Abstract
Briquetting is a compaction technology that has been used for many years to produce raw materials that are uniform in size and moisture content and are easy to process, transport and store. The physical and chemical properties of the raw material and the briquetting conditions also affect the density and strength of the briquettes. Nonetheless, assessing the quality of briquettes is challenging and extremely expensive, and necessitates lengthy laboratory investigations. In this study, a fast, cost-effective, and simple method using machine learning was used to evaluate the quality characteristics of briquette samples. The deformation energy, one of the most important briquette quality parameters, was predicted by machine learning methods, considering specific compression force, moisture content, compression resistance, briquette density, tumbler index, water resistance, shatter index and compression stress. For this purpose, Random Forest, Extreme Gradient Boosting, and CatBoost methods, which are among the ensemble learning methods, were used. The RMSE, MAE, MAPE, and R2 metrics were used to evaluate the models. With respect to the training data, the model created using the Extreme Gradient Boosting method was successful on all the metrics. However, for test data, the best RMSE (15.69), MAPE (0.0146), and R2 (0.9715) were obtained from the model established with the CatBoost method. The best MAE (10.63) was obtained from the model established with the Random Forest method. The metric results and the graphs obtained from the prediction values of the models revealed that machine learning methods were successfully able to predict briquette deformation energy.
1. Introduction
Fuels are essential in our daily routines and are utilized in our homes as cooking gas, in transport, as industrial boiler fuel, and for generating electricity. The use of fossil fuels, which are predominantly used in the above activities, should be limited due to worldwide environmental concerns [1,2]. The enhancement and augmentation of renewable energy sources form the cornerstone of innovative avenues aimed at reducing environmental complications. The employment of various sources of renewable energy, encompassing solar, wind, geothermal, and biomass energy, is instrumental in decreasing the dependence on fossil fuels. In this context, renewable energy sources such as wind, geothermal, and solar power are predominantly reliant on specific natural conditions. However, in contrast to these energy resources, biomass has a unique advantage [3,4]. Biomass boasts the capacity to be stored and subsequently utilized as needed. Moreover, the decreases in emissions of greenhouse gases, enhanced safety measures, and the progression of the indigenous economy are indeed a few of the advantages intrinsic to the utilization of biomass [5].
Biomass is expected to be utilized as a principal renewable energy resource in the future, owing to its vast potential, economic feasibility, and array of societal and ecological advantages. Stocks of fuel associated with biomass, such as agricultural waste, often exhibit high volume and low density [2,6]. This particular characteristic renders them challenging to utilize efficiently, and moreover makes their transportation economically impractical. Briquetting is one way to solve this problem. The concept of briquetting rests on the process of taking low-bulk-density biomass and converting it into high-bulk-density biomass [7]. This transformation results in the creation of a uniform, solid, and more cost-effective fuel source. In other words, it is an effective way of increasing the quality of the biomass without the need for extensive efforts or resources [8].
The biomass densification process entails compressing biomass into briquettes that are approximately ten times more compact than the original biomass material [2,9]. This form of processing results in an increase in biomass mass and energy density per unit volume. As a result, this procedure provides advantages such as reduced storage requirements, increased transportation efficiency and reduced particulate emissions per unit volume. It also ensures a consistent supply of both industrial and domestic appliances, including but not limited to rural stoves, gasifiers, and boilers. In general, compared to raw materials, fuel briquettes have superior energy properties, including increased density, high calorific value (especially per unit volume), and reduced moisture content [5,10].
The longevity of combustion for fuel briquettes should be maximized to the greatest extent possible. Additionally, the briquettes must retain their integrity during transportation, storage, or stacking, avoiding any disintegration or fragmentation [6,11]. These desired features largely depend on the quality of the briquettes. Factors such as their physical and mechanical characteristics immensely influence the durability of the briquettes, thus significantly impacting their quality. Key elements in the manufacturing process, such as density, particle size, pressure, binding ratio, temperature, and moisture content, play an influential role in determining the overall quality of the briquettes [2,12].
The quality of the briquettes obtained is determined with the help of destructive tests, which do not allow the reuse of briquettes made in the laboratory according to the physico-mechanic properties of the briquettes. Considering the large number of factors affecting the quality characteristics of briquettes, it becomes clear that the relevant measurement procedures to be carried out under laboratory conditions require a process that is both costly and labor-intensive. It also requires a significant investment of time and manpower. In an era where energy, labor, and time are of paramount importance and incur significant costs, it is advantageous to use non-traditional, non-destructive techniques as an alternative to traditional experimental methods. These modern methods provide precise and accurate predictions of desired properties, providing an effective solution for resource conservation. When facing scenarios that pose significant challenges in terms of temporal and financial measures, the utilization of machine learning methodologies has recently emerged as one of the most prevalent strategies. Numerous research papers show that machine learning techniques are effective at solving regression problems. When the resulting models are evaluated against the criteria used in the evaluation of regression models, they exhibit high R2 values and minimum RMSE and MAPE values.
The use of highly accurate machine learning methods can be useful in predicting the performance and quality of briquettes in various biomass energy conversion processes. Machine learning has surfaced as an incredibly effective, quick, and precise problem-solving method in recent years. The use of machine learning methods in renewable energy studies has become more common in recent years, and the number of studies on these topics has significantly increased, according to literature reviews.
Liu et al. (2023) [13] created a process model based on artificial neural networks using 86 biomass species as raw materials. Kumar et al. (2021) [14] used an artificial neural network technique to predict the performance of millet bran briquettes. Zhong et al. (2023) [15] used artificial neural networks to predict biomass pyrolysis behavior. Gueguim Kana et al. (2012) [16] conducted twenty-six semi-pilot fermentation studies to reveal the right combination of concentrations that improve the quantity and lag time performance of biogas production using artificial intelligence strategies. Kocer et al. (2023) [2] used 10 different machine learning (ML) methods to predict the compressive strength of briquettes obtained from peanut shells. Obafemi et al. (2019) [17] reported that ANNs can be used for real-time prediction of the thermal properties of biomass. Francik et al. (2020) [18] developed a decision support system using artificial neural networks (ANNs) to indicate the optimal parameters for the total energy consumption required for the production process of Miscanthus and willow briquettes. Mancini et al. (2020) [19] studied a methodology based on machine learning-based classification of pellet spectra. Mungale et al. (2016) [20] examined the total briquette weight following mixing to provide a model (ANN simulation) formulation for the briquette-making procedure. Zafari et al. (2013) [21] used an artificial neural network (ANN) to model the effect of independent variables on pellet density. Olugbade and Ojo (2021) [22] provided a comprehensive overview of the binding mechanisms of briquetting.
Evaluating the grade of briquettes, a type of biofuel that has surged in popularity recently due to their low storage expenses and high combustion effectiveness, and overseeing them throughout the entire delivery system, proves to be an exceptionally challenging, expensive, and crucial issue. The aim of this research is to determine the deformation energy, which is an important factor in the evaluation of briquette quality, using machine learning methods as a faster and more economical alternative to expensive and long-term laboratory studies.
2. Materials and Methods
2.1. Briquetting Procedure
The experiments were performed in the Department of Machinery, Vocational School of Technical Sciences, Akdeniz University. The shells remaining after the evisceration process of peanuts purchased from regional markets in 2023 were used as the raw material for the briquettes. Molasses was used as a binder during the briquetting process. One kilogram of molasses was added to the mixture for every fifteen kilograms of raw materials to ensure that the mixture was treated equally throughout the experiment. For the purpose of the study, two hundred and seventy briquettes were randomly selected from among all the briquettes obtained for each experiment to determine the properties of the briquettes. The moisture content of the peanut shells was reduced between 7% and 8% by drying in the sun under normal conditions as prescribed in the standard EN 14774-1 [23]. Peanut shells with an average moisture content of 7.4% were ground to a particle size of 0.5–1.5 mm in the shredding and grinding unit of the prototype machine and briquetted at a pressure of 140 MPa (Figure 1). The main steps of the briquetting process are shown in Figure 2.
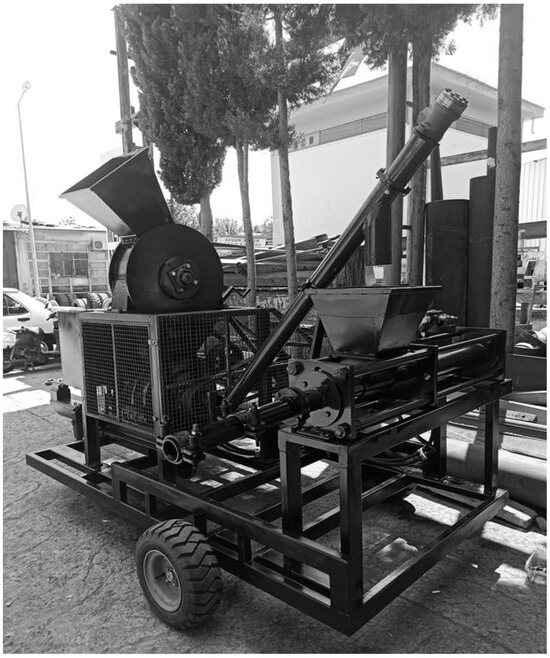
Figure 1.
Prototype mobile hydraulic piston briquetting machine.
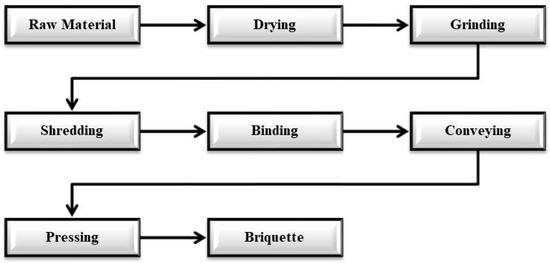
Figure 2.
The main steps of briquetting.
Figure 3 shows the shredding and grinding unit, and Figure 4 shows the briquetting unit on the briquetting machine.
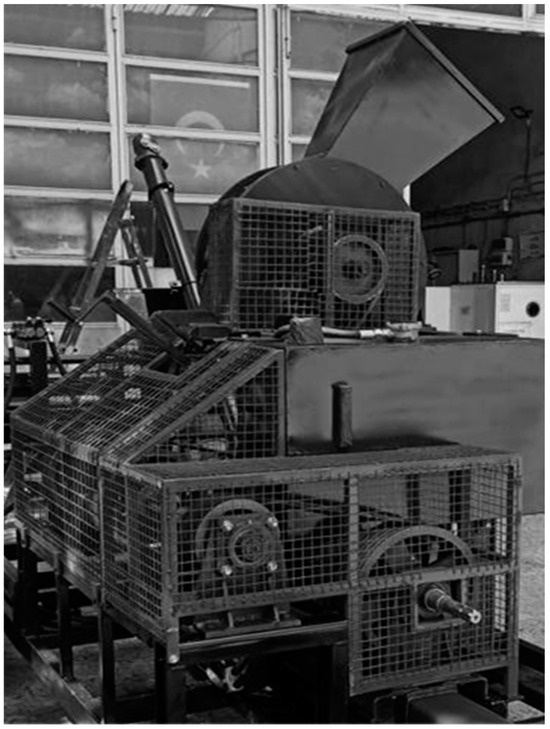
Figure 3.
Shredding unit and grinding unit.
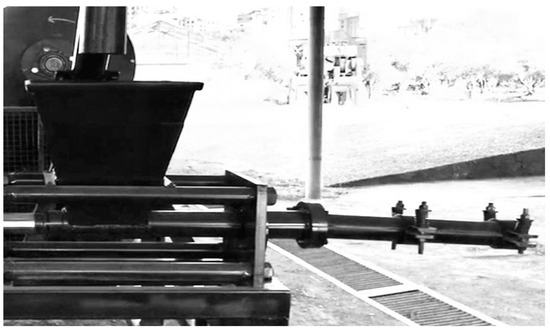
Figure 4.
Briquetting unit.
The conical die entrance had a diameter of 60 mm, the exit diameter was 55 mm, and the piston diameter was 54.5 mm. To prevent jams on the conical mold, clamps fixed on the mold with a spring nut were used.
2.2. Experimental Measurements of Briquette Quality
Briquette physical tests to determine briquette quality were carried out with 270 briquettes. Properties such as moisture content, density, tumbler index, fracture index, water resistance, compression force, compression stress, specific compression force, and deformation energy, which are important indicators of briquette quality and strength, were determined. The moisture content of the briquettes obtained from peanut shells was measured according to the European standard EN13183-1 [24] and was determined to be 5.78% on average. The density of the briquettes was calculated through the application of the stereometric method. This process involved the measurement of the physical dimensions of each briquette. In this technique, the briquettes were initially measured using a digital scale that had an accuracy of 0.001 g, and their weights were logged. Subsequently, the external diameter and length of the briquettes were gauged from their midpoint using a digital caliper accurate to 0.01 mm, and the volume of the briquettes was then computed using the derived measurements. Thus, the mass of the briquette was divided by its volume to calculate the density of the briquette in kg m−3 [25,26].
Tests for compression were performed in line with ASTME9-89 [27], considering certain facets of EN12504-1 [28]. A universal testing machine YKM-C205 with 3 kN (lowest load resolution of 0.001 N and data gathering pace of 8 kHz) composed of two compression plates was utilized, imposing a burden at a stable application rate of 20 mm min−1 following the established standards (Figure 5). The resistance to compression of the briquettes was established as N [29,30].
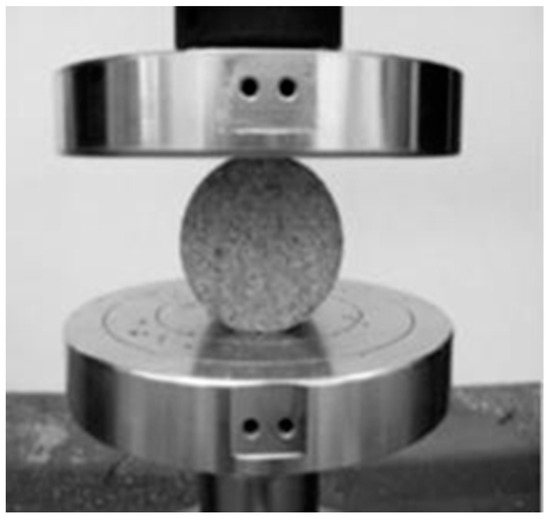
Figure 5.
A universal testing machine.
The compression strain was computed by dividing the compression exertion over the briquette’s cross-sectional coverage (N mm−2). Similarly, the specific compression force for the briquettes was found to be N mm−1 by dividing the compression force by the briquette length. The deformation energy of the briquettes was determined from the area under the force and deformation curves [31,32,33] Typical force-deformation curves of five randomly selected briquettes are shown in Figure 6.
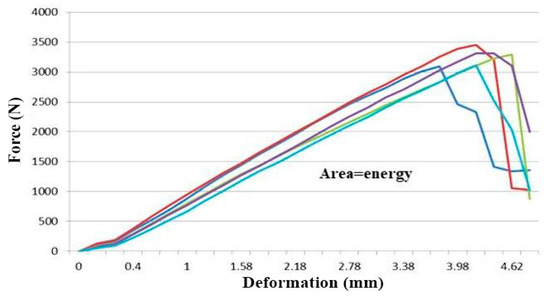
Figure 6.
Typical force–deformation graph.
The determination of the briquette tumbler index was based on the ASAE S269.4.22 [34] standard set by the American Society of Agricultural Engineers. Within this experiment, the briquettes were positioned in the tumbler test apparatus and then rotated at a velocity of 40 min−1 for 3 min. The briquettes’ weight was measured before and after their rotation, and the tumbler index was computed as a percentage (%) relative to the weight decrease throughout the test [35,36].
In the process of identifying the shatter index value, the briquettes were freely discharged 10 times from a 1 m elevation onto a concrete surface, following the standard ASTM D 440 86.25 [37]. The briquettes were evaluated before and after the release procedure, and upon the test’s conclusion, the refractive index value was ascertained as a percentage (%) contingent on the loss of mass [38,39].
The briquette water resistance was identified as the percentage of water absorbed when the briquette was submerged in water. For this experiment, different briquettes were individually immersed in water at 27 °C for 30 s. The percentage (%) of water resistance was calculated based on the mass gain of the briquettes measured before and after submersion [40,41].
2.3. Ensemble Learning
Ensemble learning methods are machine learning methods. Ensemble learning has recently become an area of great interest in machine learning research. The main purpose of community learning is based on combining the results generated by multiple decision makers solving the same problem [42]. The Random Forest, Gradient Boosting, Extreme Gradient Boosting, Light GBM, CatBoost, and Extra Trees methods are the most popular ensemble learning methods frequently used in regression and classification problems [43,44,45,46,47]. The machine learning (modeling) step is one of the most important steps of the data mining process included in the KDD (Knowledge Discovery in Databases), SEMMA, and CRISP-DM methodologies [48]. Python programming language (https://www.python.org/) was used for statistical analysis, modeling and graphical plotting.
2.4. CRISP-DM Methodology
In this study, the CRISP-DM model, which was developed in response to the needs and common problems in data mining projects in the mid-1990s, was used. The most important factors in the success of the methodology are its independence from industry, tools and applications [49]. The CRISP-DM methodology consists of six main steps: business understanding, data understanding, data preprocessing, modelling, evaluation, and deployment [48,50]. The general workflow of the CRISP-DM methodology and the illustration of the operations executed in the study were given in Figure 7.
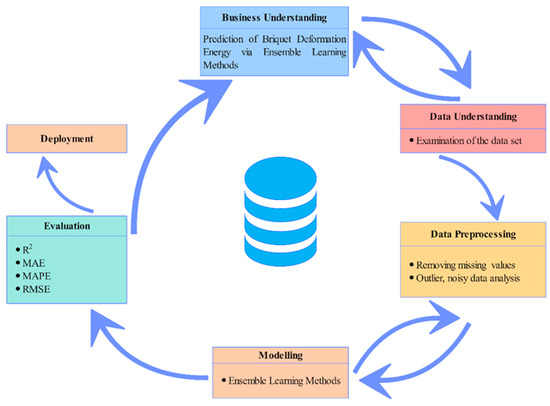
Figure 7.
Illustration of the general workflow of the study with CRISP-DM methodology [50].
The aim of the business understanding step of the study is to predict the briquette deformation energy using different ensemble learning methods. The data understanding step includes the discovery of the data to be used in the analysis and the recognition of the data and its accuracy. At this stage, basic statistical analyses were performed. The data pre-processing step includes the discovery of the data to be used in the analysis and the recognition of the data and its accuracy. At this stage, basic statistical analyses were performed. In the data pre-processing step, missing data in the dataset were removed. Additionally, outlier and noisy data were discovered via local outlier factor analysis [51]. In the modeling step, to predict briquette deformation energy, various ensemble learning algorithms were performed. Extreme Gradient Boosting, CatBoost, and Random Forest ensemble learning algorithms were applied. While 70% of the dataset was used for training the models, the remaining 30% was used for testing the trained models.
The evaluation phase is an extremely important stage. It is highly important to determine the metrics to be used in interpreting the model results and the visualization tools to be used to show the results. Selection of appropriate metrics and visualization tools is important for accurate interpretation. Line plots were used to visualize model results.
The predicted value in the established models is the deformation energy of the briquette. Since this variable takes continuous values, the problem is a regression problem. In line with the information obtained from the literature, coefficient of determination (R2), mean absolute percentage error (MAPE), root mean square error (RMSE), and mean absolute error (MAE) metrics are frequently used in evaluating regression problems [2,52]. Mathematical representations of the metrics used in the evaluation of established ensemble learning models are given in Equations (1)–(4). R2, known as a measure of the success of independent variables in predicting the dependent variable, is defined as the rate at which the independent variables explain the variance in the dependent variable [53]. In the R2 metric, which has a value between 0 and 1, an R2 value approaching 1 indicates that the success of the established regression model is high. More clearly, the whole variance in the dependent variable is explained by the independent variables [52].
The RMSE is the square root of the mean of the squares of all the errors. In the RMSE metric, which takes values between [0, ∞), values close to 0 indicate that the model is successful [46,54]. For regression models, the MAPE is another performance metric that has a very intuitive interpretation in terms of relative error. Sometimes relative variations are more sensitive than absolute variations are, and the MAPE is recommended for use in tasks where sensitivity to relative variations is more important than sensitivity to absolute variations [55]. It takes values between [0, ∞); values close to 0 indicate that the model is successful [54]. The MAE is another metric used in evaluating regression models and is the average of all absolute prediction errors. Here, the prediction error is the difference between the actual and predicted values. Like the RMSE and MAPE, the MAE takes values between [0, ∞), and values close to 0 indicate that the model is successful [46]. In the deployment step, which is the last step of the CRISP-DM process, an explanation of how to use the results is given in the discussion and conclusion sections.
2.5. Extreme Gradient Boosting (XGB)
The XGB method is one of the ensemble learning methods based on Gradient Boosting [56] and is used in classification and regression problems [57,58,59]. The method aims to optimize the cost objective function, which consists of the combination of loss function and regularization terms.
where K is the number of trees to be generated, is a tree from the ensemble trees, is the predictive value, and n is the number of instances in the training set [60]. The term regularization is used to control overfitting so that the model is faster and more robust during tuning [61]. The cost objective function allows parallel calculations as a whole and maintains the optimum calculation speed [62].
2.6. Random Forest (RF)
Random Forest, an ensemble-based machine learning algorithm, is used in classification and regression problems [63,64,65]. The aim of ensemble learning is to solve the same problem by means of many decision trees and then combining the results [66]. In the Random Forest algorithm, random datasets are produced by randomly selecting samples from the original training data, creating a forest with a decision tree trained on each random dataset. The final decision of the forest is made by voting on the decision trees in classification problems, while in regression problems it is made by taking the average of all predictions [67]. Figure 8 shows how the RF regression works.
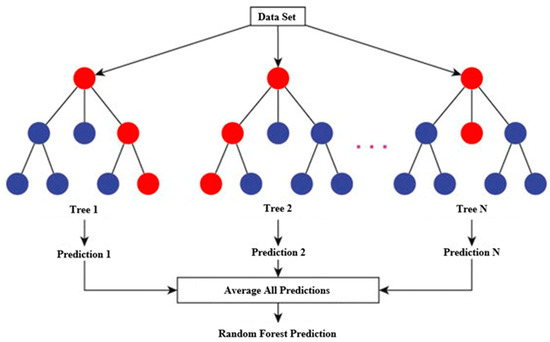
Figure 8.
Illustration of the RF regression [68].
It is an effective algorithm due to its ability to perform dimensional reduction [69]; deal with outlier, noisy, and missing datasets [70]; work with continuous and nominal values; perform fast operations on large datasets; and have a high calculation speed [42].
2.7. CatBoost
CatBoost, which takes its name from the combination of the words Category and Boosting [71], is a gradient-boosting application that uses binary decision trees as key estimators [72] and has been successfully used in both regression and classification problems [45,58,73]. CatBoost, an ensemble-based machine learning algorithm, has a GPU learning algorithm implementation and a CPU scoring algorithm implementation that is significantly faster than other gradient boosting algorithms such as XGB and LightGBM [74]. In CatBoost, the basic estimators are called decision tables or oblivious decision trees. Oblivious to the term means that the same splitting criterion is used at all levels of the tree. Such trees are balanced, less prone to overfitting, and allow significant acceleration of execution at test time [72].
3. Results and Discussion
The properties of briquettes obtained from peanut shells and descriptive statistics about these properties are shown in Table 1. The dependent variable of deformation energy has a mean = 769.74 and std. dev. = 93.58. It is clear from Table 1 that the dependent variable is normally distributed.

Table 1.
Descriptive statistics of briquettes.
In this study, three different ensemble learning methods, Random Forest, Extreme Gradient Boosting, and CatBoost, were used. The performances of the models were interpreted based on the evaluation metrics obtained as a result of the established models. The training and testing results of the models are shown in Table 2. According to the model evaluation results, the training and testing phase values are close to each other. This indicates that there is no overfitting problem during the training phase and can also be considered an indication that the models can make consistent predictions. In the training dataset, the best values of MAE = 1.89, RMSE = 2.86, MAPE = 0.0024884, and R2 = 0.9991 were obtained from the model established with the XGB method. According to the evaluation metrics, the success rankings in the training dataset are XGB, RF and CatBoost. In fact, it can be said that all models were very successful on the training dataset, and when each metric is evaluated on its own, it can be seen that the values obtained by the models are extremely close to each other.

Table 2.
Ensemble learning evaluation results.
According to the test dataset results (see Table 2), the best R2 = 0.9714 was obtained from the model established with the CatBoost method. Therefore, it can be said that the independent variables explain approximately 97.14% of the variance in the dependent variable. Since the R2 value obtained is close to 1, the established model is successful. The R2 values of the RF and XGB models are also high, at 0.9618 and 0.9585, respectively. The RMSE is a statistical metric used to calculate the error values of regression models. The RMSE values of the CatBoost, RF, and XGB models are 15.69, 18.14, and 18.91, respectively. While the best RMSE value was obtained from the model established with the CatBoost method, the results of the models established with the RF and XGB methods were close to each other. However, the model built with RF performed better than the model built with XGB, with a very small difference. The MAPE values obtained in all models were nearly 0.0146, but it can be said that the model established with CatBoost was more successful than the models established with other methods, albeit with a very small difference. According to the MAPE results, it can be said that the deformation energy of briquettes can be estimated with an error of 1.46%. When we evaluate the models according to the MAE metric, it can be said that although the values are extremely close to each other, the model established with the RF method was more successful than other models with a small difference. For the testing phase, the model established with the CatBoost method was more successful in all metrics except the MAE metric. As mentioned before, the models obtained similar values in the MAE metric. As a result, it can be said that the most successful results in the testing partition were obtained from models established with the CatBoost method.
Figure 9 shows the line plots of the models. Line plots created with training data are in the left column, and line graphs created with test data are in the right column. In the graphs, the x-axis in the graphs shows the observations, and the y-axis shows the deformation energy.
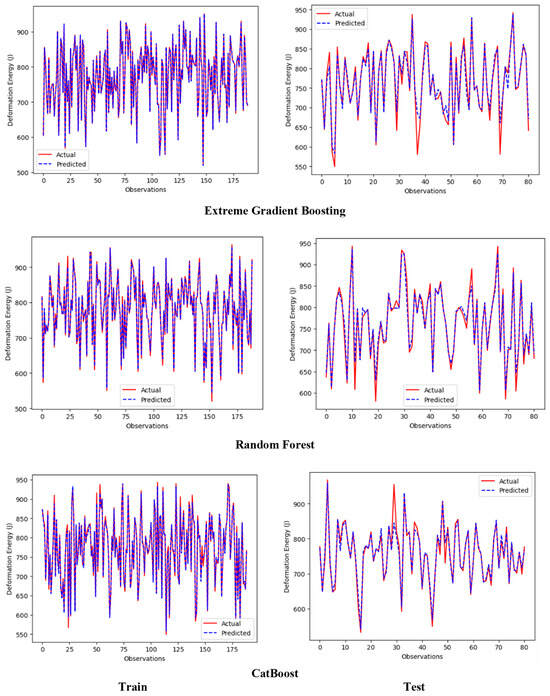
Figure 9.
Line plots of modeling results.
While red lines show actual values, dashed blue lines show predicted values. The lines nearly overlap in all three plots in the left column. Accordingly, the models built were quite successful on the training dataset. These results also support the results of the evaluation metrics of the training dataset in Table 2. The lines nearly overlap in all three plots in the right column. Accordingly, the models established were also quite successful on the test dataset. These results also support the results of the evaluation metrics of the test dataset in Table 2.
No studies have been found that predict briquette deformation energy using machine learning methods. In the field literature, Kocer et al. [2] estimated the compressive resistance of briquettes via ensemble learning methods. The best R2, MAPE, MAE, and RMSE values were obtained from the model established with the Extra Trees method; these values were 0.76, 0.0799, 284.01, and 368.1, respectively. Kabas et al. [52] estimated the deformation energy of cherry tomatoes using machine learning methods. The best results were obtained from models established with the Artificial Neural Networks method (R2 = 0.97, MAE = 0.051, MSE = 0.005). In this study, the deformation energies of briquettes obtained from peanut shells were estimated via ensemble learning methods. The models built according to the results of both the training and test datasets were extremely successful, and accordingly, it can be said that machine learning methods can be used to estimate the briquette deformation energy.
4. Conclusions
The mechanical properties of briquettes are important factors to consider throughout the briquette production process. These parameters are very important for the production of better-quality briquettes. In order to determine these properties, a large number of samples must be measured and various trials must be carried out during this period. Measuring a large number of samples simultaneously requires considerable time and effort. There is also the possibility of personal measurement errors during this process. With machine learning, all these negative features are eliminated, and errors are minimized. Machine learning methods can identify these features and produce faster and more accurate results for industrial applications such as prediction, discrimination, and sorting. Larger datasets, attributes, and algorithms that can be applied to further research can also be obtained from this approach.
In this study, the deformation energy value of briquettes obtained from peanut shells was successfully estimated using ensemble learning methods. Various metrics, such as R2, MAPE, RMSE, and MAE, were calculated to evaluate the models. For the R2 metric, the model established by the CatBoost method was the most successful model. The independent variables explain approximately 97.1% of the variance in the dependent variable. For the R2 metric, the explained proportions of the variance in the dependent variable are 96% of the model built with RF and 95.9% of the model built with XGB. When success evaluation was performed using the RMSE metric, the model established with the CatBoost method was the most successful model. While the second most successful model was established with the RF method, the least successful of the three models was established with the XGB method. When success evaluation was performed using the MAPE metric, the MAPE values calculated from the values produced by all three models were the same and equal to 0.0146. Accordingly, with each of the models, the deformation energy of briquettes can be predicted with an error of 1.46%. When success evaluation was performed using the MAE metric, the model established with the RF method was the most successful model. On the training dataset, the model built with XGB was the most successful model in all metrics, while on the test dataset, the model built with CatBoost was the most successful model in all metrics except the MAE metric.
According to the training and test dataset model results, the metric values obtained are extremely close to each other. When the models were evaluated for both the training and test datasets, there were no significant differences between the results, but it can be said that some models were more successful with small differences. While this shows that there was no overfitting problem during the training phase of the models, it can be said that the models can make consistent predictions and the established models can be used successfully for predicting the deformation energy of briquettes.
Author Contributions
Conceptualization, U.E., M.N.D. and O.K.; methodology, U.E. and O.K.; software, U.E. and M.N.D.; validation, U.E. and O.K.; formal analysis, U.E.; investigation, U.E. and O.K.; resources, U.E. and O.K.; data curation, U.E. and M.N.D.; writing—original draft preparation, U.E. and O.K.; writing—review and editing, U.E., O.K. and M.N.D.; visualization, U.E.; supervision, U.E. and O.K.; project administration, O.K. and M.N.D. All authors have read and agreed to the published version of the manuscript.
Funding
This research was funded by National University of Science and Technology Politehnica Bucharest through PubArt program.
Institutional Review Board Statement
Not applicable.
Informed Consent Statement
Not applicable.
Data Availability Statement
The raw data supporting the conclusions of this article will be made available by the authors on request.
Conflicts of Interest
The authors declare no conflicts of interest.
References
- Bhattacharya, S.C.; Leon, M.A.; Rahman, M.M. A Study on Improved Biomass Briquetting. Energy Sustain. Dev. 2002, 6, 67–71. [Google Scholar] [CrossRef]
- Kocer, A.; Kabas, O.; Zabava, B.S. Estimation of Compressive Resistance of Briquettes Obtained from Groundnut Shells with Different Machine Learning Algorithms. Appl. Sci. 2023, 13, 9826. [Google Scholar] [CrossRef]
- Dinesha, P.; Kumar, S.; Rosen, M.A. Biomass Briquettes as an Alternative Fuel: A Comprehensive Review. Energy Technol. 2019, 7, 1801011. [Google Scholar] [CrossRef]
- Patil, G. The Possibility Study Of Briquetting Agricultural Wastes For Alternative Energy. Indones. J. For. Res. 2019, 6, 133–139. [Google Scholar] [CrossRef]
- Kabaş, Ö.; Ünal, İ.; Sözer, S.; Selvi, K.C.; Ungureanu, N. Quality Assessment of Biofuel Briquettes Obtained from Greenhouse Waste Using a Mobile Prototype Briquetting Machine with PTO Drive. Energies 2022, 15, 8371. [Google Scholar] [CrossRef]
- Kabaş, Ö.; Ünal, İ.; Sözer, S. Quality Assessment of Bio-Briquettes Obtained from Nut Fruit Shells. Mitteilungen Klosterneubg. 2022, 72, 222–237. [Google Scholar]
- Bajwa, D.S.; Peterson, T.; Sharma, N.; Shojaeiarani, J.; Bajwa, S.G. A Review of Densified Solid Biomass for Energy Production. Renew. Sustain. Energy Rev. 2018, 96, 296–305. [Google Scholar] [CrossRef]
- Saleem, M. Possibility of Utilizing Agriculture Biomass as a Renewable and Sustainable Future Energy Source. Heliyon 2022, 8, 1–11. [Google Scholar] [CrossRef]
- Ibitoye, S.E.; Mahamood, R.M.; Jen, T.C.; Loha, C.; Akinlabi, E.T. Design and Fabrication of Biomass Densification Machine for Teaching and Research Purposes. Biomass Convers. Biorefinery 2023, 1, 1–12. [Google Scholar]
- Stolarski, M.J.; Szczukowski, S.; Tworkowski, J.; Krzyzaniak, M.; Gulczyński, P.; Mleczek, M. Comparison of Quality and Production Cost of Briquettes Made from Agricultural and Forest Origin Biomass. Renew. Energy 2013, 57, 20–26. [Google Scholar] [CrossRef]
- Olugbade, T.; Ojo, O.; Mohammed, T. Influence of Binders on Combustion Properties of Biomass Briquettes: A Recent Review. Bioenerg. Res. 2019, 12, 241–259. [Google Scholar] [CrossRef]
- Gendek, A.; Aniszewska, M.; Malaťák, J.; Velebil, J. Evaluation of Selected Physical and Mechanical Properties of Briquettes Produced from Cones of Three Coniferous Tree Species. Biomass Bioenergy 2018, 117, 173–179. [Google Scholar] [CrossRef]
- Liu, S.; Yang, Y.; Yu, L.; Cao, Y.; Liu, X.; Yao, A.; Cao, Y. Self-Heating Optimization of Integrated System of Supercritical Water Gasification of Biomass for Power Generation Using Artificial Neural Network Combined with Process Simulation. Energy 2023, 272, 127134. [Google Scholar] [CrossRef]
- Kumar, G.; Gireeshkumaran Thampi, B.S.; Mondal, P.K. Predicting Performance of Briquette Made from Millet Bran: A Neural Network Approach. Adv. J. Grad. Res. 2021, 9, 1–13. [Google Scholar] [CrossRef]
- Zhong, Y.; Ding, Y.; Jiang, G.; Lu, K.; Li, C. Comparison of Artificial Neural Networks and Kinetic Inverse Modeling to Predict Biomass Pyrolysis Behavior. J. Anal. Appl. Pyrolysis 2023, 169, 105802. [Google Scholar] [CrossRef]
- Gueguim Kana, E.B.; Oloke, J.K.; Lateef, A.; Adesiyan, M.O. Modeling and Optimization of Biogas Production on Saw Dust and Other Co-Substrates Using Artificial Neural Network and Genetic Algorithm. Renew. Energy 2012, 46, 276–281. [Google Scholar] [CrossRef]
- Obafemi, O.; Stephen, A.; Ajayi, O.; Nkosinathi, M. A Survey of Artificial Neural Network-Based Prediction Models for Thermal Properties of Biomass. Procedia Manuf. 2019, 33, 184–191. [Google Scholar] [CrossRef]
- Francik, S.; Knapczyk, A.; Knapczyk, A.; Francik, R. Decision Support System for the Production of Miscanthus and Willow Briquettes. Energies 2020, 13, 1364. [Google Scholar] [CrossRef]
- Mancini, M.; Mircoli, A.; Potena, D.; Diamantini, C.; Duca, D.; Toscano, G. Prediction of Pellet Quality through Machine Learning Techniques and Near-Infrared Spectroscopy. Comput. Ind. Eng. 2020, 147, 106566. [Google Scholar] [CrossRef]
- Mungale, N.P.; Sakhale, C.N. Model Formulation and Analysis of Total Weight of Briquettes after Mixing for Briquette Making Operation. Int. J. Eng. Res. Appl. 2016, 6, 25–29. [Google Scholar]
- Zafari, A.; Kianmehr, M.H.; Abdolahzadeh, R. Modeling the Effect of Extrusion Parameters on Density of Biomass Pellet Using Artificial Neural Network. Int. J. Recycl. Org. Waste Agric. 2013, 2, 1–11. [Google Scholar] [CrossRef]
- Olugbade, T.O.; Ojo, O.T. Binderless Briquetting Technology for Lignite Briquettes: A Review. Energy Ecol. Environ. 2021, 6, 69–79. [Google Scholar] [CrossRef]
- EN14774-1; SolidBiofuels—Determination of Moisture Content—Oven Dry Method Part1: Total Moisture. Reference European Committee for Standardization: Brussels, Belgium, 2019.
- EN13183-1; Moisture Content of a Piece of Sawn Timber—Part 1: Determination by Oven Dry Method. Reference European Committee for Standardization: Brussels, Belgium, 2002.
- Demirel, B. Determination of Solid Biofuel Properties of Hazelnut Husk Briquettes Obtained at Different Compaction Pressures. Biomass Convers. Biorefinery 2023, 13, 13267–13278. [Google Scholar]
- Setter, C.; Ataíde, C.H.; Mendes, R.F.; de Oliveira, T.J.P. Influence of Particle Size on the Physico-Mechanical and Energy Properties of Briquettes Produced with Coffee Husks. Environ. Sci. Pollut. Res. 2021, 28, 8215–8223. [Google Scholar] [CrossRef]
- ASTM E9-89; International Standard Test Methods of Compression Testing. Annual Book of ASTM Standards. ASTM: West Conshohocken, PA, USA, 2019.
- EN12504–1; Testing Concrete in Structures—Part 1: Cored Specimens—Taking, Examining and Testing in Compression. Reference European Committee for Standardization: Brussels, Belgium, 2019.
- Niño, A.; Arzola, N.; Araque, O. Experimental Study on the Mechanical Properties of Biomass Briquettes from a Mixture of Rice Husk and Pine Sawdust. Energies 2020, 13, 1060. [Google Scholar] [CrossRef]
- Lubis, M.R.; Gani, A.; Maimun, T.; Aflah, N. Utilization of Brown Coal with Ceara Rubber (Manihot Glaziovii) Binder for Biobriquettes. Philipp. J. Sci. 2023, 152, 1885–1894. [Google Scholar] [CrossRef]
- Ivanova, T.; Kabutey, A.; Herák, D.; Demirel, C. Estimation of Energy Requirement of Jatropha curcas L. Seedcake Briquettes under Compression Loading. Energies 2018, 11, 1980. [Google Scholar] [CrossRef]
- Eslami, A.; Zahedi, A.; Mirabi Banadaki, H. In-Plane Seismic Behavior of NSM Strengthened Adobe Walls: Experimental Evaluation of Different Reinforcements. Eng. Struct. 2021, 246, 113016. [Google Scholar] [CrossRef]
- Gilvari, H.; de Jong, W.; Schott, D.L. Quality Parameters Relevant for Densification of Bio-Materials: Measuring Methods and Affecting Factors—A Review. Biomass Bioenergy 2019, 120, 117–134. [Google Scholar] [CrossRef]
- ASAE S269.4; Cubes, Pellets, and Crumbles Definitions and Methods for Determining Density, Durability, and Moisture Content. American Society of Agricultural and Biological Engineers: St. Joseph, MI, USA, 2000.
- Nagarajan, J.; Prakash, L. Preparation and Characterization of Biomass Briquettes Using Sugarcane Bagasse, Corncob and Rice Husk. Mater. Today Proc. 2021, 47, 4194–4198. [Google Scholar] [CrossRef]
- Bizhanov, A.M.; Zagainov, S.A. Tests of Briquettes for Mechanical Strength. Metallurgist 2021, 65, 247–256. [Google Scholar] [CrossRef]
- ASTM D 440-86; International Standard Test Method of Drop Shatter Test for Coal. Annual Book of ASTM Standards. ASTM: West Conshohocken, PA, USA, 1998.
- Jha, E.; Dutta, S.K. Optimization of Binder for Improving Strength and Shatter Index of Briquettes for BOF Dust Using Design of Experiments. Artic. Int. J. Eng. Adv. Technol. 2019, 9, 6282–6287. [Google Scholar] [CrossRef]
- Akogun, O.A.; Waheed, M.A.; Ismaila, S.O.; Dairo, O.U. Physical and Combustion Indices of Thermally Treated Cornhusk and Sawdust Briquettes for Heating Applications in Nigeria. J. Nat. Fibers 2022, 19, 1201–1216. [Google Scholar] [CrossRef]
- Jekayinfa, S.O.; Pecenka, R.; Orisaleye, J.I. Empirical Model for Prediction of Density and Water Resistance of Corn Cob Briquettes. Int. J. Renew. Energy Technol. 2019, 10, 212. [Google Scholar] [CrossRef]
- Adeleke, A.; Odusote, J.; Ikubanni, P.; Lasode, O.; Malathi, M.; Pasawan, D. Physical and Mechanical Characteristics of Composite Briquette from Coal and Pretreated Wood Fines. Int. J. Coal Sci. Technol. 2021, 8, 1088–1098. [Google Scholar] [CrossRef]
- Oshiro, T.M.; Perez, P.S.; Baranauskas, J.A. How Many Trees in a Random Forest? In Machine Learning and Data Mining in Pattern Recognition; Perner, P., Ed.; Springer: Berlin/Heidelberg, Germany, 2012; Volume 7376, pp. 154–168. [Google Scholar] [CrossRef]
- Hama Saeed, M.A. Diabetes Type 2 Classification Using Machine Learning Algorithms with Up-Sampling Technique. J. Electr. Syst. Inf. Technol. 2023, 10, 1–10. [Google Scholar] [CrossRef]
- El Bilali, A.; Abdeslam, T.; Ayoub, N.; Lamane, H.; Ezzaouini, M.A.; Elbeltagi, A. An Interpretable Machine Learning Approach Based on DNN, SVR, Extra Tree, and XGBoost Models for Predicting Daily Pan Evaporation. J. Environ. Manag. 2023, 327, 116890. [Google Scholar] [CrossRef]
- Jabeur, S.B.; Gharib, C.; Mefteh-Wali, S.; Arfi, W. Ben CatBoost Model and Artificial Intelligence Techniques for Corporate Failure Prediction. Technol. Forecast. Soc. Chang. 2021, 166, 120658. [Google Scholar] [CrossRef]
- Duman, S.; Elewi, A.; Yetgin, Z. Distance Estimation from a Monocular Camera Using Face and Body Features. Arab. J. Sci. Eng. 2022, 47, 1547–1557. [Google Scholar] [CrossRef]
- Aksoy, E.; Kocer, A.; Yilmaz, İ.; Akçal, A.N.; Akpinar, K. Assessing Fire Risk in Wildland–Urban Interface Regions Using a Machine Learning Method and GIS Data: The Example of Istanbul’s European Side. Fire 2023, 6, 408. [Google Scholar] [CrossRef]
- Azevedo, A.; Santos, M.F. KDD, SEMMA and CRISP-DM: A Parallel Overview; IADS-DM; Instituto Politécnico do Porto, Instituto Superior de Contabilidade e Administração do Porto: São Mamede de Infesta, Portugal, 2008. [Google Scholar]
- Mariscal, G.; Marbán, Ó.; Fernández, C. A Survey of Data Mining and Knowledge Discovery Process Models and Methodologies. Knowl. Eng. Rev. 2010, 25, 137–166. [Google Scholar] [CrossRef]
- Chapman, P.; Clinton, J.; Kerber, R.; Khabaza, T.; Reinartz, T.; Shearer, C.; Wirth, R. CRISP-DM 1.0 Step-by-Step Data Mining Guide; CRISP-DM; Cambridge University Press: Cambridge, UK, 1999. [Google Scholar]
- Lee, J.; Kang, B.; Kang, S.H. Integrating Independent Component Analysis and Local Outlier Factor for Plant-Wide Process Monitoring. J. Process Control 2011, 21, 1011–1021. [Google Scholar] [CrossRef]
- Kabas, O.; Kayakus, M.; Ünal, İ.; Moiceanu, G. Deformation Energy Estimation of Cherry Tomato Based on Some Engineering Parameters Using Machine-Learning Algorithms. Appl. Sci. 2023, 13, 8906. [Google Scholar] [CrossRef]
- Plonsky, L.; Ghanbar, H. Multiple Regression in L2 Research: A Methodological Synthesis and Guide to Interpreting R2 Values. Mod. Lang. J. 2018, 102, 713–731. [Google Scholar] [CrossRef]
- Chicco, D.; Warrens, M.J.; Jurman, G. The Coefficient of Determination R-Squared Is More Informative than SMAPE, MAE, MAPE, MSE and RMSE in Regression Analysis Evaluation. PeerJ Comput. Sci. 2021, 7, 1–18. [Google Scholar] [CrossRef]
- de Myttenaere, A.; Golden, B.; Le Grand, B.; Rossi, F. Mean Absolute Percentage Error for Regression Models. Neurocomputing 2016, 192, 38–48. [Google Scholar] [CrossRef]
- Chen, T.; Guestrin, C. XGBoost: A Scalable Tree Boosting System. In KDD ‘16, Proceedings of the 22nd ACM SIGKDD International Conference on Knowledge Discovery and Data Mining, San Francisco, CA, USA, 13–17 August 2016; Association for Computing Machinery: New York, NY, USA, 2016; pp. 785–794. [Google Scholar] [CrossRef]
- Wen, H.T.; Wu, H.Y.; Liao, K.C. Using XGBoost Regression to Analyze the Importance of Input Features Applied to an Artificial Intelligence Model for the Biomass Gasification System. Inventions 2022, 7, 126. [Google Scholar] [CrossRef]
- Huang, G.; Wu, L.; Ma, X.; Zhang, W.; Fan, J.; Yu, X.; Zeng, W.; Zhou, H. Evaluation of CatBoost Method for Prediction of Reference Evapotranspiration in Humid Regions. J. Hydrol. 2019, 574, 1029–1041. [Google Scholar] [CrossRef]
- Wang, R.; Wang, L.; Zhang, J.; He, M.; Xu, J. XGBoost Machine Learning Algorism Performed Better Than Regression Models in Predicting Mortality of Moderate-to-Severe Traumatic Brain Injury. World Neurosurg. 2022, 163, e617–e622. [Google Scholar] [CrossRef]
- Cherif, I.L.; Kortebi, A. On Using EXtreme Gradient Boosting (XGBoost) Machine Learning Algorithm for Home Network Traffic Classification. In Proceedings of the 2019 Wireless Days (WD), Manchester, UK, 24–26 April 2019. [Google Scholar] [CrossRef]
- Al Daoud, E. Comparison between XGBoost, LightGBM and CatBoost Using a Home Credit Dataset. Int. J. Comput. Inf. Eng. 2019, 13, 6–10. [Google Scholar]
- Abdi, A.M. Land Cover and Land Use Classification Performance of Machine Learning Algorithms in a Boreal Landscape Using Sentinel-2 Data. GIScience Remote Sens. 2020, 57, 1–20. [Google Scholar] [CrossRef]
- Chen, H.; Wu, L.; Chen, J.; Lu, W.; Ding, J. A Comparative Study of Automated Legal Text Classification Using Random Forests and Deep Learning. Inf. Process. Manag. 2022, 59, 102798. [Google Scholar] [CrossRef]
- Khan, K.; Iqbal, M.; Salami, B.A.; Amin, M.N.; Ahamd, I.; Alabdullah, A.A.; Arab, A.M.A.; Jalal, F.E. Estimating Flexural Strength of FRP Reinforced Beam Using Artificial Neural Network and Random Forest Prediction Models. Polymers 2022, 14, 2270. [Google Scholar] [CrossRef]
- Rajković, D.; Marjanović Jeromela, A.; Pezo, L.; Lončar, B.; Grahovac, N.; Kondić Špika, A. Artificial Neural Network and Random Forest Regression Models for Modelling Fatty Acid and Tocopherol Content in Oil of Winter Rapeseed. J. Food Compos. Anal. 2023, 115, 105020. [Google Scholar] [CrossRef]
- Biau, G.; Scornet, E. A Random Forest Guided Tour. Test 2016, 25, 197–227. [Google Scholar] [CrossRef]
- Ecer, O.; Yetgin, Z.; Çelik, T. Air Write Letter Recognition Using Random Forest Classification on Arduino Dataset. Int. J. Sci. Technol. Res. 2018, 4, 1–9. [Google Scholar]
- Zeini, H.A.; Al-Jeznawi, D.; Imran, H.; Bernardo, L.F.A.; Al-Khafaji, Z.; Ostrowski, K.A.; Kazmi, S.; Zeini, H.A.; Al-Jeznawi, D.; Imran, H.; et al. Random Forest Algorithm for the Strength Prediction of Geopolymer Stabilized Clayey Soil. Sustainability 2023, 15, 1408. [Google Scholar] [CrossRef]
- Sullivan, W. Machine Learning for Beginners Guide Algorithms; Healthy Pragmatic Solutions Inc.: Delhi, India, 2017; ISBN 2013206534. [Google Scholar]
- Breiman, L. Random Forests. Mach. Learn. 2001, 45, 5–32. [Google Scholar] [CrossRef]
- Vermeulen, A.F. Industrial Machine Learning: Using Artificial Intelligence as a Transformational Disruptor; Apress: New York, NY, USA, 2019; ISBN 9781484253168. [Google Scholar]
- Prokhorenkova, L.; Gusev, G.; Vorobev, A.; Dorogush, A.V.; Gulin, A. Catboost: Unbiased Boosting with Categorical Features. arXiv 2019, arXiv:1706.09516. [Google Scholar]
- Dutta, J.; Roy, S. OccupancySense: Context-Based Indoor Occupancy Detection & Prediction Using CatBoost Model. Appl. Soft Comput. 2022, 119, 108536. [Google Scholar] [CrossRef]
- Dorogush, A.V.; Ershov, V.; Yandex, A.G. CatBoost: Gradient Boosting with Categorical Features Support. arXiv 2018, arXiv:1810.11363v1. [Google Scholar] [CrossRef]
Disclaimer/Publisher’s Note: The statements, opinions and data contained in all publications are solely those of the individual author(s) and contributor(s) and not of MDPI and/or the editor(s). MDPI and/or the editor(s) disclaim responsibility for any injury to people or property resulting from any ideas, methods, instructions or products referred to in the content. |
© 2024 by the authors. Licensee MDPI, Basel, Switzerland. This article is an open access article distributed under the terms and conditions of the Creative Commons Attribution (CC BY) license (https://creativecommons.org/licenses/by/4.0/).