1. Introduction
The air void content of asphalt mixtures is one of the most important parameters affecting the expected life span of road pavement structures as well as their deformation characteristics [
1]. Former research has established correlations between the air void content and other key parameters of asphalt mixtures like stability and durability [
2], as well as strength and stiffness [
3,
4].
Several researchers have studied the effect of changes in air void content on the long-term performance of road pavement structures. Based on laboratory tests, it can be deduced that, in the case of a 1% increase in air void content, the fatigue lifetime of asphalt concrete may decrease by 35% (or even more) [
5]. Based on another analysis performed under different circumstances, the authors of [
6] found that every 1% increase in air void content above 7% indicates an approximately 10% decrease in the lifetime of road pavement. Harvey et al. (1996) [
7] arrived at the conclusion that a decrease in air void content from 8% to 5% doubles the fatigue lifetime of asphalt beam specimens. According to the Texas Department of Transportation (2004) [
8], an air void content between 8.5% and 9.9% indicates a significant decrease in value. Moreover, an air void content above 9.9% indicates that the road pavement must be removed and rebuilt [
9]. On the contrary, over-compaction should also be avoided because it may result in a high asphalt density and an air void content of less than 3% [
10,
11]. This is primarily because, after the construction of asphalt, pavements are further compacted by traffic loading. In this period, an intense shear deformation may occur, meaning the air void content cannot be further reduced. Besides this fact, in cases where asphalt pavements have a low air void content, the binder may bleed on the surface due to the lack of space inside.
The compactness and consequent air void content of a built-in asphalt layer are, in practice, usually determined based on drilled core samples. This method causes destruction of the structure and provides only point-wise information, which does not necessarily meet the requirements for representative sampling in the case of older and more inhomogeneous structures. Moreover, this method is expensive, time-consuming, and impossible to measure in real time. Although in situ drilling is useful for analysis at the end of the construction work and is often used as a primary element for quality control testing, it still does not provide real-time feedback during compaction work [
12]. Considering these facts, it is reasonable that, nowadays, emphasis is placed on the use of non-destructive methods for in situ road condition assessments.
The main advantage of non-destructive tests is the ability to perform a large amount of measurements quickly and without disturbance, therefore avoiding damage to the analysed structure. This latter feature is extremely important in cases of newly constructed road pavement structures, as the drilling of freshly built layers is not allowed, even for construction quality control purposes. A detailed review of non-destructive tests can be found in the works of Goel and Das (2008) [
13] and Wang et al. (2022) [
14].
To implement non-destructive tests, the utilization of unmanned aerial vehicles (UAVs) represents a very attractive technology due to their simple use, low maintenance costs, high operational flexibility, and ability to be used at almost any location. Drones, as a common type of UAVs, are powerful tools in several scientific fields. Due to their versatility, multiple types of sensors can be equipped, such as passive sensors (optical cameras) and/or active sensors (light detection and ranging (LIDAR) radar) [
15,
16,
17]. Cameras are the most common payloads in drones as they are the most accessible, are less costly, and offer multifield sensors.
Traditionally, the processes of detecting any type of damage to a pavement are implemented manually or utilized in a road vehicle at a high labour cost [
18]. Road pavement distresses, such as potholes and cracks, may appear on the road surface [
16]. A significant number of studies have focused on the utilization of drone images to monitor and analyse pavement surface conditions (such as [
19]) and automate crack detection from pavement surface imagery [
20]. Additionally, machine learning algorithms or multi-agent architecture [
18] are used as a primary means by which to evaluate such photos and automatically identify cracks and/or potholes [
15,
17]. Multispectral imagery, which presents spatial and spectral features of objects, has been widely used in remote sensing applications. Pan et al. (2018) [
16] evaluated UAV-based multispectral pavement images to differentiate normal pavement from damaged pavement (e.g., cracks and potholes) by applying machine learning algorithms. Hyperspectral sensors are camera-like sensors that capture imagery outside of the visible spectrum. As asphalt pavements deteriorate, changes in asphalt composition arise, and, ultimately, the reflectivity of that alteration allows for the identification of a pavement’s defects in its asphalt [
15,
17]. From the presented devices and methods in the above-mentioned works, this paper deals only with ground-penetrating radar (GPR) measurement technology.
In a comparison of traditional detection methods of highway pavement conditions and GPR, Liu et al. (2008) [
21] concluded that GPR can provide continuous and non-destructive measurements without disturbing the pavement structure. Among various non-destructive testing techniques (NDTs), GPR is considered one of the most efficient instruments due to its high usage flexibility and result reliability [
22]. Furthermore, it is easy to use, is not disruptive to traffic, and can be used as a multi-application device in road transport infrastructure and civil engineering applications. The main applications of GPR for pavement assessment are measurement of pavement layers’ thickness, subsidence, and sinkholes; rebar detection/localization; and detection of moisture damage and crack air voids [
23]. A major advantage of GPR is its capability of collecting data on a centimetre scale at driving speeds when using air-coupled antennas. A GPR assessment can establish accurate, continuous profiles of pavement layers and has the capability to detect major causes of structural failure at traffic speed [
24].
This method is suitable not only for the assessment of the condition of deteriorated road sections but also for quality control of newly constructed sections. Nevertheless, it is mainly used for the former purpose. The reason for such application is its capability of acquiring large amount of continuous spatial data without disturbing traffic [
25]. Continuous measurement is extremely important and useful, since obtaining the spatial extension of local structural data at local points (at distances of 25–50 m or even 500–1000 m) is an ambiguous and difficult task. It is also challenging to obtain a realistic average value of such local data. Using traditional sampling methods, local faults cannot be determined, although with quick feedback to the contractor, these faults could be corrected during or right after construction work.
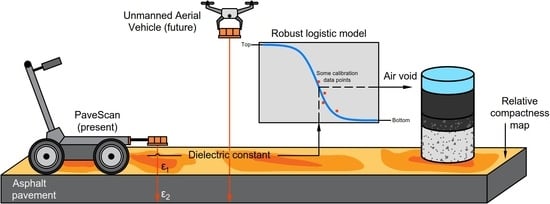
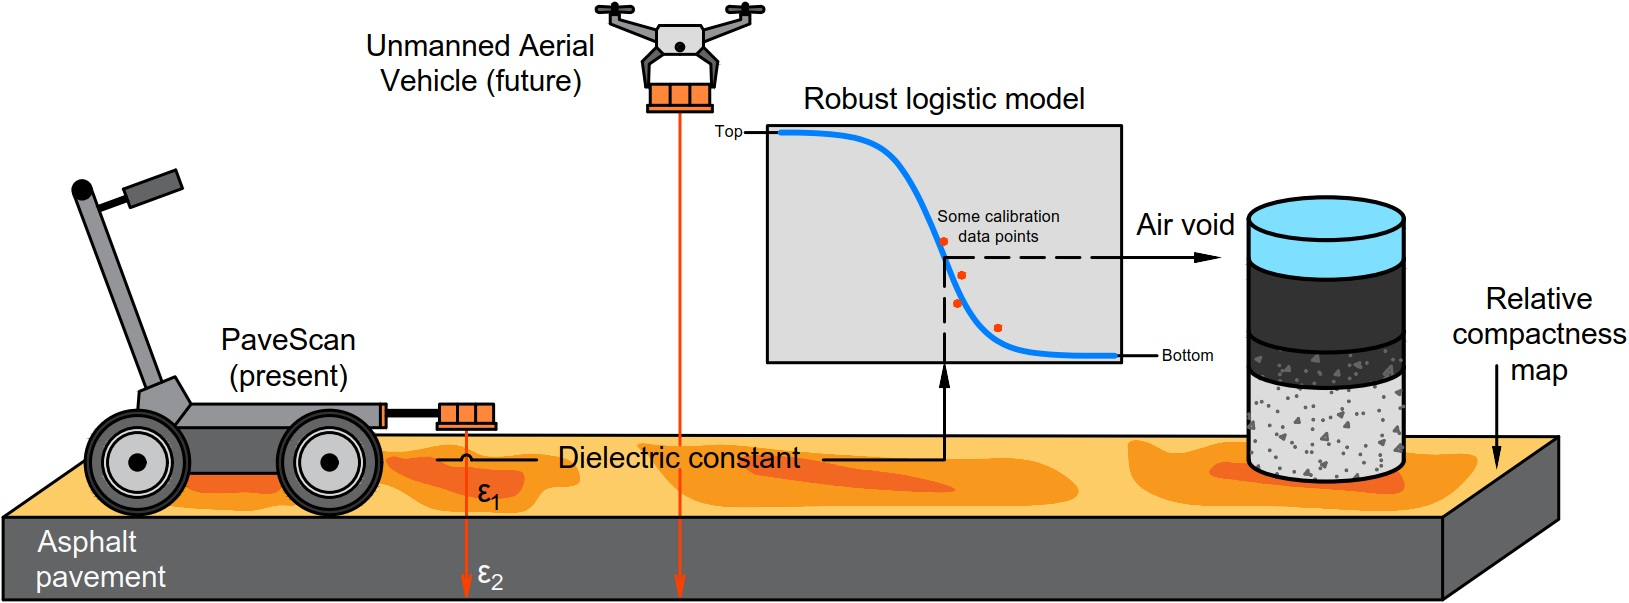
This study, therefore, investigated the applicability of GPR in the field of quality control. We focused on the determination of the air void content of asphalt layers. There are several empirical studies on the relationship between the dielectric constant and air voids in the literature. Most of the formulae are based on an exponential relationship, although in theory, it is clear that air voids have lower and upper asymptotes as a function of the dielectric constant. Therefore, we proposed a new logistic function to describe this relationship and examined how robust each model is in real-world conditions with a few calibration data points.
2. Theoretical Background
A GPR device typically consists of a transmitter, a receiver antenna, a data acquisition and measurement control unit, a distance measuring wheel, and, optionally, a GPS. The transmitter of a GPR device emits high-frequency electromagnetic impulses. These electromagnetic waves are partially absorbed, partially refracted, and partially reflected in the analysed medium. The returning electromagnetic signal is stored by the receiver unit depending based on the time received. The transmission of radar waves depends on the electric and magnetic characteristics of the analysed medium [
26]. Among these characteristics, the two most typical are the relative electric permittivity (dielectric constant) and the specific conductance. The in situ relative permittivity of asphalt layers can be determined in different ways, with most studies applying the Surface Reflection (SR) method [
27,
28]. The advantage of the SR method is that the measured AC surface reflection depends only on the parameters of the upper layer when the analysed layer is thicker than 30 mm [
12].
There are values reported in the literature for the relative permittivity of layers in road pavement structures (asphalt: 4–8, concrete: 9–11). By applying these values, layer thicknesses can be easily calculated without the need for any drilled core samples. The difficulty of this method is that the relative permittivity of road construction materials can be variable, depending on the moisture content, the mineral composition, the temperature, the compactness, and the measuring frequency. The reason is that materials used for road construction (soil, crushed stone, asphalt, and concrete) are mainly three-phased disperse systems from a chemical point of view, in which the proportions of liquid and gas phases depend heavily on weather factors. Moreover, parameters of the solid phase (bitumen) can change over time.
Consequently, GPR measurements are not only suitable for determining layer thicknesses but also for estimating the bulk density and air void content of asphalt mixtures, as well as for monitoring the compactness and moisture content of pavement subgrade to detect road distresses like cracks [
29,
30,
31,
32]. In these cases, an important prerequisite is knowledge of the moisture content and material quality of the disperse system under study, at least approximately; however, even if this condition is not fulfilled, the measured results still offer the possibility of conducting relative spatial comparison, which, by itself, can provide very useful information. Saarenketo (1997) [
33] was one of the first European researchers to apply GPR to measure the density of asphalt pavement structures. His research work was based on the principle that the relative permittivity of a pavement structure is presumably a function of the relative permittivity of its constituents; therefore, changes in the volumetric proportions of these phase constituents can be estimated by measuring the relative permittivity of the total pavement structure.
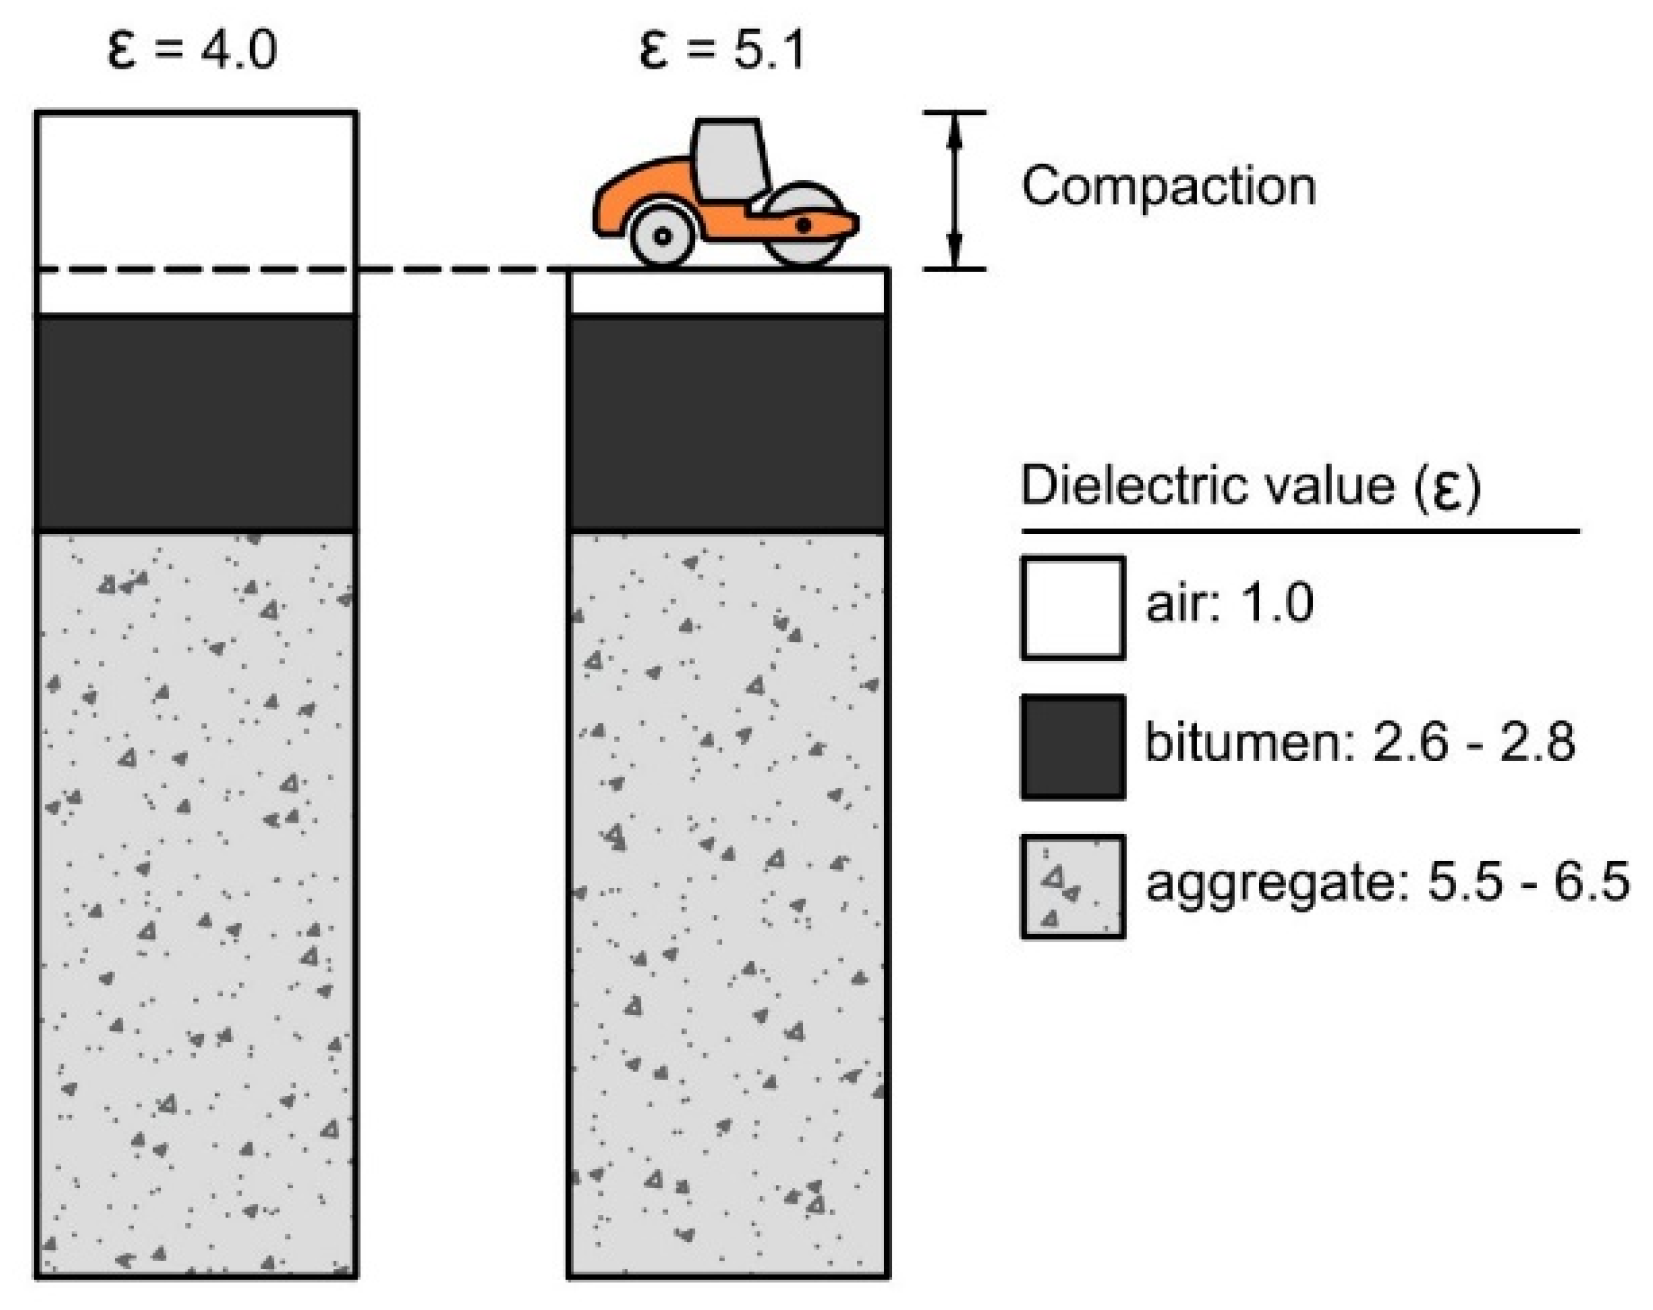
The constituents of an asphalt mix are bitumen, mineral aggregates, air, and sometimes water (
Figure 1). The relative permittivity of the bitumen is usually between 2.6 and 2.8, the relative permittivity of the crushed dry aggregates is usually between 5.5 and 6.5, and the relative permittivity of air is approximately 1. Although the relative permittivity of water depends on its chemical characterization capacity, it can be assumed that, in the case of a new pavement structure, water bears no effect on the measurement of the structure’s relative permittivity.
The compaction of asphalt decreases with an increase in the air proportion (having a low relative permittivity) and increases with an increase in the volumetric proportions of the bitumen and aggregates; in the latter case, the relative permittivity of asphalt also increases. GPR data collected on different roads have proven that a decrease in the value of the relative permittivity indicates density problems. Therefore, the application of GPR has great potential in monitoring road pavements and identifying their local problems [
28]. There are several approaches described in the literature concerning the relationship between relative permittivity and the air void content of asphalt mixtures. The most frequently used approach characterises the empirical relationship between these two characteristics. Based on research in Finland, a conclusion has been drawn [
33] that there is an exponential relationship between relative permittivity and the air void content (
) of asphalt mixtures [
34]:
where
is the air void content of the asphalt mixture,
is the relative permittivity of the asphalt mixture, and
and
are the calibration constants depending on the type of mixture. To determine the values of the parameters in Equation (1), Finnish researchers measured the relative permittivity of asphalt samples with various air void contents by applying a percometer probe, and fitted an exponential regression model with a determination coefficient
:
After establishing the correlation equation, further measurements were performed but the new data were not in good agreement with the former data. Researchers assumed that this phenomenon is a consequence of the differences in the dielectric characteristics of aggregates, and the inaccuracy of the model could be corrected by shifting the dataset. A
calibration factor was, thus, introduced, and the final model has the following form:
The calibration factor was calculated for all in situ drilled core samples, and the values were averaged. This average value is valid for asphalt mixtures produced in a certain mix plant using a certain aggregate source.
The exponential model shows a good fitting to the drilled asphalt samples. However, in the case of samples with lower relative permittivity values, its predictions become inaccurate. This is why the authors of [
12] recently published a new formula with better fitting, even for cases with extreme data values. The proposed Hoegh–Dai (HD) model introduces physical constraints on the possible maximum and minimum values, thereby preventing the model from predicting a negative air void content or a relative permittivity value below 1:
where
is the air void content of the asphalt mixture;
is the relative permittivity of the asphalt mixture; and
,
, and
are the calibration constants determined by minimizing the sum of the square differences between the model and experimental data. If the input relative permittivity value is close to 1 (for air
), then the HD model predicts a 100% air void content, which is physically correct. This way, the model is not sensitive to the unrealistically high air void content of drilled core samples and is suitable for extrapolation below the lowest value of the calibration dataset [
12]. With this development, the HD model fits well to drilled core samples with an air void content between 4% and 12% [
35] but according to recent experiences, it still overestimates the slope of the relationship function between the air void content and relative permittivity in cases with extreme data values.
Steiner et al. (2020) [
36] proposed that the core sample data predict an inflection point near the extreme values, where the slope of the model function is flattening. Consequently, the measured data can be better described by applying a logistic function instead of an exponential function:
where
,
and
are the parameters determining the slope and inflection point of the logistic function;
and
are the lower and upper limits of the logistic function, respectively; and
and
are as explained earlier. Since the air void content of drilled hot-mix asphalt core samples cannot exceed 20% in practice, the value of the parameter
is fixed at 0.20. A further expectation is that as the values of relative permittivity approach that of the air (
), the function shall approach a 100% air void content. Therefore, the lower limit
is established using the following formula:
Considering the above-mentioned aspects and substituting the above equation into Equation (5), the recommended MnDOT (Minnesota Department of Transportation) model is based on the following final formula:
The remaining three parameters in the MnDOT model can be determined by minimising the sum of the square differences between the gyratory specimens and modelled data [
36]. This approach makes it possible to measure the in situ air void content using a GPR device without a core sample calibration.
3. Materials and Methods
The potential application of GPR technology was demonstrated on an experimental section of a Hungarian residential street that was about 220–240 m in length. The measurements and their assessment aimed to control the prescribed compactness and air void content of freshly built asphalt layers. The composition of the road pavement structure of the analysed two-lane residential street was as follows:
A 4.0 cm AC 11 wearing course.
A 7.0 cm AC 22 binder course.
An 8.0 cm AC 22 base course.
A 20.0 cm FZKA 0/63 unbound granular base.
A 20.0 cm sandy gravel protection layer.
Samples were taken from the AC 11 and AC 22 asphalt mixtures and tested in the laboratory. The main characteristics of these asphalt mixtures were as follows:
The proportion of the binder (bitumen) by weight was
= 4.1%, with its relative density
= 1050 kg/m
3 in both mixes. The maximum density of the aggregates used was
= 2759 kg/m
3. To determine the model parameters, either in situ drilled core samples or gyratory specimens obtained from a given asphalt mixture can be used [
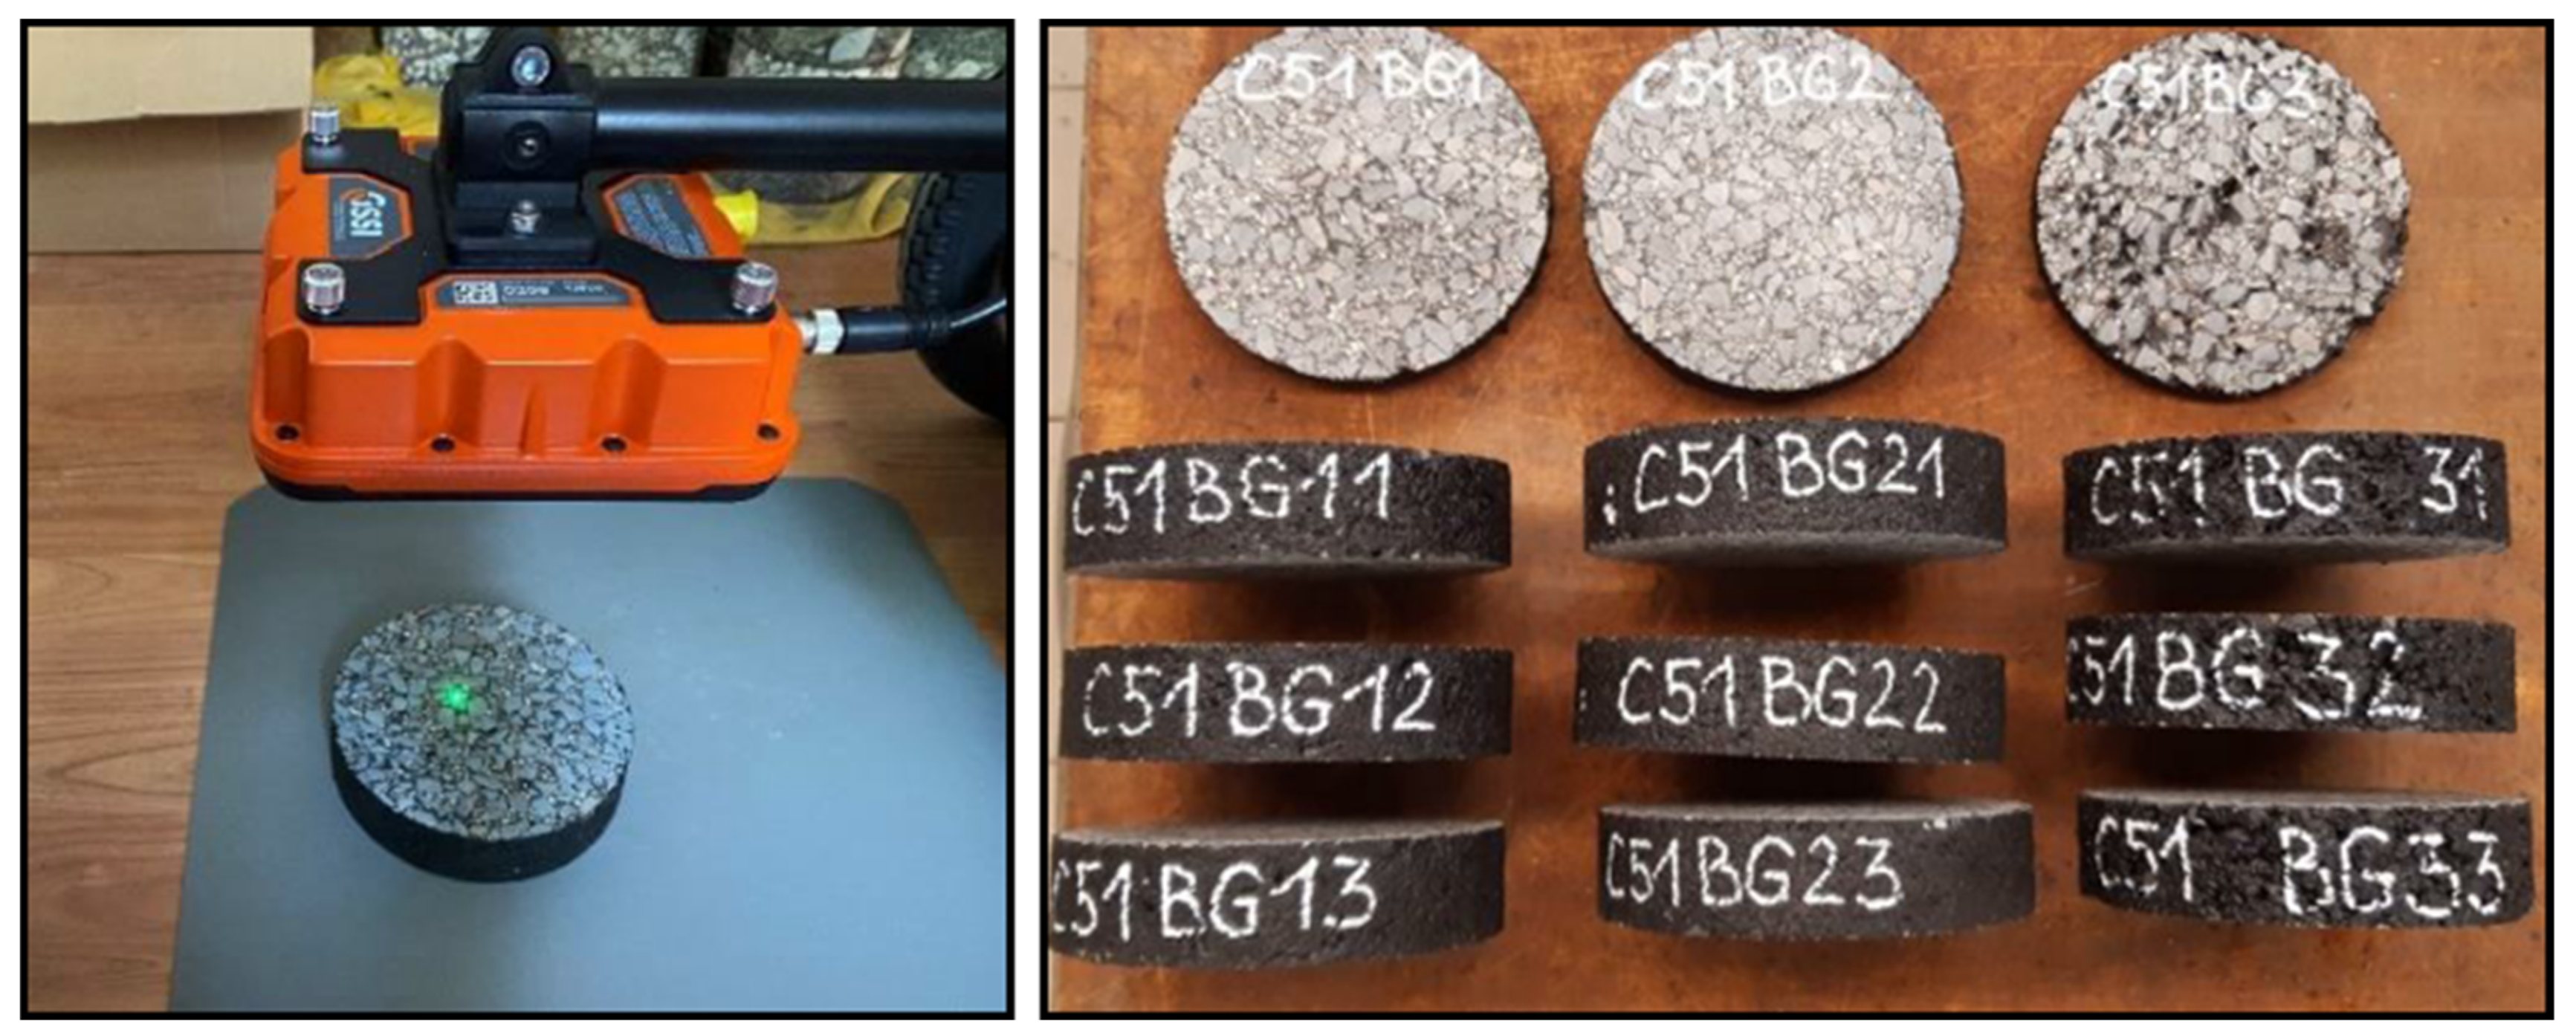
35]. In the present work, the latter method was chosen, and gyratory specimens were prepared in three ways from the transported asphalt material in the laboratory to calibrate the models for the air void content and the relative permittivity. The reference specimen had the prescribed mass and was compacted at 150 turns. The second specimen had a 10% increase in mass and was compacted at 408 turns. The third specimen had a 10% decrease in mass and was compacted at 12 turns. All specimens were split into three slices, and their
bulk density and
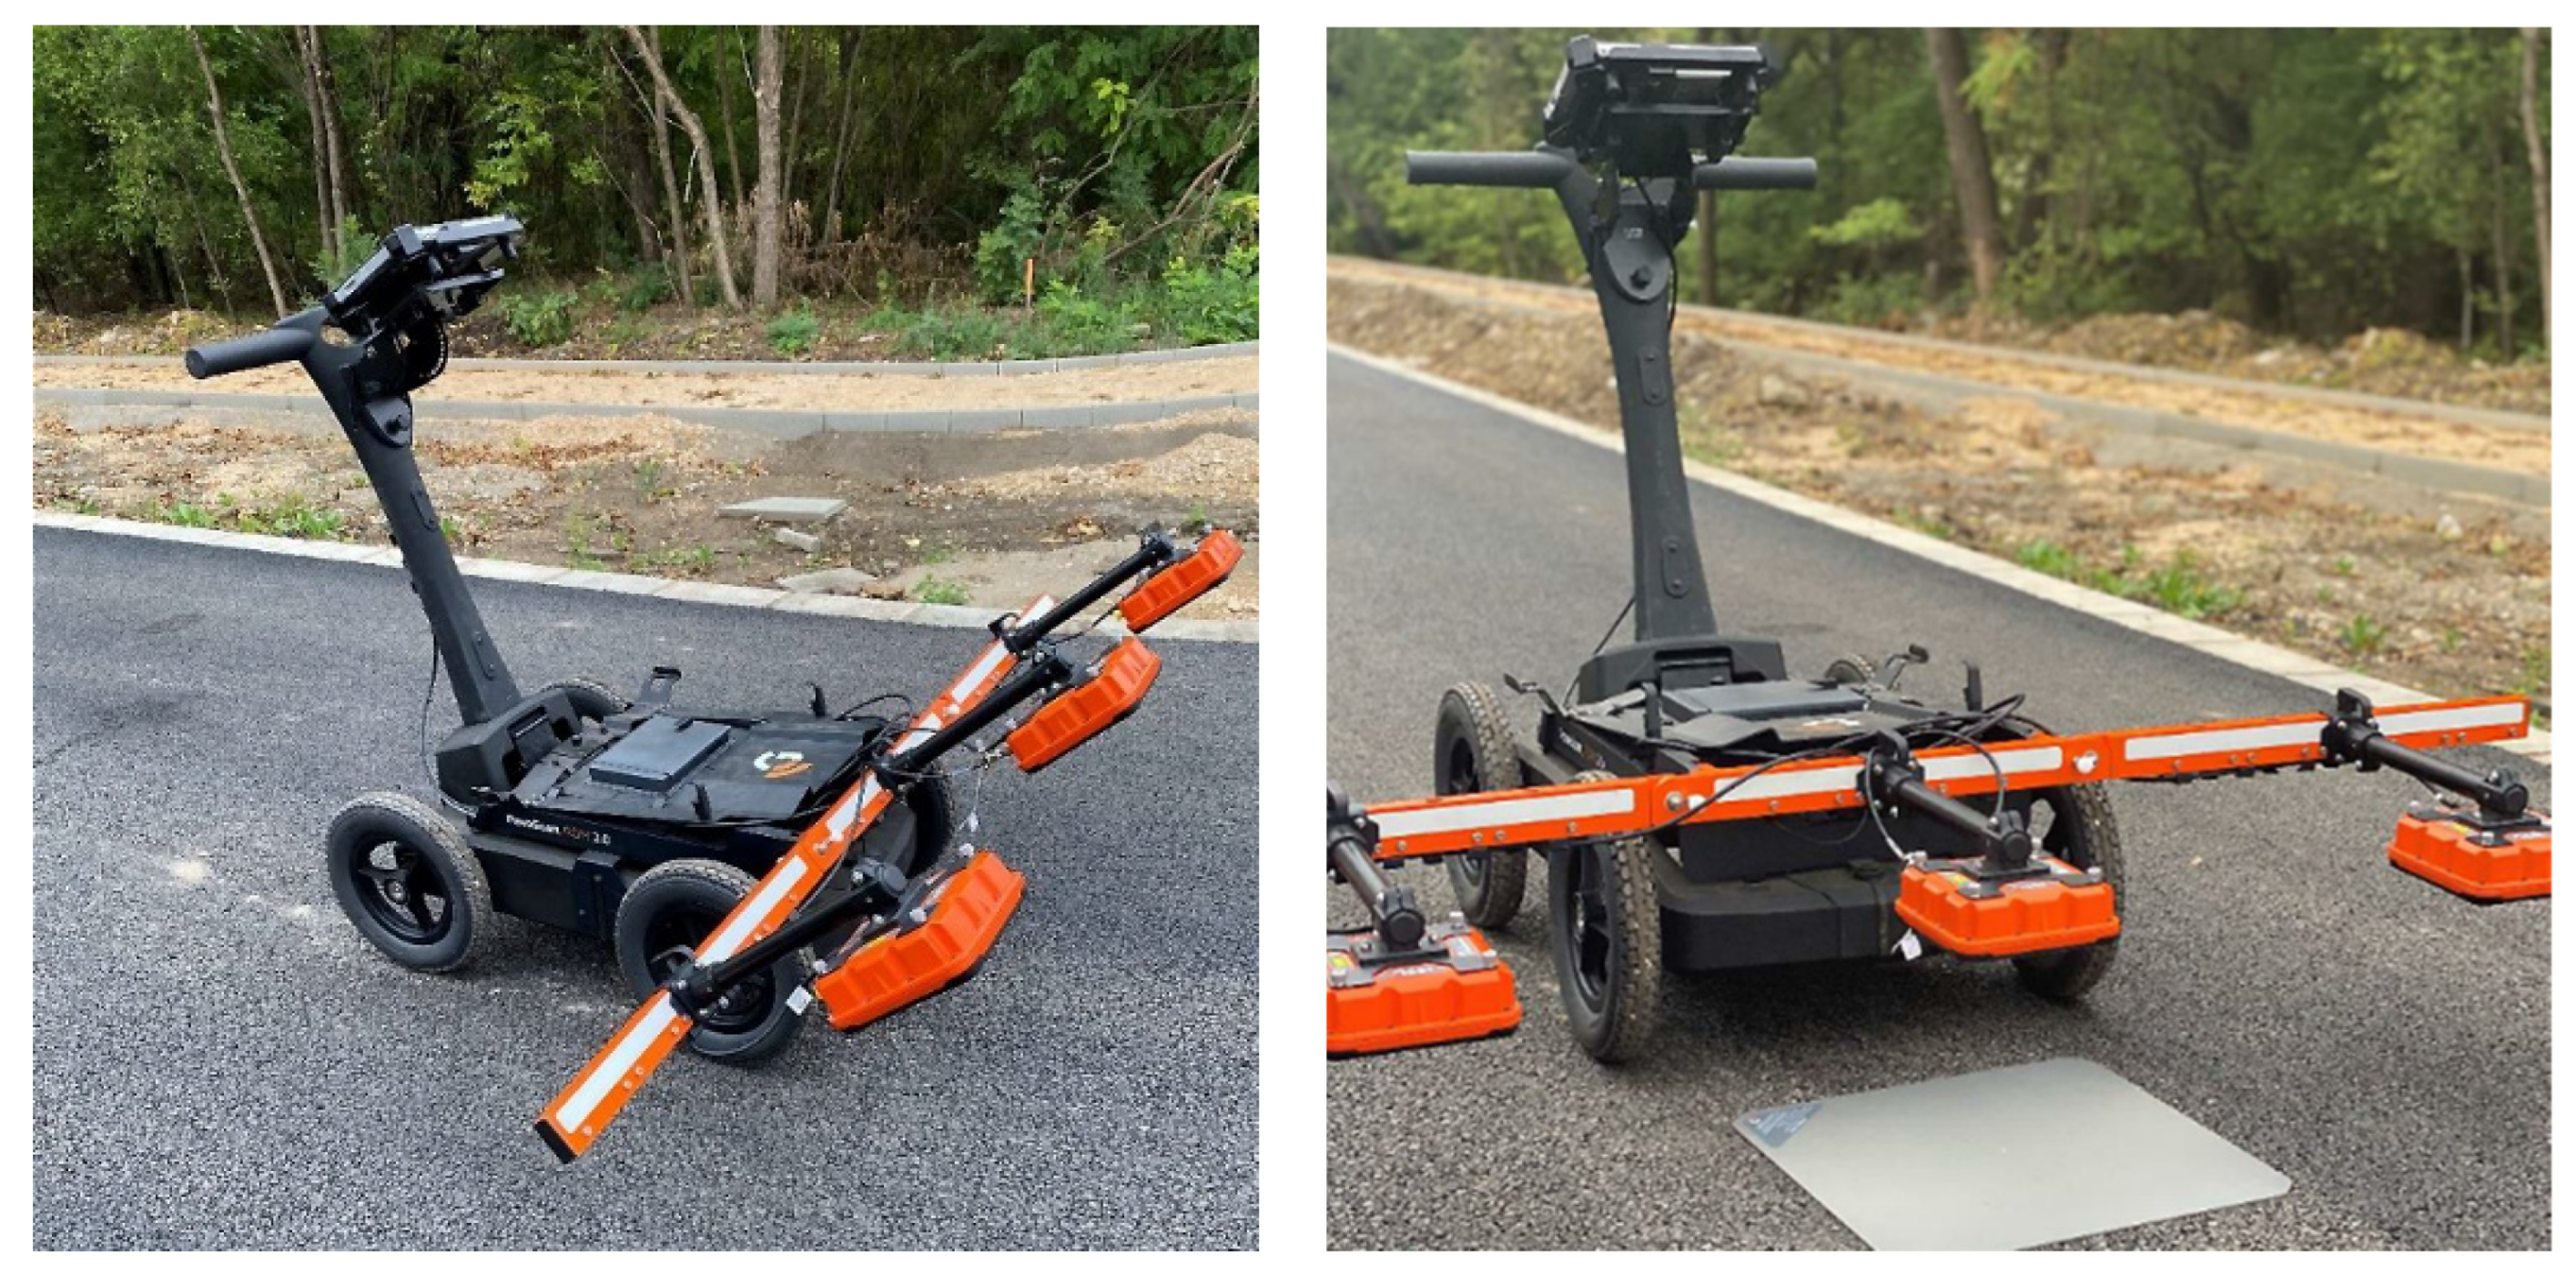
relative permittivity were determined using a GSSI PaveScan device (
Figure 2).
The PaveScan device basically measures the dielectric characteristics of the analysed asphalt mixture with a 2 GHz middle-frequency antenna and estimates the bulk density. In the next phase of this research study, the correlation between the
relative permittivity measured in the laboratory and the
air void content of the asphalt layer was determined. The air void content can be calculated from densities as follows:
The HD and MnDOT models were fitted to the data points of air void content and relative permittivity determined in the laboratory. Besides these two popular models, another
S-shape function was investigated, which has been successfully applied in the field of rheology [
37]:
where
denotes the difference between the upper and lower asymptotes of the function,
denotes the slope of the function between the upper and lower asymptotes,
shifts the total curve horizontally (left or right, depending on its value), and
is the lower asymptote of the function.
The recommended model of this work, as described in Equation (9), possesses all the positive qualities of the MnDOT model and has only 4 parameters instead of 5. Moreover, considering the model constraints established by [
36], the number of remaining free parameters has been decreased to 2 as follows:
To determine the optimal parameters for these three nonlinear models, a program code was developed in Python, mainly applying the curve_fit procedure from the SciPy library. The confidence intervals of the parameter sets of the models fitted to the data were calculated using the NumPy function. The laboratory data and model parameters were determined by minimising the least square error, thereby providing the possibility of recalculating the relative permittivity data into bulk density or air void content. For the evaluation of the goodness of fit of the models, the standard error of
estimated based on
, the standard deviation
and the adjusted coefficient of determination were calculated for all regression models. The adjusted
is a modification of
considering the number of observations and the number of explanatory variables. The formulae are as follows:
where
is the measured value,
is the predicted value,
is the average of the measured values,
is the sample size, and
is the number of independent variables. A lower
value and a higher
value indicate better agreement between the predicted and measured data. Based on previous research [
38,
39,
40], an excellent model fit is achieved if the value of
is below 0.35 and
is above 0.9, as shown in
Table 1.
After conducting the laboratory tests, the relative permittivity of the built-in asphalt layers was measured in situ using a PaveScan non-destructive device, which was developed for asphalt density evaluation (
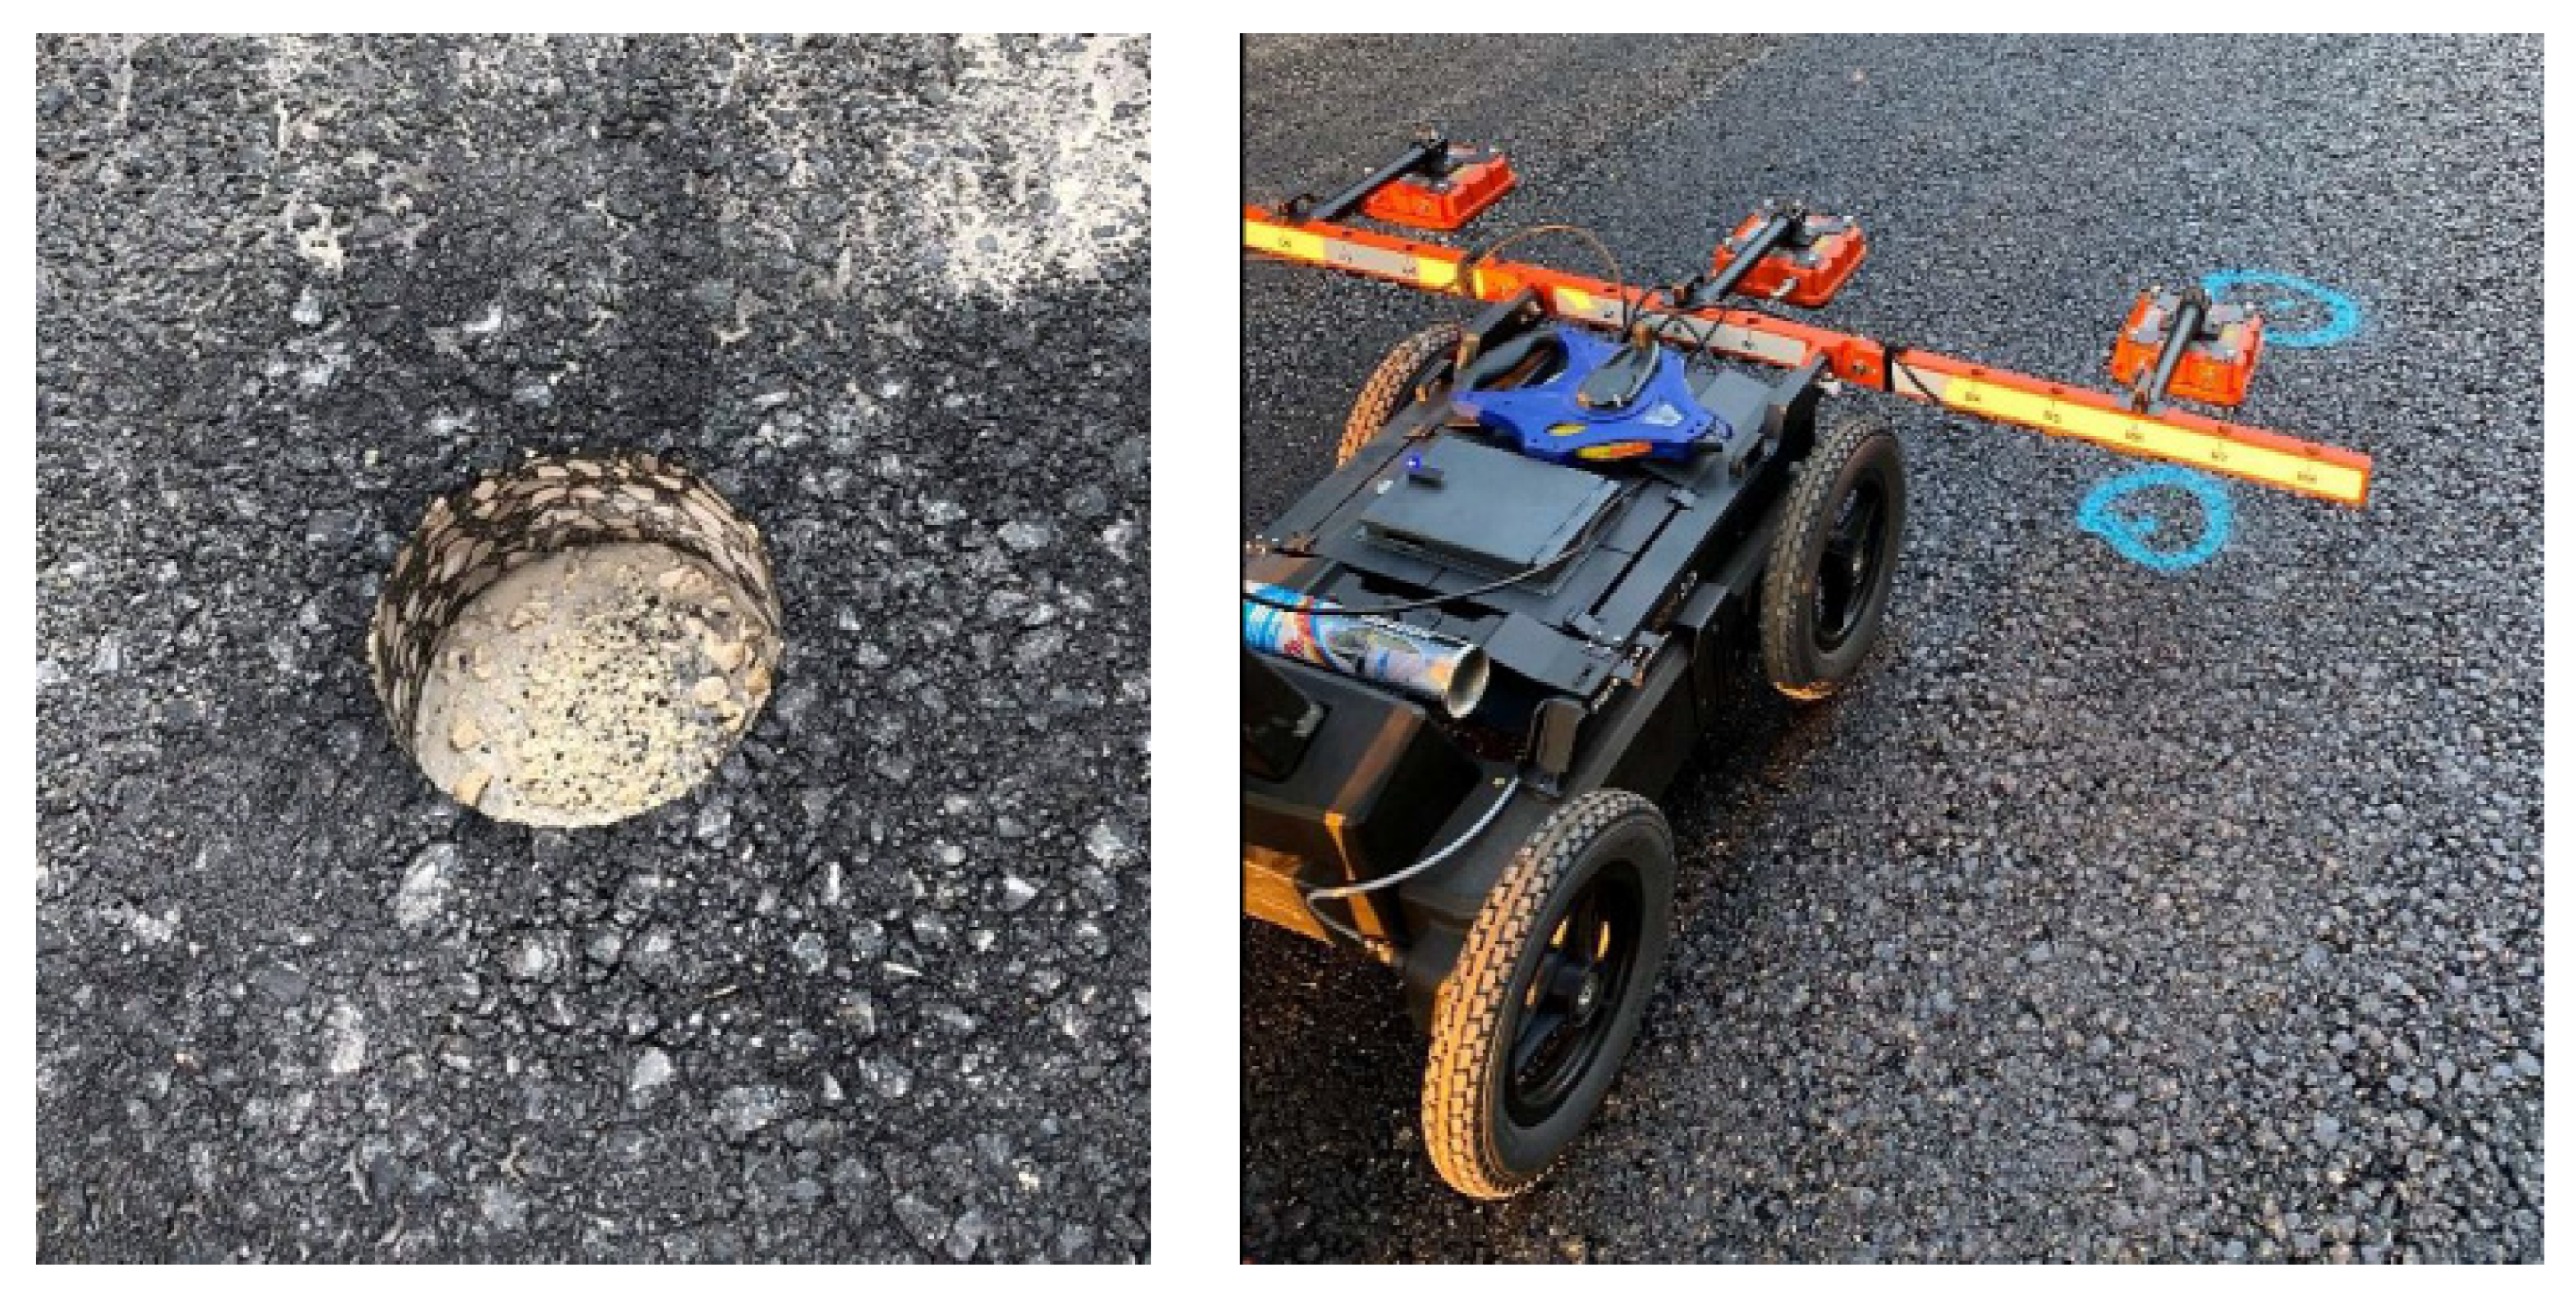
Figure 3). The device has three 2 GHz frequency air-coupled sensors at an arbitrary distance from each other, albeit with a maximum distance of 1.1 m, in order to properly cover the road surface. The sensors were fixed at a 30 cm height above the surface.
The sensors automatically calculate the relative permittivity of a given point on the asphalt surface based on the Surface Reflection (SR) method. The device performs 40 scans per metre; therefore, it is possible to perform a high-resolution determination of the relative permittivity. The measurement process starts with air calibration (
Figure 3, left) to eliminate background noises, and metal plate calibration (
Figure 3, right) to detect the amplitudes of electromagnetic waves reflected from the asphalt surface and from the metal plate.
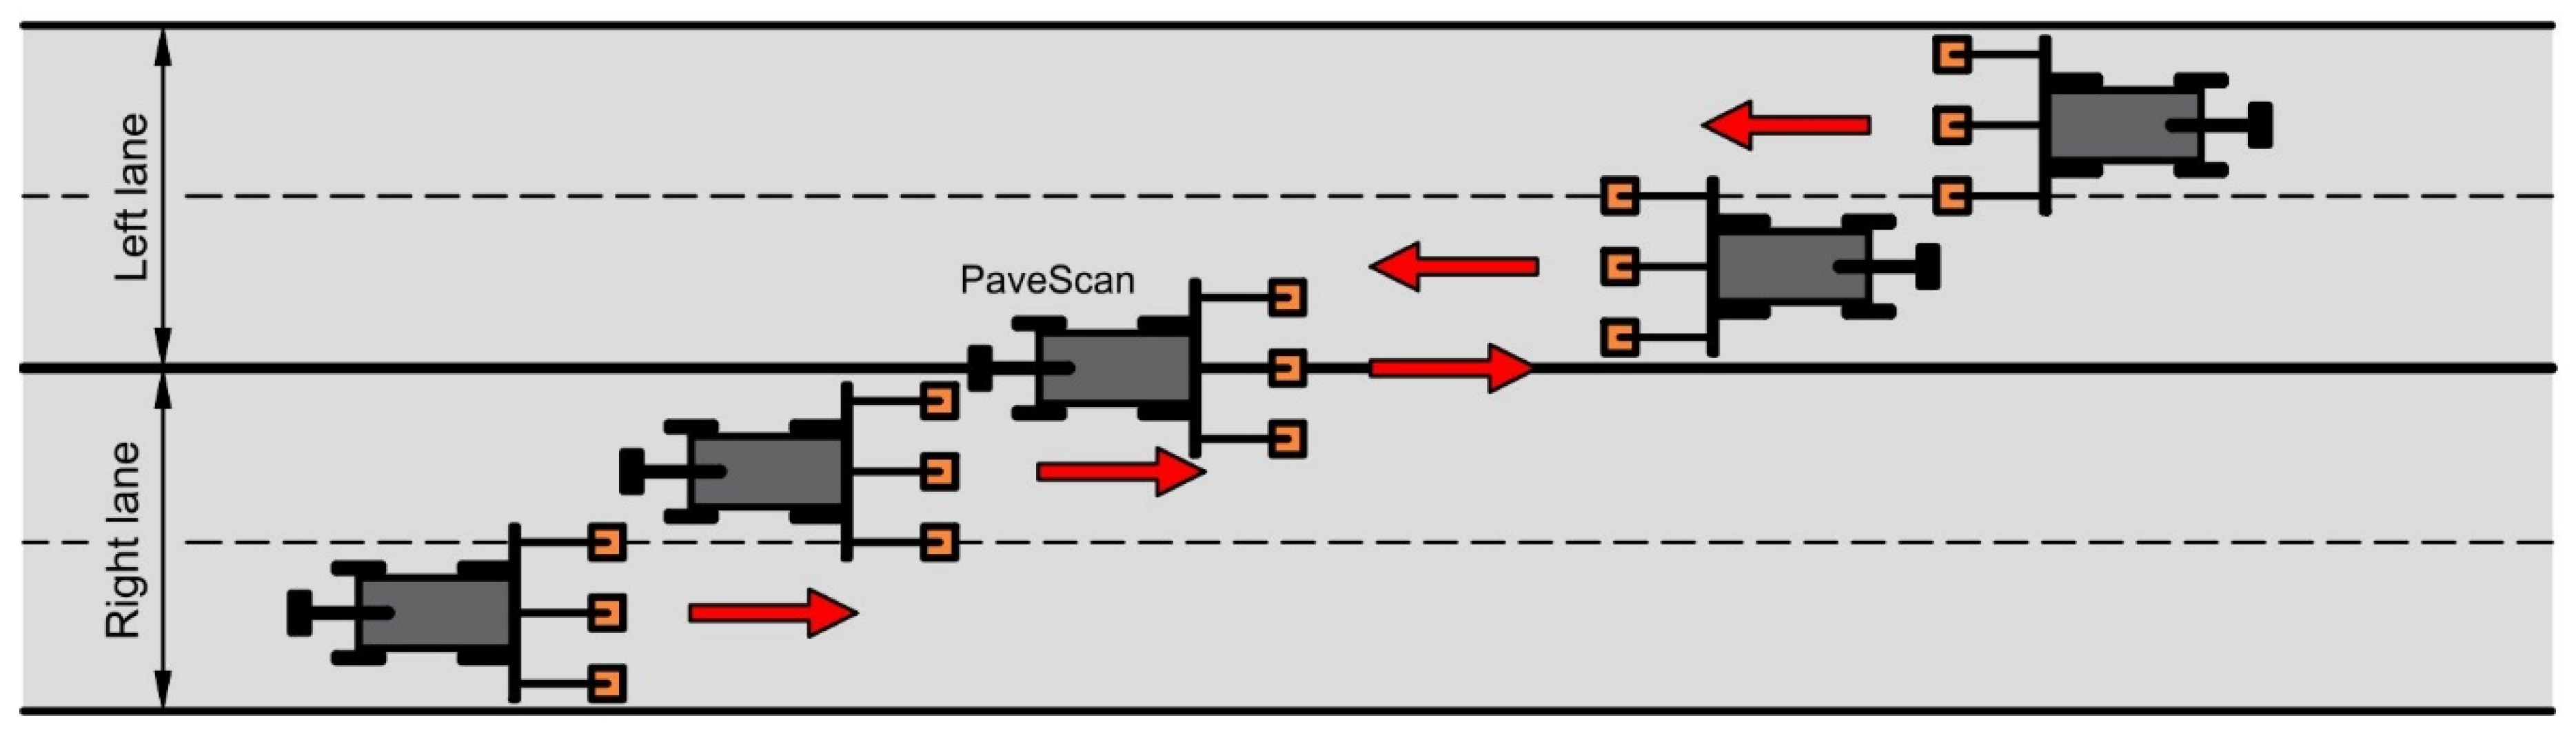
Three measurements were performed on the entire experimental road section using the PaveScan device. The first (#1) measurement was performed after constructing the AC 22 asphalt base course, the second (#2) measurement was performed after constructing the AC 22 asphalt binder course, and finally, the third (#3) measurement was performed after constructing the AC 11 asphalt wearing course. By performing the measurements on every layer, information was acquired regarding the relative permittivity of all asphalt layers. To cover the entire carriageway, two measurements were performed on each lane, one at the lane edge (using the outside sensor near the shoulder) and another at the middle of the lane (using the outside sensor near the road axis). To acquire more detailed data, these measurements were complemented with a measurement along the road axis (
Figure 4).
For the validation of the GPR measurement results, drilled core samples were obtained and analysed. After constructing the asphalt AC 22 base course and the asphalt AC 22 binder course, 3-3 core samples were extracted on the right and left lanes at about ~70 m apart (
Figure 5).
However, in the case of the asphalt AC 11 wearing course, only one in-site drilling was performed. The bulk density of the core samples was determined using the AASHTO T 275-A method.
After performing the in situ measurements, the relative permittivity values were exported from the PaveScan device at every 0.5 m, starting at the lane edge and moving towards the road axis in the sequence of: 2.9 m, 2.3 m, 1.7 m, 1.3 m, 0.7 m, 0.6 m, 0.1 m, and 0 m.
The spatial relative permittivity values were recalculated as air void content values by applying the recommended model in this work, as shown in Equation (10). Finally, the in situ relative compactness (relative density) of the analysed layers was calculated [
12,
41] using the following formula:
where
is the relative density of the mixture;
is the air void content of the mixture;
is the bulk density of the compacted mixture; and
is the theoretical maximum density of the mixture without air void.
It is clear from Equation (14) that the density level reached at a construction site and the air void content are two inversely related condition parameters: the higher the compactness, the lower the air void content. This is why the air void content of the built-in asphalt layers is usually characterised based on the relative compactness or the relative density.
According to Brown (1990) [
41], the initial air void content of a newly built layer cannot exceed 8%, and after compaction, it cannot be less than 3%. Based on these limits, the
relative compactness of new layers typically varies between 0.92 and 0.97. Immediately after construction, it is regarded as optimal if the relative compactness is 0.93–0.94.
4. Results and Discussion
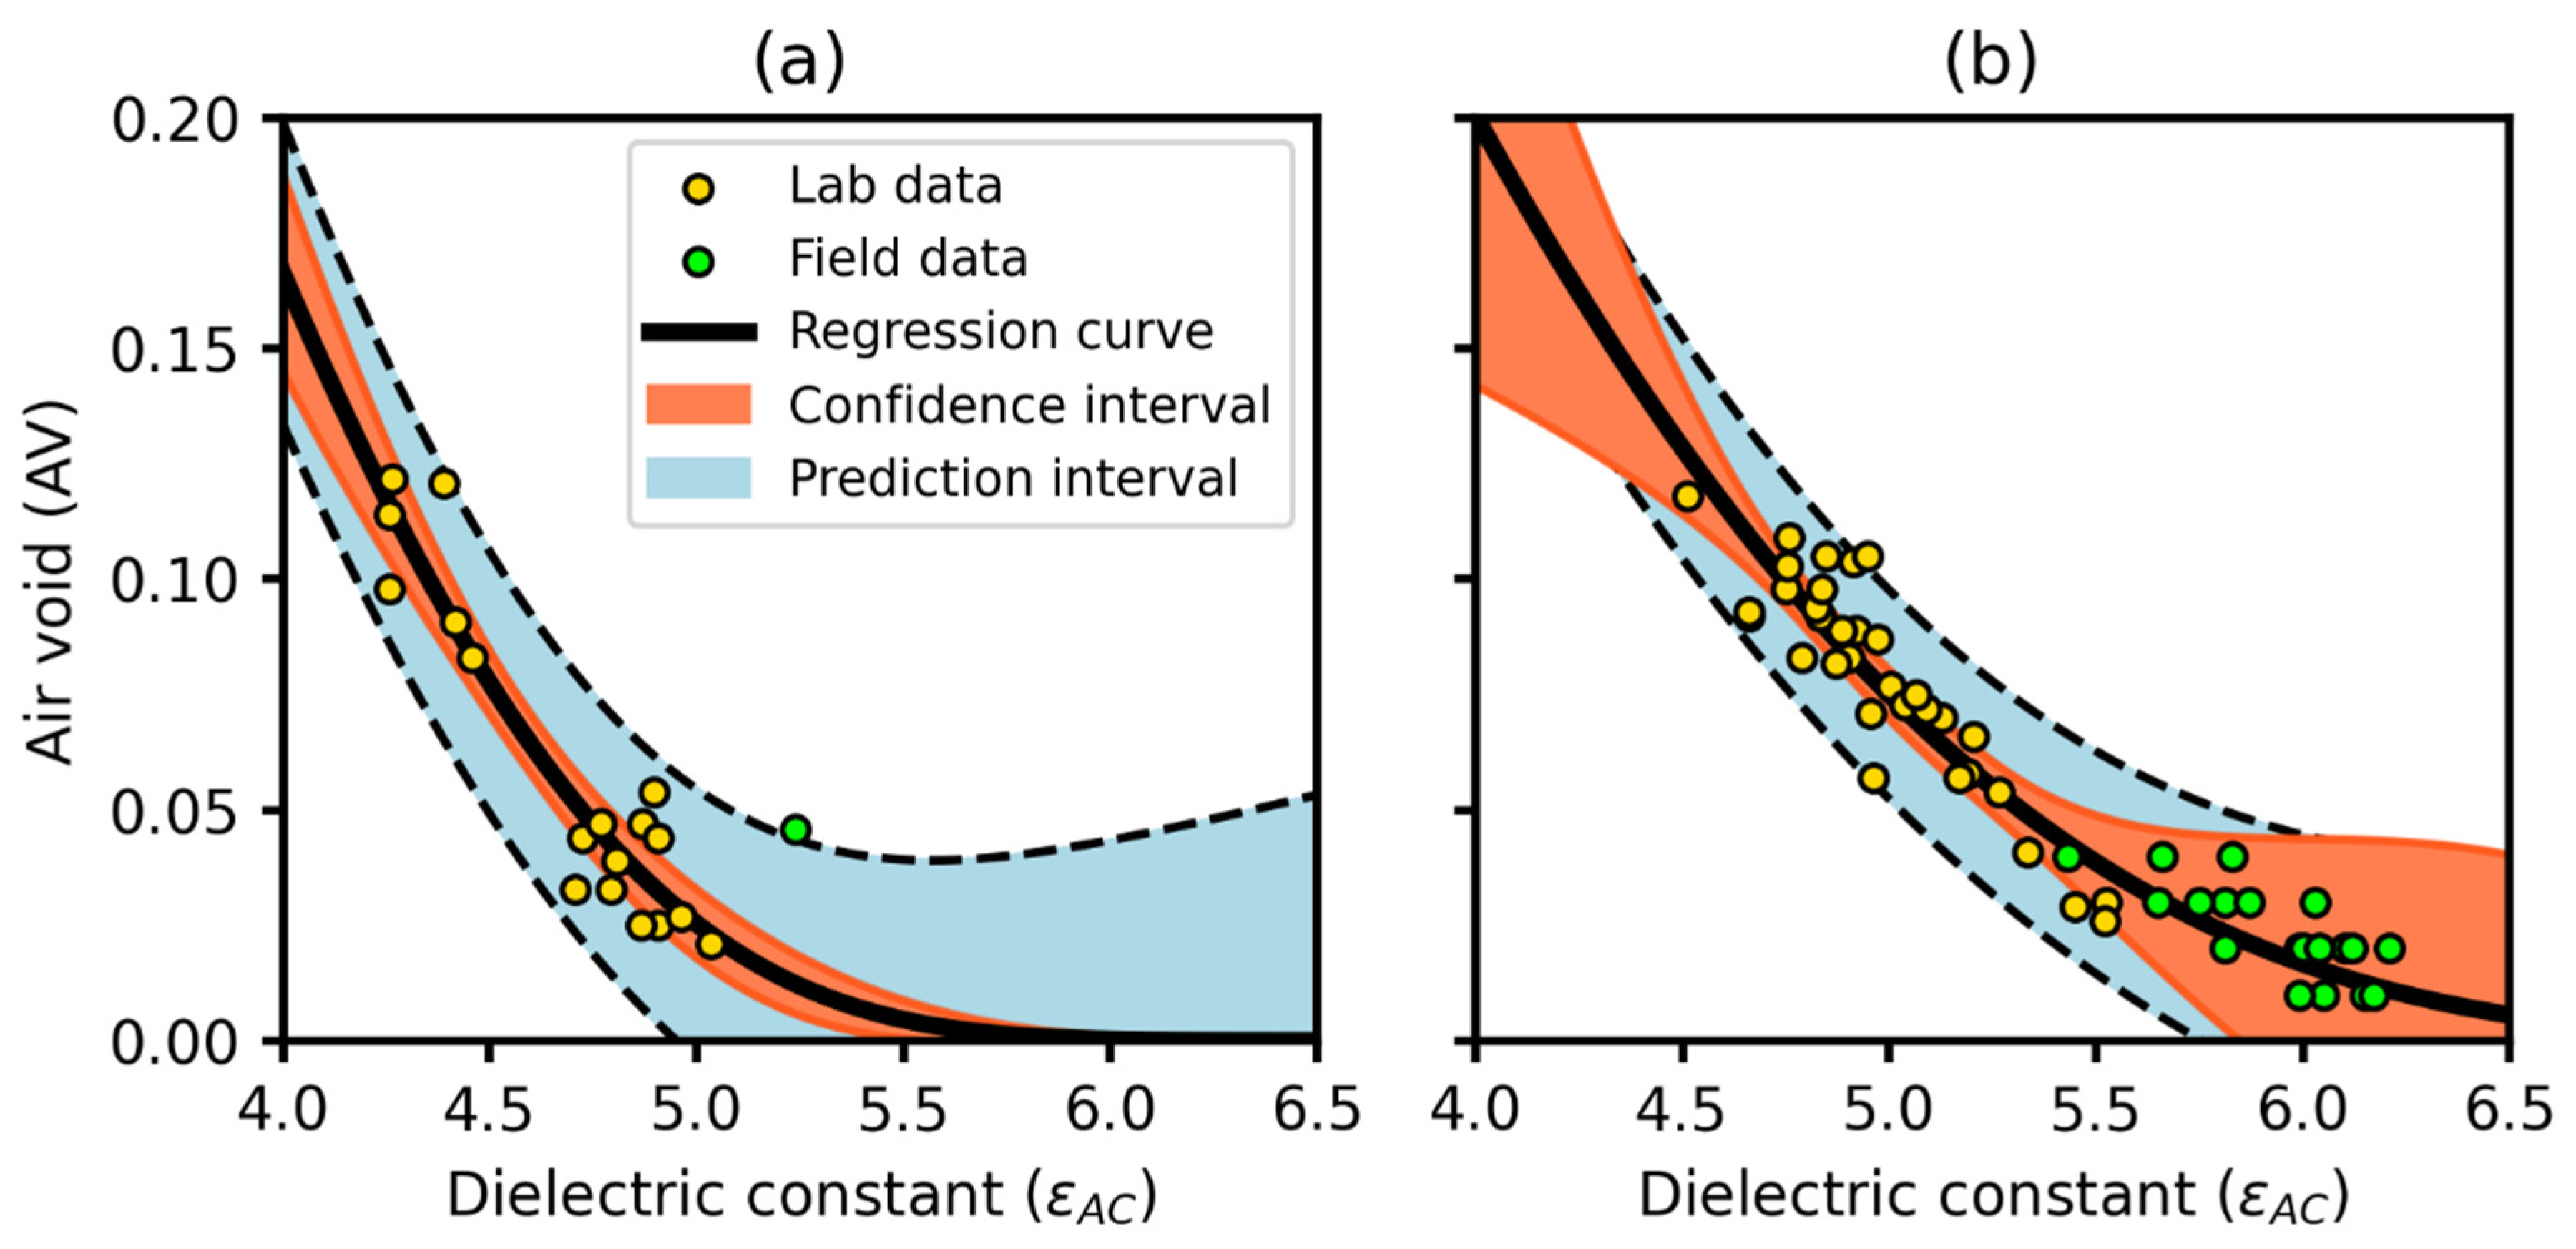
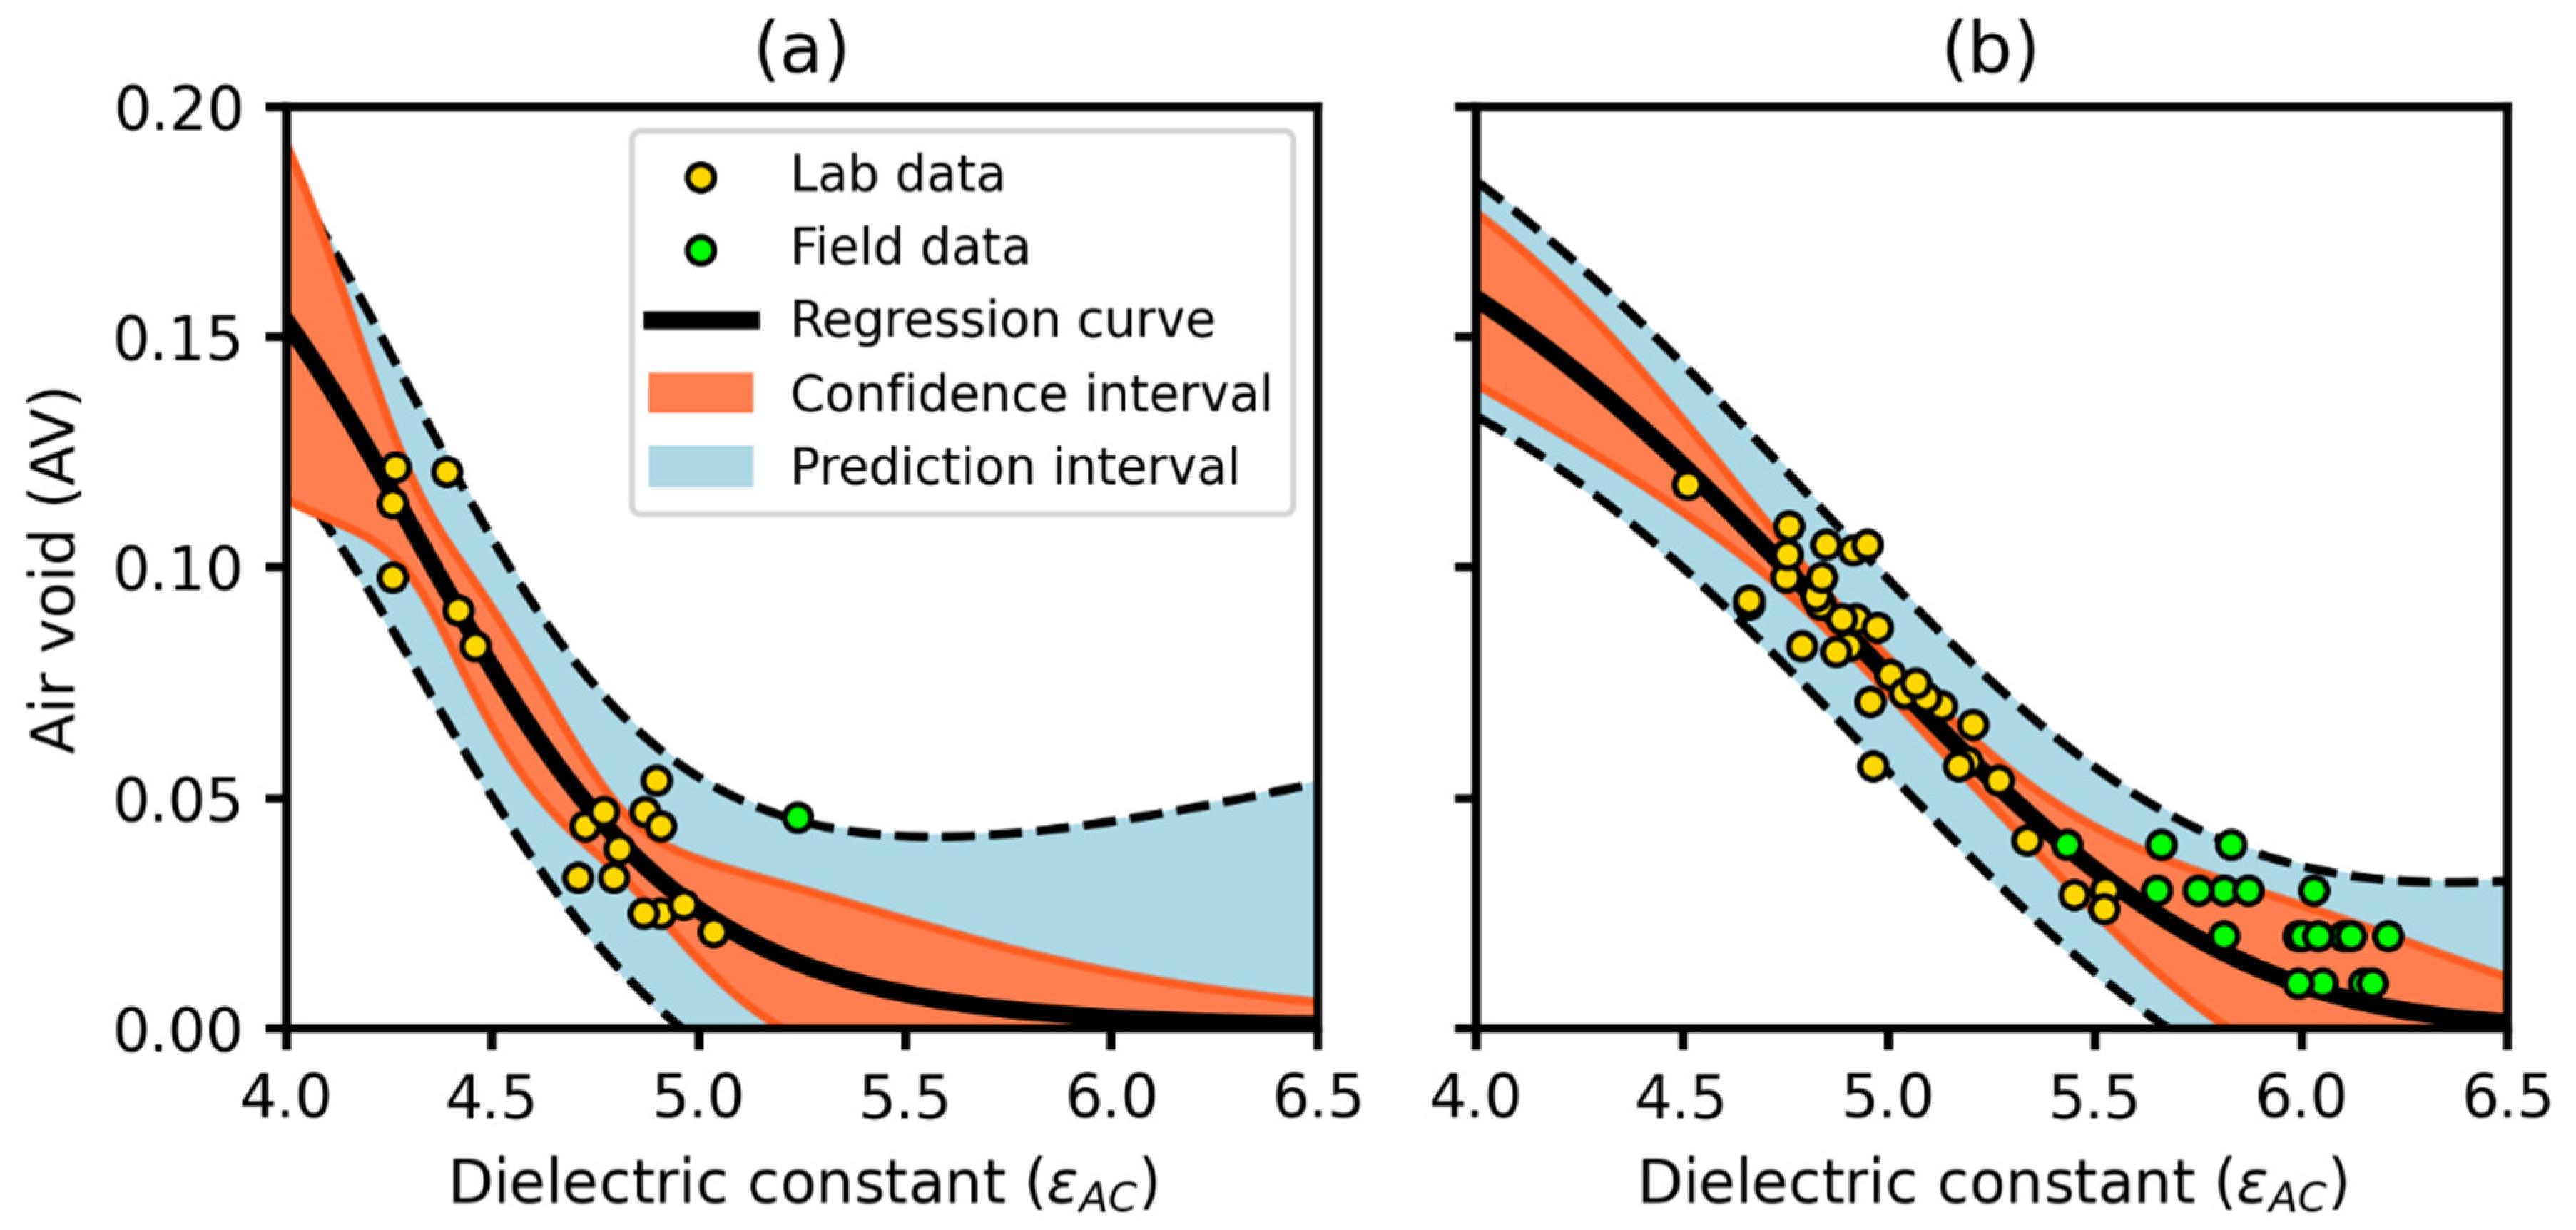
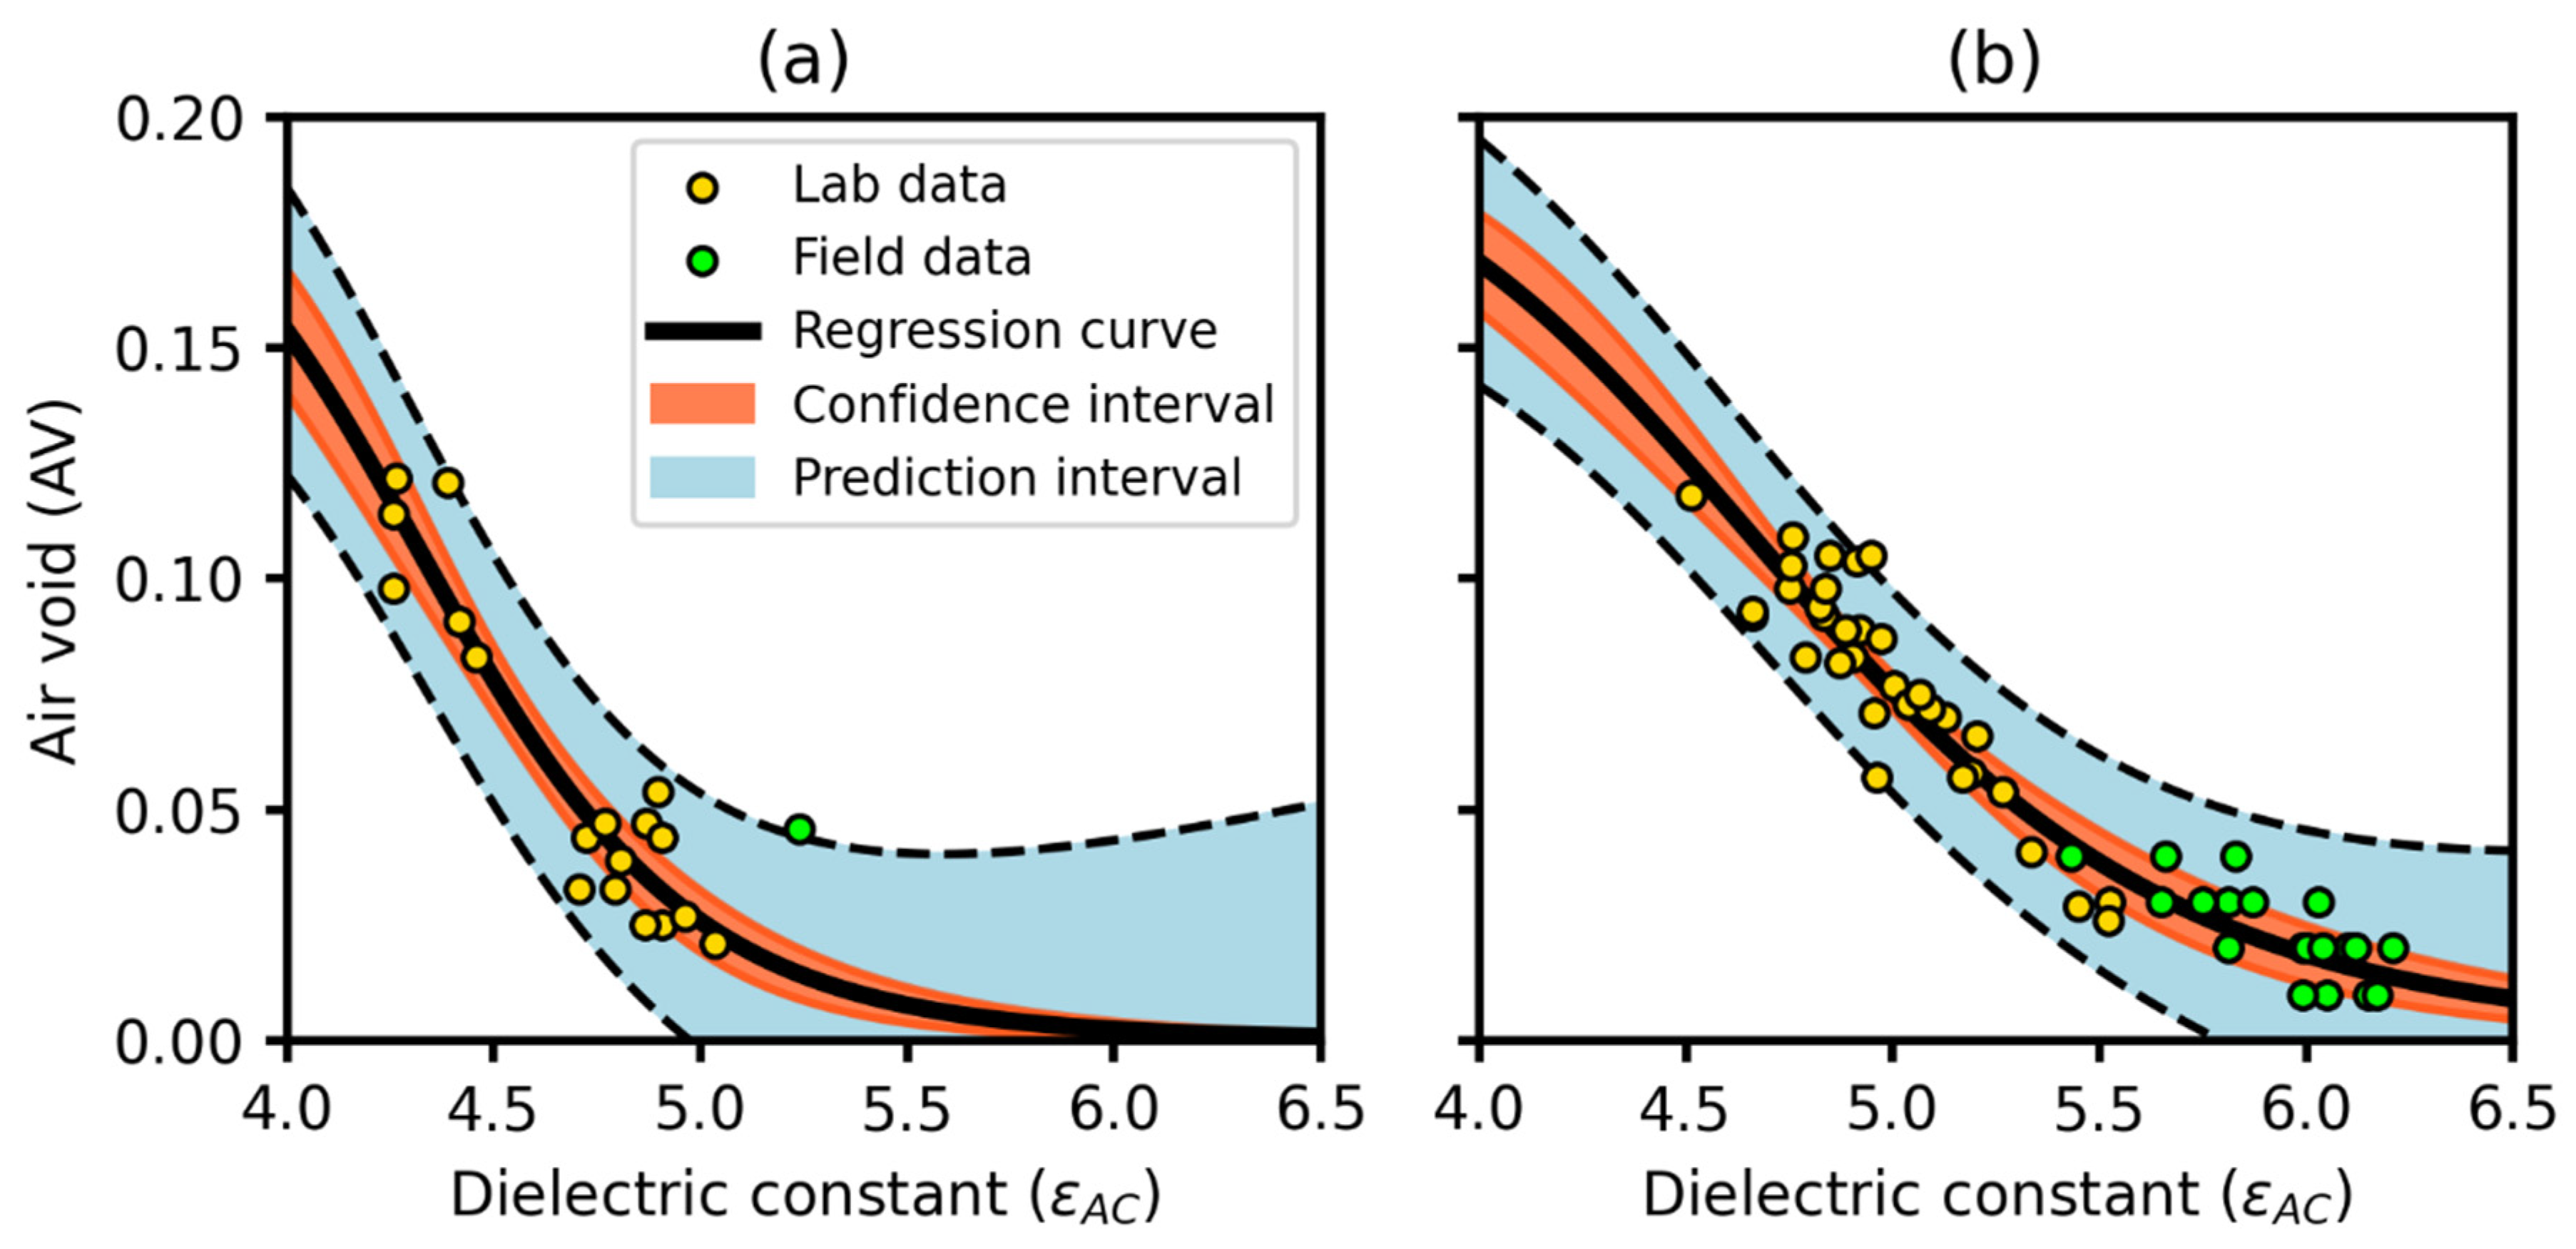
Based on the data obtained from the testing of the gyratory specimens, the parameter sets of the HD model, the MnDOT model, and the recommended model (Equation (10)) were determined. The 95% confidence intervals of the models as well as their prediction intervals were calculated. The prediction interval describes the expected range of future observations, while the confidence interval shows the probability range of estimates compared to the data average. The results of the numerical calculations are presented in
Table 2, along with the goodness-of-fit values from model fitting. Graphical representations of the analysed models and their results are shown in detail in
Figure 6,
Figure 7 and
Figure 8.
Based on the adjusted and the quotient, every analysed model achieves good performance in predicting the air void content of both asphalt mixture types. Only the HD model shows a slightly lower performance, but the difference to the other models is negligible. However, there are significant differences in the uncertainty of model parameters.
The parameters of the HD and MnDOT models vary in a rather wide range, which suggests they are characterised by high uncertainty. A good example for this is the HD model for the AC 22 asphalt mix, where the 95% confidence interval widens at both low and high values of relative permittivity. A similar phenomenon can be observed for the MnDOT model, mainly in the case of the AC 11 asphalt mix. The model recommended in the present paper shows less uncertainty compared to the other two models. The recommended model is characterised by a very narrow confidence interval for both asphalt mixtures, which provides the possibility for more accurate population predictions (
Figure 8).
The data points of the drilled core samples are indicated on the figures in lime green colour. These data points were not used for model fitting. There are differences between the laboratory and field dielectric constants. The results of the laboratory tests are limited to a certain degree. Thus, the density values obtained from the laboratory tests using the available compaction equipment are much lower than the field values. With in situ compaction, the air void content usually ranges between 4% and 5%. In the laboratory, it is also necessary to consider the scattering of the GPR signal from the edge of the sample under test. Despite this fact, the recommended model fits well even when using such data in the case of the AC 22 asphalt mix. The HD and MnDOT models underestimate the results of the in situ tests (
Figure 6 and
Figure 7). For the AC 11 wearing course, only one core sample was taken; therefore, detailed analysis could not be performed. Nevertheless, it is clear that although the results of the drilled sample are significantly different from the laboratory test values, they are still within the border of the prediction intervals (
Figure 6a,
Figure 7a, and
Figure 8a). Since a prediction interval describes the uncertainty of a given data point, it can be assumed that the sample taken from the wearing course has a higher sampling error compared to the samples taken from the binder and base courses.
In the case of the recommended model, it can be observed that the b parameter, which influences the S-shape, is similar for both AC 11 and AC 22 asphalt mixes. Therefore, a conclusion can be drawn that with a suitable amount of data, the b value can be regarded as constant. Finally, only the c parameter, which describes the curve shifting, remains unknown. The aggregates of the AC 11 wearing course are mainly from andesite or basalt because of the high abrasion resistance, and the aggregates of the AC 22 binder and base courses are from limestone; hence, the difference in the c parameter can be explained by the different dielectric characteristics of the aggregates in these asphalt mixes. This fact allows the introduction of a k correction factor, similar to what was carried out for the Finnish research results, and by multiplying the c parameter of the model with this correction factor, the results are better fitted to the drilled sample results. In summary, it can be stated that the model recommended in this paper seems to be better at predicting the air void content compared to previous models, and the parameter set of the model can be determined via proper laboratory tests.
In the following paragraphs, the results of the GPR measurements performed on the asphalt layers of the residential street are presented, and these results and the experiences gained are discussed.
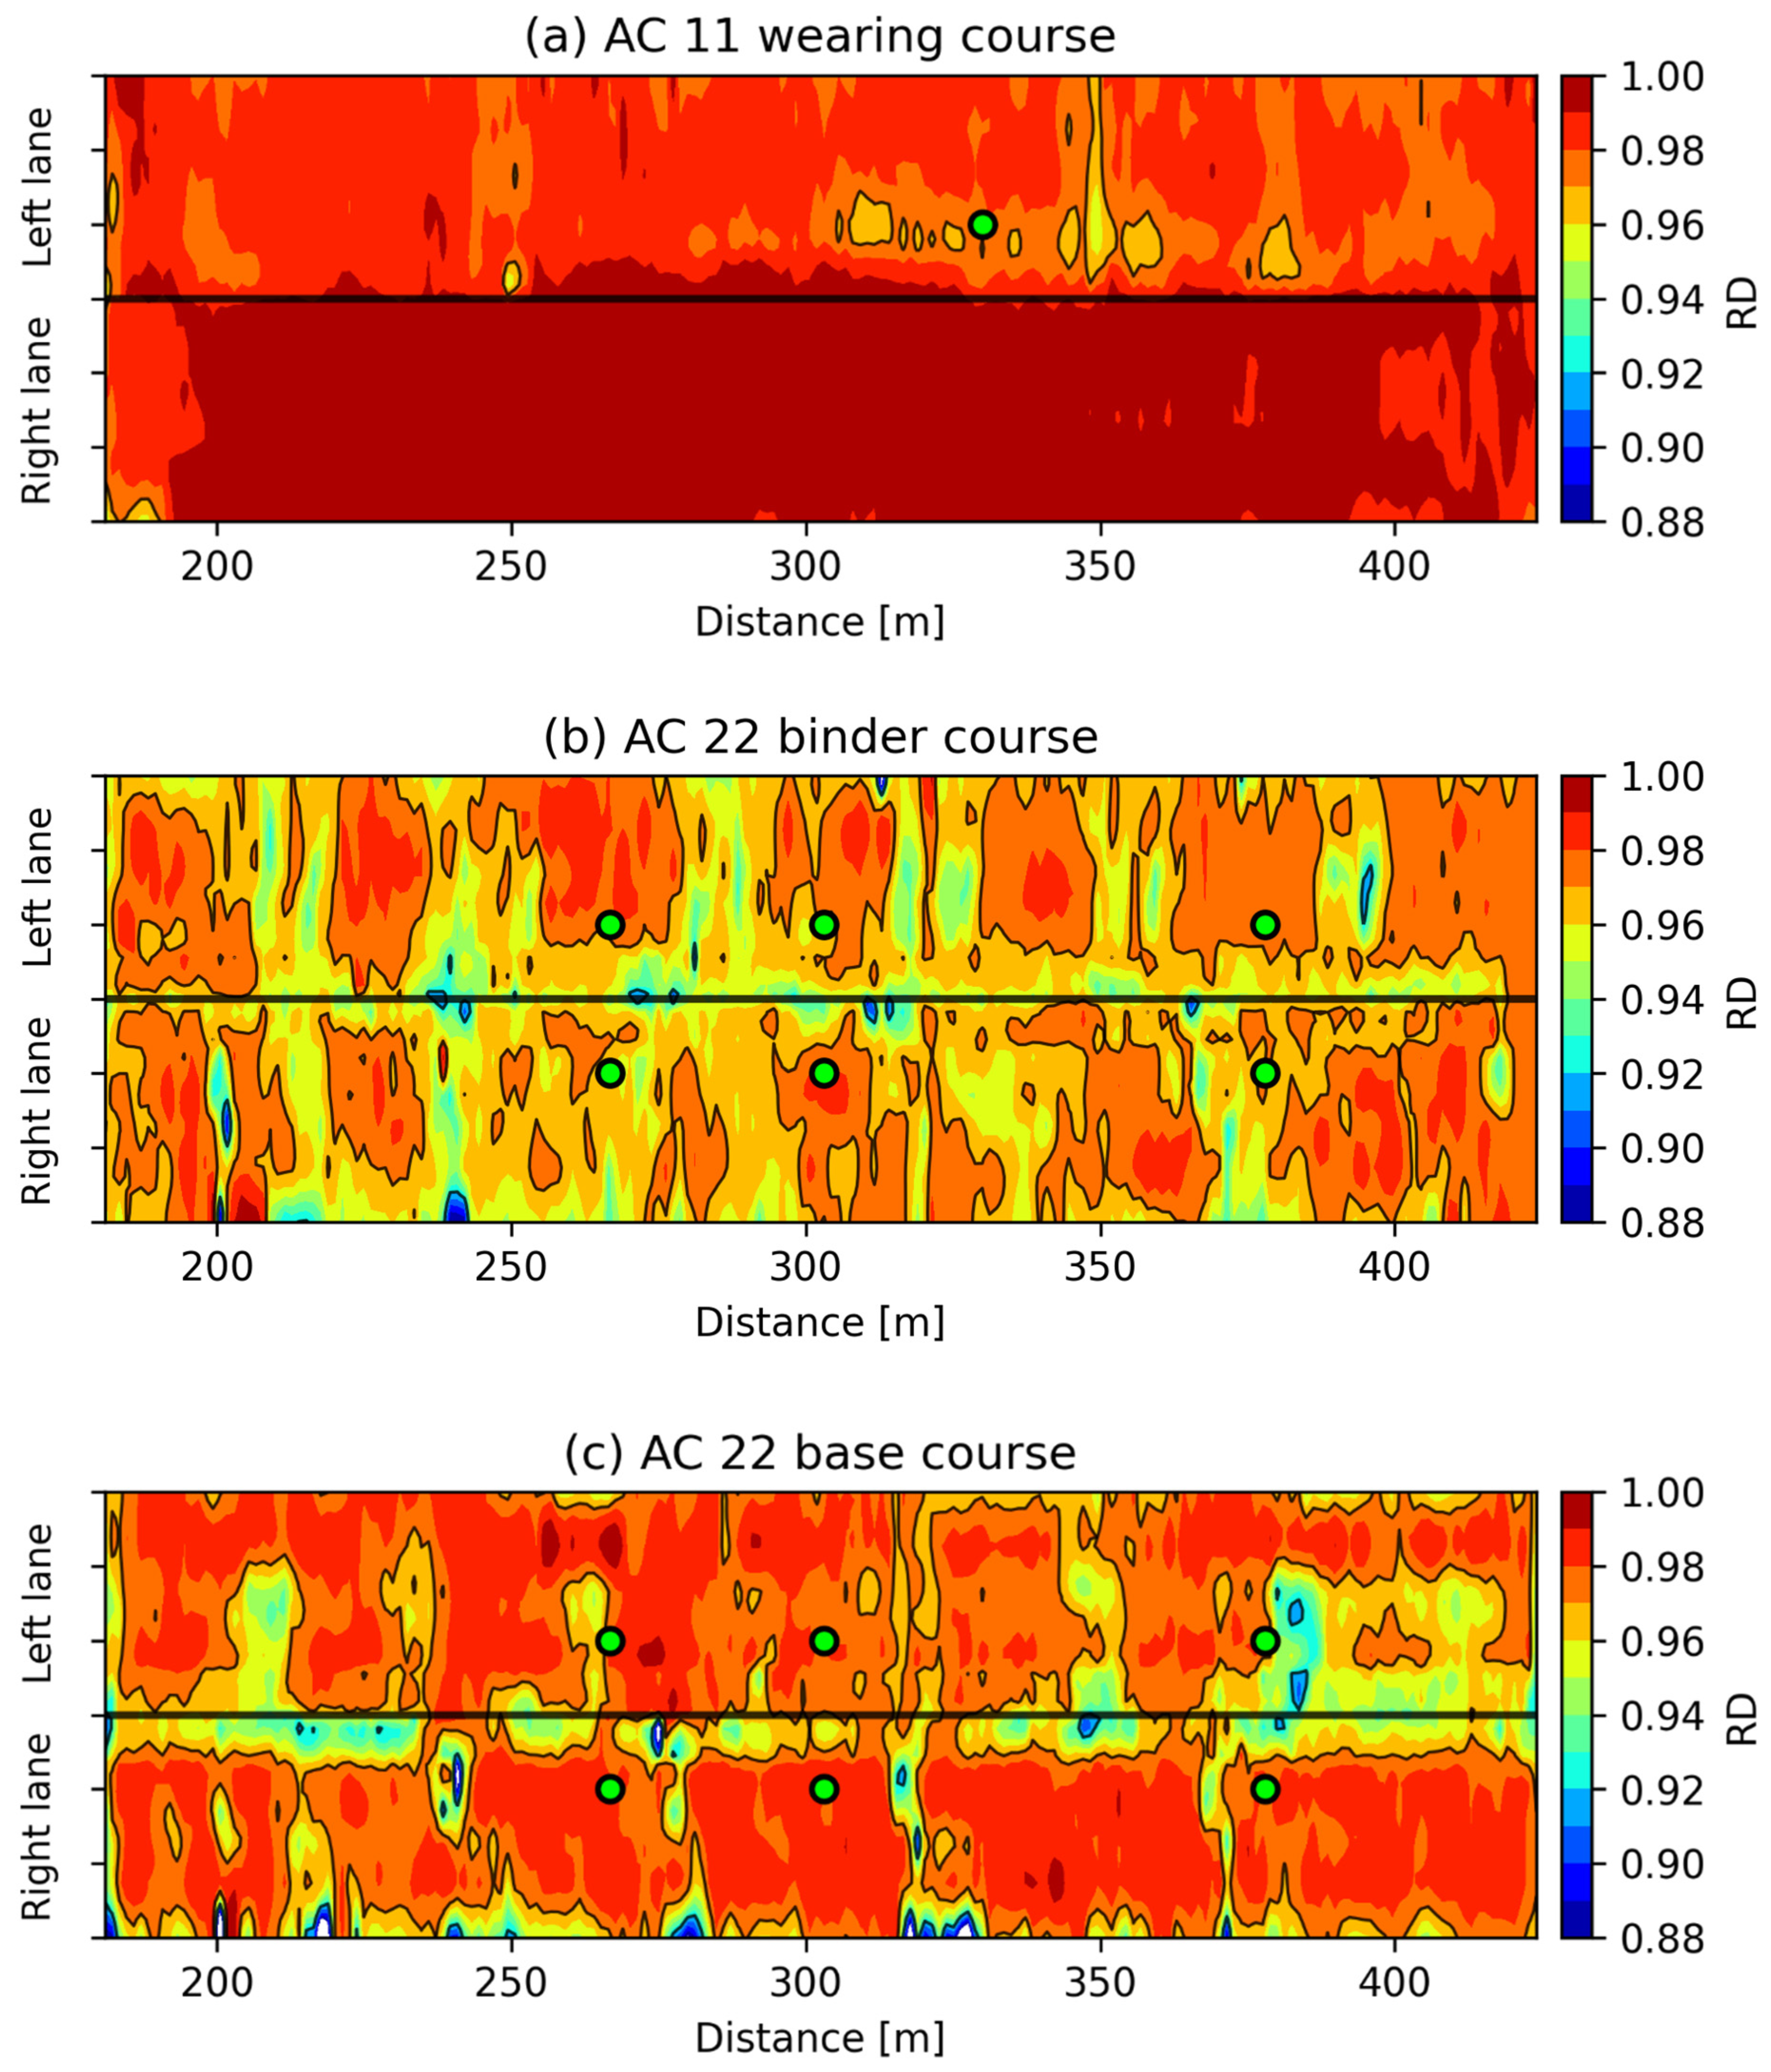
The relative permittivity values exported from the PaveScan device were transformed to air void content values by applying the recommended empirical model, and the RD values were calculated according to Equation (14). The maps of relative compactness were prepared for all three asphalt layers analysed (
Figure 9). The desirable domains with RD values between 0.92 and 0.97 are indicated as black contour curves on these maps. In general, it can be stated that a greater proportion of the areas of the analysed layers shows a relative compactness above 0.97, meaning that the air void content at these areas remains below 3%.
In the case of the wearing course, the maps of relative compactness are significantly different for the left and right traffic lanes (
Figure 9a). The right traffic lane seems to be almost totally homogeneous, with its compactness reaching 100%. Since this is physically impossible, another explanation was sought and identified. Unfortunately, right before the in situ measurements, the contractors sprayed water onto the freshly paved wearing course to accelerate the cooling time. After the watering, the pavement surface became very wet; therefore, the measurements could not be performed immediately after construction. Consequently, the PaveScan testing was shifted to the next day but because of the rather low daily temperature, the influence of moisture on relative permittivity still had to be assumed. Since the PaveScan device uses the SR method, the measured relative permittivity results were distorted by the thin wet layer on the pavement surface. The reason behind this is that the SR method considers only the amplitude of electromagnetic signals reflected from the surface; therefore, it is sensitive to local problems of inhomogeneities. The only cored asphalt sample was obtained from the left traffic lane, which presumably still bears some sampling error, thereby affecting its measured in situ relative permittivity.
By analysing the RD map of the AC 22 binder course, it can be observed that on both the right and left lanes, the relative compactness is highest at the middle of the lane, and the values gradually decrease when moving towards the road axis (
Figure 9b). The lowest values of compactness were detected at the road axis and at the pavement edges. By analysing the relative compactness map of the AC 22 base course, it can be observed that on the right lane, the asphalt compactness is highest at the middle of the lane, and these values gradually decrease when moving towards the shoulder (
Figure 9c). On the contrary, on the left lane, the asphalt compactness is more or less homogeneous until the 0+370 chainage, and from that point onwards, a significant decrease in RD can be observed in the vicinity of the road axis.
The three presented relative compactness maps demonstrate that the relative compactness of built-in asphalt materials is not uniform on the whole road surface, as any construction problem appears immediately as a decrease in quality. Consequently, it is normal that the compactness of an asphalt layer is highest at the middle of the lane, and the relative compactness values gradually decrease when moving towards the road axis. By comparing the relative compactness maps of the asphalt base and binder courses, it can also be observed that the measured relative compactness values are higher for the base course, meaning that the base course was better compacted than the binder course. On the experimental road section, the air void content of all 13 drilled core samples characteristically varied between 2% and 5%, and these values did not predict any parts of the road with a lower quality. This fact underlines that the greatest advantage of the GPR technology is its large data coverage. Moreover, maps and profiles of relative permittivity, bulk density, and air void content can be prepared quickly and in a relatively accurate way. Such maps are ideal for determining road sections or areas where the compaction is weaker or better, and by analysing drilled core samples obtained from these places, their quality can be verified.
5. Conclusions
The experiences gained from the analysis of the 240 m length experimental section of a residential street in southern Hungary show that it is useful to perform GPR measurements after the laydown and compaction of each layer on the surface of the road. This procedure may require more measurements, but these additional measurements provide the opportunity to determine the relative compactness or the air void content of each layer separately.
In our study, PaveScan was used to determine the relative permittivity of asphalt layers quickly and quantitatively. A strong correlation was found between relative permittivity and the air void content of the asphalt mixtures, similar to previous studies. In this article, a novel empirical model is suggested for this task. Our new logistic model is less sensitive to the limitation of fewer calibration data points being available than other models in the literature. This offers the opportunity to adapt the laboratory-parameterised model to the actual conditions based on a few field core samples. Based on systematic data acquisition, an empirical model can be developed to estimate the air void content values at a ±0.5% accuracy. For this purpose, either drilled samples or gyratory specimens obtained from the asphalt mixtures being tested can be successfully used. In the present work, the latter method was chosen for the non-destructive road condition assessment. The air void content computed based on the recommended empirical model can be used to derive a relative compactness (RD) map, which highlights the problematic parts of asphalt layers. Maps of the relative compactness values measured after the first roller pass provide a good comparison basis for assessments that are performed later. The compaction data produced are not of better quality than those determined from drilled core samples but the large amount of data obtained still makes them more useful.
In summary, it can be stated that among existing non-destructive road diagnostic methods, only the GPR technology and the Intelligent Compaction (IC) technology are able to provide continuous determination of the quantitative compactness of asphalt mixtures. Moreover, the GPR technology is suitable for the determination of layer thicknesses in road pavement structures as well. Therefore, it can be recommended for quality control of construction work. In future research, the combination of GPR and UAVs as non-destructive devices should be investigated, specifically for the quality control of asphalt compaction work and the hot asphalt mix behind the compaction roller during pavement construction.


 ,
, 


