Evaluation Method for Virtual Museum Interface Integrating Layout Aesthetics and Visual Cognitive Characteristics Based on Improved Gray H-Convex Correlation Model
Abstract
1. Introduction
2. Theoretical Background
2.1. Interface Layout Aesthetics
2.2. Visual Cognition
2.3. Research Motivation and Methodology
- (1)
- Gray H-convex correlation
- (2)
- ICRITIC
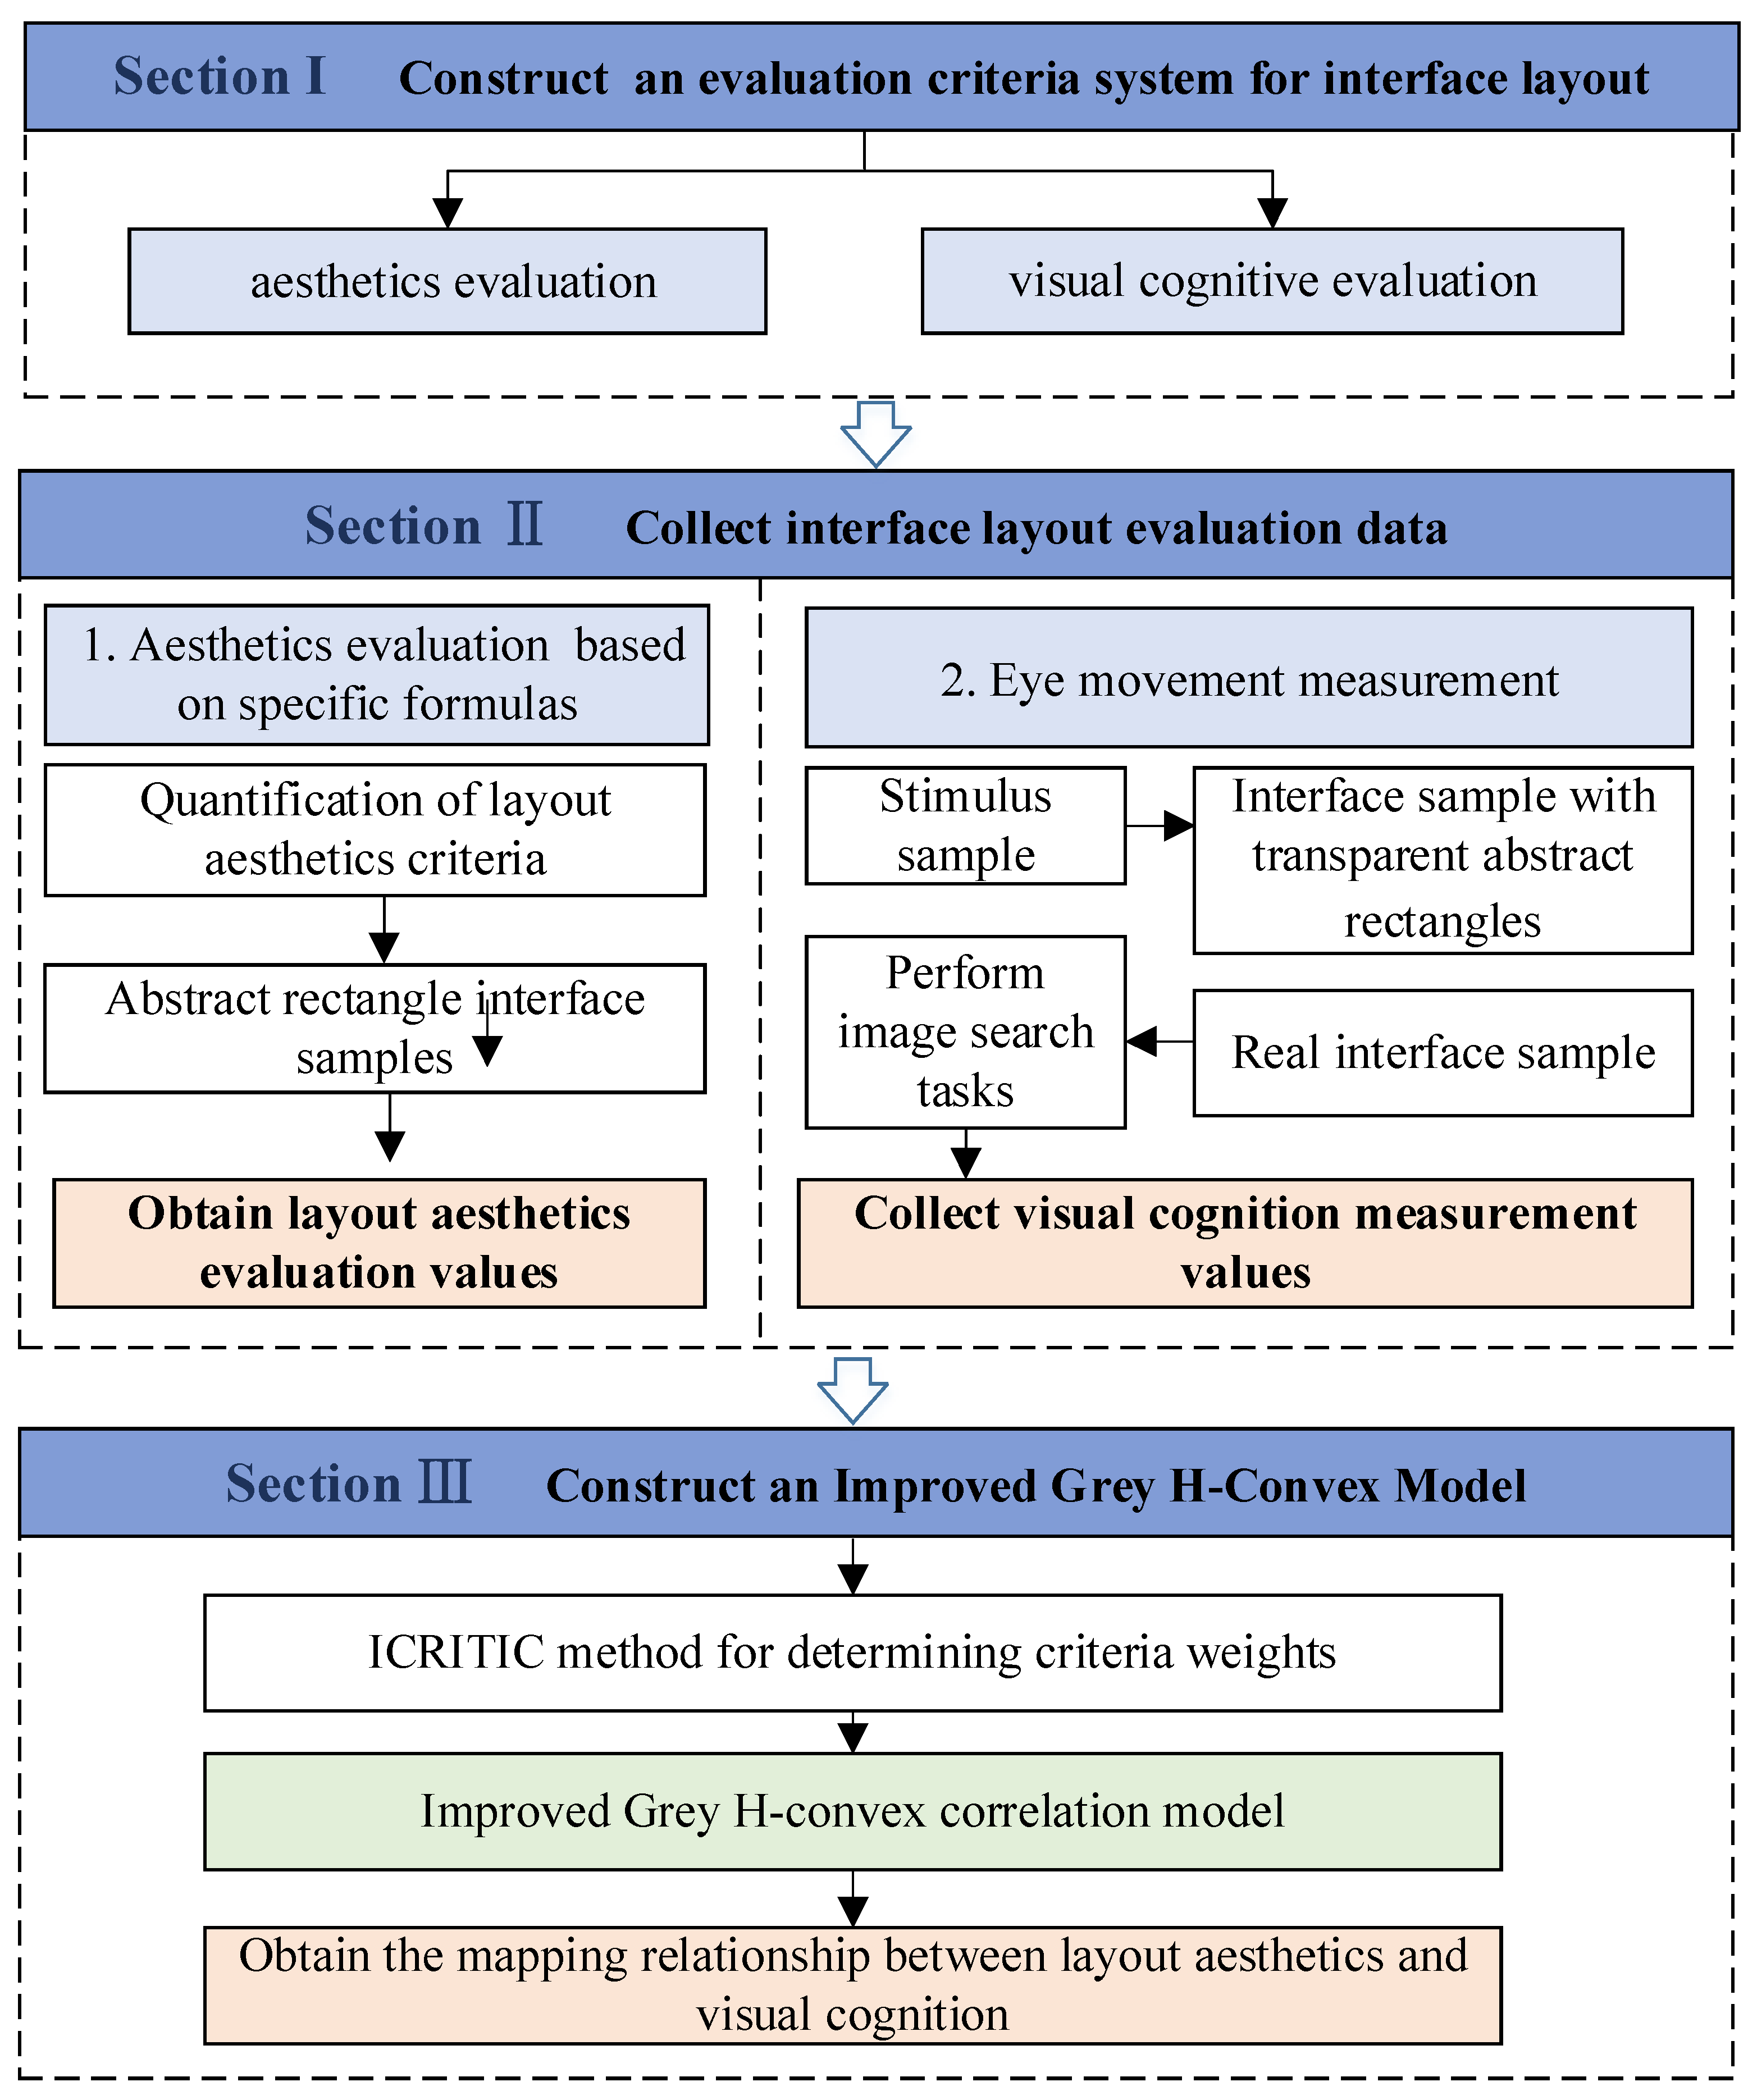
2.4. Thesis Framework
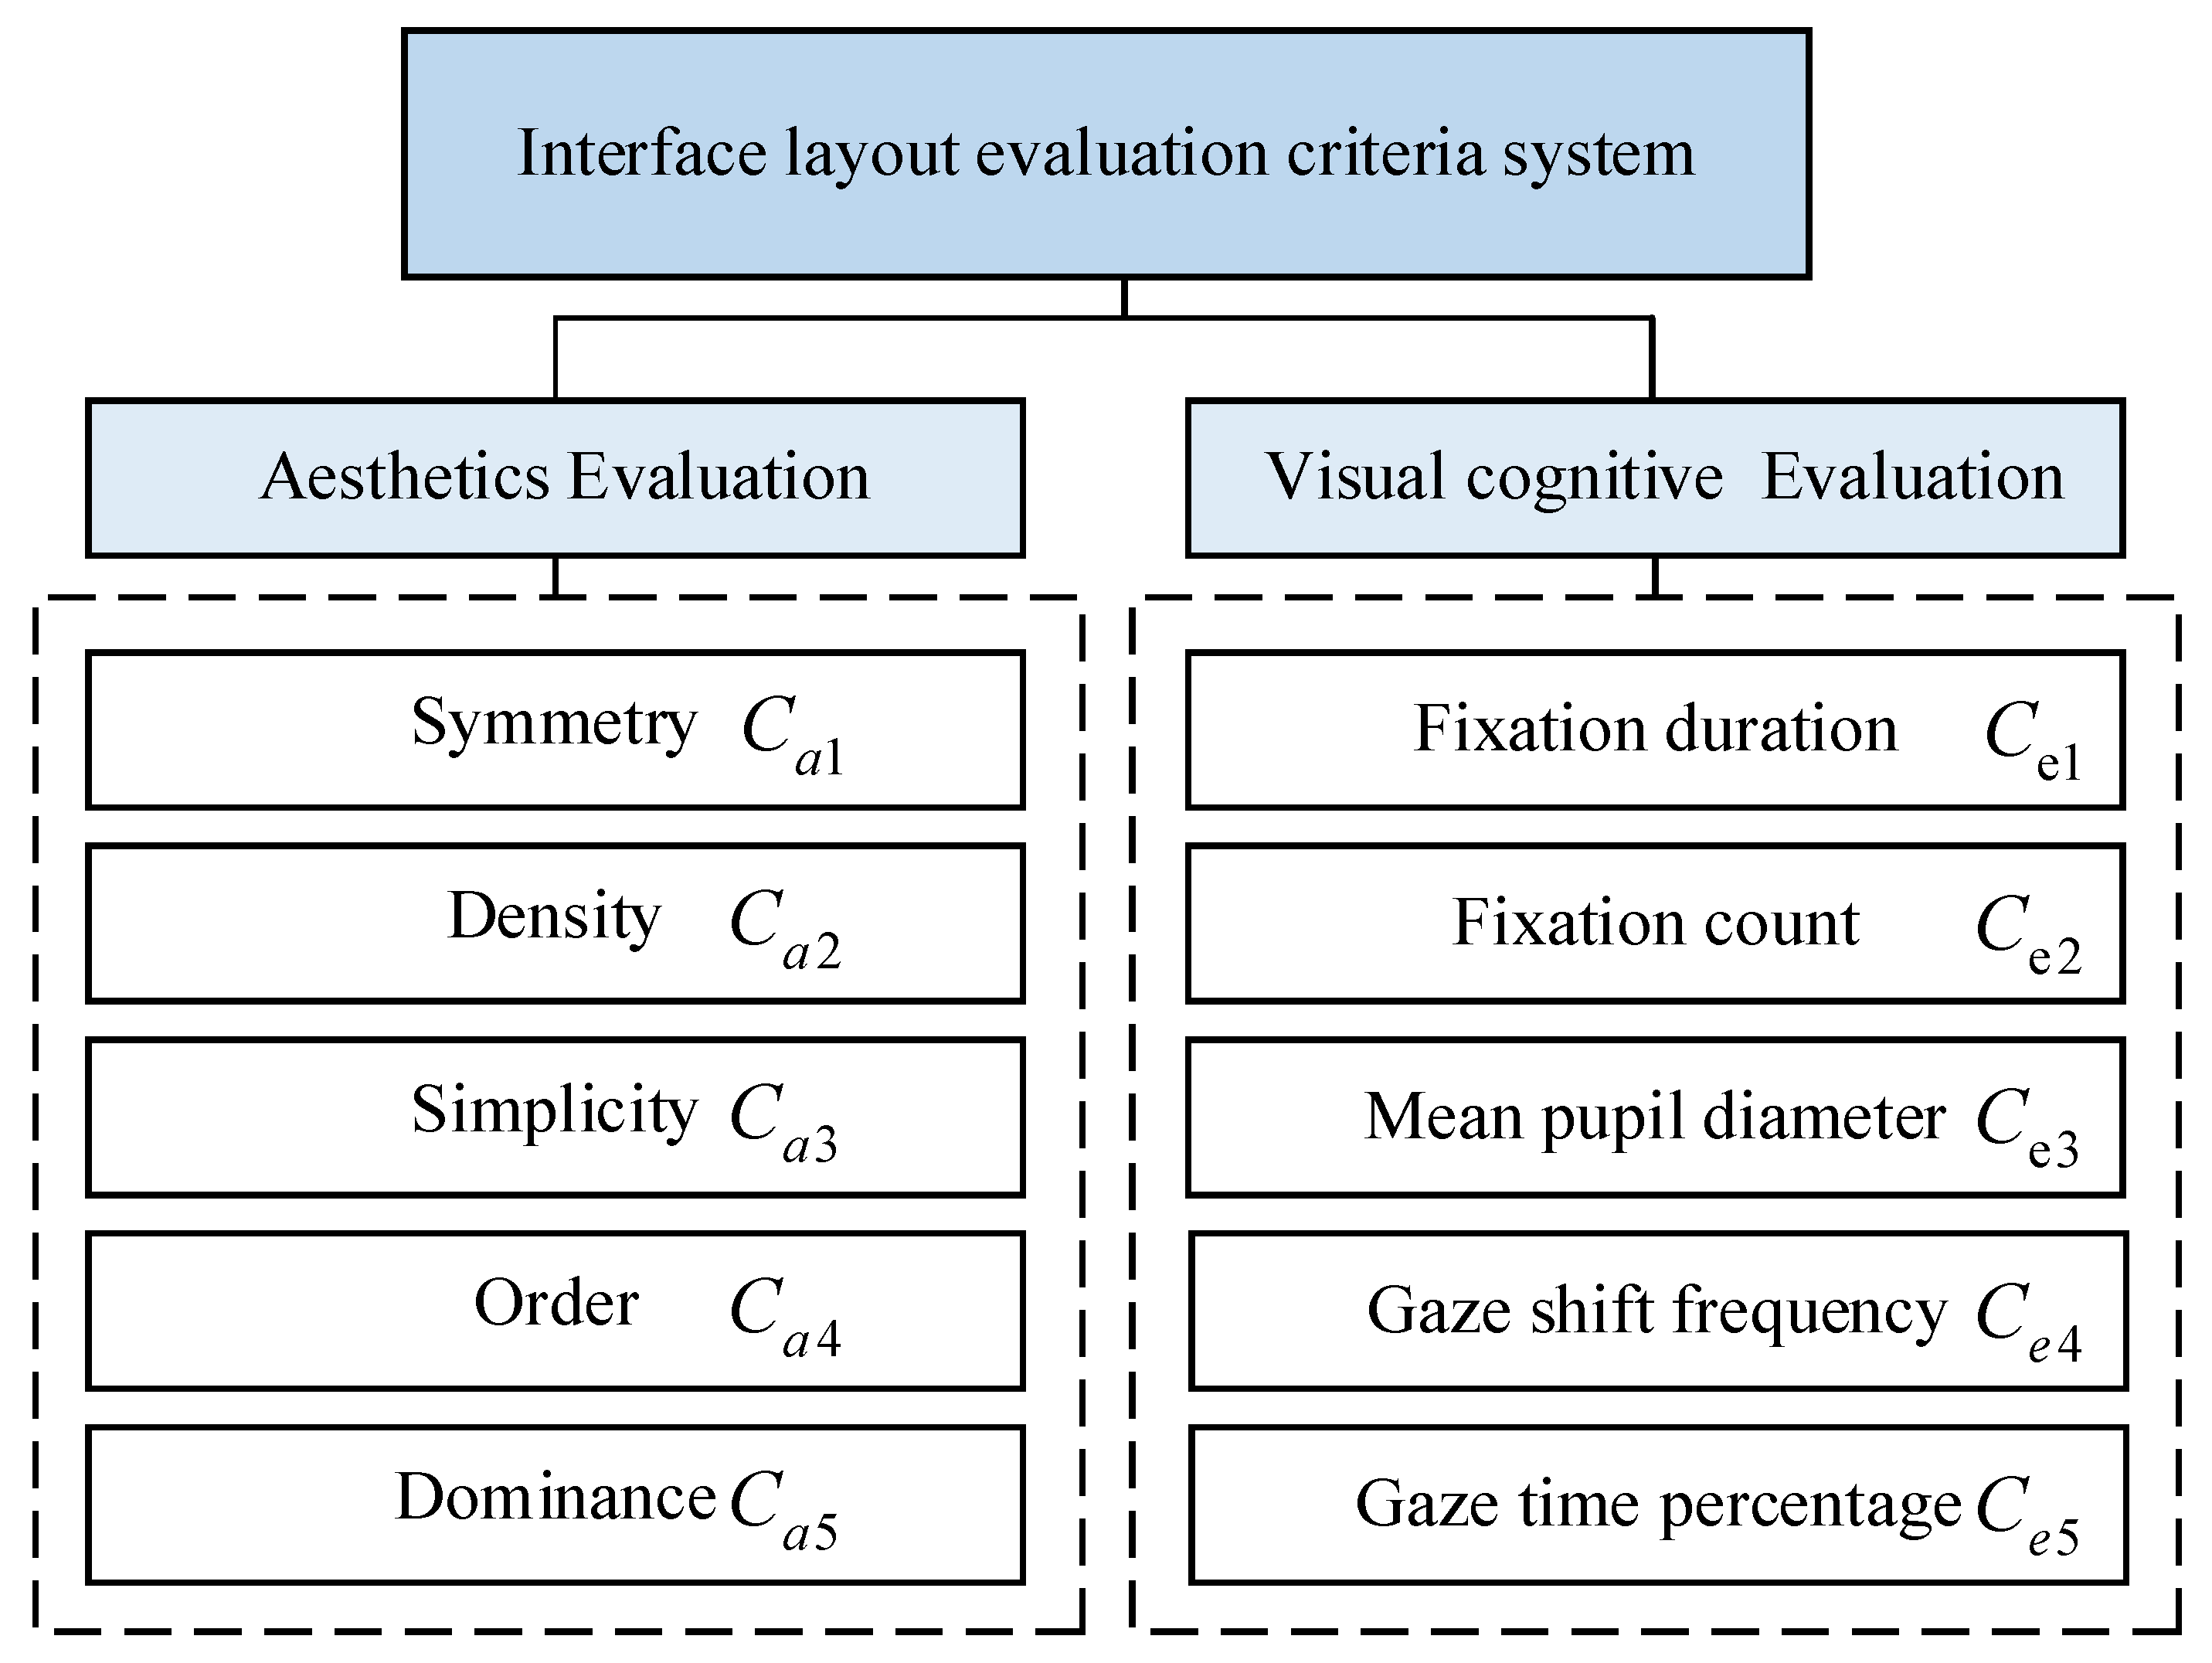
3. Interface Layout Evaluation Criteria System
4. Model Construction
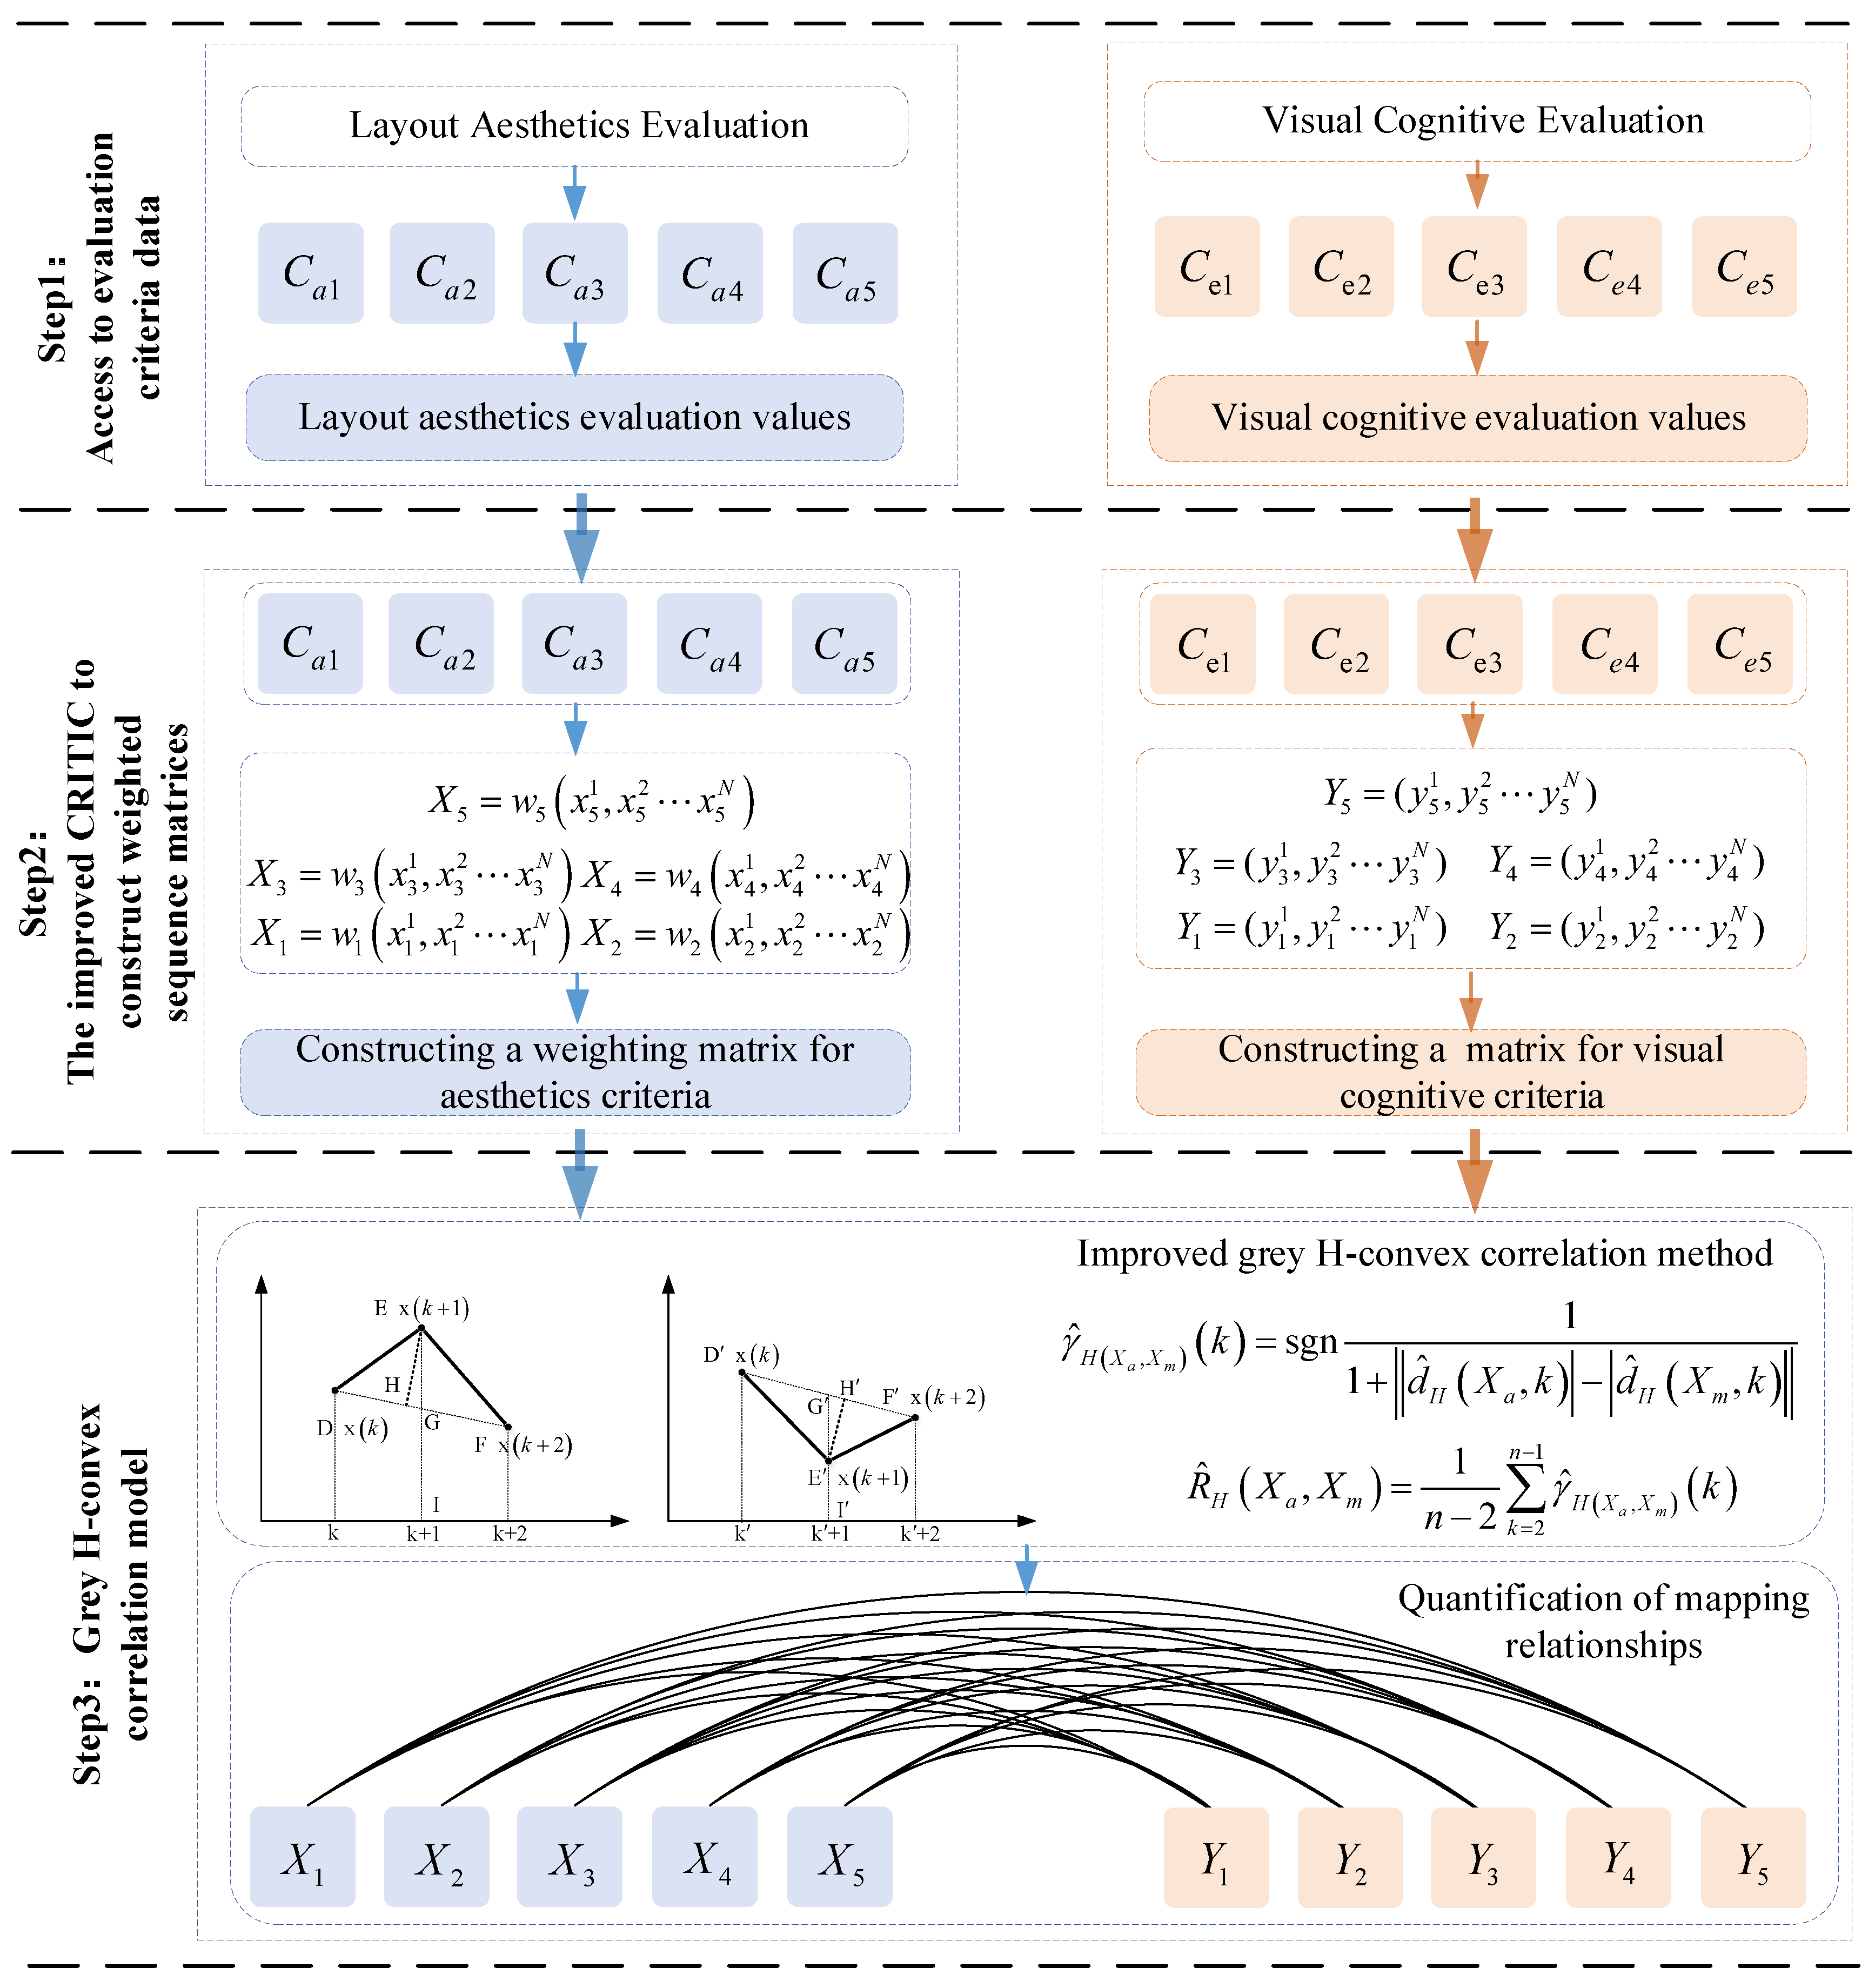
4.1. Modeling Framework
- (1)
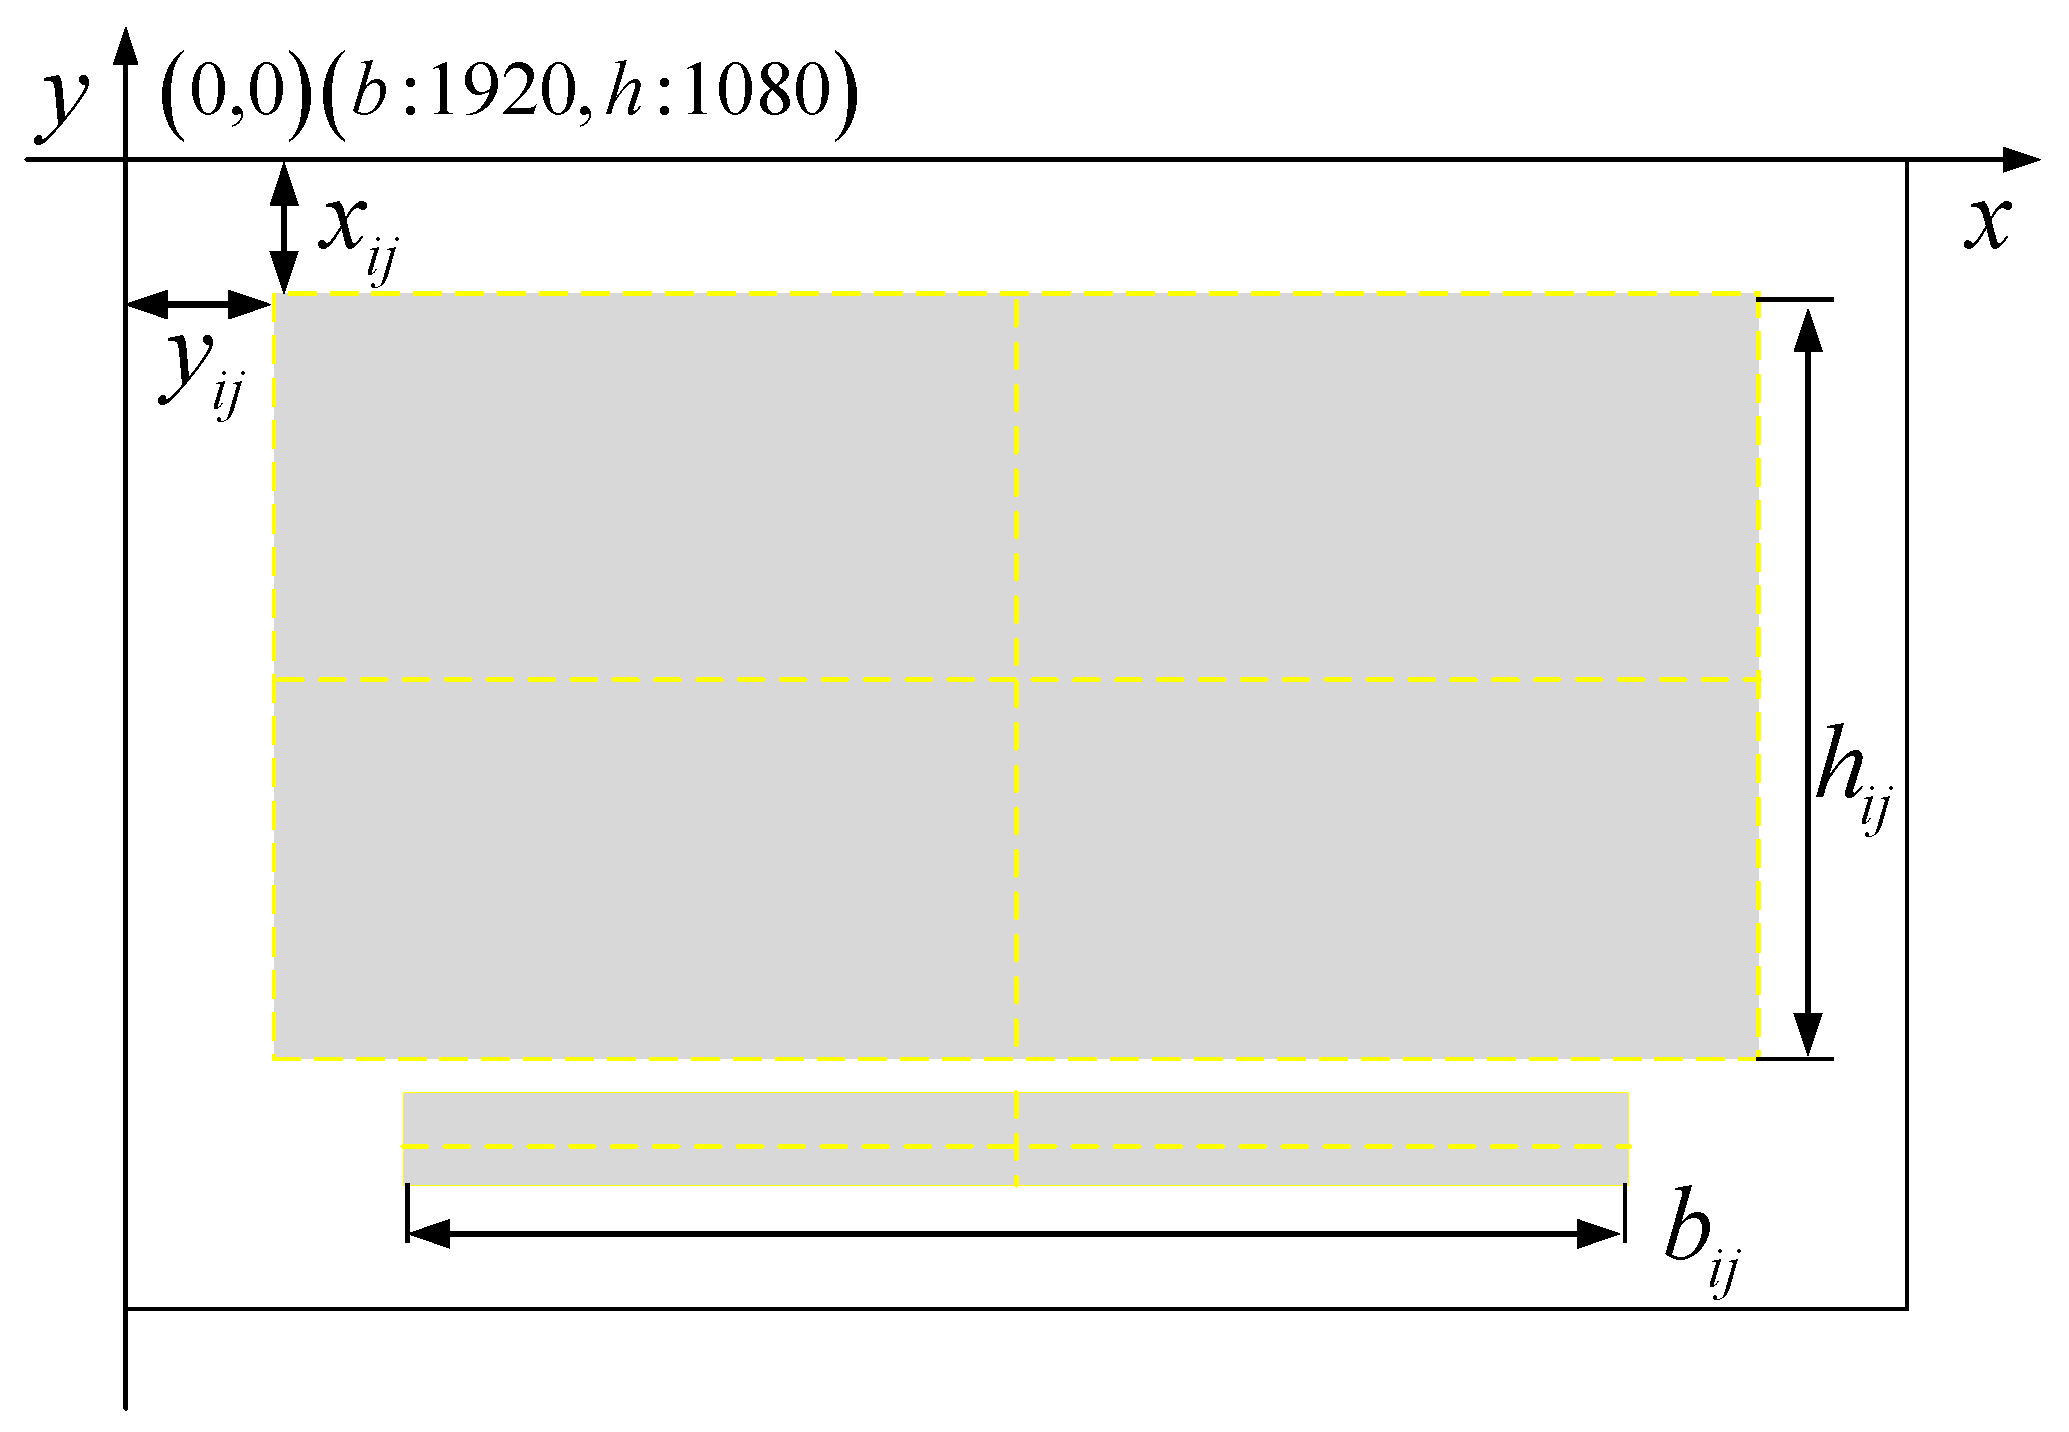
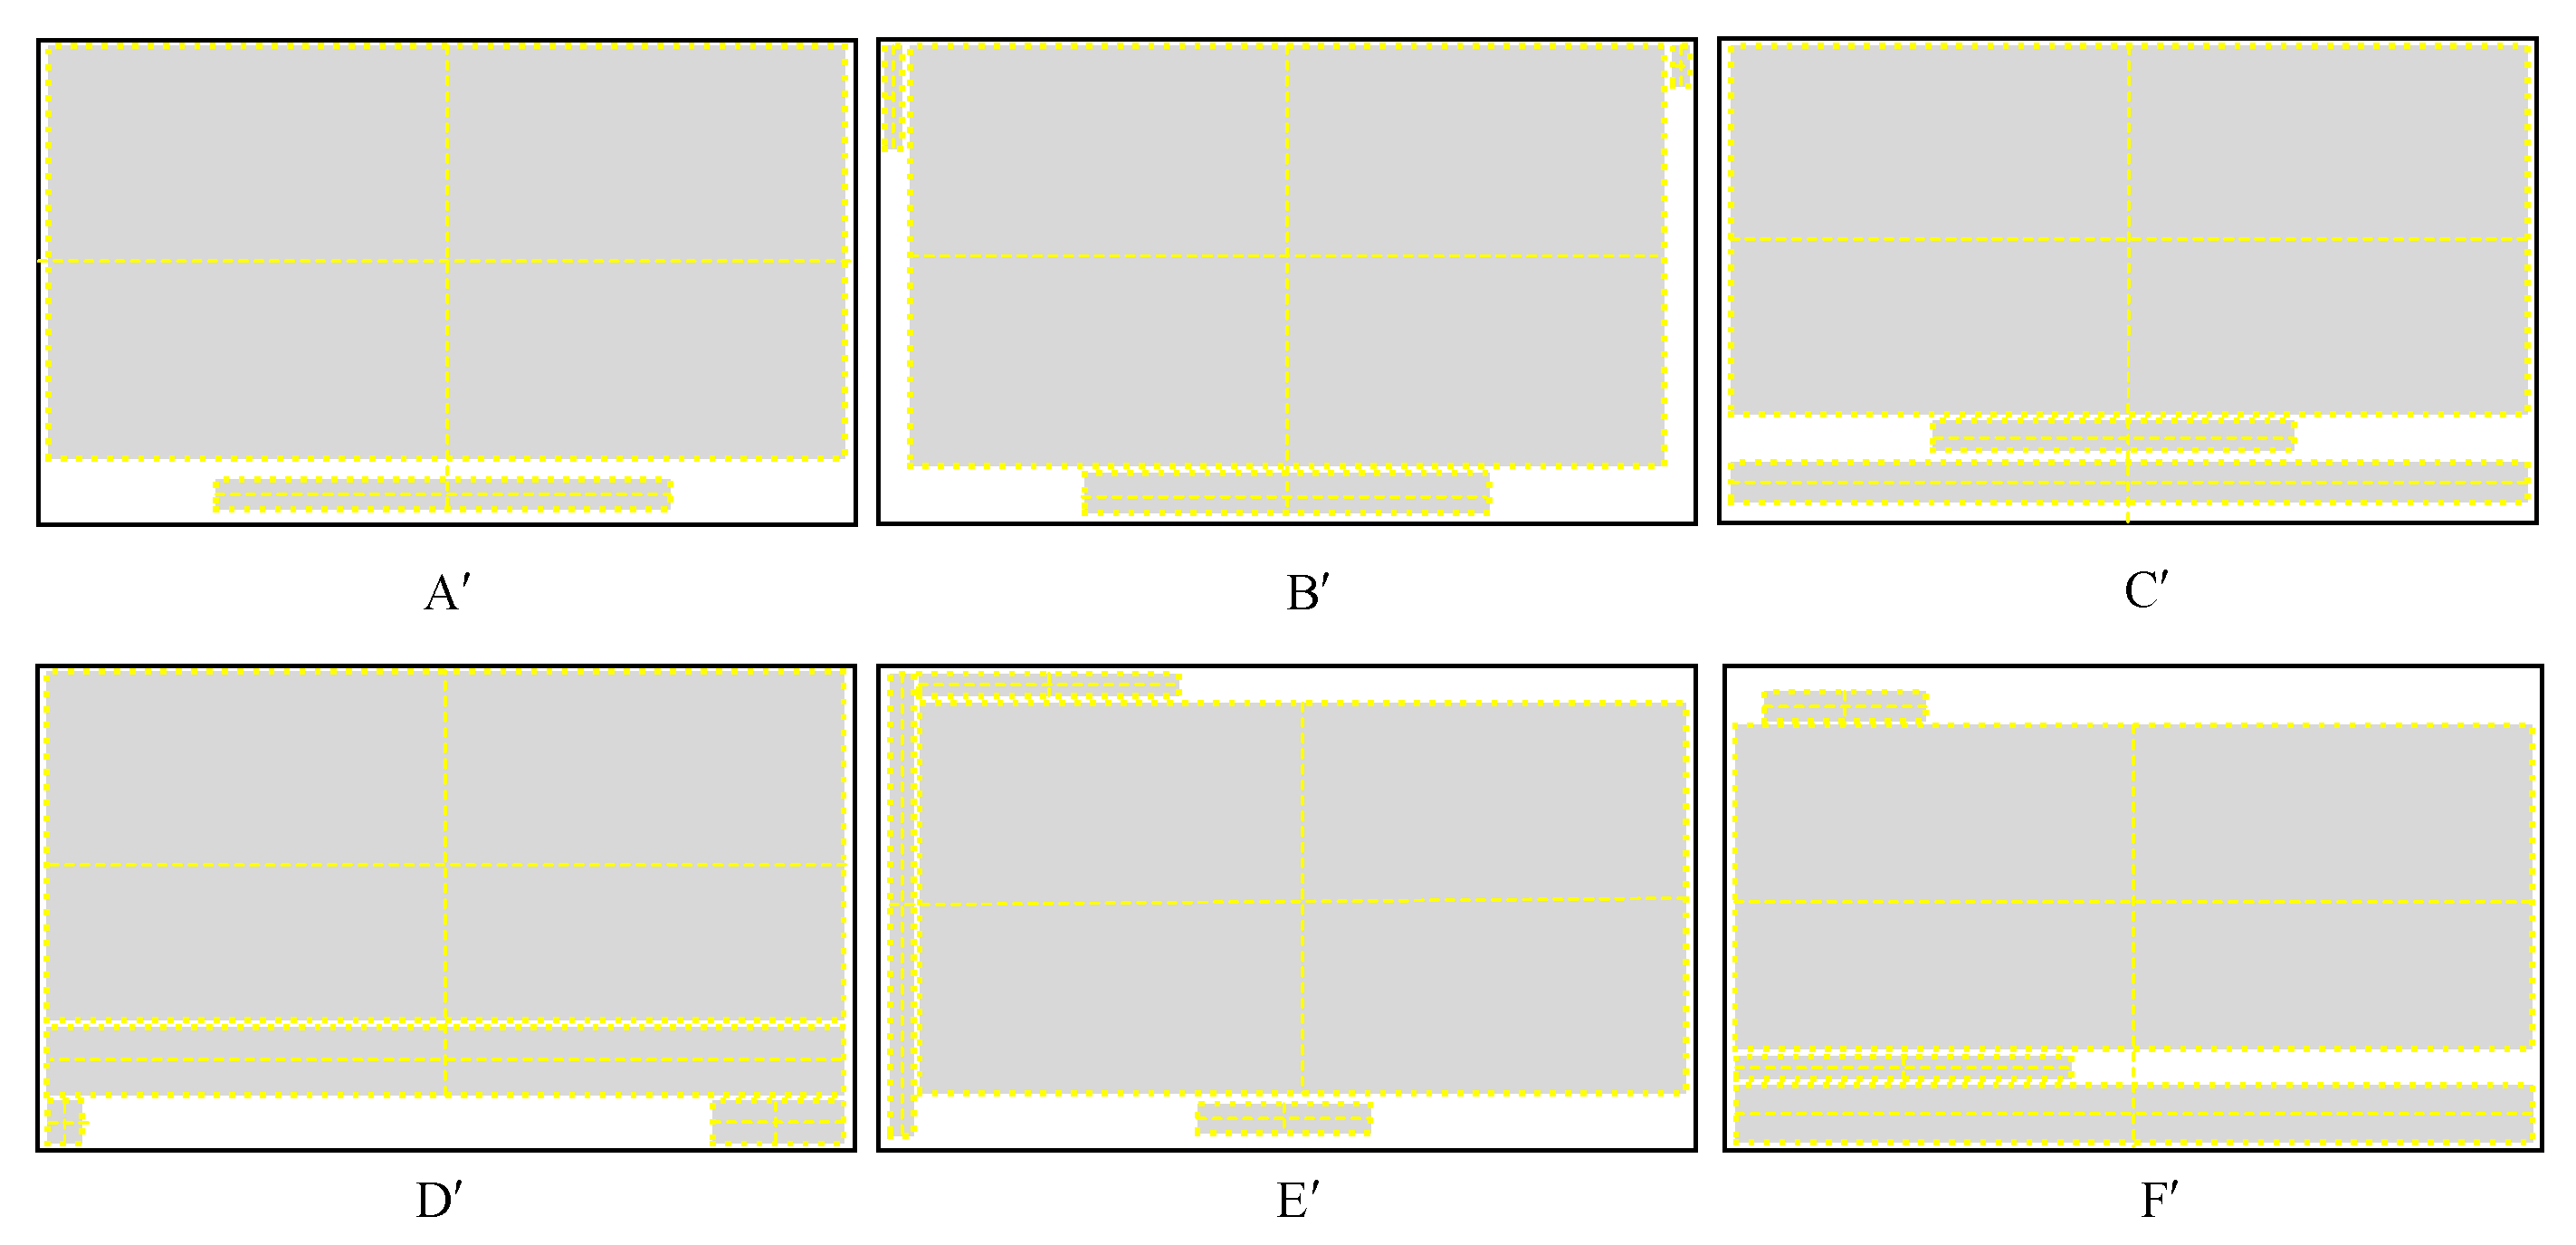
- Obtaining criteria data. Firstly, we computed aesthetic assessment values by amalgamating objective formulae with abstract rectangular samples [26]. Secondly, physiological measurements of visual cognition were acquired utilizing eye-tracking technology to collect pertinent eye movement indicator data. Let the set of aesthetic evaluation criteria be , and the set of eye movement criteria is .
- (2)
- Constructing a weighted indicator sequence matrix based on the ICRITIC. Utilizing the ICRITIC method for weight assignment to criteria, a weighted criteria sequence matrix is constructed, where denotes the data sequence of the first eye movement indicator under samples, , , , and so on and denotes the data sequence of the first aesthetic indicator under samples, , , , and so on.
- (3)
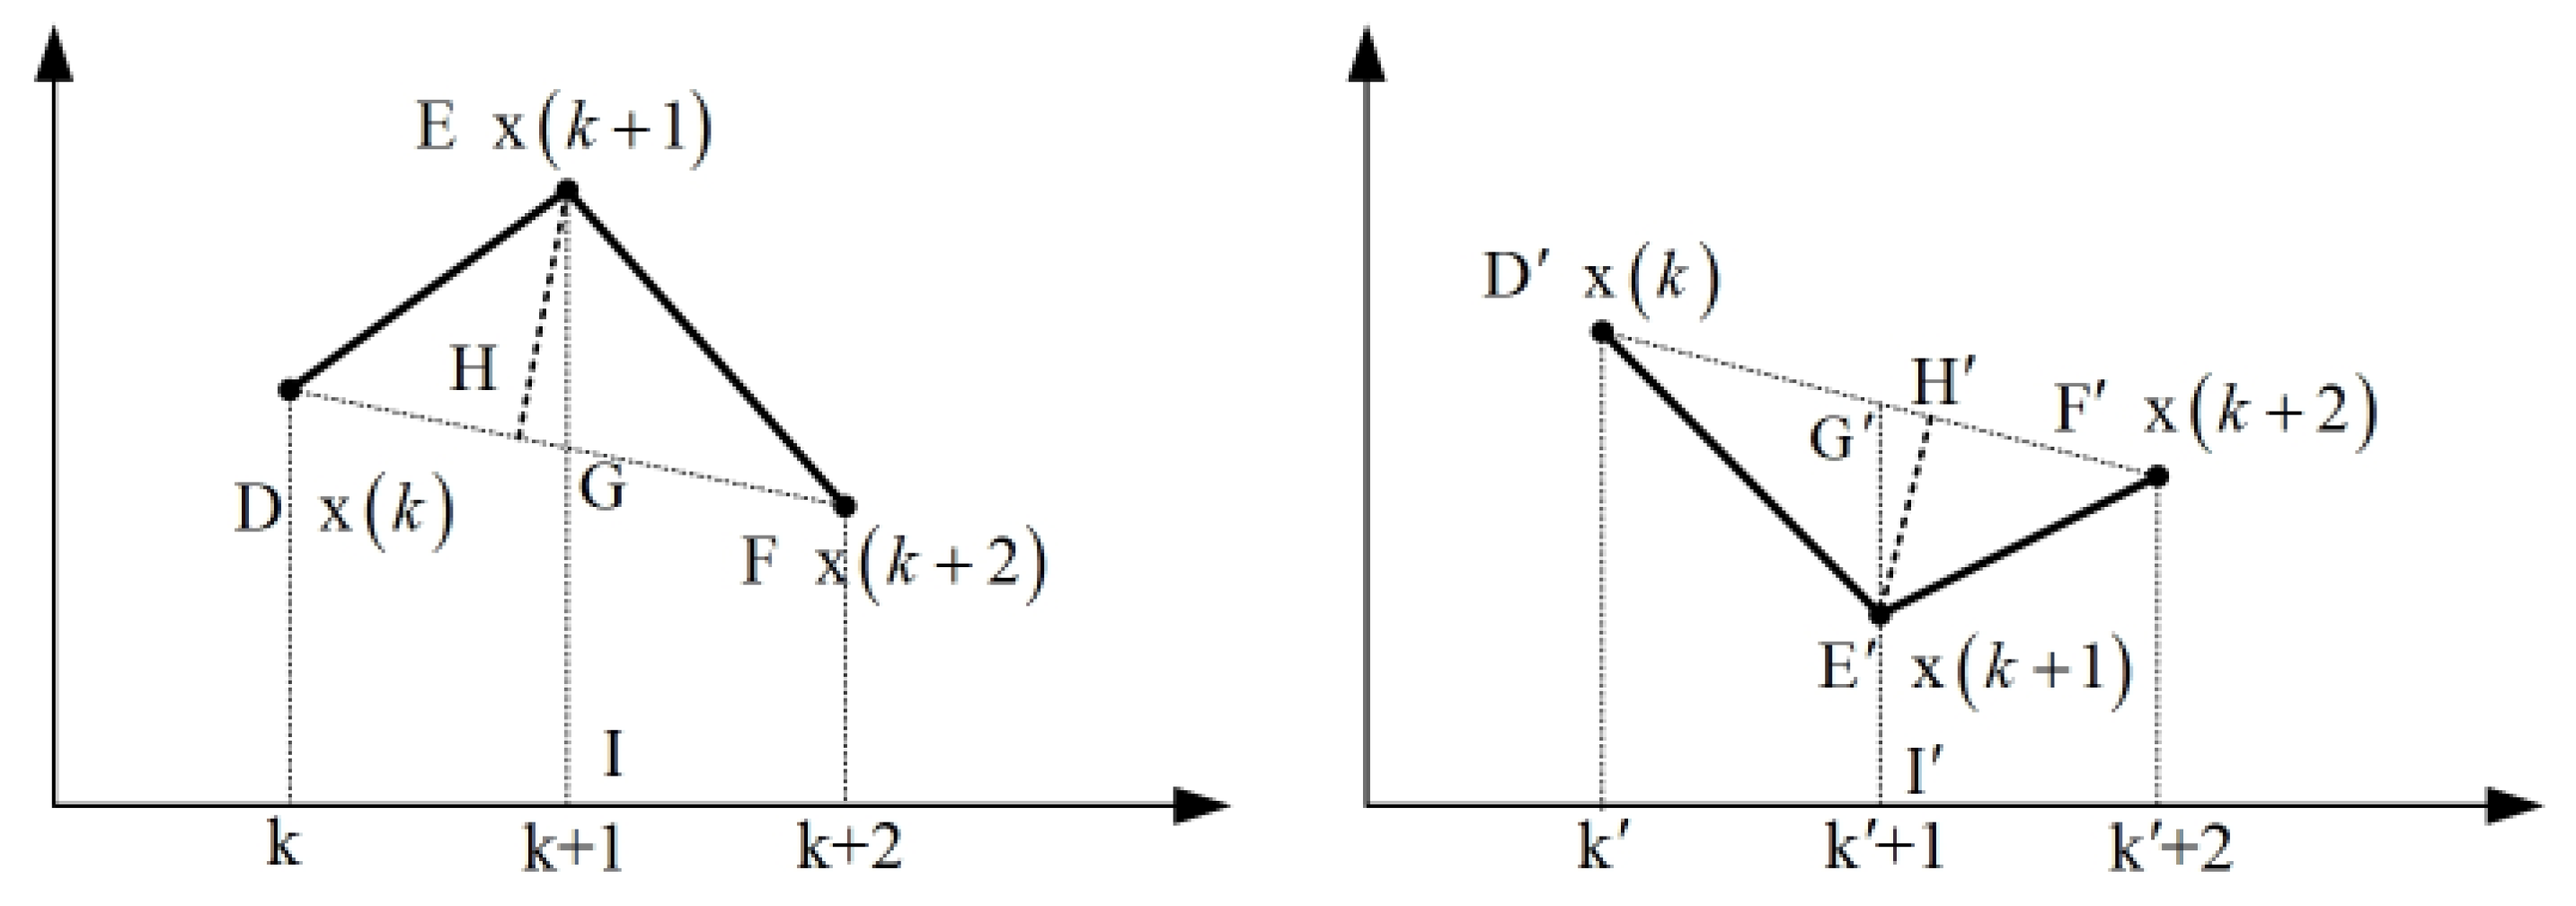
- Gray H-convex correlation model. Optimizing the gray H-convex correlation model based on weighted indicator sequence matrices. Using the visual cognitive criteria sequence as the reference sequence, i.e., , and using the layout aesthetic criteria sequence as the comparison sequence, i.e., . The mapping relationship between layout aesthetics and visual cognitive features is clarified by calculating the correlation between the indicator data sequence curves, where is denoted as the gray H-convexity coefficients of and at , an is denoted as the gray H-convex correlation degree between sequences and . The meaning of the symbols in the diagrams is detailed in Section 4.2.3 and will not be repeated here.
4.2. Layout Aesthetics and Visual Cognitive Mapping Model
4.2.1. Collecting Data
Layout Aesthetic Evaluation Value
- (1)
- Symmetry
- (2)
- Density
- (3)
- Simplicity
- (4)
- Order
- (5)
- Dominance
Visual Cognitive Measurement Values
- (1)
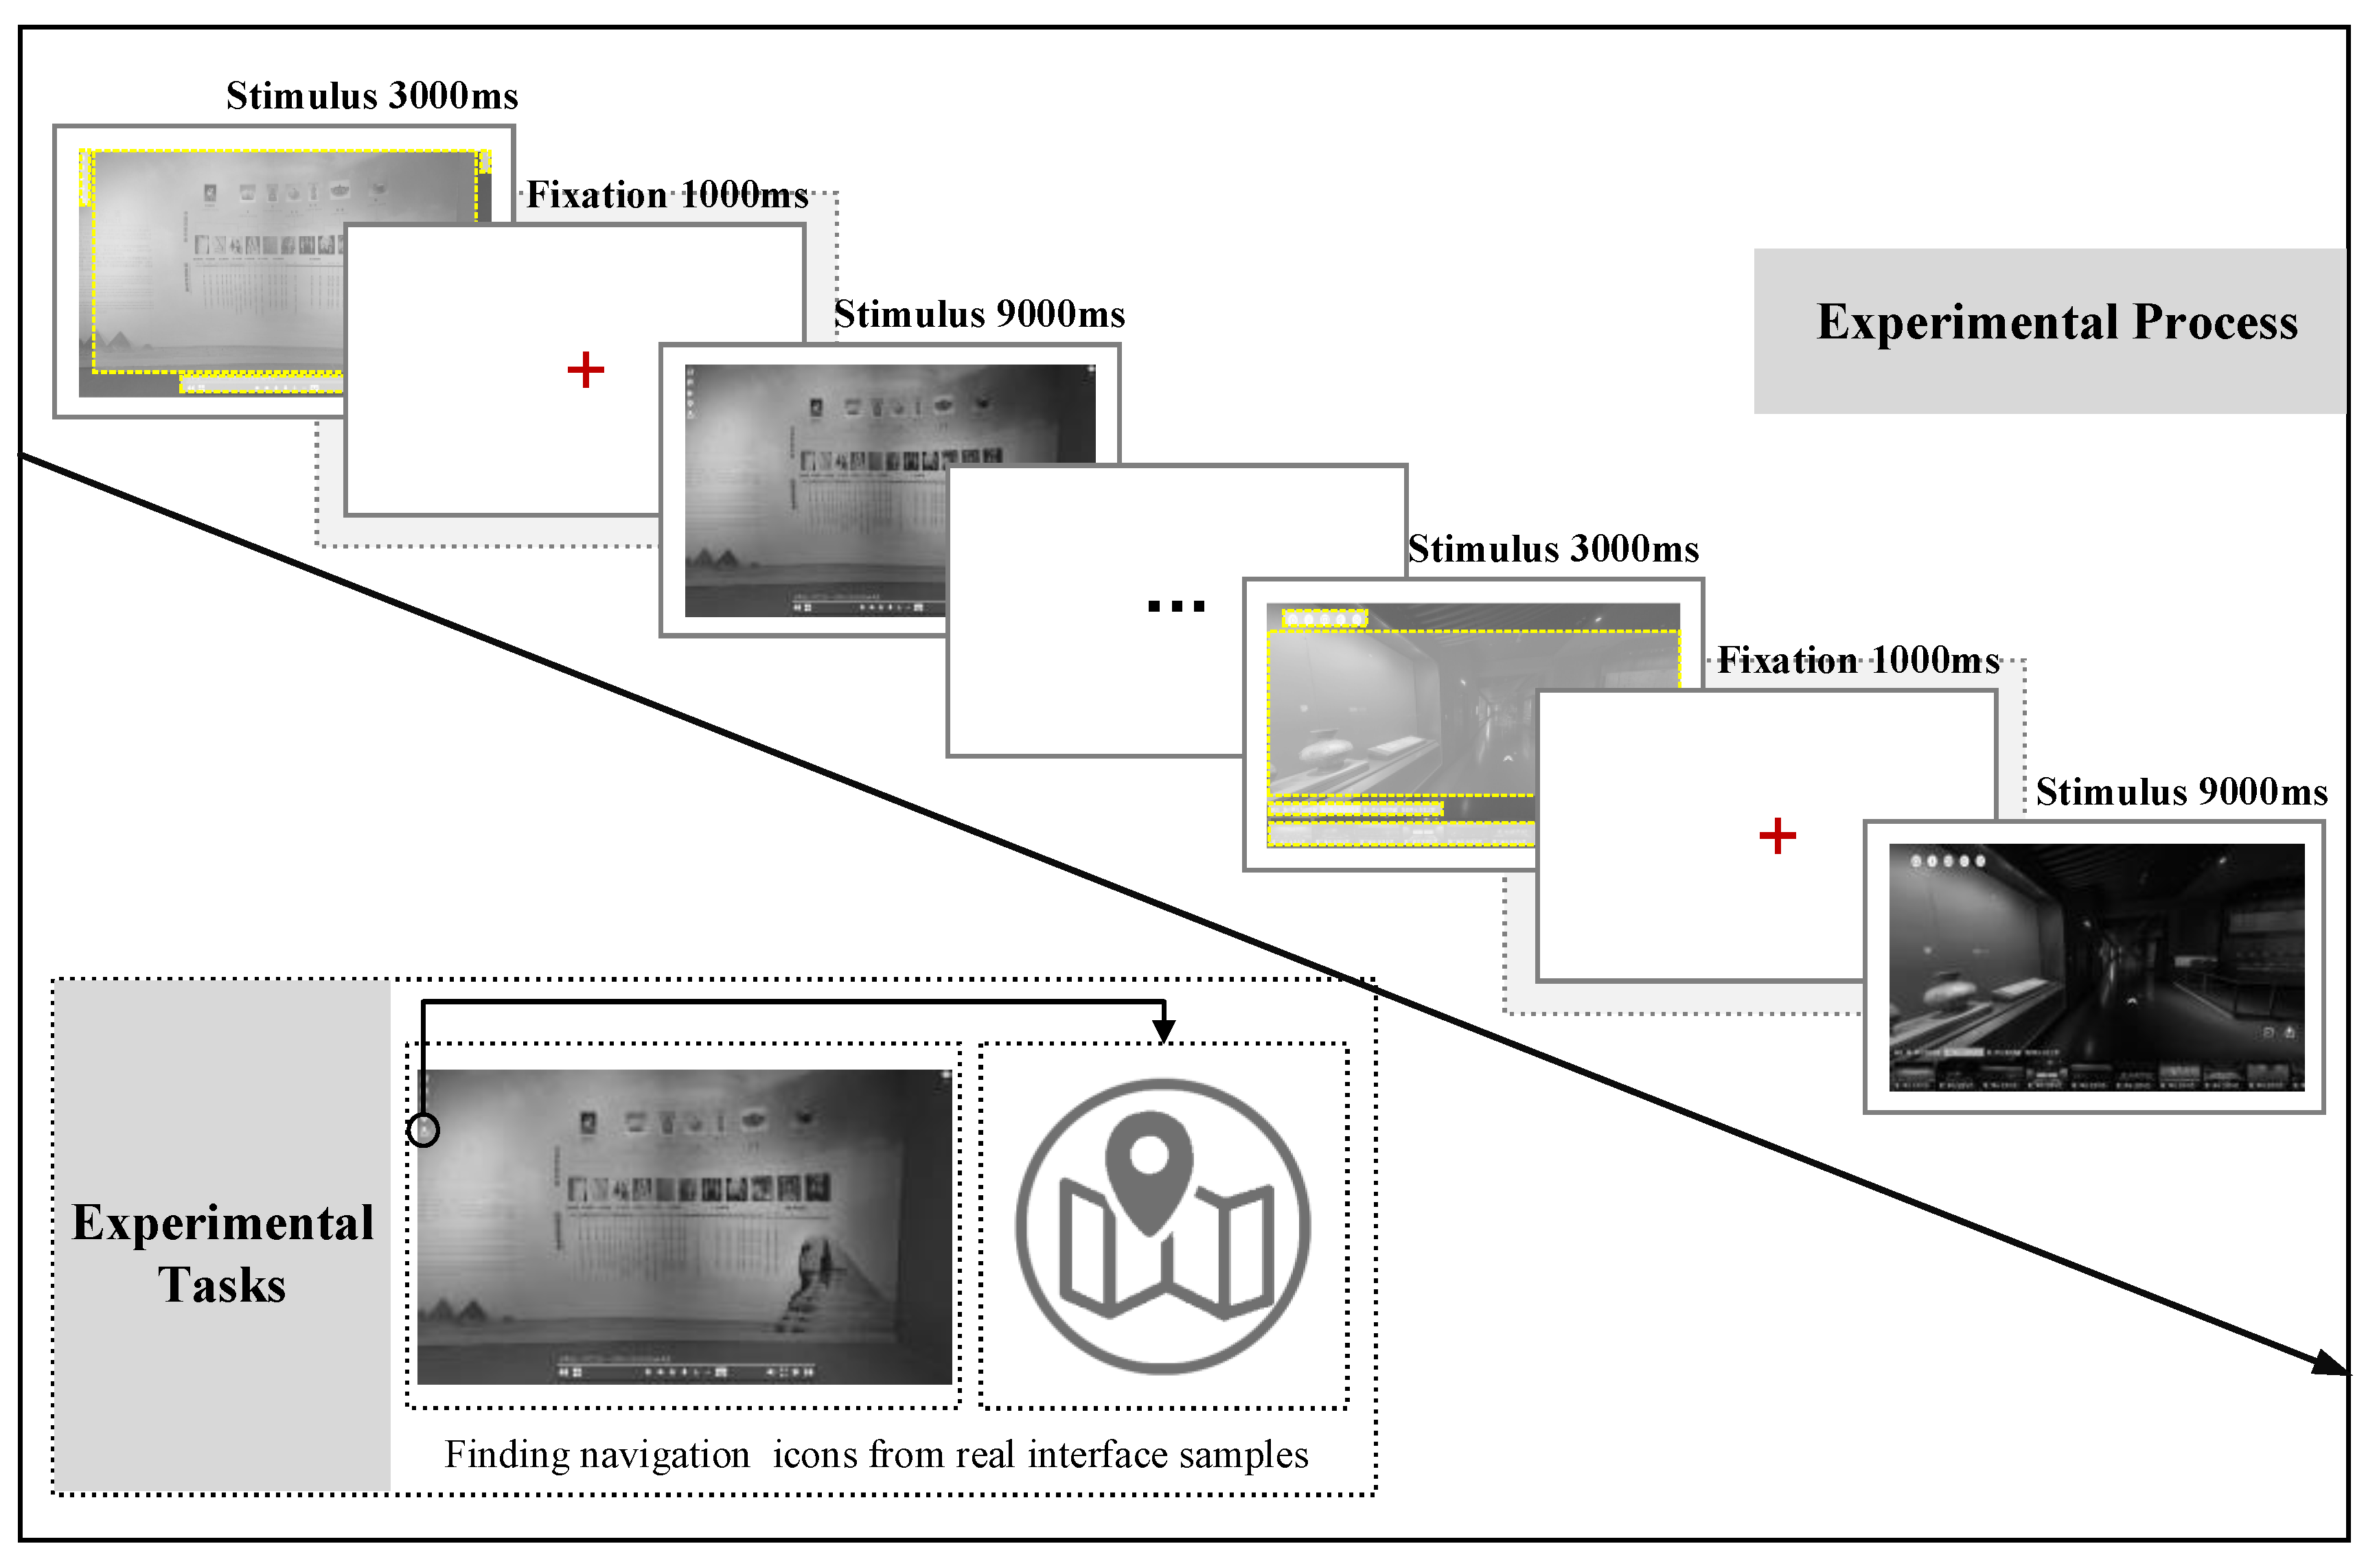
- Experimental Equipment: The Tobii X120 eye tracker (Tobii, Danderyd Municipality, Sweden) (with a sampling frequency of 120 Hz and an accuracy of approximately 0.4°) and a 23.8-inch Dell desktop presentation monitor (Dell, Round Rock, TX, USA) (with a resolution of 1920 × 1080 px, operating at 60 Hz) were chosen. ErgoLAB software (ErgoLAB v3.12) was employed to develop, execute, and collect experimental stimulation programs, while SPSS software (v.29) was utilized for experimental data processing and analysis. All potential interfering factors (such as noise, external light sources, odors, temperature, etc.) were minimized during the experiment. The experimental setting encompassed a laboratory space covering approximately 42 square meters, indoors, with shading treatments applied.
- (2)
- Experimental Subjects: The study enlisted 6 professionals (comprising the professional group) with over 3 years of experience in human–machine interface design, alongside 32 non-designers, none of whom had prior involvement in similar experiments. Among the non-professional group, there were 16 males and 16 females aged 20–32 years, with an average age of 25 years (standard deviation = 0.843). The day before the experiment, participants were reminded to ensure adequate sleep and to avoid being excessively tired or excited. Prior to the formal experiment, all participants underwent vision chart and color vision tests to ensure normal vision in both eyes and no visual impairments. Additionally, participants completed and signed a consent form approved by the university review board, ensuring that they fully understood the experiment’s content and the associated ethical and legal guidelines.
4.2.2. Criteria Weights
4.2.3. Improved Gray H-Convex Correlation
- (1)
- Calculate H-convexity
- (2)
- Calculate the gray H-convex correlation coefficient
- (3)
- Calculate the gray H-convex correlation degree.
5. Application
5.1. Evaluation Samples
5.2. Evaluation Data
5.2.1. Layout Aesthetic Evaluation Data
5.2.2. Eye Movement Experimental Data
5.2.3. Weighted Normalized Data
5.3. Results and Analysis
- (1)
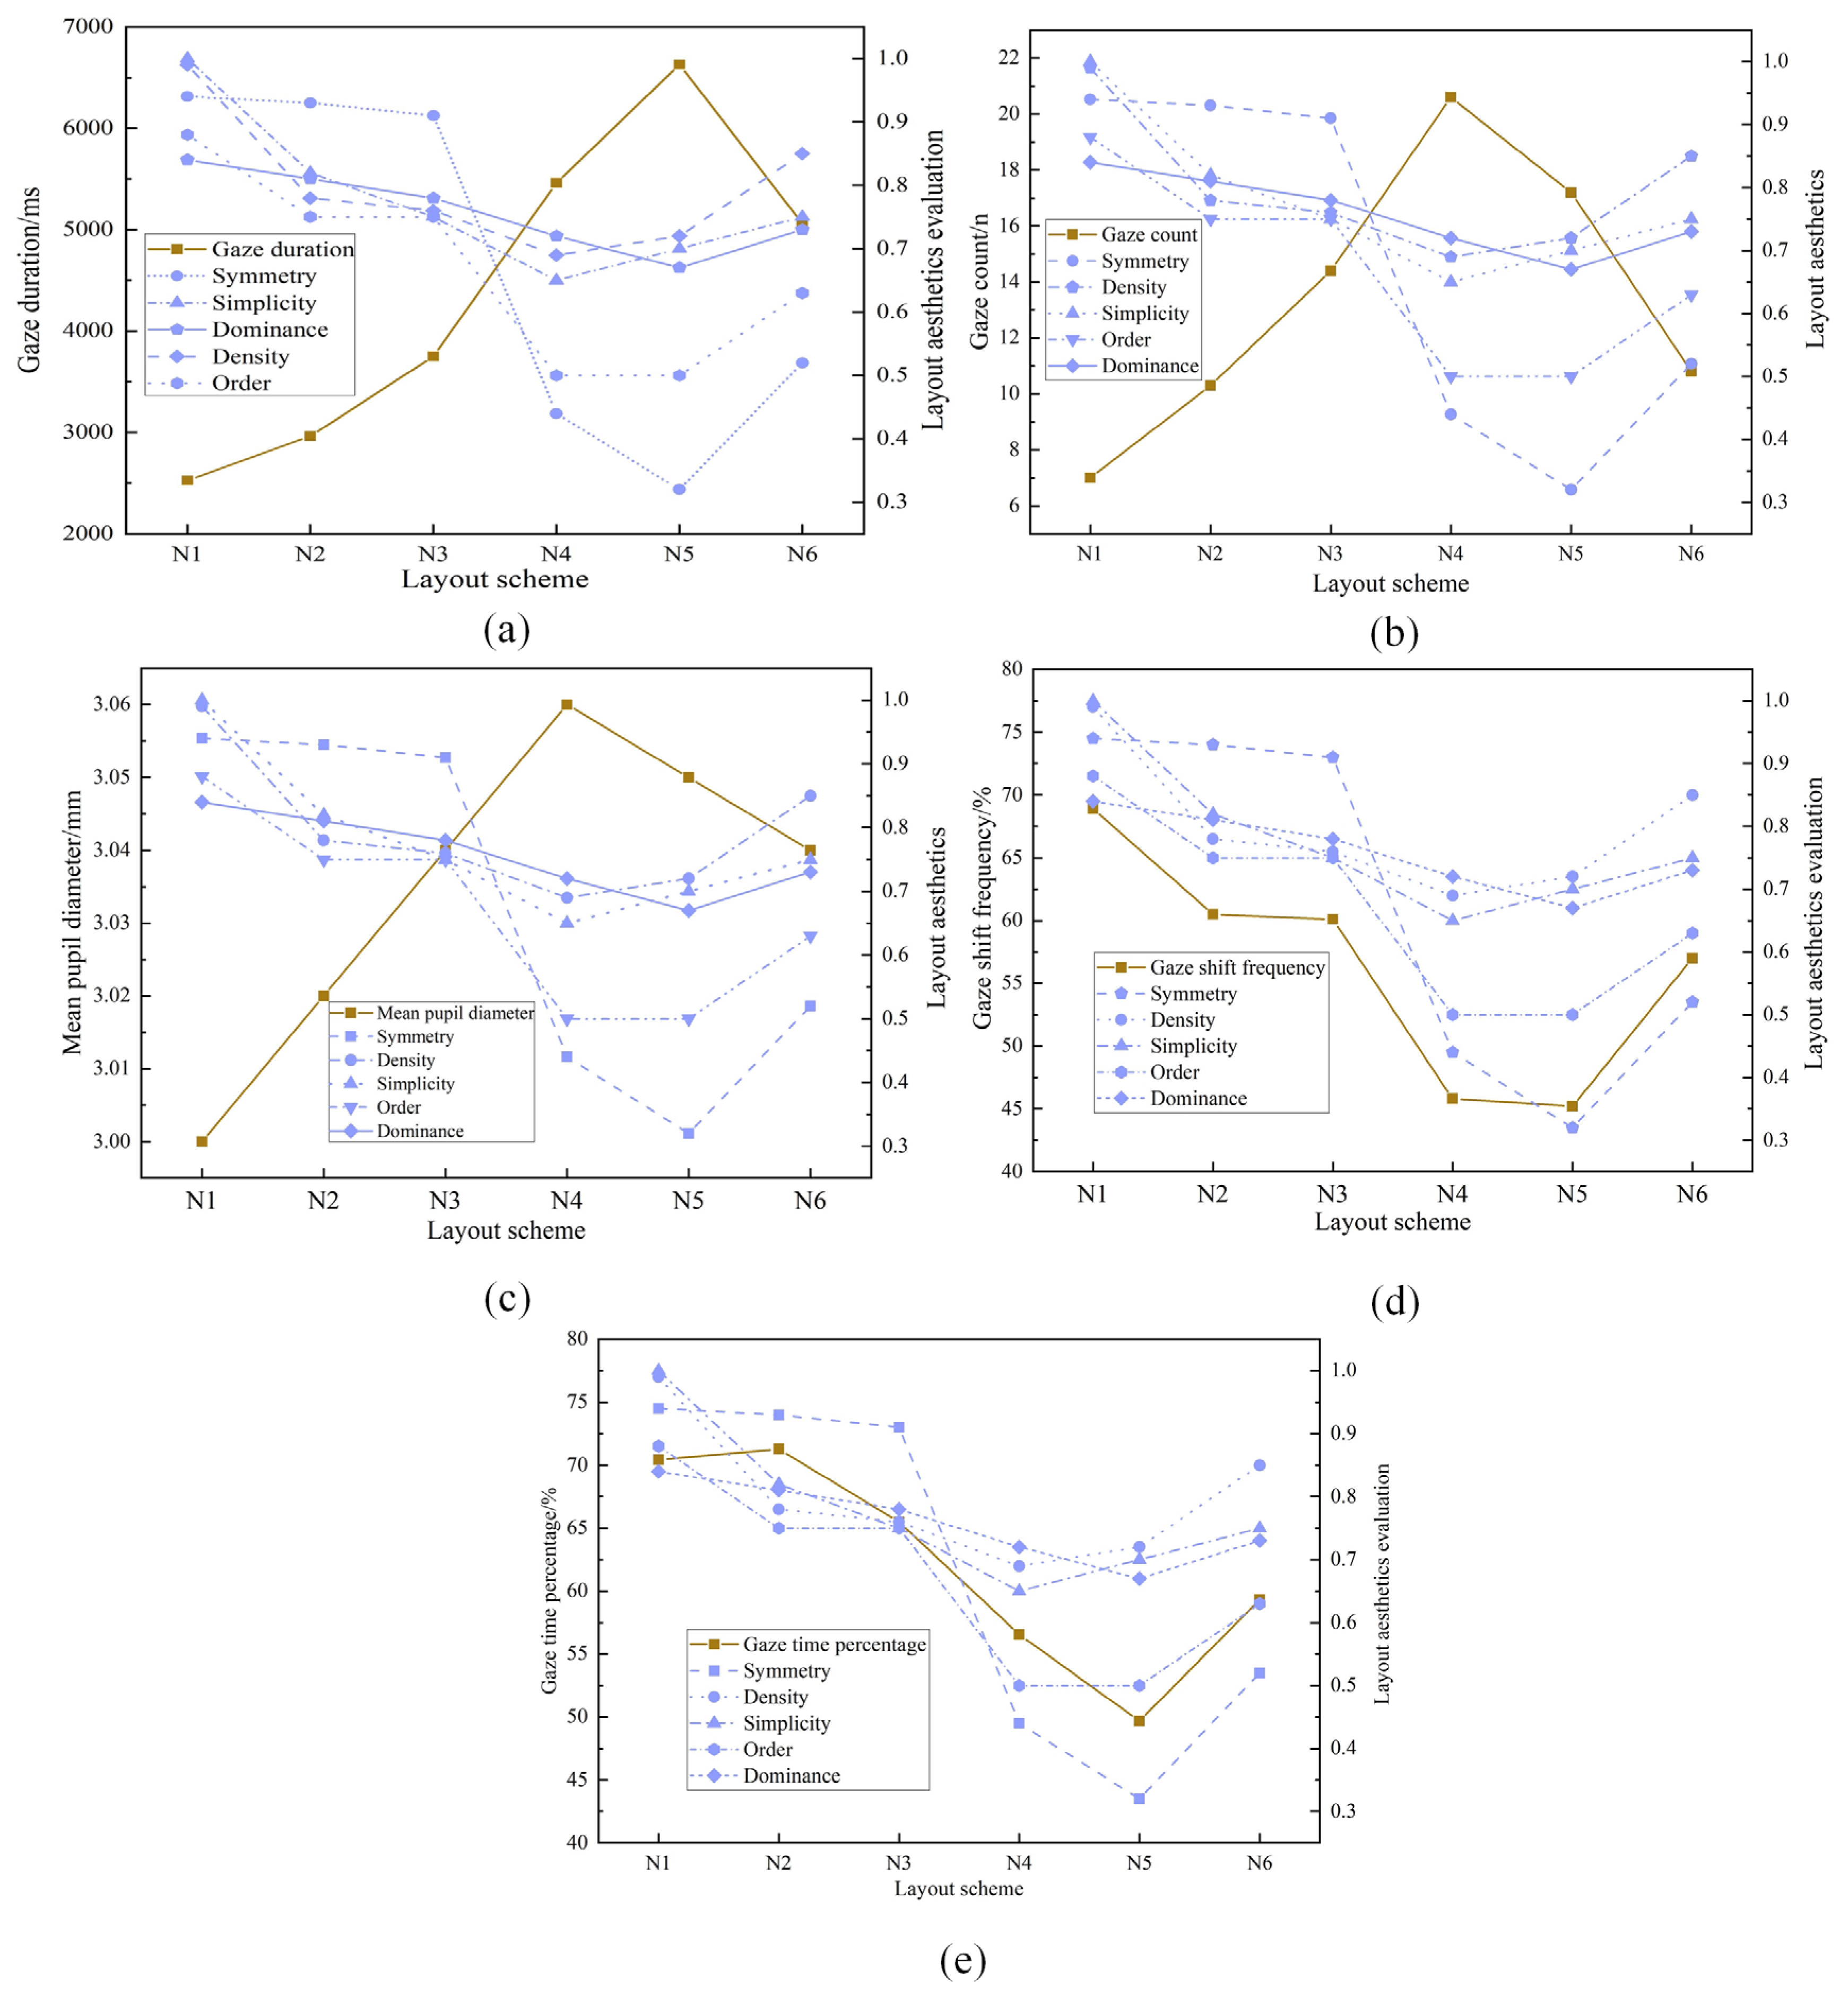
- Correlations between fixation duration and layout aesthetics
- (2)
- Correlations between the fixation count and layout aesthetics
- (3)
- Correlations between mean pupil diameter and layout aesthetics
- (4)
- Correlations between gaze shift frequency and layout aesthetics
- (5)
- Correlations between gaze time percentage and layout aesthetics
5.4. Model Testing and Comparison
5.4.1. Effect Comparison
- The gray correlation model yields positive results even in cases of negative correlation between indicators, failing to align with the actual scenario, which is highly consistent with the findings of Zhou et al. [48].
- The new gray absolute correlation model lacks stability in accurately reflecting positive and negative correlations among indicators, exemplified by a correlation coefficient of 0.0489 between fixation duration and order, still indicating a positive correlation. This conclusion corroborates the findings of Zhou et al. [48], demonstrating that the model lacks the capability to determine negative correlations between variables.
- The original gray H-convex correlation model indicates that the highest negative correlation between fixation duration and dominance was 0.8546, followed by symmetry at 0.7016. This is consistent with the ranking outcomes of the enhanced gray H-convex correlation model.
- In the improved model, the correlation between fixation duration and simplicity surpasses that of density, contrary to the results of the original gray H-convex correlation model. This discrepancy may stem from the improved model’s integration of differential indicator characteristics and their impact on the system, thereby influencing the final outcome.
5.4.2. Performance Comparison
6. Conclusions
- (1)
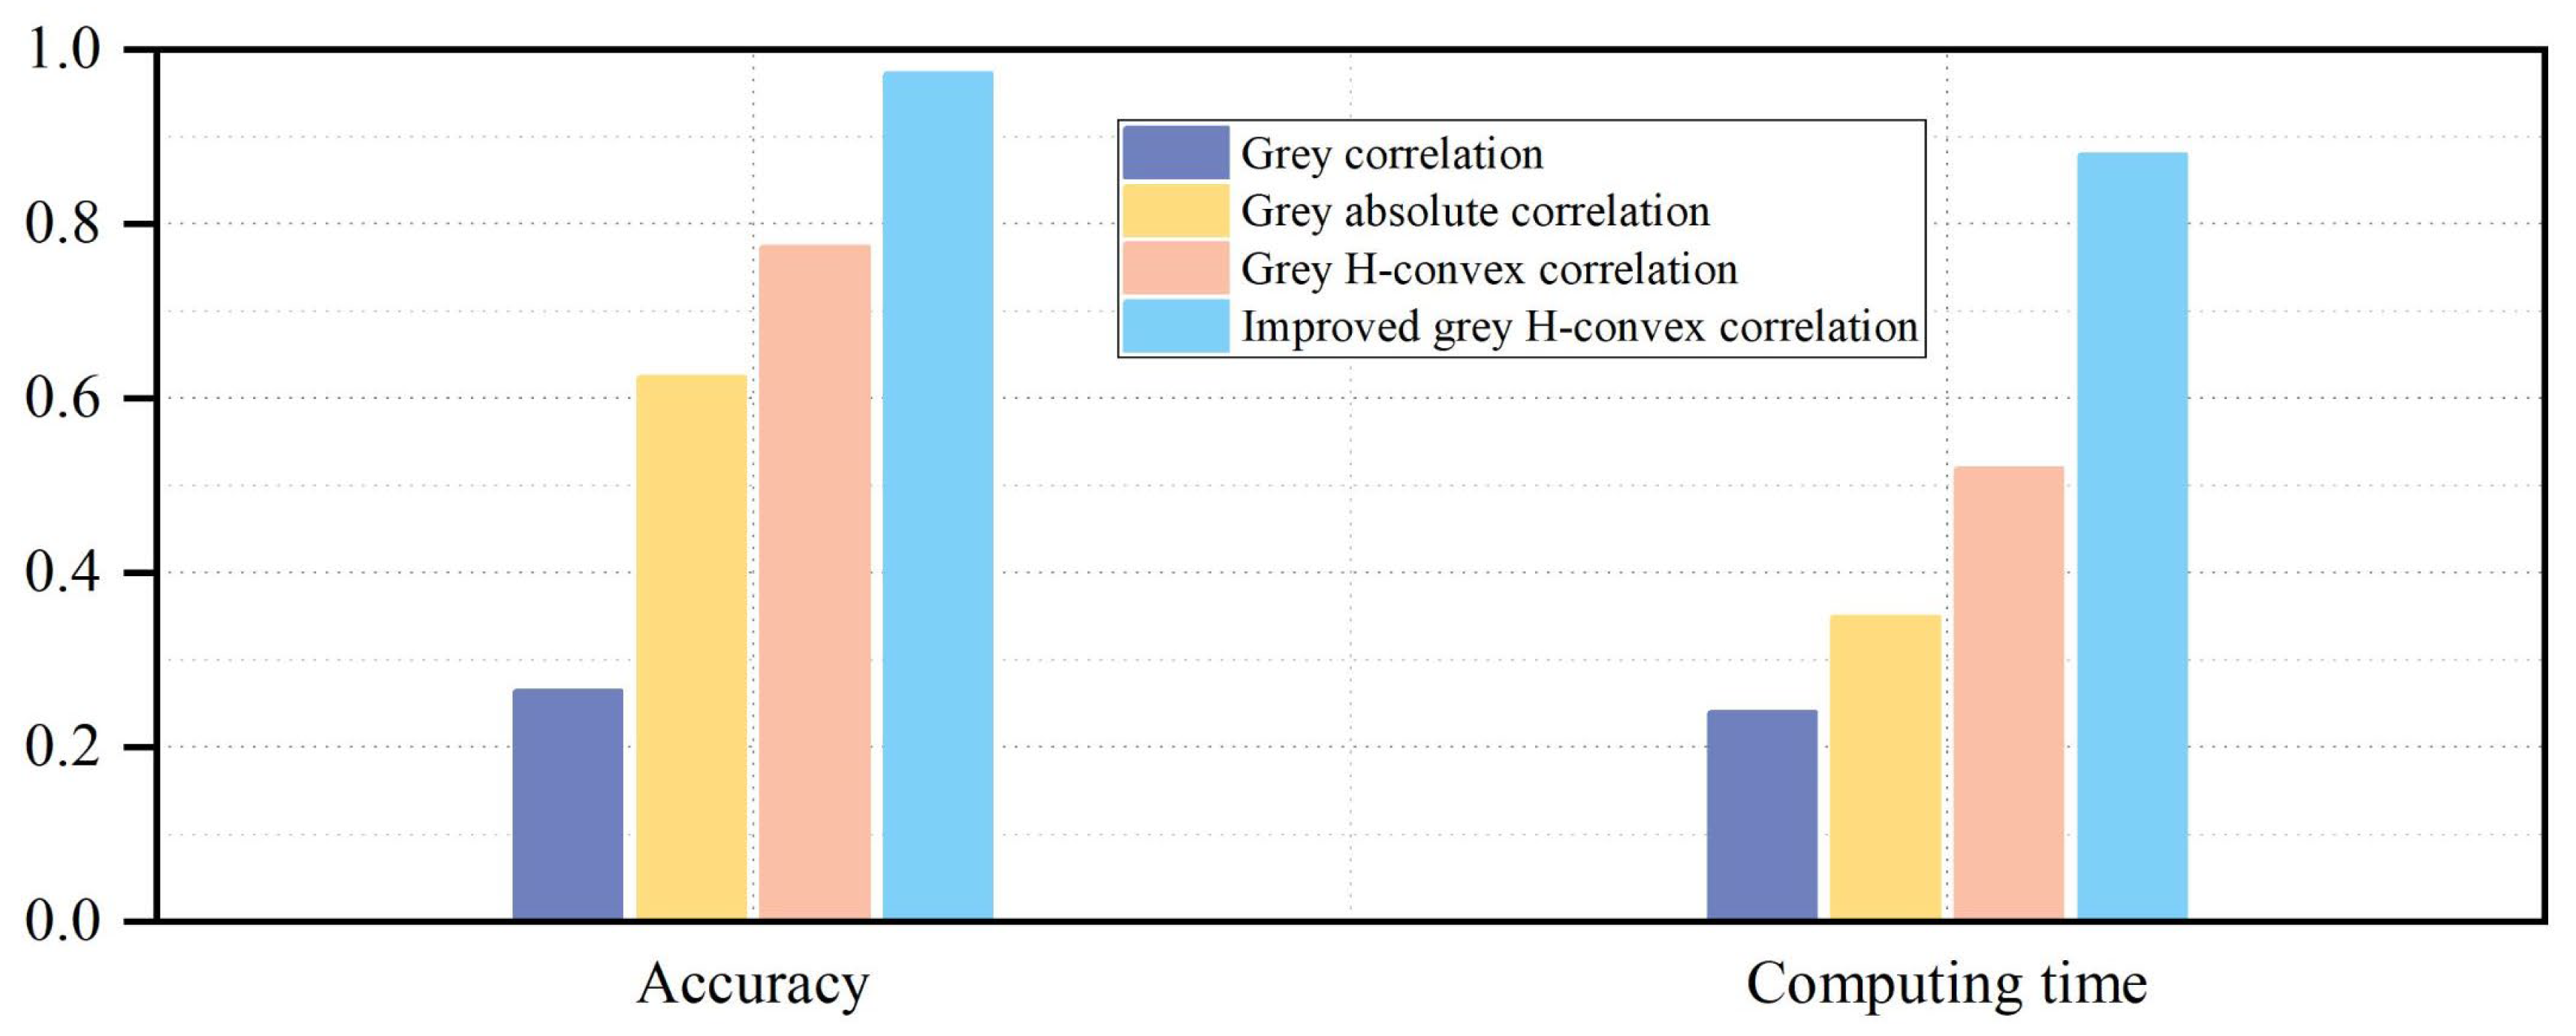
- This paper employs the enhanced gray H-convex correlation model, enabling precise identification of positive and negative correlations between interface layout aesthetics and visual cognition. The findings demonstrate that the accuracy of the enhanced model exceeds 90%. Nevertheless, the computational complexity of the model leads to a moderate increase in running time. Efforts will be directed towards addressing this limitation through further optimization in future endeavors.
- (2)
- A notable correlation exists between interface layout aesthetics and user visual cognition. Specifically, the correlations between fixation duration and fixation count are the most pronounced (0.9831 and 0.9353, respectively), which is highly consistent with the findings of Li et al. [51]. However, this study differs by explicitly calculating the degree of their correlation. Moreover, the correlation between mean pupil diameter and symmetry exhibits the highest value (0.7124), which is consistent with the findings of Wei et al. [52]. Simultaneously, we found that the correlation between gaze shift frequency and order is notably strong (0.9808), while the correlation between fixation time percentage and dominance is the highest (0.9710). The inverse relationship between fixation duration, fixation count, and mean pupil diameter with interface layout aesthetics is consistent with the findings of Munsters et al. [53]. Notably, this study found that gaze shift frequency and gaze time percentage are positively correlated with interface layout aesthetics. These findings underscore the importance for designers to prioritize factors such as dominance, symmetry, and order of interface layout in designing interfaces for infrequently accessed public services like virtual museums. Furthermore, attention should be directed towards understanding user cognitive and physiological tendencies, as well as aesthetic inclinations, to enhance user experience and interaction efficiency.
- (3)
- Nevertheless, the evaluation samples utilized in this paper exclusively encompass 2D static layout interfaces, thereby overlooking the undeniable influence of dynamic interface layout designs on user visual cognition. In forthcoming research, we intend to incorporate immersive 3D dynamic interactive interfaces as samples to undertake a comparative study of the impact of dynamic versus static interfaces on user aesthetics and cognition. Moreover, while this study predominantly centers on interface layout, it is imperative to acknowledge that interface color schemes, icons, and interaction frameworks, as well as user emotions and personalities, constitute pivotal factors influencing interface design. Consequently, future endeavors will be directed towards addressing these overlooked limitations, thereby contributing to a more comprehensive understanding of interface design considerations.
Author Contributions
Funding
Institutional Review Board Statement
Informed Consent Statement
Data Availability Statement
Acknowledgments
Conflicts of Interest
References
- Wen, J.Y.; Shu, T.L. Creative economy and sustainable development: Shaping flexible cultural governance model for creativity. Sustainability 2023, 15, 4353. [Google Scholar] [CrossRef]
- Chai, C.; Zhang, X.; Chai, Q.; Yin, Y.; Li, W.; Shi, J.; Fan, H.; Liu, X.; Zhang, D.; Zou, N. Immersive 2D versus 3D: How does the form of virtual reality inspirational stimuli affect conceptual design? Des. J. 2023, 26, 856–877. [Google Scholar] [CrossRef]
- Deng, Y.; Zhang, X.; Zhang, B.; Zhang, B.; Qin, J. From digital museuming to on-site visiting: The mediation of cultural identity and perceived value. Front. Psychol. 2023, 14, 1111917. [Google Scholar] [CrossRef] [PubMed]
- Yu, N.; Lv, Y.; Liu, X.; Jiang, S.; Xie, H.; Zhang, X.; Xu, K. Impact of Correlated Color Temperature on Visitors’ Perception and Preference in Virtual Reality Museum Exhibitions. Int. J. Environ. Res. Public Health 2023, 20, 2811. [Google Scholar] [CrossRef] [PubMed]
- Çevik, A.; Kazanasmaz, Z.T.; Tambellini, G.; Salvadori, G.; Leccese, F. Perception of Light in Museum Environments: Comparison between Real-Life and Virtual Visual Experiences. Sustainability 2022, 14, 14288. [Google Scholar] [CrossRef]
- Jeon, S.; Kim, M.S. Noise-Robust Multimodal Audio-Visual Speech Recognition System for Speech-Based Interaction Applications. Sensors 2022, 22, 7738. [Google Scholar] [CrossRef] [PubMed]
- Suarez, S.; Puyol, R.; Schafer, C.; Mucklich, F. HapticSOUND: An Interactive Learning Experience with a Digital Musical Instrument. Appl. Sci. 2023, 13, 7149. [Google Scholar] [CrossRef]
- Hulusic, V.; Gusia, L.; Luci, N.; Smith, M. Tangible User Interfaces for Enhancing User Experience of Virtual Reality Cultural Heritage Applications for Utilization in Educational Environment. J. Comput. Cult. Herit. 2023, 16, 3593429. [Google Scholar] [CrossRef]
- Kim, K.; Kwon, O.; Yu, J. Evaluation of an HMD-Based Multisensory Virtual Museum Experience for Enhancing Sense of Presence. IEEE Access 2023, 11, 100295–100308. [Google Scholar] [CrossRef]
- Partarakis, N.; Zabulis, X. A review of immersive technologies, knowledge representation, and AI for human-centered digital experiences. Electronics 2024, 13, 269. [Google Scholar] [CrossRef]
- Nunes, V.; Cappelli, C.; De Moraes, R.M.; Oliveira, R.; Da Silva, J.L.C. Method for Evaluating the Use of Plain Language in Interfaces of Public Service Portals. In Proceedings of the 24th Annual International Conference on Digital Government Research (DGO’23), Gdańsk, Poland, 11–14 July 2023; Volume 7, pp. 233–243. [Google Scholar] [CrossRef]
- Leopardi, A.; Ceccacci, S.; Mengoni, M.; Naspetti, S.; Gambelli, D.; Ozturk, E.; Zanoli, R. X-reality technologies for museums: A comparative evaluation based on presence and visitors experience through user studies. J. Cult. Herit. 2020, 47, 188–198. [Google Scholar] [CrossRef]
- Wolfgang, H.; Tan, X.J.; de Coninck, F. Using Digital Extensions to Create New VR Museum Experiences. In Proceedings of the 13th International Conference on Advances in Computer Entertainment Technology, Osaka, Japan, 9–12 November 2016; pp. 1–6. [Google Scholar]
- Marty, P.F. Museum websites and museum visitors: Digital museum resources and their use. Mus. Manag. Curatorship 2008, 23, 81–99. [Google Scholar] [CrossRef]
- Tanriverdi, V.; Jacob, R.J.K. VRID: A design model and methodology for developing virtual reality interfaces. In Proceedings of the ACM Symposium on Virtual Reality Software and Technology, Baniff, AB, Canada, 15–17 November 2001. [Google Scholar]
- Frojdman, S. User Experience Guidelines for Deisgn of Virtual Reality Graphical User Interfaces. Ph.D. Thesis, University of Skovde, Skövde, Sweden, 2016. [Google Scholar]
- Nadia, Z.; Pasaribu, Y.; Djati, I. Expectations and Ideal VRUI from User’s Perspective, Case Studies: VR Interface in ITB Electric Car’s (Molina) Virttual Exhibition. J. Comput. 2018, 13, 721–732. [Google Scholar] [CrossRef]
- Pan, P.G.; Chen, Y.M.; Xie, H.Y. Study on grey H-convex correlation degree model. Stat. Decis. 2016, 9, 31–34. [Google Scholar] [CrossRef]
- Xu, L.; Chen, J.; Wang, Q. Application of color entropy to image quality assessment. J. Image Graph. 2015, 20, 1583–1592. [Google Scholar]
- Dong, T.Y.; Yang, L.J.; Zhang, X.P. 3D image experience quality evaluation method for users multi-dimensional perception. J. Image Graph. 2019, 24, 0782–0793. [Google Scholar]
- Horbinski, T.; Cybulski, P.; Medynska, G. Graphic design and button placement for Mobile map applications. Cartogr. J. 2020, 57, 196–208. [Google Scholar] [CrossRef]
- Lazard, A.; King, A. Objective design to subjective evaluations: Connecting visual complexity to aesthetic and usability assessments of ehealth. Int. J. Hum.-Comput. Interact. 2020, 36, 95–104. [Google Scholar] [CrossRef]
- Dianat, I.; Adeli, P.; Jafarabadi, M.A.; Karimi, M.A. User-centred web design, usability and user satisfaction: The case of online banking websites in Iran. Appl. Ergon. 2019, 81, 102892. [Google Scholar] [CrossRef]
- Pengnate, S.; Sarathy, R.; Kyulee, J. The engagement of website initial aesthetic impressions: An experimental investigation. Int. J. Hum.-Comput. Interact. 2018, 35, 1517–1531. [Google Scholar] [CrossRef]
- Birkhoff, G.D. Aesthetic Measure; Harvard University Press: Cambridge, MA, USA, 1933. [Google Scholar]
- Ngo, D.C.L.; Lian, S.T.; Byrne, J.G. Modelling interface aesthetics. Inf. Sci. 2003, 152, 25–46. [Google Scholar] [CrossRef]
- Zhou, A.M.; Su, J.N.; Yan, S.T.; Ouyang, J.Y.; Shi, C.; Yuwang, B.Y. Nonlinear information dynamics model of synthetic evaluation on product form aesthetic. J. Mech. Eng. 2018, 54, 150–159. [Google Scholar] [CrossRef]
- Theeuwes, J. Self-explaining roads: What does visual cognition tell us about designing safer roads? Cogn. Res. Princ. Implic. 2021, 6, 15. [Google Scholar] [CrossRef] [PubMed]
- Zhu, Y.; Li, Y.; Lin, Y.; Chen, M.; Guo, Q.; Zhang, Z. Research on the influence of user and graphic-Text combined Icon construal level fitting on visual cognition. Appl. Sci. 2022, 7, 10111. [Google Scholar] [CrossRef]
- Montazem, A.R. The impact of experience on the design of user interface. Man-Mach. Stud. 1991, 34, 731–749. [Google Scholar] [CrossRef]
- Zhi, J.Y.; Du, Y.; Feng, S. Review on the graphic design and perceptual characteristics of automobile system interface. Packag. Eng. 2020, 41, 62–70. [Google Scholar]
- Salman, Y.B.; Cheng, H.I.; Patterson, P.E. Icon and user interface design for emergency medical information systems: A case study. Int. J. Med. Inform. 2012, 81, 29–35. [Google Scholar] [CrossRef] [PubMed]
- Martinez-Marquez, D.; Pingali, S.; Panuwatwanich, K.; Stewart, R.A.; Mohamed, S. Application of Eye Tracking Technology in Aviation, Maritime, and Construction Industries: A Systematic Review. Sensors 2021, 21, 4289. [Google Scholar] [CrossRef]
- Deng, J.L. Figure on difference information space in grey relational analysis source. J. Grey Syst. 2004, 16, 96–100. [Google Scholar]
- Deng, J.L. The Elements of Grey System; Press of Huazhong University of Science and Technology: Wuhan, China, 2002; pp. 63–170. [Google Scholar]
- Zhang, Q.S.; Guo, X.J.; Deng, J.L. Grey relation entropy method of grey relation analysis. Syst. Eng.-Theory Pract. 1996, 16, 7–11. [Google Scholar]
- Wang, Q.Y. The grey relational analysis of B-Mode. J. Huazhong Univ. Sci. Technol. 1989, 16, 77–82. [Google Scholar]
- Liu, Y.; Liu, F.; Forrest, J. A new grey absolute degree of grey incidence model and application. Chin. J. Manag. Sci. 2012, 20, 173–177. [Google Scholar]
- Wang, J.H.; Wang, L.; Zhang, L.; Cui, L.J. Supplier selection vikor Multi-attribute decision making of grey group clustering and improved critic weighting. Syst. Eng. Electron. 2023, 45, 155–164. [Google Scholar]
- Krishnan, A.R.; Kasim, M.M.; Hamid, R.; Ghazali, M.F. A modified critic method to estimate the objective weights of decision criteria. Symmetry 2021, 13, 973. [Google Scholar] [CrossRef]
- Fan, W.L.; Hu, P.; Liu, Z.G. A multi-attribute node importance evaluation method based on Gni-cofficient in complex power grids. IET Gener. Transm. Distrib. 2016, 10, 2027–2034. [Google Scholar]
- d’Anjou, P. The impalpable omnipresence of the ethical demand in design. Adv. Des. Res. 2023, 1, 1–6. [Google Scholar] [CrossRef]
- Wang, L. A Study of the Effect of Website Symmetry and Complexity on User’s Recognition Load Based one Eye Tracking Technology. Master’s Thesis, Zhejiang University, Hangzhou, China, 2017. [Google Scholar]
- Nandini, M.; Jaiteg, S. Understanding Online Consumer Behavior at E-commerce Portals Using Eye-Gaze Tracking. Int. J. Hum.-Comput. Interact. 2023, 39, 721–742. [Google Scholar]
- Wu, X.; Gedeon, T.; Xue, C.; Zhang, W.; Wang, L. Comparison of the congruent effects on Fixation/Saccade and pupil dilation influencing information feature searching. J. Comput.-Aided Des. Comput. Graph. 2019, 31, 1636–1644. [Google Scholar]
- Lounis, C.; Peysakhovich, V. Causse M Visual scanning strategies in the cockpit are modulated by pilots’ expertise: A flight simulator study. Plosone 2021, 16, e0247061. [Google Scholar] [CrossRef]
- Wang, L.; Yu, S.H.; Chu, J.J. Position design of in-car information display based on eye movement analysis. J. Zhejiang Univ. (Eng. Sci.) 2020, 54, 671–693. [Google Scholar]
- Zhou, W.H.; Zeng, B. A research review of grey relational degree model. Stat. Decis. 2020, 36, 29–34. [Google Scholar]
- Jiang, J.-Y.; Guo, F.; Chen, J.-H.; Tian, X.-H.; Lv, W. Applying Eye-Tracking Technology to Measure Interactive Experience Toward the Navigation Interface of Mobile Games Considering Different Visual Attention Mechanisms. Appl. Sci. 2019, 9, 3242. [Google Scholar] [CrossRef]
- Yang, Y.; Chen, F. Research on the characteristics of driver visual behavior in highway extra-long tunnel. IOP Conf. Ser. Earth Env. Sci. 2019, 295, 042139. [Google Scholar] [CrossRef]
- Li, G.; Wang, L.; Hu, J. Integration with Visual Perception—Research on the Usability of a Data Visualization Interface Layout in Zero-Carbon Parks Based on Eye-Tracking Technology. Sustainability 2023, 15, 11102. [Google Scholar] [CrossRef]
- Wei, S.; Zheng, R.; Li, R.; Shi, M.; Zhang, J. Measuring cognitive load of digital interface combining event-related potential and BubbleView. Brain Inform. 2023, 10, 8. [Google Scholar] [CrossRef] [PubMed]
- Munsters, N.M.; Boomen, C.v.D.; Hooge, I.T.C.; Kemner, C. The Role of Global and Local Visual Information during Gaze-Cued Orienting of Attention. PLoS ONE 2016, 11, e0160405. [Google Scholar] [CrossRef]


| Samples | |||||
|---|---|---|---|---|---|
| 0.94 | 0.99 | 1.00 | 0.88 | 0.84 | |
| 0.93 | 0.78 | 0.82 | 0.75 | 0.81 | |
| 0.91 | 0.76 | 0.75 | 0.75 | 0.78 | |
| 0.44 | 0.69 | 0.65 | 0.50 | 0.72 | |
| 0.32 | 0.72 | 0.70 | 0.50 | 0.67 | |
| 0.52 | 0.85 | 0.75 | 0.63 | 0.73 |
| Samples | |||||
|---|---|---|---|---|---|
| A | 2527 | 7.00 | 3.00 | 68.9 | 70.43 |
| B | 2963 | 10.30 | 3.02 | 60.5 | 71.27 |
| C | 3751 | 14.40 | 3.04 | 60.1 | 65.48 |
| D | 5460 | 20.60 | 3.06 | 45.8 | 56.55 |
| E | 6628 | 17.20 | 3.05 | 45.2 | 49.69 |
| F | 5062 | 10.80 | 3.04 | 57.0 | 59.33 |
| F-value | 3.526 | 9.506 | 20.089 | 4.178 | 5.506 |
| p-value | 0.035 | 0.001 | 0.022 | 0.012 | 0.043 |
| Criteria | |||||
|---|---|---|---|---|---|
| Weight | 0.38 | 0.15 | 0.10 | 0.27 | 0.11 |
| −0.9394 | −0.4928 | −0.4976 | −0.4617 | −0.9831 | |
| −0.9300 | −0.5001 | −0.4819 | −0.4769 | −0.9353 | |
| −0.7124 | −0.4937 | −0.5077 | 0.4586 | −0.4997 | |
| 0.9720 | 0.9382 | 0.4504 | 0.9808 | 0.4779 | |
| 0.9155 | 0.4764 | 0.0178 | 0.4213 | 0.9710 |
| Model | |||||
|---|---|---|---|---|---|
| Gray correlation | 0.6959 | 0.6058 | 0.3800 | 0.3542 | 0.4591 |
| New gray absolute correlation | −0.7511 | −0.3119 | −0.3048 | 0.0489 | −0.7379 |
| Gray H-convex correlation | −0.7016 | −0.4138 | −0.3599 | −0.2024 | −0.8546 |
| Improved gray H-convex correlation | −0.9394 | −0.4928 | −0.4976 | −0.4617 | −0.9831 |
Disclaimer/Publisher’s Note: The statements, opinions and data contained in all publications are solely those of the individual author(s) and contributor(s) and not of MDPI and/or the editor(s). MDPI and/or the editor(s) disclaim responsibility for any injury to people or property resulting from any ideas, methods, instructions or products referred to in the content. |
© 2024 by the authors. Licensee MDPI, Basel, Switzerland. This article is an open access article distributed under the terms and conditions of the Creative Commons Attribution (CC BY) license (https://creativecommons.org/licenses/by/4.0/).
Share and Cite
Wang, W.; Wen, Z.; Chen, J.; Gu, Y.; Peng, Q. Evaluation Method for Virtual Museum Interface Integrating Layout Aesthetics and Visual Cognitive Characteristics Based on Improved Gray H-Convex Correlation Model. Appl. Sci. 2024, 14, 7006. https://doi.org/10.3390/app14167006
Wang W, Wen Z, Chen J, Gu Y, Peng Q. Evaluation Method for Virtual Museum Interface Integrating Layout Aesthetics and Visual Cognitive Characteristics Based on Improved Gray H-Convex Correlation Model. Applied Sciences. 2024; 14(16):7006. https://doi.org/10.3390/app14167006
Chicago/Turabian StyleWang, Weiwei, Zhiqiang Wen, Jian Chen, Yanhui Gu, and Qizhao Peng. 2024. "Evaluation Method for Virtual Museum Interface Integrating Layout Aesthetics and Visual Cognitive Characteristics Based on Improved Gray H-Convex Correlation Model" Applied Sciences 14, no. 16: 7006. https://doi.org/10.3390/app14167006
APA StyleWang, W., Wen, Z., Chen, J., Gu, Y., & Peng, Q. (2024). Evaluation Method for Virtual Museum Interface Integrating Layout Aesthetics and Visual Cognitive Characteristics Based on Improved Gray H-Convex Correlation Model. Applied Sciences, 14(16), 7006. https://doi.org/10.3390/app14167006


