1. Introduction
The pre-stressed high-strength concrete (PHC) pile offers high bearing capacity, a wide application range, good driving resistance, and fast construction speed. Widely utilized in high-rise buildings, bridges, ports, and other industries [
1,
2,
3]. PHC piles have become increasingly important for ensuring safety through reliable construction and thorough quality control. Although standards vary by country, conducting dynamic load tests on all piles remains impractical. Instead, these tests occur on a select few to estimate bearing capacity while managing the remaining piles through penetration depth. Ensuring that all piles share the same conditions is impossible, making it problematic to manage piles based solely on penetration depth.
Two major issues must be addressed for reliable pile management. First, the method of measuring penetration depth during the final driving requires improvement. Traditionally, laborers manually measure penetration depth and rebound values using pen and paper [
4,
5]. Although simple and widely used, this method is prone to inaccuracies unless performed flawlessly by experienced laborers in ideal conditions. Additionally, important information may be omitted, and records can be manipulated, complicating construction management and safety assurance. Recently developed non-contact penetration measurement devices and sensors help mitigate these issues [
6,
7]. While these advancements have improved accuracy and reliability in measuring penetration depth, further enhancements in the measurement process contribute to better pile management.
The second issue involves reliance on on-site penetration depth values for construction and quality management. Penetration depth is influenced by various factors such as hammer height, ram weight, and pile type, making it difficult to ensure reliable pile quality using penetration depth alone. It is crucial to consider penetration depth and hammer energy through driving formulas to address this issue, as this approach can significantly improve reliability. However, current practices often fail to integrate these factors comprehensively, leaving room for improvement in pile quality management. Various researchers have conducted studies from different perspectives to improve the accuracy and applicability of pile driving formulas. For instance, Xiao improved the traditional Hiley formula by considering the time effects, using high-strain dynamic tests to propose a method for predicting the bearing capacity of piles more accurately [
8]. Similarly, Ter-Martirosyan presented a new analytical solution for vibratory pile driving rates, considering vibratory creep to better estimate the pile embedding rate [
9]. Masud proposed improved wave equation analysis methods and load and resistance factor design (LRFD) recommendations for piles in soil-based intermediate geomaterials, introducing new damping parameters to enhance the reliability of pile resistance predictions [
10]. Also, Bian incorporated the setup effect, where the bearing capacity of driven piles increases over time, into the reliability analysis to improve the prediction accuracy and economic efficiency of pile designs [
11]. Tokhi suggested improvements to the commonly used Hiley kinetic equation, which could result in more accurate evaluations of pile bearing capacity [
12]. Arsyad used four different formulas, including the Hiley formula, to estimate pile bearing capacity and found that the Hiley formula tended to underestimate these values [
13]. Zhang compared the predicted geotechnical pile bearing capacities using the Hiley formula and the high-strain method. Their findings indicated that the values derived from the Hiley formula were consistently lower than those obtained from the high-strain method and static load tests [
14].
This paper aims to enhance the reliability of quality management for driven piles without dynamic load tests by reviewing and improving existing driving formulas, especially for PHC piles. Specifically, to tackle the second issue, the paper focuses on enhancing the methods for using penetration depth and hammer energy in driving formulas. To validate the existing formulas (Hiley, Gates, and Danish), 258 dynamic load test data points collected from various sites were utilized. The results of the dynamic load tests provided a reference, and the calculated bearing capacity from driving formulas underwent comparison. Statistical methods analyzed the comparison results. Additionally, the Gates formula incorporated easily obtainable variables to increase the practical applicability of the existing driving formulas. The improvement involved two methods: (1) curve fitting with actual data and (2) applying coefficients based on different segments. These improved methods led to enhanced accuracy in estimating bearing capacity.
This paper is structured as follows: First, a review of dynamic load testing and existing pile driving formulas is presented. Then, the reliability of these formulas is examined using data from 258 dynamic load tests. Following this, the Gates formula, which allows for easy variable acquisition, is improved and reviewed through two distinct methods. Finally, using an additional set of 60 data points, the study results were validated, and the sensitivity of the formulas to the pile diameter was confirmed.
2. Dynamic Load Testing
Dynamic load tests are commonly used to estimate the bearing capacity of piles on-site. Developed in 1964 at Case Western Reserve University in the United States, this method is based on the wave equation theory related to the impact wave applied to piles [
15]. The Pile Driving Analyzer (PDA) system is specifically designed for dynamic load testing and drive monitoring.
Dynamic monitoring involves installing two sets of sensors at the pile head, which include two strain sensors and two acceleration sensors placed on opposite sides of the pile above ground level. When connected to the pile head and the PDA system, these sensors capture data on the relationship between the pile top force and velocity over time during vertical hammering of the pile head.
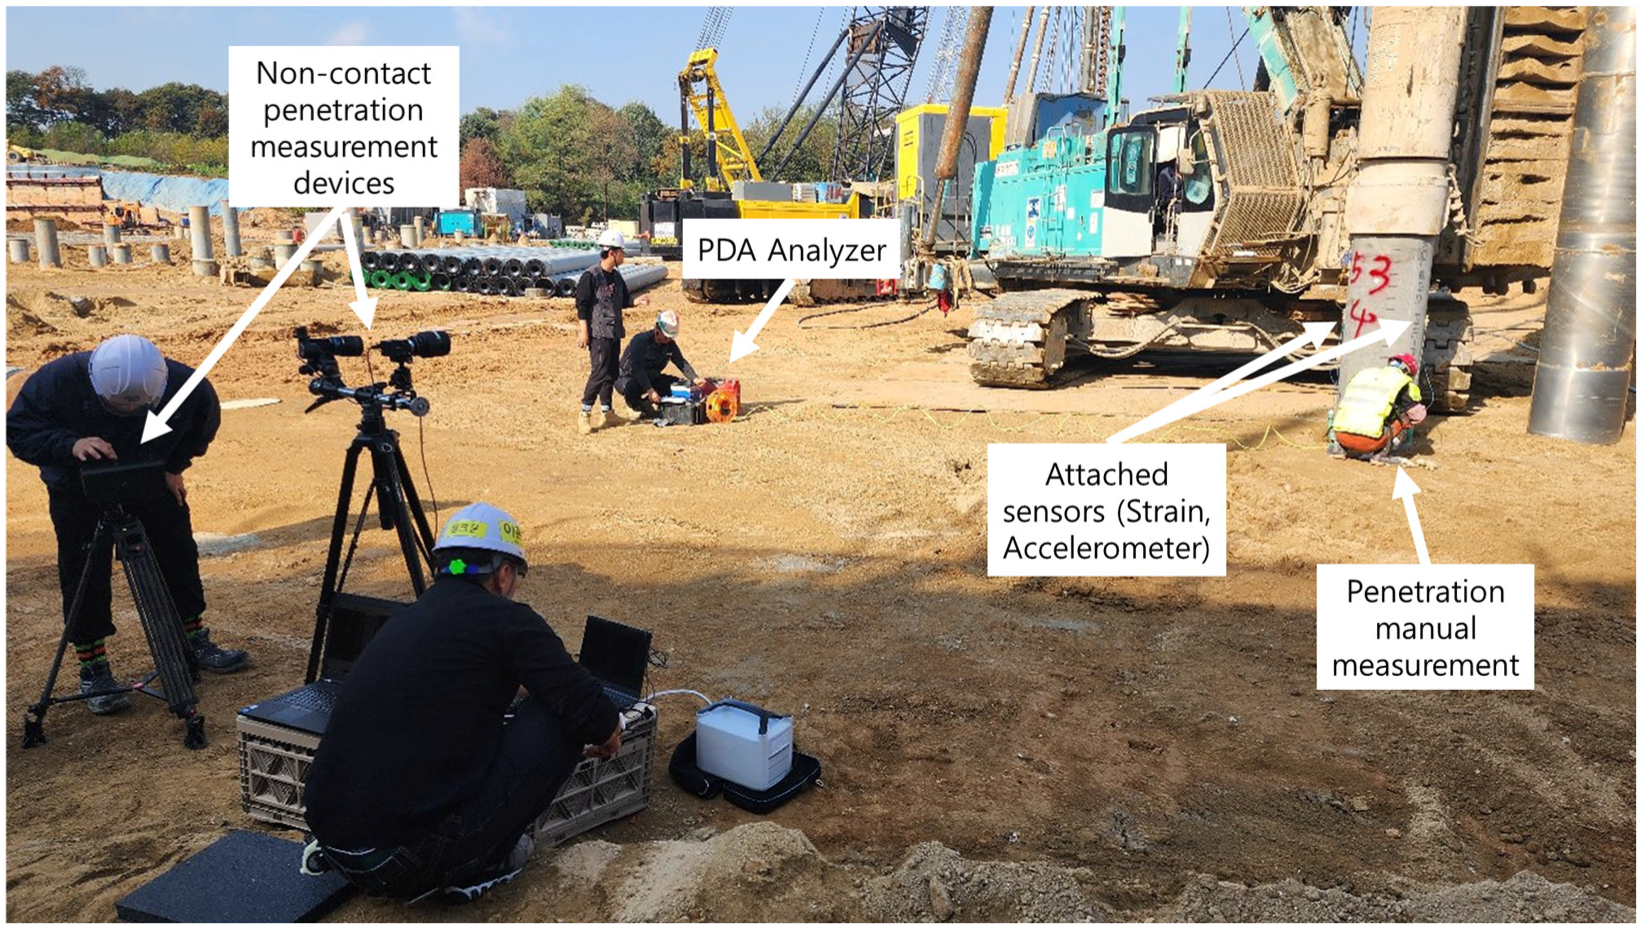
Figure 1 shows the acquisition of physical properties on-site using a PDA (Pile Driving Analyzer), manufactured by Pile Dynamics, Inc., located in Cleveland, OH, USA. The PDA analyzer records various parameters, such as estimated driving resistance, estimated static resistance, and energy transmitted through the sensors [
8].
The acquired data are analyzed using the Case Pile Wave Analysis Program (CAPWAP: software version: 2006-2). This method involves calculating waveforms from force and velocity data and comparing them with measured waveforms under varying boundary conditions [
16]. The CAPWAP program employs wave equations to analyze the pile driving parameters, which help calculate pile movement and stress during the pile driving process. By establishing a pile–soil model, the program adjusts the pile and soil resistance models until the calculated parameters match the actual measured parameters [
17]. Once a good match is achieved, the dynamic model of the pile can be used to determine the distribution of pile parameters along its length and predict the load and settlement of the pile.
Using CAPWAP analysis, the bearing capacity, load–settlement relationship, and other critical pile performance metrics can be determined. This comprehensive analysis allows for a more accurate assessment of pile behavior under load, ensuring the reliability and safety of pile foundations in various geotechnical conditions.
3. Pile Driving Formula
This section introduces the three most widely used pile driving formulas: the Hiley formula, Gates formula, and Danish formula. Pile driving formulas predict dynamic bearing capacity based on the correlation between pile driving energy and ground penetration. These formulas have evolved through various studies from their initial forms, with the Hiley and Gates formulas being long regarded as the most reliable [
18]. Additionally, reports from the Wisconsin Department of Transportation (WSDOT) and the Minnesota Department of Transportation (MnDOT) have confirmed that the Gates formula produces reliable bearing capacity values despite its simplicity [
19,
20]. The Danish formula is also widely used and suitable for large piling projects [
21,
22].
In this section, each formula will be discussed in detail, including application cases and research findings on their reliability.
3.1. Hiley Formula
The Hiley formula is one of the oldest and most widely recognized pile driving formulas. It takes into account the efficiency of the hammer blow, the temporary compression of the pile, and the set per blow [
23]. Over time, researchers have refined this formula, and the most accurate version of the Hiley formula to date is presented below [
24]:
where
EMX = Maximum energy delivered to the pile during driving (ton × m),
S = penetration of pile per blow (m),
q = rebound (m).
This formula enhances reliability by using measured values from a Pile Driving Analyzer (PDA) as input variables. While this makes the updated Hiley formula more reliable than the original, it also imposes certain limitations for use in the field without a PDA. Specifically, accurate values for hammer weight, hammer drop height, hammer efficiency, penetration per blow, and rebound must be known in order to apply the formula effectively.
3.2. Gates Formula
The original Gates formula, introduced in 1957, is an empirical formula for predicting pile bearing capacity. The initial form of the formula is as follows [
25,
26]:
where
E = hammer efficiency (0.75 for drop hammer),
= hammer energy (kN×m),
S = penetration of pile per blow (m).
Adjustments to the original formula were proposed by several researchers. For instance, in 1967, Olson and Flaate proposed a formula with different constants for various types of piles (timber, concrete, steel, and all types) [
27]. Additionally, in 2001, the FHWA recommended using the constants proposed by Long. By introducing the constants below, this method compensated for the tendency of the original Gates formula to underestimate the overall bearing capacity [
19].
Further research culminated in the version currently recommended by the FHWA Pile Manual in 2006, which is now widely used [
28]. The adjusted formula is expressed as follows:
where
W = weight of hammer (kN),
H = height of hammer (m),
= hammer efficiency,
N = number of blows to penetrate 25.4 mm.
3.3. Danish Formula
The Danish formula accounts for the impact of dimensions, as shown below [
29]:
where
W = weight of hammer (kN),
H = height of hammer (cm),
= hammer efficiency,
S = penetration of pile per blow (cm),
L = length of piles (cm),
A = area of the pile cross-section (cm
2),
= modulus of elasticity of the pile material (kN/cm
2). This formula was also improved by researchers by applying EMX values measured with a PDA, enhancing its accuracy. The improved formula is as follows [
30]:
4. Comparative Analysis of Pile Driving Formulas
The pile driving formula, or dynamic formula, has limitations in reliably estimating the ultimate bearing capacity of piles. These issues arise from comparing the formula, which does not account for time factors, with static load test results that do consider time factors [
24]. Thus, it should be used for quality control purposes immediately after the End of Initial Driving (E.O.I.D). For ensuring high reliability in quality control, existing pile driving formulas were reviewed. This review utilized a total of 258 data points from a PDA (Pile Driving Analyzer) and various other data collected from 11 different sites. Only PHC piles with a diameter of 600 mm were used, with the piles driven into weathered rock. The ground above the weathered rock mainly consisted of silty sand and weathered soil.
The dataset used in this analysis includes measured bearing capacities from a PDA, calculated using CAPWAP analysis and calculated bearing capacities from four different formulas: the Hiley, Gates, Danish, and original Gates formulas. Among these, the Hiley and Danish formulas utilize the EMX value obtained through PDA, reflecting the actual energy. Therefore, versions of these formulas that include the EMX value for higher accuracy were used. Additionally, the Hiley formula specifically extracts the well-estimated rebound value using the DMX obtained from PDA, resulting in even greater accuracy.
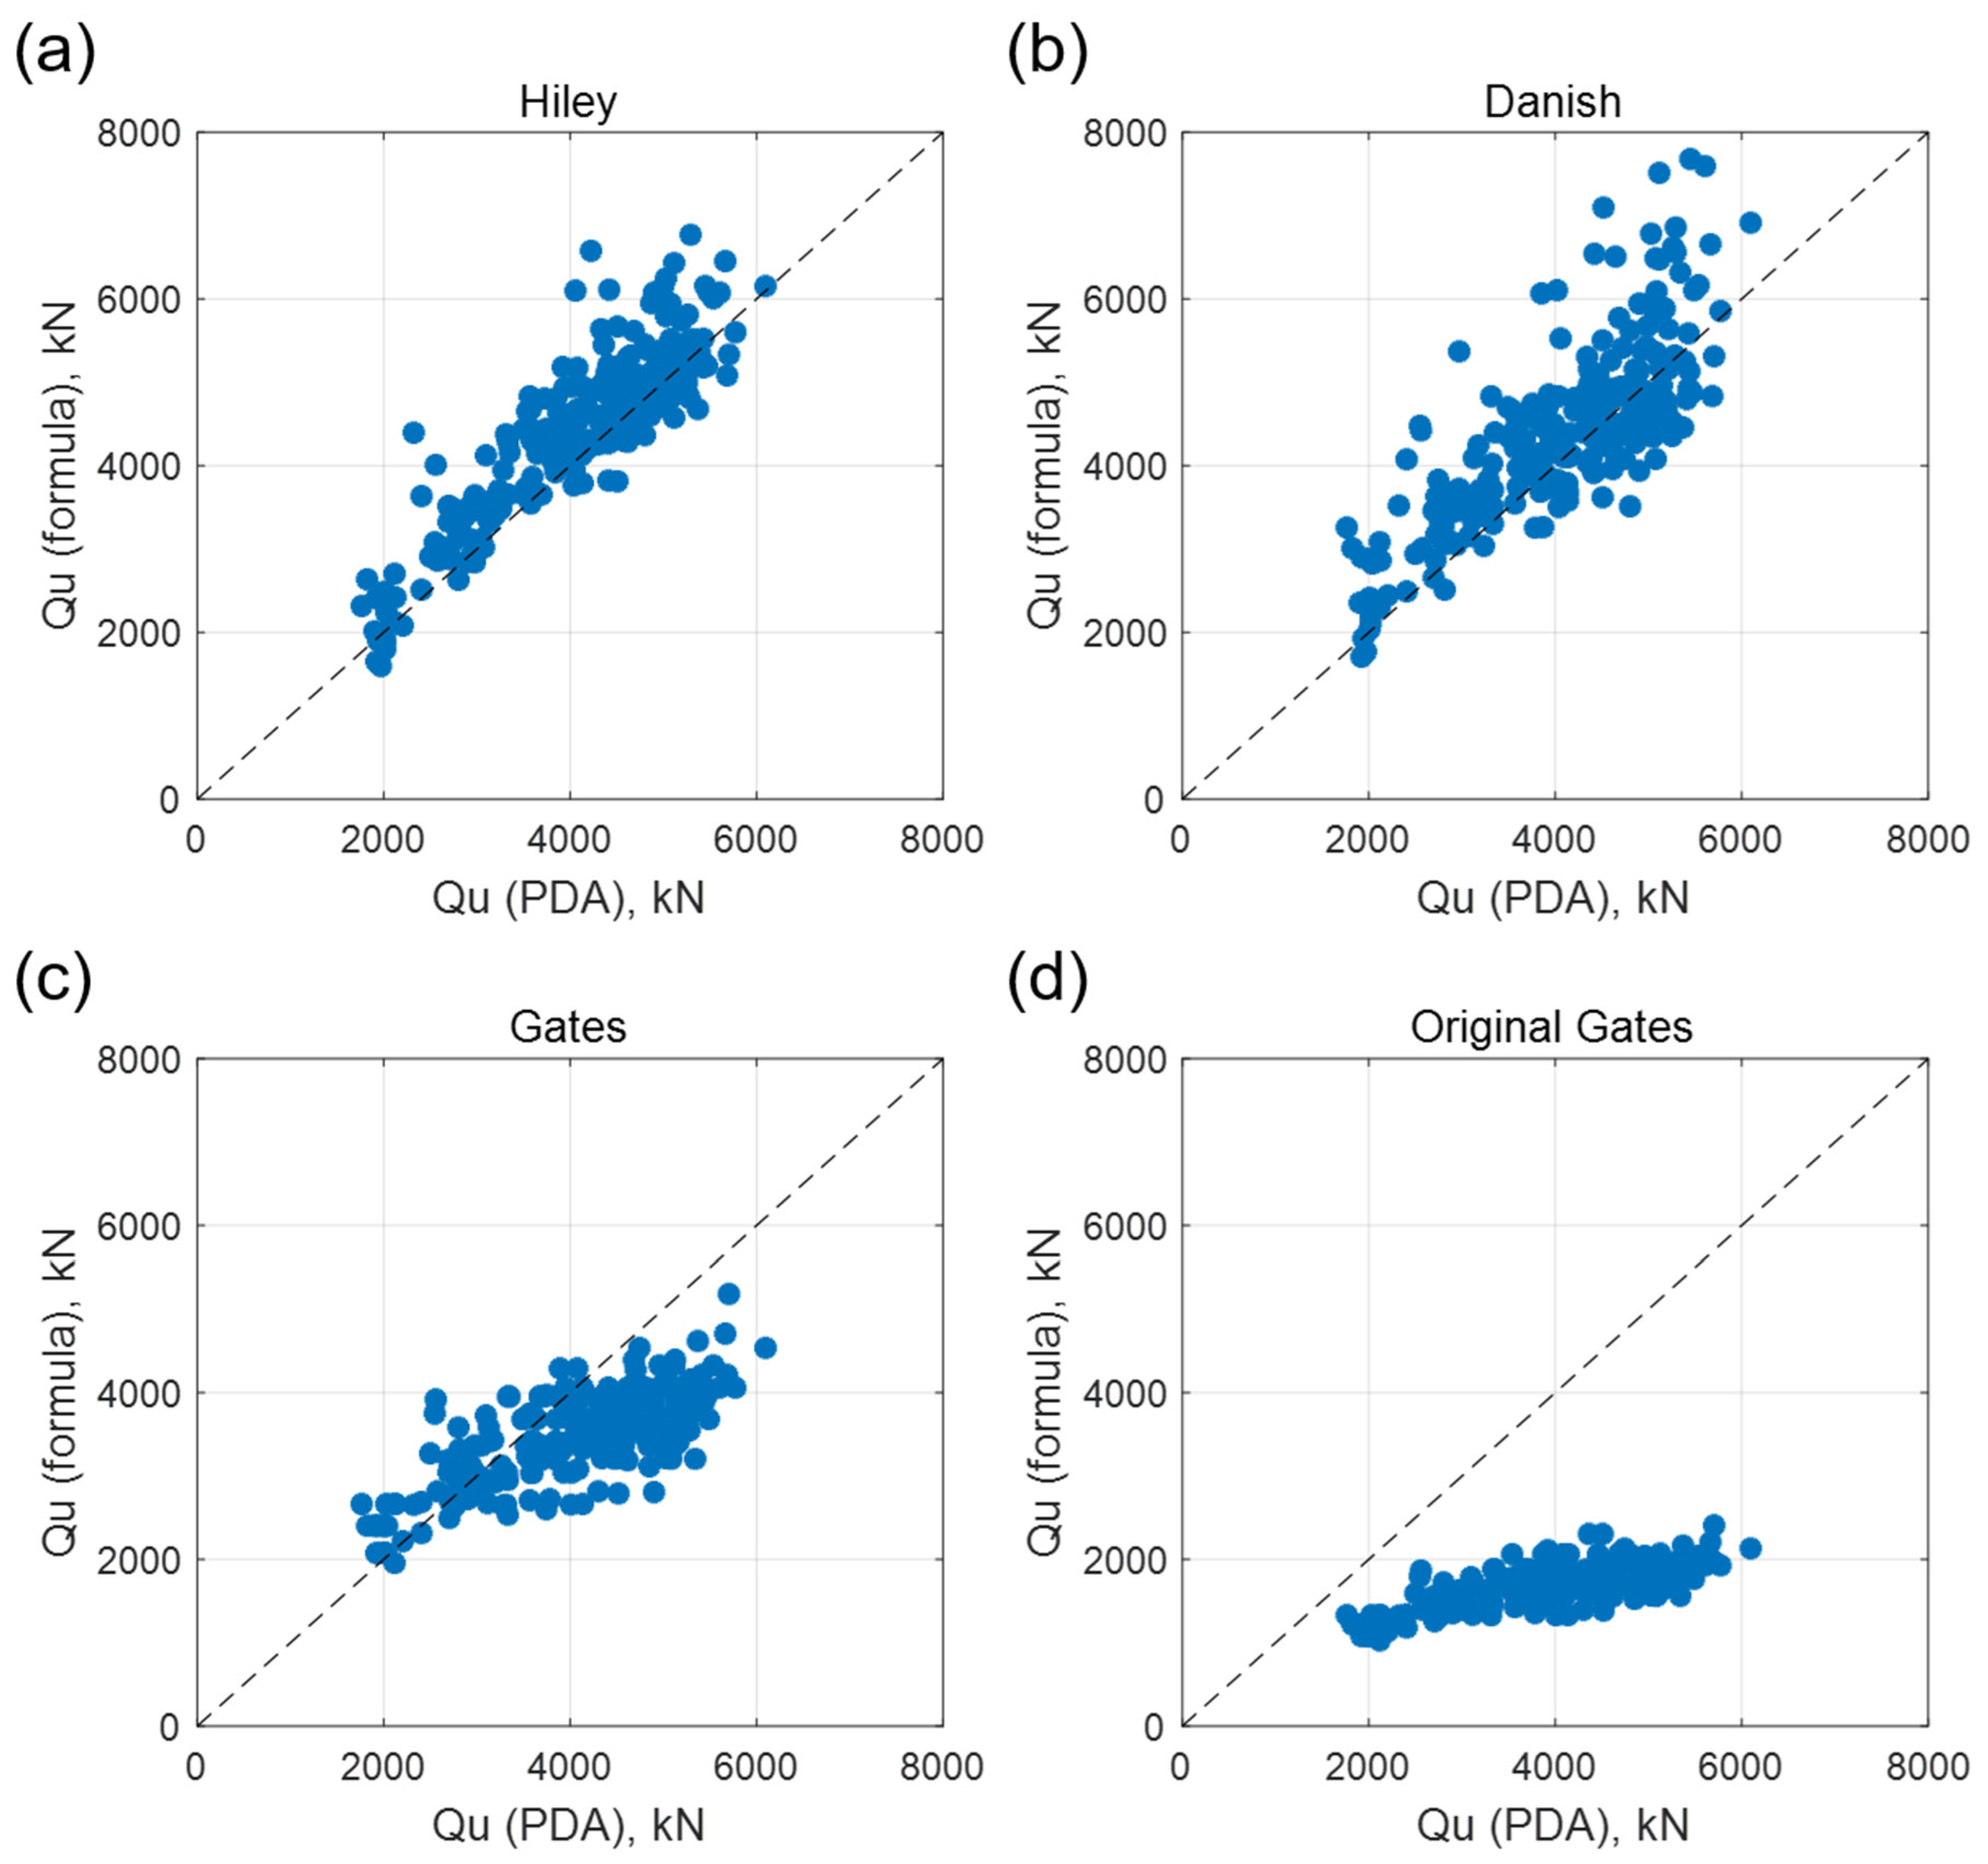
Figure 2 compares the bearing capacity derived from CAPWAP with the results calculated using various pile driving formulas.
Figure 2a shows the comparison with the Hiley formula,
Figure 2b with the Danish formula,
Figure 2c with the Gates formula, and
Figure 2d with the original Gates formula. The closer the data points lie to the 1:1 diagonal line, the higher the accuracy of the pile driving formula. Data points below the diagonal line indicate that the formula underestimates the bearing capacity, while points above it indicate an overestimation.
The comparison reveals that the Hiley formula produces results most similar to the bearing capacity obtained from the dynamic load test. The Danish and Gates formulas also show comparable accuracy, though the Danish formula exhibits a relatively higher degree of variance. In contrast, the Gates formula tends to have less dispersion. Despite not utilizing highly accurate variables obtained from a PDA like the Hiley or Danish formulas, the Gates formula demonstrated creditable accuracy. The original Gates formula consistently produces lower values than those obtained from PDA, indicating very low reliability. Two Gates (original Gates and Gates) formulas exhibit a nonlinear shape, likely due to the inclusion of root and logarithmic terms in their equations, reflecting inherent model limitations.
Further metrics for evaluating the performance of these formulas, such as the mean error, absolute mean error rate, and standard deviation of absolute mean error rate, were calculated (
Table 1). These metrics provide insights into both the accuracy (how close predictions are to actual values) and the consistency (how variable the predictions are) of each formula. Firstly, the mean error can be used to determine whether a formula generally underestimates or overestimates the bearing capacity. The absolute mean error is a measure used to quantify the accuracy of predictions. It is calculated as the average of the absolute differences between predicted values and actual values. A lower absolute mean error indicates that the predictions are, on average, closer to the actual values, suggesting higher accuracy. The standard deviation of errors measures the variability or dispersion of prediction errors around the mean error. A lower standard deviation indicates that the prediction errors are more consistent and closely clustered around the mean error, suggesting more reliable predictions.
The analysis of bearing capacity errors compared to the PDA (Pile Driving Analyzer) results reveals that the original Gates formula has the highest absolute mean error at 56.77% and a corresponding standard deviation of 8.85%. This indicates that the original Gates formula significantly deviates from the PDA values, showing less reliability but small variability, showing high consistency. The high standard deviation further underscores the inconsistency of this formula in predicting accurate bearing capacity values.
In contrast, the Hiley formula demonstrates a more reliable performance, with an absolute mean error of 11.99% and a standard deviation of 11.52%. These values suggest that the Hiley formula estimates closer to the PDA results and exhibits moderate variability. The Danish and Gates formulas also show moderate errors, but the Danish formula exhibits the highest absolute error standard deviations, meaning it is less consistent. However, they are generally more accurate than the original Gates method. Overall, the Hiley method stands out as the most consistent and reliable among the evaluated methods for estimating bearing capacity.
The mean errors reveal that both the Hiley and Danish formulas have a tendency to overestimate the bearing capacity, though the overestimation is relatively small. The Gates and original Gates formulas, on the other hand, tend to underestimate the bearing capacity, with the original Gates formula showing a particularly large underestimation. This analysis highlights the importance of understanding the direction and magnitude of biases in different estimation formulas, with the Hiley formula emerging as the most balanced and reliable among those analyzed.
5. Gates Formula Improvement
5.1. Data Fitting
The comparative analysis demonstrates that the Hiley formula offers the most reliable prediction for pile capacity. However, the Hiley formula requires the rebound value, which occurs momentarily and is challenging to capture, limiting its general application in the field. In contrast, the Gates formula requires only penetration and hammer energy measurements. Due to the ease of obtaining variables and its satisfactory accuracy, the Gates formula gains preference.
No formula can entirely overcome inherent assumptions and errors. Experienced engineers may suggest modifications for greater reliability or adopt a rule-of-thumb approach. Correction coefficients or re-fitting can be established by comparing results from the dynamic load tests [
16]. Thus, this study aims to improve the Gates formula to enhance the usability and reliability of the pile driving formula. The existing Gates formula shows high accuracy in low-capacity ranges (approximately below 3000 kN) but tends to underestimate bearing capacity compared to dynamic load tests as capacity increases [
19]. Moreover, the original Gates formula, initially recommended for use only up to 2650 kN, reflects the lower pile driving energy available at empirical formula creation, making it less applicable to current PHC pile conditions and hammer.
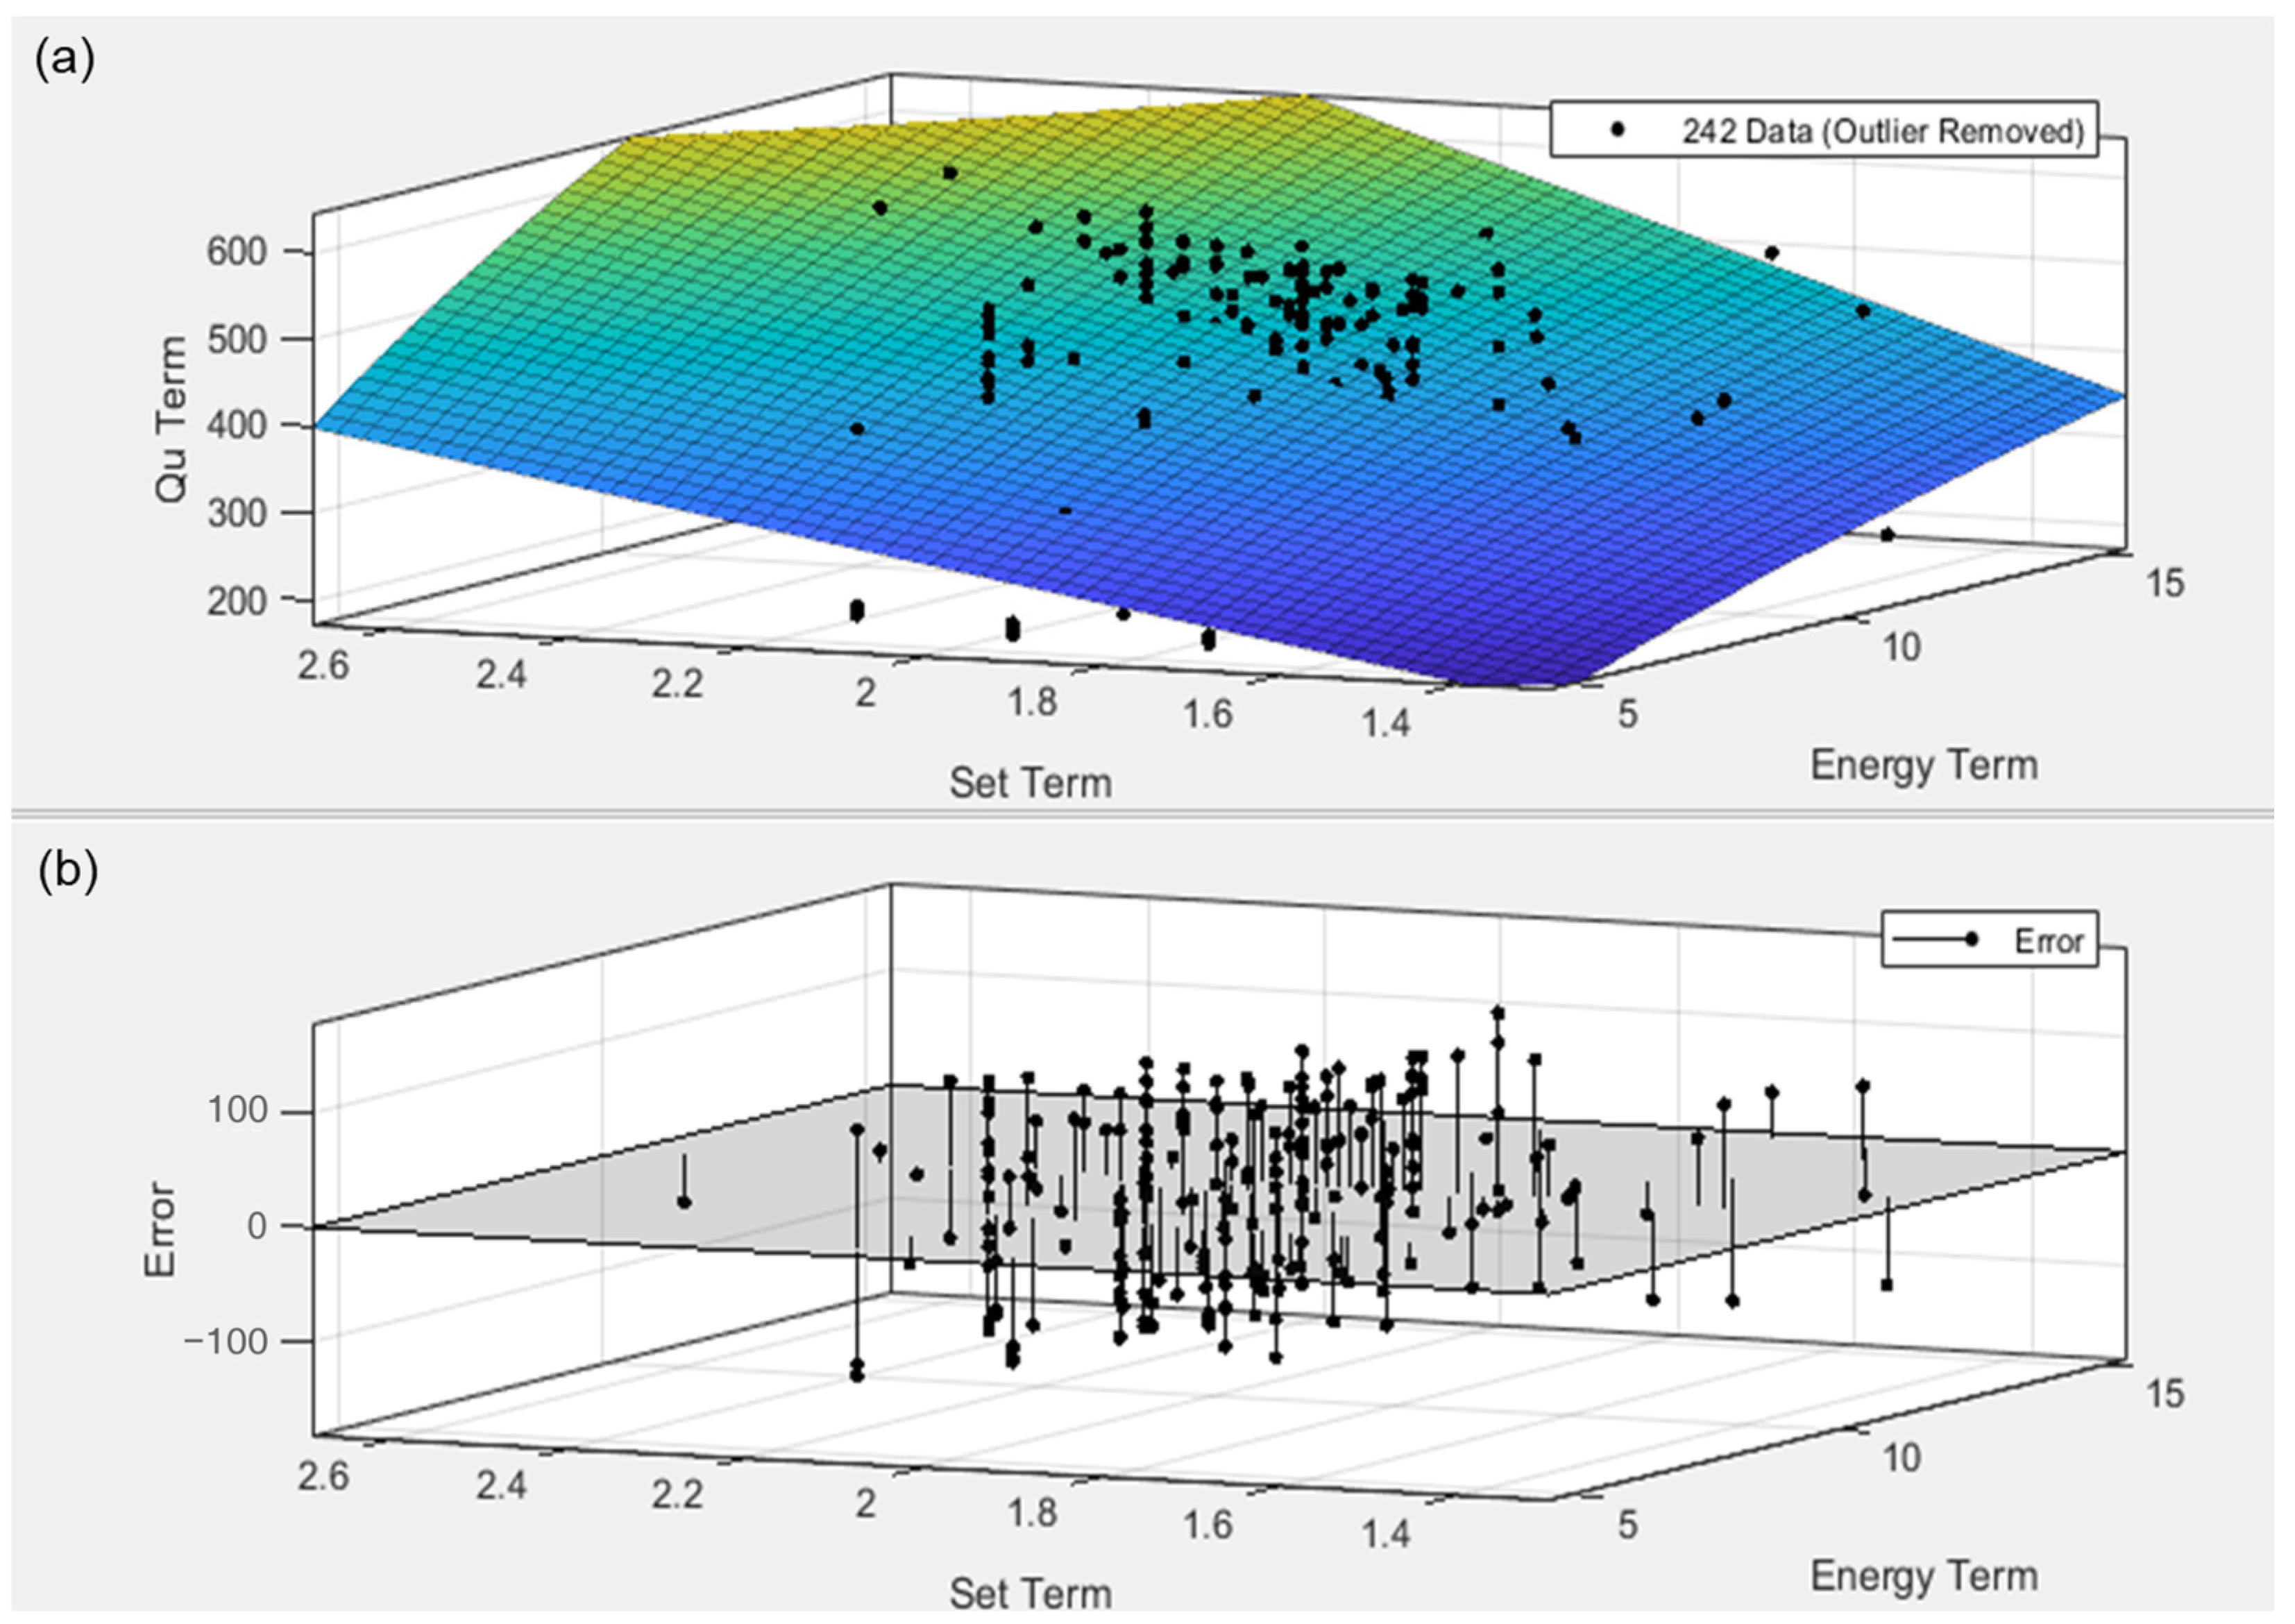
To enhance the accuracy of the Gates formula, two empirical approaches were considered. The first approach involved modifying the constants of the Gates formula using 258 PDA data points. This was achieved through data curve fitting, a process that ensures the reliability of the data used for the fitting. Outliers, defined as cases where values calculated by the three pile driving formulas (Hiley, Gates, and Danish) differed by more than 20% from the bearing capacity value obtained through PDA, were first removed. After excluding 16 outlier cases, 242 data points underwent data curve fitting as shown in
Figure 3.
Figure 3a shows the data fitting for the new formula, while
Figure 3b illustrates the errors of the new formula compared to the 242 data points.
Through iteration, constants were identified to minimize the errors in
Figure 3b. The resulting Gates (PHC) formula is as follows.
where
W = weight of hammer (kN),
H = height of hammer (m),
N = number of blows to penetrate 25.4 mm.
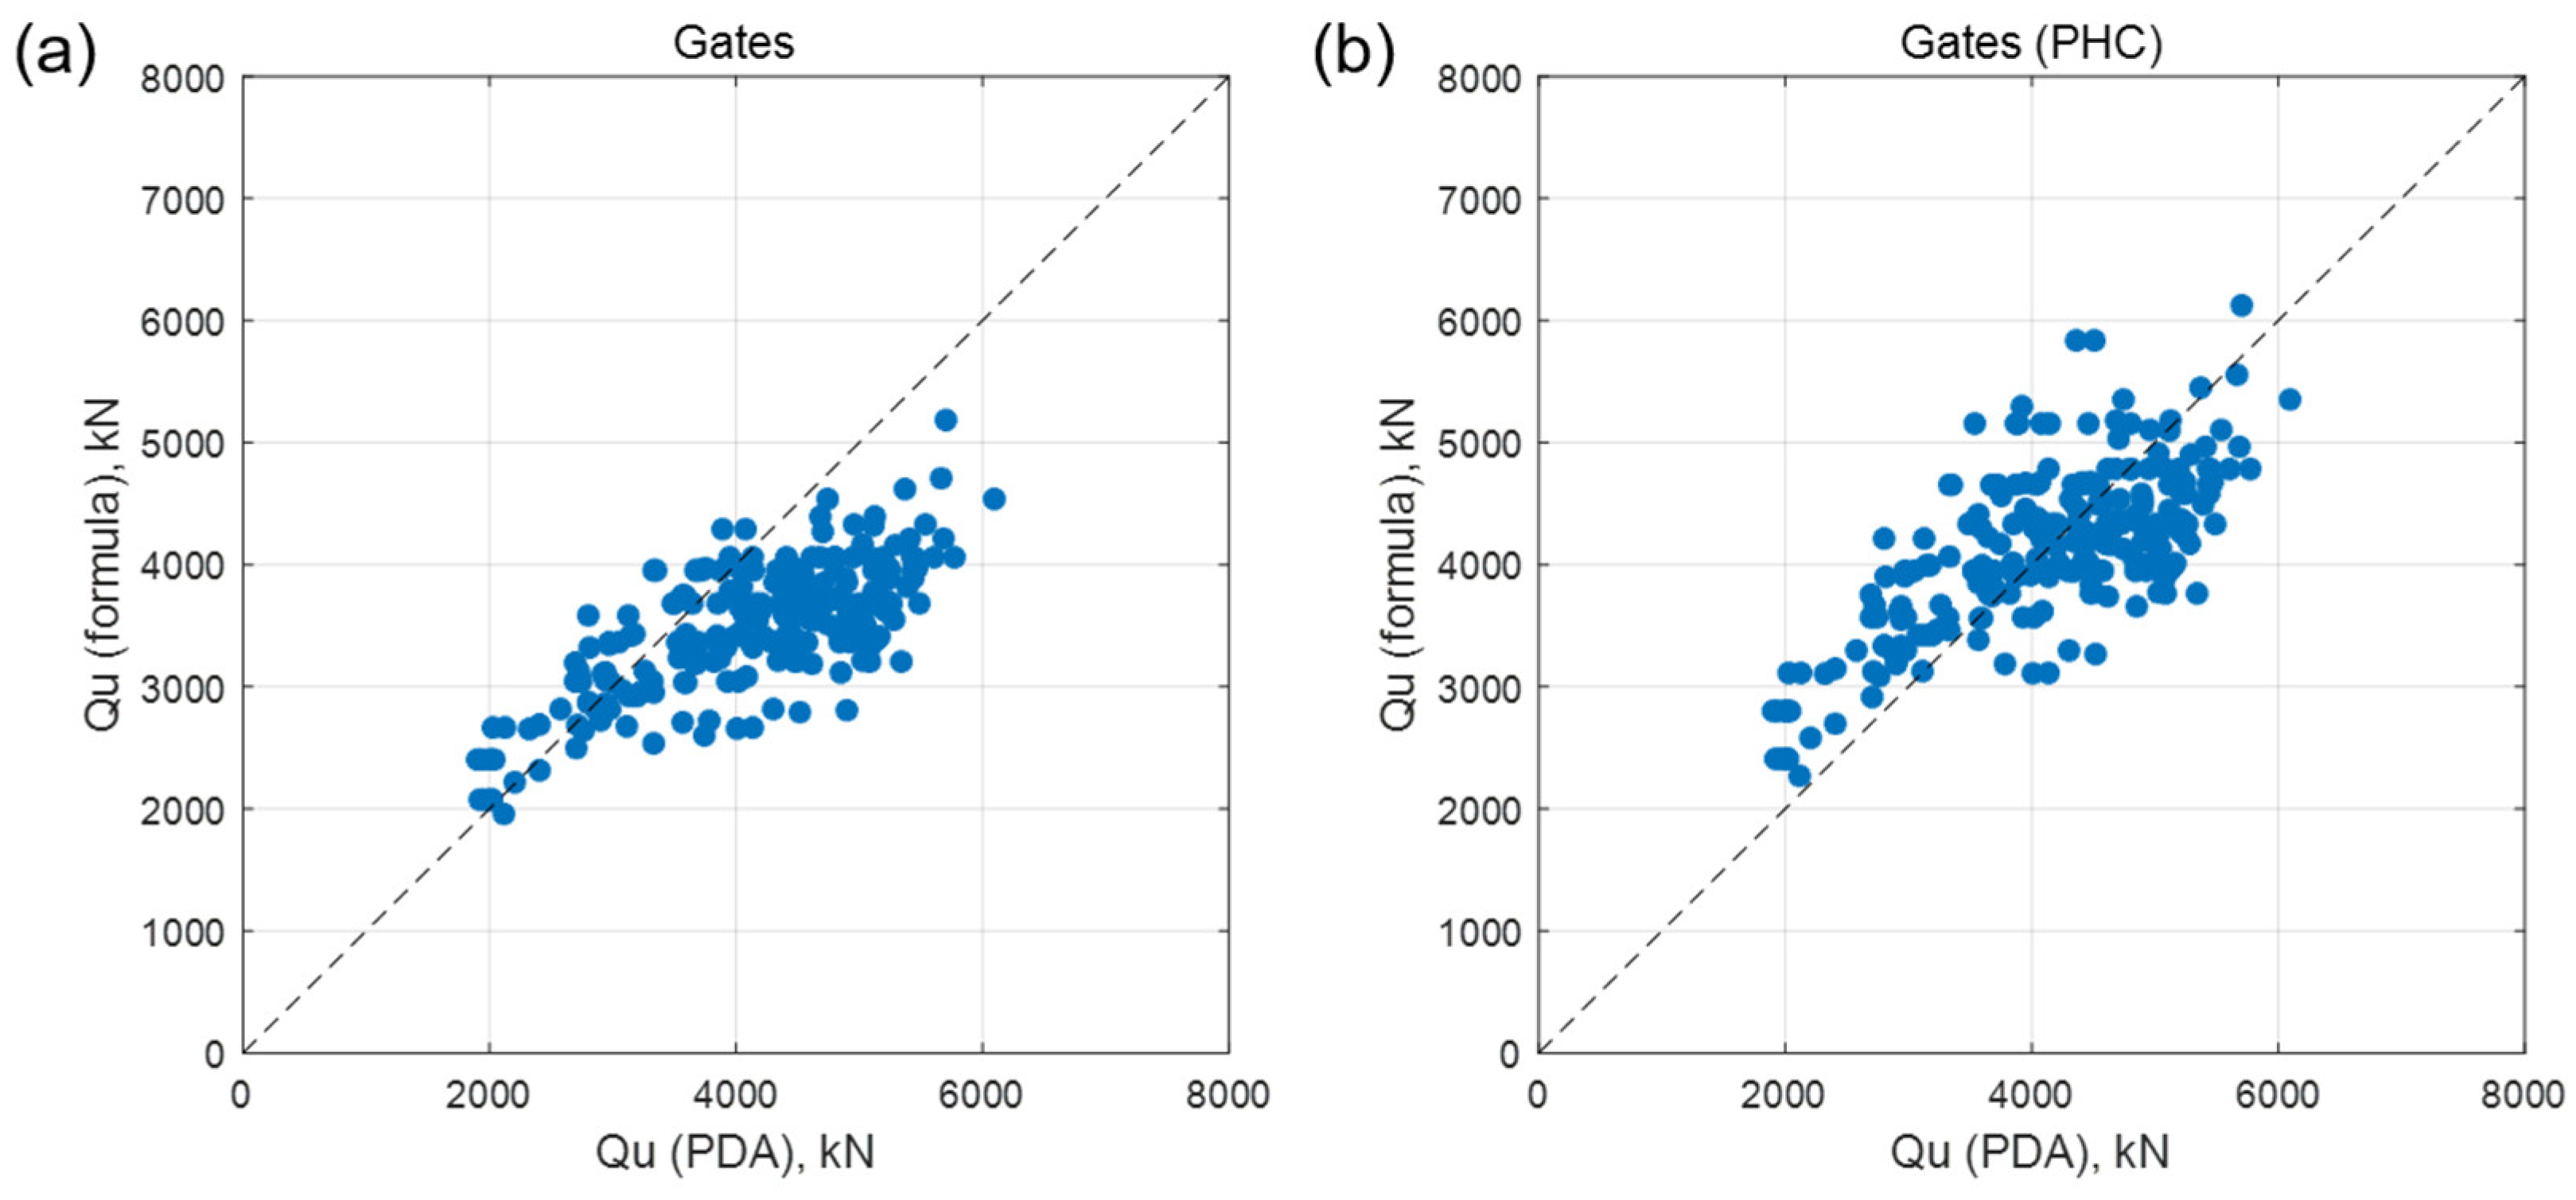
The improved Gates formula, the Gates (PHC) formula was used for a comparison with the PDA results (
Figure 4).
Figure 4a shows the comparison between the traditional Gates formula and the PDA results, while
Figure 4b presents the comparison between the Gates (PHC) formula and PDA results. The Gates (PHC) formula shows a significant reduction in the underestimation of values beyond 3000 kN. However, Gates (PHC) displays a slight underestimation trend beyond 5000 kN, with an increase in variance compared to the Gates. Compared to the Gates formula, although the dispersion in Gates (PHC) increased, the accuracy definitely improved.
5.2. Coefficient
The second approach for improving the accuracy of the formula involves applying coefficients. Unlike other pile driving formulas, the Gates formula shows a nonlinear trend when comparing the bearing capacity with the PDA. In such cases, applying coefficients based on segmented intervals can significantly improve the accuracy of the formula. Four intervals were defined to closely match the values calculated by the Gates formula and Gates (PHC) values with those obtained using the PDA (Pile Driving Analyzer), and coefficients were applied accordingly. These four intervals were determined using two approaches. The first approach applies coefficients at every 1000 kN, with segments of ≤3000 kN, 3000–4000 kN, 4000–5000 kN, and >5000 kN. The second approach calculates and applies coefficients by optimizing the segments through the iteration process. Two approaches were applied to the original Gates and the Gates (PHC) formula discussed in
Section 5.1.
The coefficients determined using the first approach are summarized in
Table 2. The Gates formula with the applied coefficients is named Gates (Coef), and the Gates (PHC) formula with the applied coefficients is named Gates (PHC Coef).
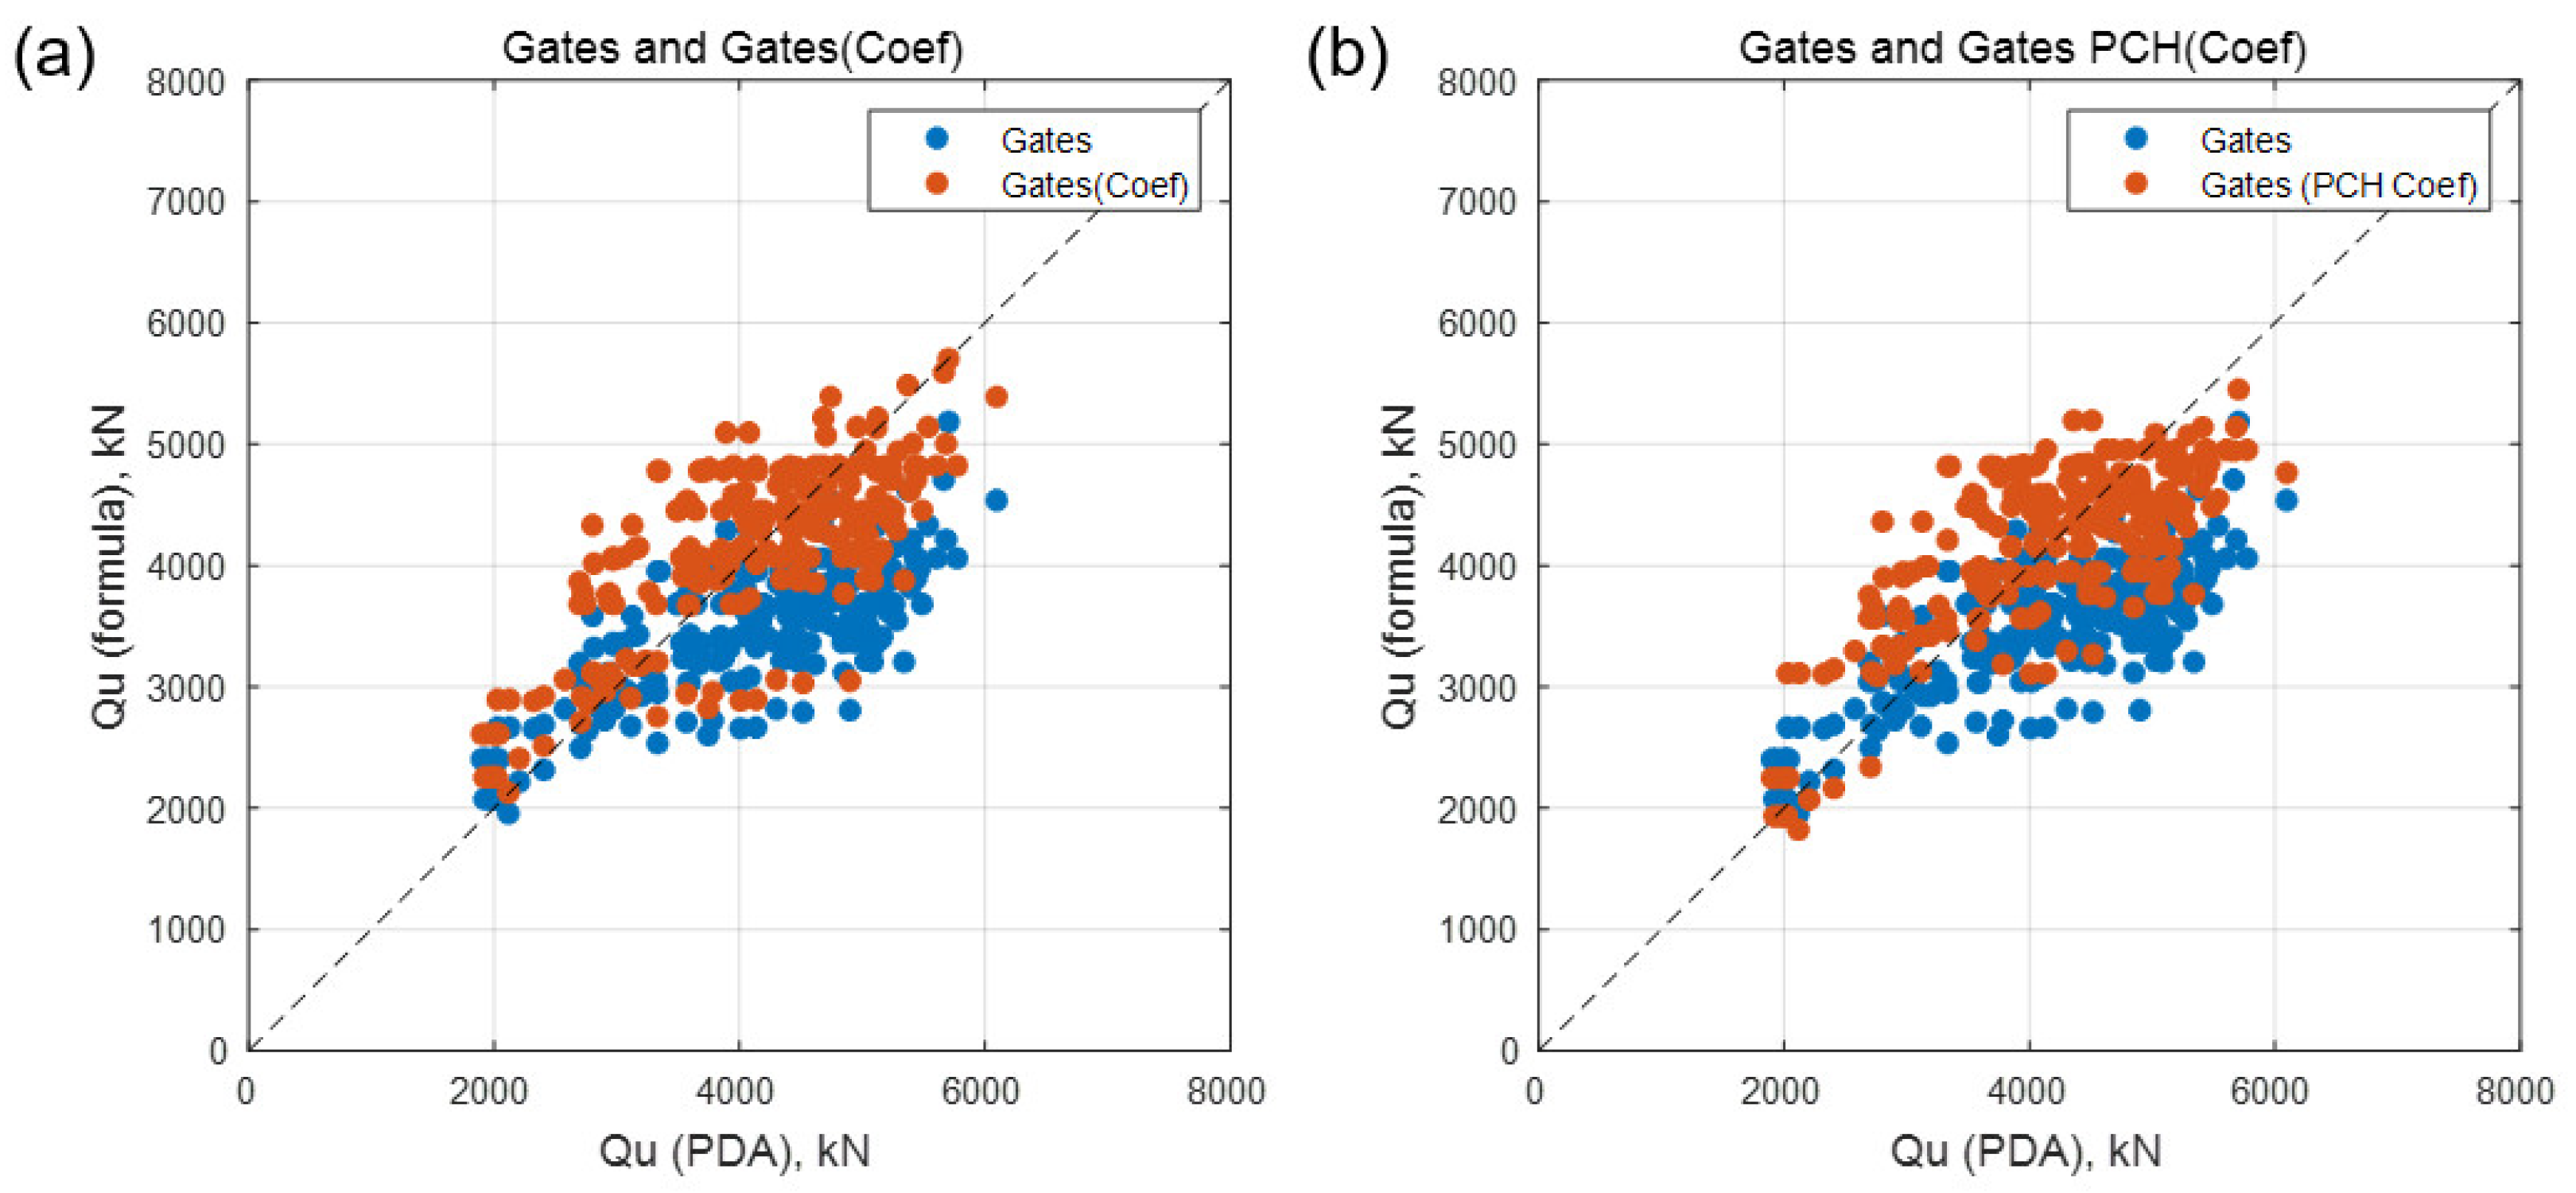
Figure 5 shows the results of applying the coefficients to each section.
Figure 5a presents the results of applying the coefficients to the Gates formula. In contrast,
Figure 5b presents the results of applying the coefficients to the Gates (PHC) formula, comparing them with the existing formula. Based on
Figure 5, applying the coefficients to both formulas results in an overall increase in accuracy.
The second approach, through an iterative process, determined not only the coefficients but also the optimized segments. These segments round to the nearest ten units. The optimized segments and coefficients are summarized in
Table 3.
The comparison of the Gates formula with the results of applying the optimal interval coefficients is shown in
Figure 6.
Figure 6a presents the results of using the optimal interval coefficients of the Gates formula, named Gates (Coef2). In contrast,
Figure 6b presents the results of applying the optimal interval coefficients to the Gates (PHC) formula, named Gates (PHC Coef2). From a statistical perspective, there is an improvement in accuracy by applying the optimal coefficient. However, as shown in the two comparison graphs, a significant data gap between 3300 and 4000 kN is observed. The intervals could cause this gap, and the coefficients applied may have shifted the original Gates values away from this specific range. Alternatively, this gap might result from a relatively low amount of data within this interval. Despite the statistical improvement in accuracy, the presence of this gap suggests that caution is necessary when using this method.
5.3. Summary of Improved Gates Formula
In this section, two different methods were introduced to improve the Gates formula. The first approach utilizes 242 PDA data points from this study to modify the constants of the Gates formula through data curve fitting. The second approach to enhancing the accuracy of the formula involves applying coefficients. The improved results obtained from both methods, along with the statistical results of the existing pile driving formulas, are summarized in
Table 4.
The mean error analysis indicates that Gates (PHC) significantly addresses the previous tendency to underestimate, as demonstrated by the improvement. The absolute mean error decreased from 17.52% to 14.71%, indicating enhanced accuracy. Although the variance of the error slightly increased, the absolute value itself remained small.
Optimized coefficients resulted in a Gates (Coef) value with an absolute mean error of 13.41% compared to the bearing capacity derived from the PDA values. All values moved closer to zero, confirming a significant improvement in accuracy. Applying the optimized coefficients to the Gates (PHC) formula resulted in an absolute mean error of 13.35% compared to the bearing capacity from the PDA values, showing a slight improvement over the Gates (Coef) formula.
The results of applying the optimal interval coefficients for both cases (Gates (Coef2) and Gates (PHC Coef2)) demonstrated the most significant statistical improvement across all values compared to previous examples. However, as observed in
Figure 6, this method induces a data gap in specific intervals, making its use less advisable. A more detailed analysis with finer intervals than the four used in this study could mitigate this issue, but this would require the collection of more data under diverse conditions. Comprehensive analysis of all results indicates that the Hiley formula exhibits the lowest mean absolute error and generally has the smallest mean absolute standard deviation, demonstrating the highest accuracy. Nonetheless, various improvement measures attempted for the Gates formula have also significantly enhanced its accuracy. Consequently, the newly fitted Gates (PHC) and the Gates (PHC) with interval coefficients (Gates (PHC Coef)) have proven suitable for improving the Gates formula. However, as Gates (PHC Coef) lacks sufficient justification for the interval range, caution or further research is recommended.
Given that this study employed the highly accurate EMX values derived from the PDA measurements, the improved Gates formulas are expected to have similar or higher accuracy in field applications where a PDA cannot always be used, thus demonstrating high practical utility.
6. Verification of Formulas Using Additional Data
This section presents additional verification of the formulas used in the study by comparing their predictive performance against the actual bearing capacity values obtained from the PDA (Pile Driving Analyzer) measurements. A total of 60 data points were used for verification, collected from 7 different sites (
Table 3). Out of the 60 data points, 39 were collected from 4 different sites using 600 mm diameter PHC piles and 21 data points were collected from 3 other sites using 500 mm diameter PHC piles. The 500 mm diameter data were utilized to examine the sensitivity of the formulas to different pile diameters. The study results underwent verification using the same methods employed in earlier sections. The formulas under consideration include the Hiley, Original Gates, Gates (PHC), Gates (Coef), Gates (PHC Coef), Gates (Coef2), and Gates (PHC Coef2) formulas. The Danish formula was excluded from verification due to missing variables in the collected data.
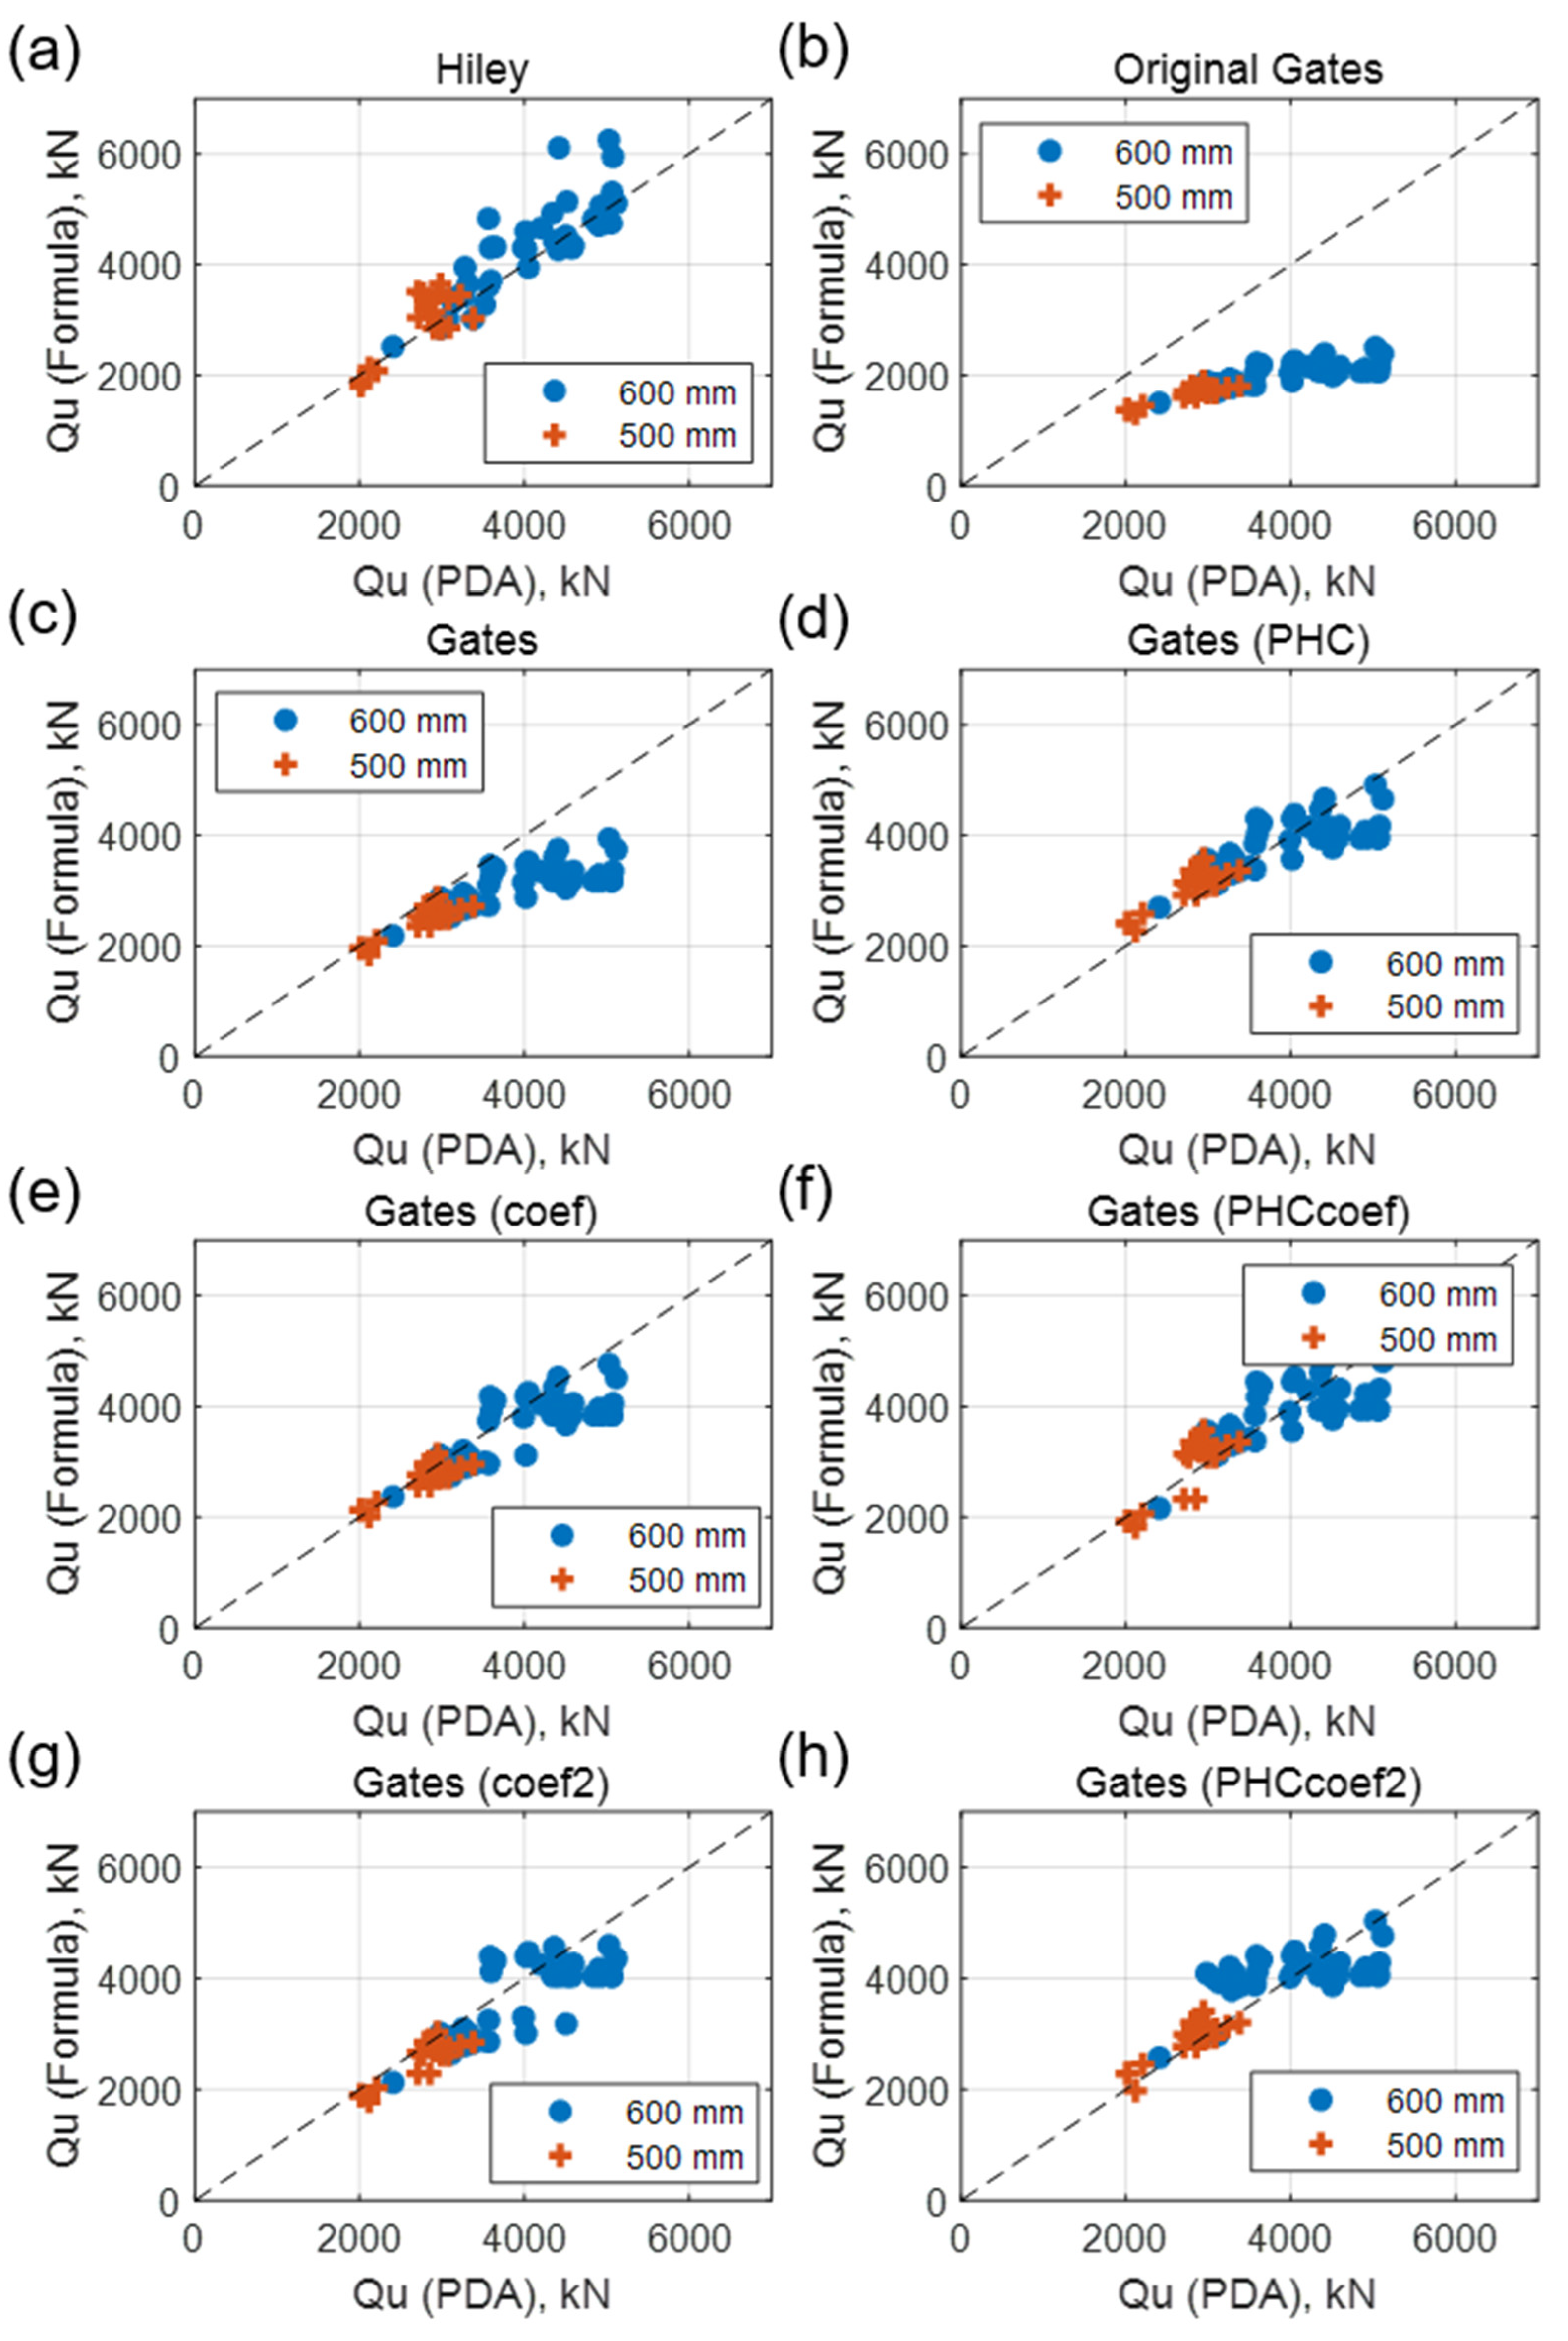
Figure 7 shows the comparison of the bearing capacity values obtained from 60 dynamic load tests with those calculated using the driving formulas, with the 500 mm diameter data marked in red and the 600 mm diameter data marked in blue.
As shown in the figure, the Hiley formula demonstrates reasonable accuracy, while the original Gates formula tends to underestimate all values. Gates also shows a decline in accuracy beyond 3000 kN. The improved formulas, Gates (PHC), Gates (Coef), and Gates (PHC Coef), exhibit enhanced accuracy. The Gates (Coef2) and Gates (PHC Coef2) formulas also show improvement, but, similar to previous results, a gap was observed.
Data obtained from the 500 mm diameter piles generally showed lower bearing capacity values compared to the 600 mm data due to the influence of pile size. Therefore, the Gates formula, which has high accuracy for bearing capacity calculations below 3000 kN, showed similar results to the bearing capacity values obtained from the PDA for the data acquired with the 500 mm diameter piles. Overall, no differences were found based on pile diameter.
The statistical results are summarized in
Table 5,
Table 6 and
Table 7 for detailed verification. The tables present the mean absolute error rates, standard deviations of absolute error rates, and mean error rates for each method.
Table 6 shows the 21 data points for a 500 mm diameter, and
Table 7 shows the combined 60 data points.
Table 5 shows the statistical results using 39 data points for a 600 mm diameter PHC pile. Although the verification used a small dataset of 39 samples, the results showed that the Hiley formula achieved the highest accuracy, consistent with previous findings. The Gates (PHC) and Gates (PHC Coef) formulas demonstrated the highest accuracy among the improved Gates formulas. Specifically, the absolute mean error significantly dropped from 20% to around 10%. In contrast, the method employing optimal intervals and coefficients optimized using 242 data points showed lower accuracy than other improved Gates formulas, leading to negative results regarding its practicality during the verification stage.
In contrast,
Table 6, which uses data from 21 sets of 500 mm diameter PHC piles, shows results slightly different from previous findings. Compared to the analysis with the 600 mm diameter data, the Gates formula demonstrates much higher accuracy. The reason is that most of the data fall within the range of 3000 kN or less, where the Gates formula operates accurately. Among all formulas, the Gates (Coef) shows the highest accuracy. This is because the Gates (Coef) applies an optimized coefficient to the Gates formula for specific ranges, resulting in improved accuracy. Although their accuracy is relatively lower compared to other formulas, the previously recommended Gates (PHC) and Gates (PHC Coef) showed absolutely better accuracy than the results using 242 data points, confirming their successful verification.
Lastly, the analysis using all data confirms that the Gates (PHC), Gates (Coef), and Gates (PHC Coef) formulas exhibit the highest accuracy (
Table 7). The difference in the accuracy order of the formulas between the results using 60 data points and the previous 242 data points arises due to the data distribution. The previous dataset of 242 data points predominantly included the 600 mm diameter PHC pile data, with a significant proportion showing bearing capacities greater than 3000 kN. In contrast, the verification dataset had 30% of the data with bearing capacities of 3000 kN or less, which increased the accuracy of the Gates and Gates (Coef) formulas. Despite the difference in the accuracy order, the absolute mean error and absolute error standard deviation values showed better results, ultimately proving the validity of the formulas.
Although the number of data points is limited, considering previous test results and verification results, the following conclusions can be suggested: (1) For PHC piles with a diameter of 500 mm or less, the Gates (Coef) or Gates (PHC) or Gates (PHC Coef) formulas are recommended. (2) For PHC piles with diameters greater than 500 mm, the Gates (PHC) or Gates (PHC Coef) formulas are recommended.
In conclusion, obtaining highly accurate variables like those used in the Hiley formula presents limitations. Therefore, improving and utilizing the Gates formula, which consists of easily obtainable variables, offers high practical utility.
7. Discussion and Conclusions
Due to time savings and efficiency in construction, piles often rely on penetration amounts for the remaining piles after performing dynamic load tests (DLT). For these remaining piles, using pile driving formulas that consider penetration amount and driving energy, rather than solely relying on penetration amounts for construction quality control, enhances reliability. However, other pile driving formulas face reliability issues, except for the Hiley formula. Furthermore, a formula optimized for PHC piles, widely used in Asia, is required. Therefore, this study reviewed the applicability of representative existing pile driving formulas using 258 dynamic load test data points and further improved these formulas to increase their applicability to pile construction management. Finally, using an additional 60 dynamic load test data points, the findings of this study were verified, and a sensitivity analysis of pile diameter was conducted. The contents of the study are summarized as follows:
- (1)
The review of pile driving formulas included the Hiley, Gates, Danish, and original Gates formulas. The Hiley formula showed the highest accuracy with an average absolute error of about 12% compared to the dynamic load test. The high accuracy of the Hiley formula in this study resulted from using EMX and well-estimated rebound values obtained through the PDA. The Danish and Gates formulas showed similar trends to the dynamic load test but had an average absolute error of around 16%, indicating lower accuracy than the Hiley formula. The original Gates formula exhibited accuracy that was too low to be practical.
- (2)
Although the Hiley formula demonstrated high accuracy, the rebound value, used as a variable in the formula, must be measured accurately, which is challenging. As an alternative, an improved formula based on the Gates formula was proposed, with easier variable acquisition. Specifically, the Gates formula showed results similar to the dynamic load test results for values below approximately 3000 kN. However, for values above 3000 kN, the calculated bearing capacity generally appeared lower, necessitating improvement. To make these improvements, 242 dynamic load test data points, excluding outliers, were used, and the optimal constants satisfying the data were derived through curve fitting. The enhanced Gates formula (Gates (PHC)) with new constants demonstrated significantly improved accuracy compared to the original Gates formula.
- (3)
The Gates and Gates (PHC) formulas tend to underestimate bearing capacity as it increases due to the non-linear characteristics of the model. Therefore, different coefficients were applied for each segment of bearing capacity calculated from the Gates formula to overcome this shortcoming. Two approaches were used for applying coefficients: one approach (1) involved dividing the segments by 1000 kN and applying coefficients to each segment, and (2) the other involved determining the optimal segments and applicable coefficients through iteration. Both methods improved accuracy compared to the original Gates formula, but the iteration method created data gaps, making it insufficient for use. The study results showed that the Gates (PHC Coef) formula has high accuracy, but the definition of the interval range for this formula is not justified. Therefore, the Gates (PHC) formula is a safe choice, and considering the overall results, Gates (PHC Coef) is also worth considering.
- (4)
To verify the results and conduct a sensitivity test on pile size, 60 additional data sets were used. The additional data consist of 39 data sets for 600 mm diameter piles and 21 data sets for 500 mm diameter piles. The verification results showed that, regardless of the presence of the 500 mm diameter data, both the Gates (PHC) and Gates (PHC Coef) formulas demonstrated higher accuracy compared to the initial study results, confirming the validity of the improved formulas.
- (5)
The 500 mm data generally showed lower bearing capacity, which resulted in Gates and the Gates (Coef) formulas showing higher accuracy compared to the 600 mm diameter data. Consequently, for piles with a diameter of 500 mm or less, the Gates (Coef), Gates (PHC), or Gates (PHC Coef) formulas are recommended. For PHC piles with diameters greater than 500 mm, the Gates (PHC) or Gates (PHC Coef) formulas are recommended.
In this study, 258 dynamic load test data points were used, with an additional 60 data points employed for verification. The results indicated that the improved Gates formula, Gates (PHC), with applied coefficients, demonstrated accuracy close to that of the Hiley formula. The data and conditions used in the research (drop hammer, PHC pile, 600 mm diameter) were limited, and the research proceeded without specific site ground conditions. Further research, with more data covering various site conditions, would likely enhance the practical applicability of the proposed formula and coefficients.


