Article

Groundwater Discharge Limits of Mountain Tunnels Based on the Normal Growth of Typical Herbaceous Plants

1
Institute of Future Civil Engineering Science and Technology, Chongqing Jiaotong University, Chongqing 400074, China
2
School of Civil Engineering, Chongqing Jiaotong University, Chongqing 400074, China
*
Author to whom correspondence should be addressed.
Appl. Sci. 2024, 14(15), 6561; https://doi.org/10.3390/app14156561
Submission received: 14 June 2024 / Revised: 23 July 2024 / Accepted: 24 July 2024 / Published: 26 July 2024
(This article belongs to the Special Issue Tunnel and Underground Engineering: Recent Advances and Challenges)

Abstract

:
The construction of mountain tunnels can lead to groundwater loss and severely impact plant growth. In order to study the limited discharge of groundwater in mountain tunnels for the normal growth of typical herbaceous plants, a tunnel in the alpine meadow area of Qinghai Province was taken as the research objective. Based on transplant experiments, numerical simulations, and the empirical calculation of tunnel discharge limits, the minimum water level required for the normal growth of herbaceous plants, groundwater changes, and grouting parameters during tunnel construction, as well as limited discharge values of groundwater based on the normal growth requirements of plants, were studied. The results indicate that when the groundwater level declined by 0.6–0.8 m, herbaceous plants were able to normally grow. Generally, tunnel excavation lowered the groundwater level so that the normal growth of herbaceous plants was significantly affected. The reasonable grouting parameters were obtained by numerical simulation. They were able to ensure that the groundwater level decline was less than 0.8 m and ultimately recovered to over 90% of the pre-construction level. The herbaceous plants in Qinghai’s alpine grasslands were able to normally grow when the groundwater discharge limit was 0.2~4.0 m3/(m·d). This research offers guidance and support for managing groundwater discharge during tunnel construction in ecologically fragile areas, such as the Three Rivers Source in Qinghai.

1. Introduction

As an important underground engineering solution to overcome terrain obstacles in mountainous areas, tunnels have a complex relationship with groundwater. In transportation construction, they can improve alignment, shorten mileage, save time, and reduce damage to vegetation. However, the excavation of mountain tunnels is affected by groundwater, and a large amount of water inflow can lead to sudden water and mud accidents. If too much groundwater is discharged during construction, it can cause serious consequences such as surface collapse, the depletion of water wells, and the death of vegetation [1,2,3,4]. Therefore, it is of great significance to study the requirements of vegetation protection for mountain tunnels on the groundwater level during tunnel construction and to regulate the variation of the groundwater level during tunnel construction. Surface vegetation is significantly affected by groundwater, and changes in groundwater depth can influence the physical and chemical properties of soils, thereby affecting vegetation growth [5]. Especially in arid areas, groundwater level fluctuations are a key factor affecting ecosystems [6,7]. Compared with water stress caused by drought, water stress induced by tunnels has a greater impact on eco-hydrological vulnerability, and the growth dynamics of forest trees may not be fully restored [8]. Therefore, the relationship between groundwater level and vegetation growth has become a hotspot in mountain tunnel construction. The demand for groundwater level varies greatly in different plants. For example, the salt tolerant and high nutrient crop quinoa is able to grow at a non-saline groundwater depth below 1.62 m [9]. The groundwater threshold depth of the seven-year protective forest in Hetao Irrigation District is 3.6 m, beyond which the transpiration of the forest belt is extremely low, affecting its growth [10]. When the groundwater depth of wheat is maintained between 0.5 m and 0.6 m under appropriate fertilization levels, the wheat grain yield reaches its maximum or near stability [11]. Wang et al. [12] used plant stem xylem, soil moisture, and groundwater to determine that the water source of Populus euphratica seedlings in the Tarim River Basin is a shallow soil layer of 0–80 cm. Xu et al. [13] integrated tunnel factors into the assessment framework of the soil–plant–atmosphere continuum (SPAC) to assess the vulnerability of vegetation at the regional scale.
During the construction of mountain tunnels, a large amount of water will be generated [14], leading to a significant decline in the groundwater level, and an asymmetric depression funnel will form at the same elevation water level [15]. Zhang et al. [16] introduced a similarity index indicating a low correlation between tunnel water inflow and surface water. Zhang et al. [17] proposed a method for predicting the degree of water inrush hazards based on the random forest algorithm. Fu et al. [18] derived calculation equations for allowable and total displacement that can be used to predict actual displacement. Gokdemir et al. [19] combined engineering and environmental perspectives and believed that the maximum impact range on the tunnel axis was 90 m. Most tunnels have an impact area of less than 5 m. Different grouting modes [20] and grouting materials [21] can be used to reduce groundwater level decline and ensure the safety of tunnel construction. When the water inflow of the tunnel was 0.69 m3/(m∙d) and the external water pressure of the tunnel lining was 0.58 MPa, the thickness of the grouting ring for tunnels similar to Hongtuzhang had to be 8 m, and the permeability coefficient of the grouting ring had to be 1.61 × 10⁻⁸ m/s [22].
To investigate the interaction between the normal growth of typical vegetation and the depth of underground water in tunnel construction, the typical plants in the Maixiu Protection Zone of the Sanjiangyuan National Nature Reserve in Qinghai Province (an ecologically fragile area) are taken as the research object. The influence of different groundwater levels on plant growth status is studied by planting experiments. The variation laws of groundwater level and drainage amount during tunnel construction are studied by means of numerical simulation. The influence of different grouting parameters on groundwater level is also analyzed by means of numerical simulation. Finally, the limited drainage value based on normal growth of vegetation is proposed. The results can provide a reference and support for groundwater discharge management in tunnel construction in ecologically fragile areas similar to the Three Rivers Source in Qinghai.

2. Materials and Methods

Taking the Maixiu Nature Reserve of Qinghai Sanjiangyuan National Nature Reserve as the research area, through data collection and analysis, it was found that the dominant species in alpine meadow soil are Artemisia scoparia, Artemisia annua, and Stipa. The proportion of Artemisia annua and Stipa is relatively high in this region. Experiments on the growth of Artemisia annua and Stipa under different water levels were conducted to study the minimum water level requirements for their growth.

2.1. Experimental Preparation and Implementation

Figure 1 shows a model diagram of plant growth experiments at different groundwater levels, with the experimental plants, soil, groundwater, and filter layer arranged from top to bottom. The maximum groundwater depth set in this experiment was 100 cm, and different groundwater depths were simulated by adjusting the soil height. The groundwater level was 40 cm away from the bottom of the test box, in which 10 cm of fine sand was placed on the bottom of the filter layer, followed by 30 cm of gravel. A PVC plastic pipe with an outer diameter of 2 cm was installed in the gravel layer as the inlet and outlet, and a valve was installed on the water pipe.
Groundwater level is one of the main factors affecting soil moisture content, and the vertical distribution of soil moisture content increases with the increase in soil depth [23]. This experiment set up four different heights of soil layers (H) to simulate different groundwater depths, namely, 100 cm, 80 cm, 60 cm, and 40 cm. The experimental plants were Artemisia annua and Stipa. Three different soil moisture contents were designed, with an average soil moisture content of 15%, 25%, and 30% for Artemisia annua and 15%, 20%, and 25% for Stipa. There were a total of 10 working conditions (see Table 1). The initially measured soil moisture content is shown in Table 1. This experiment lasted for 30 days, during which plant growth was observed, and vegetation growth height and soil moisture content were measured every 2 days.

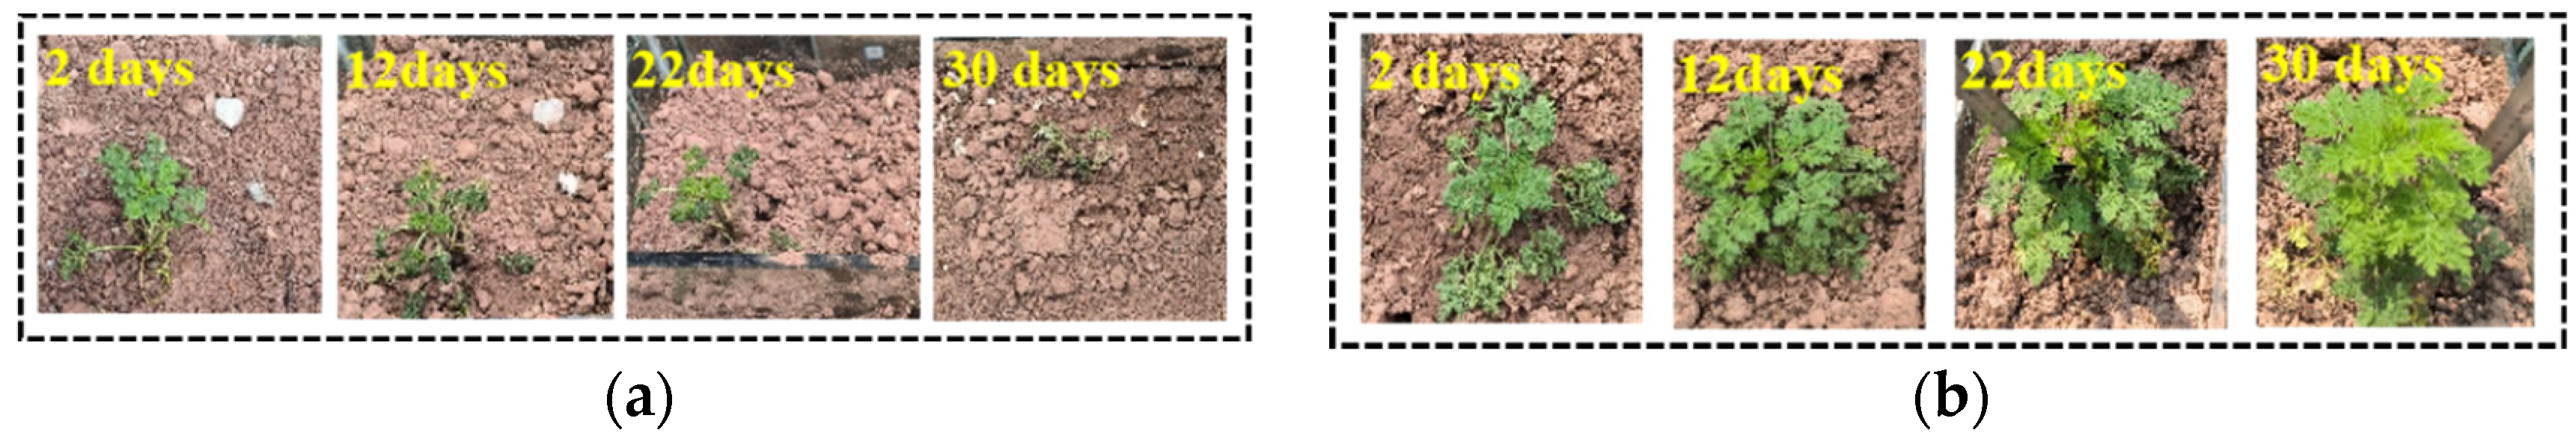
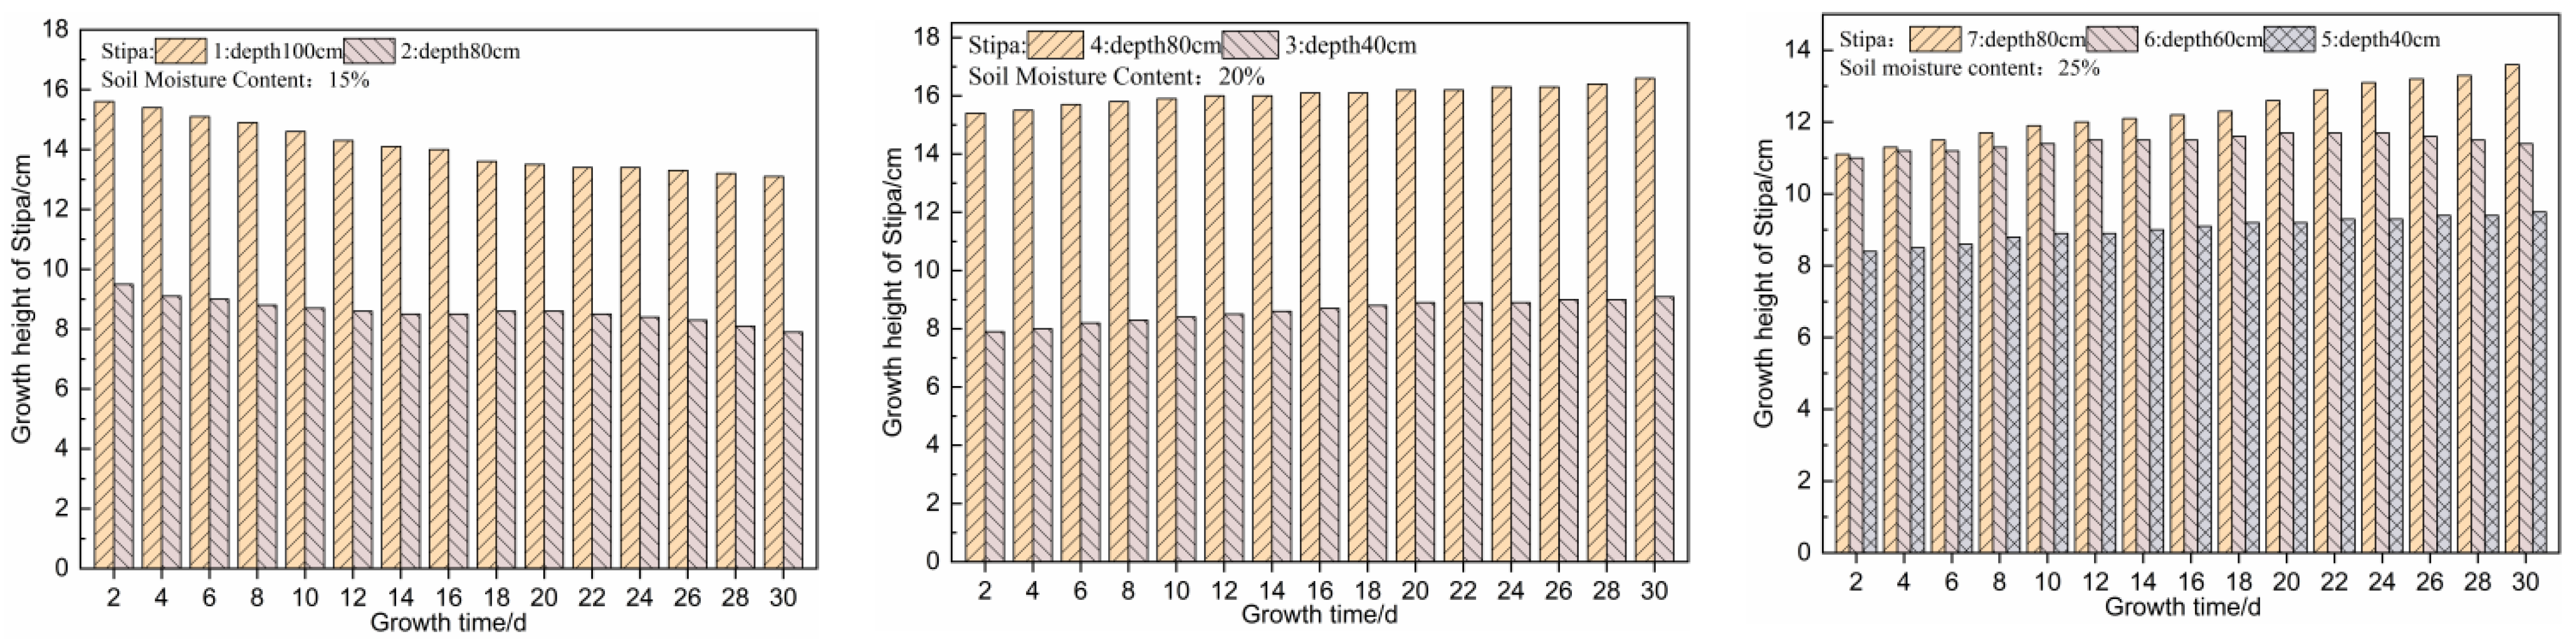
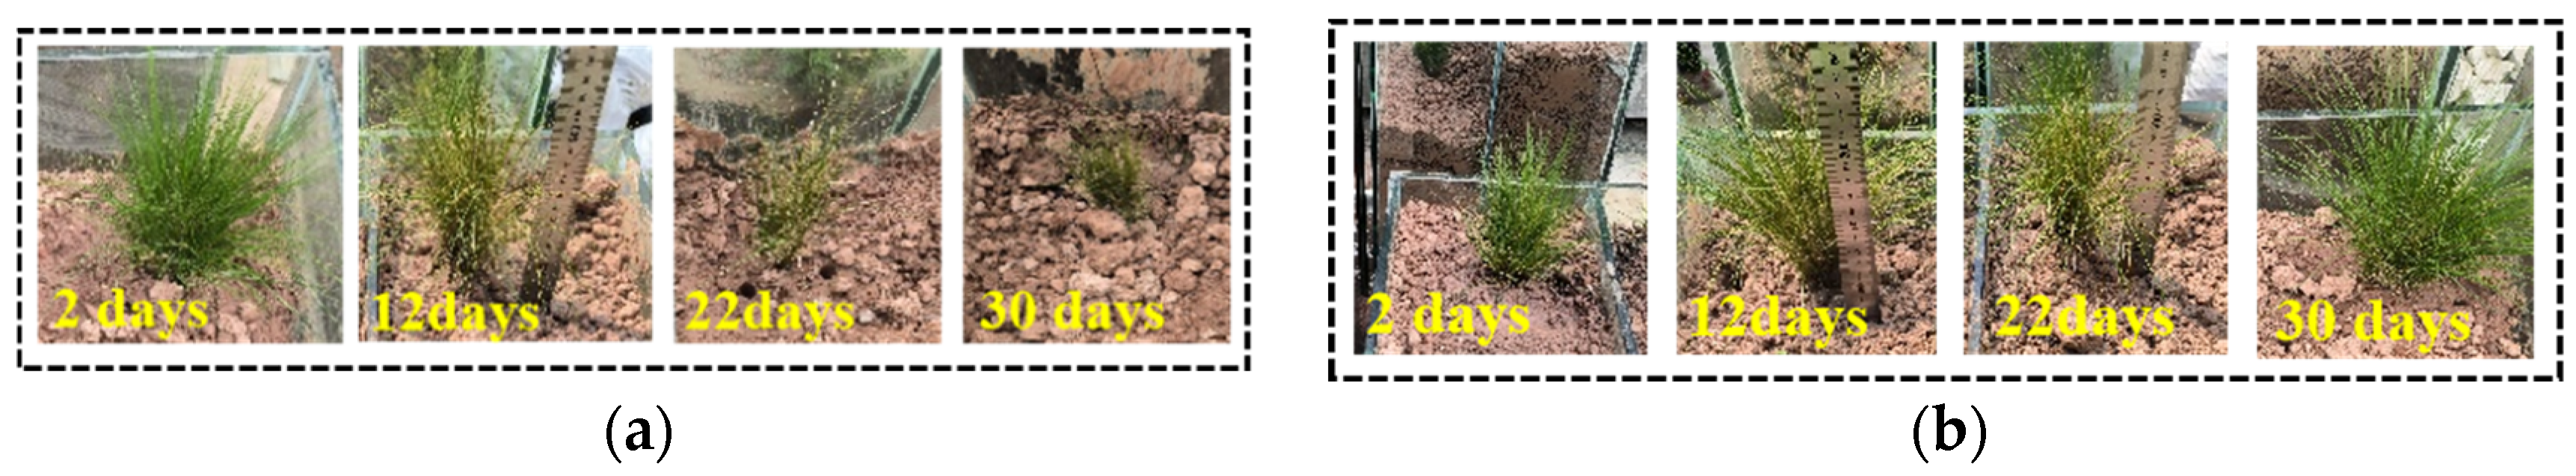
2.2. Effects of Different Groundwater Depths on Plant Growth

Figure 2 shows the variation in the growth height of Artemisia annua over time. When the soil moisture content was 15%, the underground burial depth had a significant impact on plant growth. During the experiments, the height of Artemisia annua 1 decreased from 5.0 cm to 2.1 cm (shown in Figure 3a). The plant gradually wilted and finally died. After 10 days of transplanting, the height of Artemisia annua 2 increased by 1.1 cm. After 16 days, the height of Artemisia annua 2 showed a downward trend and growth declined. After 30 days, the height of Artemisia annua 2 only increased by 0.6 cm. Artemisia annua 1 was buried 20 cm deeper than Artemisia annua 2. The height of Artemisia annua 1 decreased until the plant died. But the height of Artemisia annua 2 increased. When the soil moisture content was 25%, the height of all Artemisia annua plants showed an increasing trend. The groundwater depth of Artemisia annua 3 was relatively shallow. In the early stage, Artemisia annua 3 grew slowly because there was too much water. After 20 days, the root system of the plant gradually aged so that the water absorption capacity declined. The growth height of Artemisia annua 3 slowly decreased. When the depth of groundwater was 60 cm, the height of Artemisia annua 6 increased linearly and was more than 2 cm during the experiment (shown in Figure 3b).
When the soil moisture content was 30% and the groundwater depth of Artemisia annua 7 was 80 cm, the growth height increased linearly in the first 20 days. After 30 days, Artemisia annua 7 increased by 4 cm. The rest of the Artemisia annua grew slowly and had a small growth height. During the experiments, the growth height of Artemisia annua 7 increased the best. Overall, when the soil moisture content was 25%, the height of plant growth increased and it grew better than the others. When the moisture content was smaller than 25%, the depth of groundwater burial was too shallow to meet plant growth. When the moisture content was larger than 25%, it was necessary to increase the burial depth of groundwater. When the moisture content of Artemisia annua was between 15% and 25% and the burial depth of groundwater was between 60 cm and 80 cm, Artemisia annua grew very well.
Figure 4 shows the variation in the growth height of Stipa over time. When the soil moisture content was 15%, the height of all Stipa plants decreased. The groundwater burial depth of Stipa 1 was deeper than that of Stipa 2. The growth height of Stipa 1 was obviously smaller than that of Stipa 2. Leaf chlorosis, leaf tip yellowing, and the gradual wilting of Stipa 1 happened due to a lack of water (shown in Figure 5a). When the soil moisture content was 20%, the influence of groundwater depth on Stipa growth was relatively small and slow. The increase in height of Stipa 4 with a groundwater depth of 80 cm was 0.5 cm more than that of Stipa 3 with a groundwater depth of 40 cm. The height of Stipa with a soil moisture content of 25% showed an increasing trend. When the depth of groundwater was 80 cm, the height of Stipa 7 linearly increased (shown in Figure 5b), ultimately increasing by 2.5 cm. The growth status of Stipa 7 was normal and without any yellowing or wilting. If moisture content is not enough, Stipa cannot normally grow. The growth condition of Stipa can be improved by raising the groundwater level. When the moisture content was 20–25%, the growth height of Stipa increased. While the groundwater depth was 80 cm, Stipa grew linearly.
The experimental results showed that when the soil moisture content was 15%, both Artemisia annua and Stipa had drought stress at a groundwater depth of 100 cm, and grew normally at a groundwater depth of 80 cm. When the moisture content was between 20% and 25%, if the groundwater depth was 80 cm, Stipa grew very well. If the soil moisture content was 25%, when the groundwater depth was 60 cm and 80 cm, the growth height of Artemisia annua exceeded 2 cm. When the moisture content was 30% and the groundwater depth was 80 cm, the growth height of Artemisia annua was the largest, increasing by 4 cm. Therefore, a groundwater depth between 60 cm and 80 cm is the groundwater level required for the normal growth of typical plants such as Artemisia annua and Stipa.

3. The Variation Law of Groundwater during Tunnel Construction

Tunnel construction will inevitably lead to a decline in groundwater levels, which directly affects the normal growth of plants. This study is based on a study of groundwater changes during the construction process of the Longzang Mountain No. 1 Tunnel at Maixiu Forest Farm in Maixiu Town, Zeku County, Huangnan Tibetan Autonomous Prefecture, Qinghai Province. The relationship between typical plants and groundwater depth in the tunnel site was studied through transplanting experiments using glass boxes. Based on this, it is necessary to analyze the impact of changes in groundwater level during tunnel construction on the normal growth of typical plants. The Longzangshan No. 1 Tunnel is a separated middle tunnel with left and right tracks.

3.1. Numerical Model

Based on the information of the tunnel engineering, the height of the tunnel is 5.00 m, the width is 10.25 m, and the burial depth of tunnel is 30 m. Based on the actual situation of the tunnel and engineering experience, a numerical model was established. Its vertical height was 80 m and its horizontal width was 90 m (shown in Figure 6). Normal displacement constraints and impermeable boundaries were applied to the left, right, front, back, and bottom surfaces of the numerical model. Based on the results of plant growth experiments, the groundwater level was set to be 0.6 m below the top surface of the model. Six monitoring points, labeled A, B, C, D, E, and F, were positioned above the tunnel arch, with a distance of 5 m between adjacent monitoring points, to monitor changes in pore pressure and pressure head. The assumptions made in this calculation were as follows:
(1)
The surrounding rock is considered as an isotropic material using the Mohr Coulomb elastoplastic model.
(2)
The tunnel excavation uses the step method, with the construction sequence and times as follows:
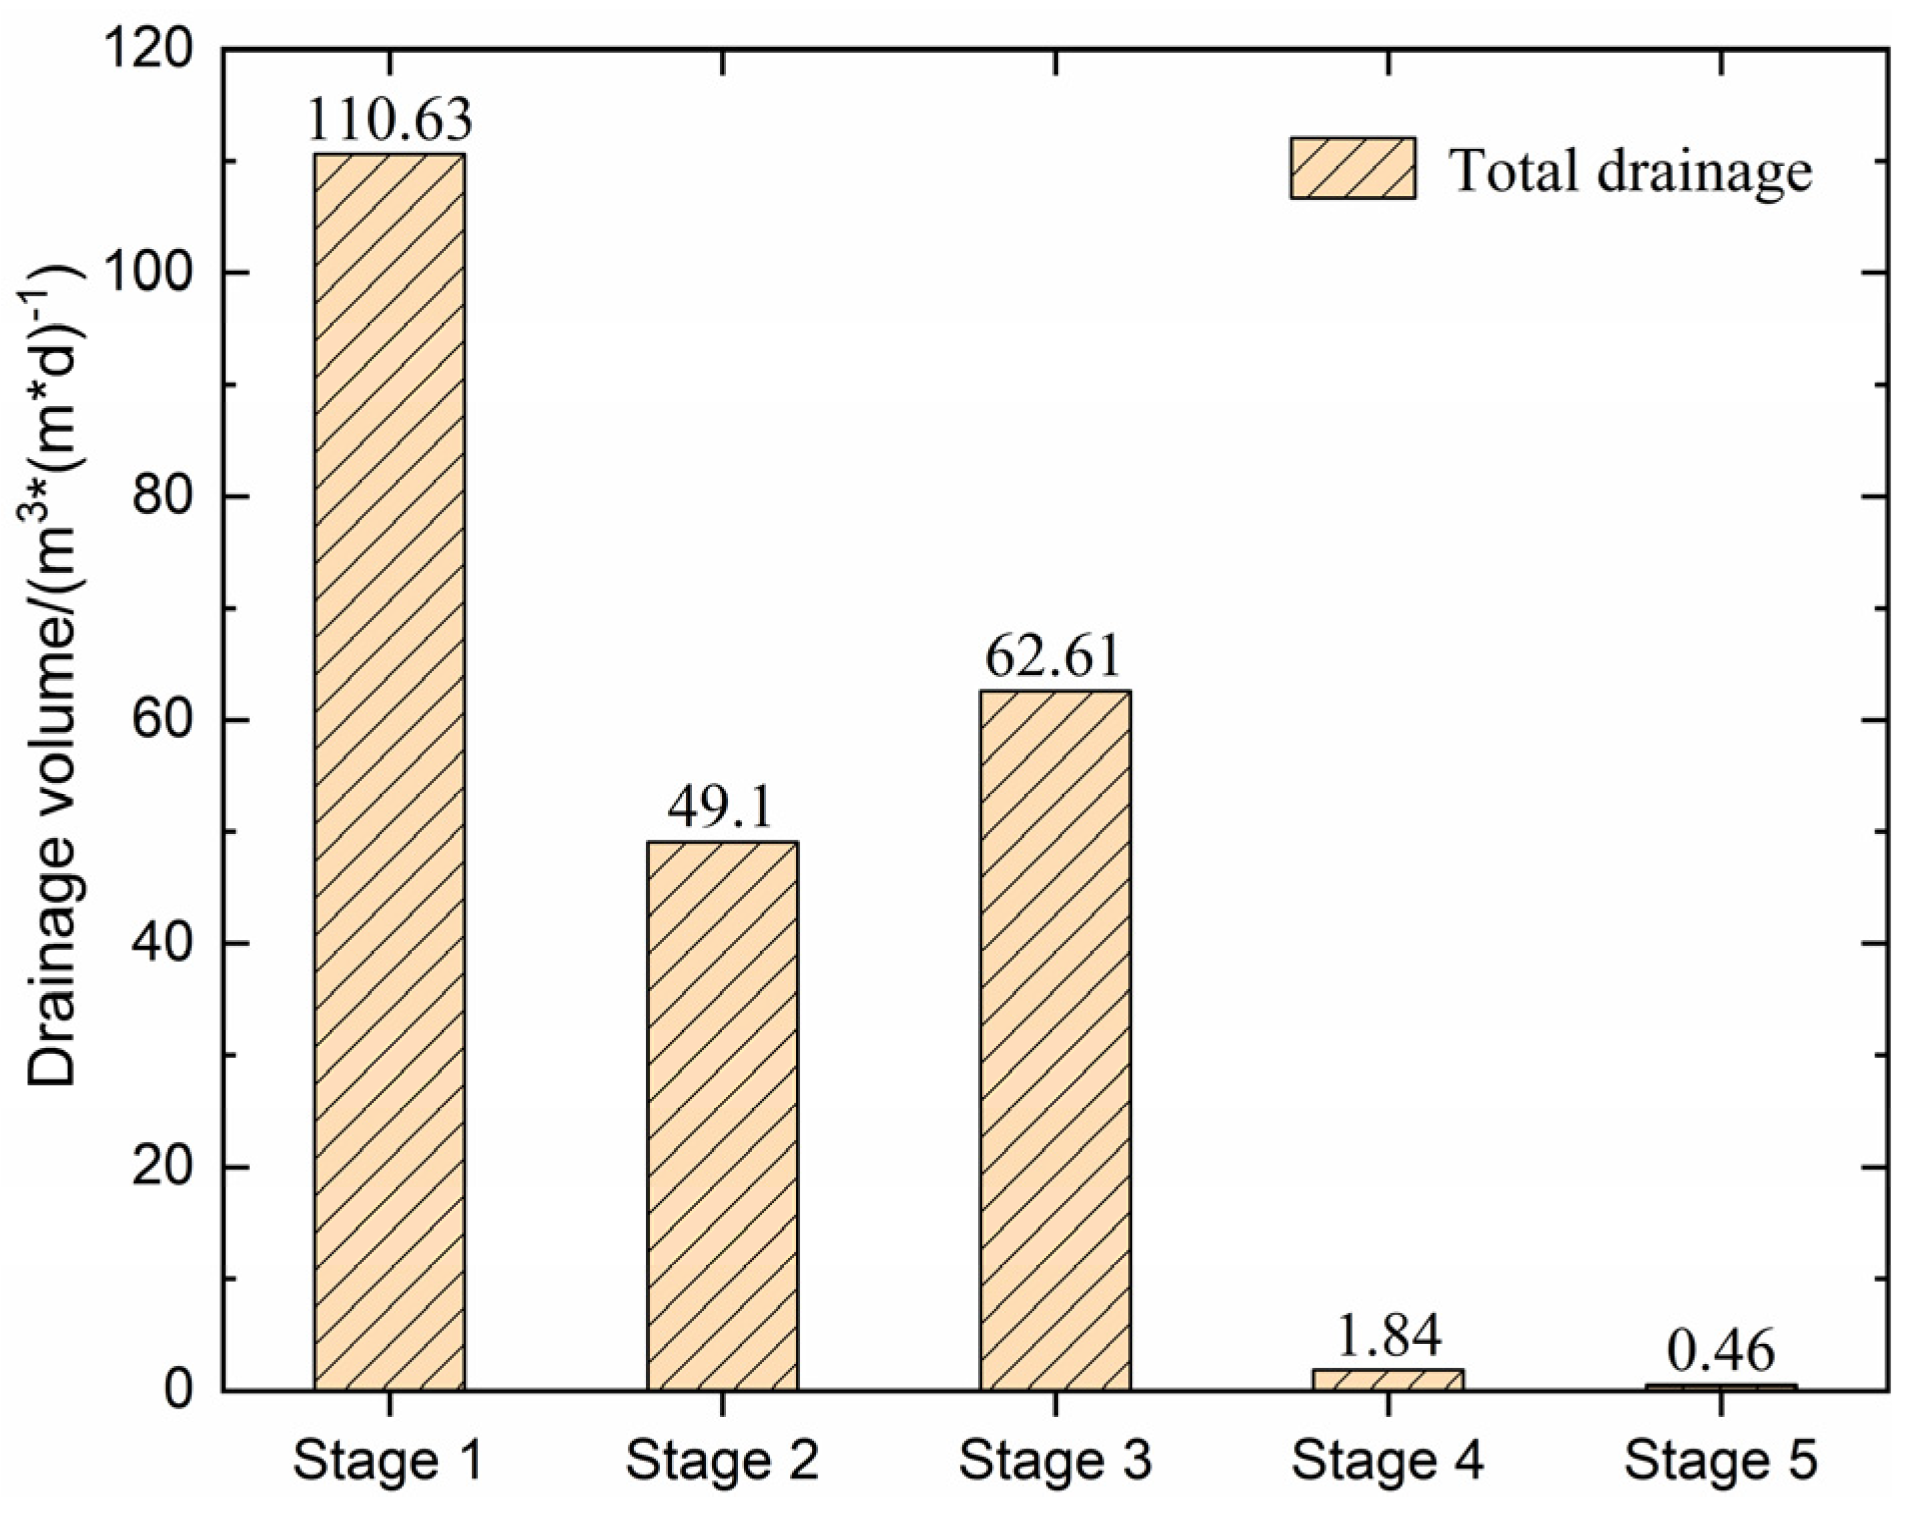
  • Stage 1: Upper step excavation (3 h);
  • Stage 2: Initial support for upper steps (6 h);
  • Stage 3: Lower bench excavation (9 h);
  • Stage 4: Initial support for descending steps (12 h);
  • Stage 5: Construction of secondary lining (steady-state analysis).
Combined with survey data and relevant specifications, the calculation parameters utilized in the model are shown in Table 2.

3.2. Tunnel Drainage Volume

The sum of waterflow volume at all nodes along the different excavation surface was the drainage volume of the tunnel. Figure 7 shows the tunnel drainage statistics of each construction stage. After the excavation of the upper platform, the maximum drainage capacity of the tunnel reached 110.63 m3/(m·d). The initial support of the subsequently completed staircase decreased, and the tunnel drainage decreased to 49.10 m3/(m∙d) due to its anti-seepage effect. The excavation of lower steps resulted in an increase in the seepage boundary, leading to an increase in the tunnel drainage to 62.61 m3/(m·d). After completing the initial support of lower steps, it was wrapped in a ring to reduce the tunnel drainage to 1.84 m3/(m·d). After the completion of the secondary lining construction, a second layer of waterproofing was added, and the tunnel drainage was further reduced, ultimately stabilizing at 0.46 m3/(m·d). It is worth noting that the excavation process during tunnel construction resulted in the highest amount of tunnel drainage. Shortening the initial support time and improving the anti-seepage performance of sprayed concrete can significantly reduce the drainage volume during tunnel construction.

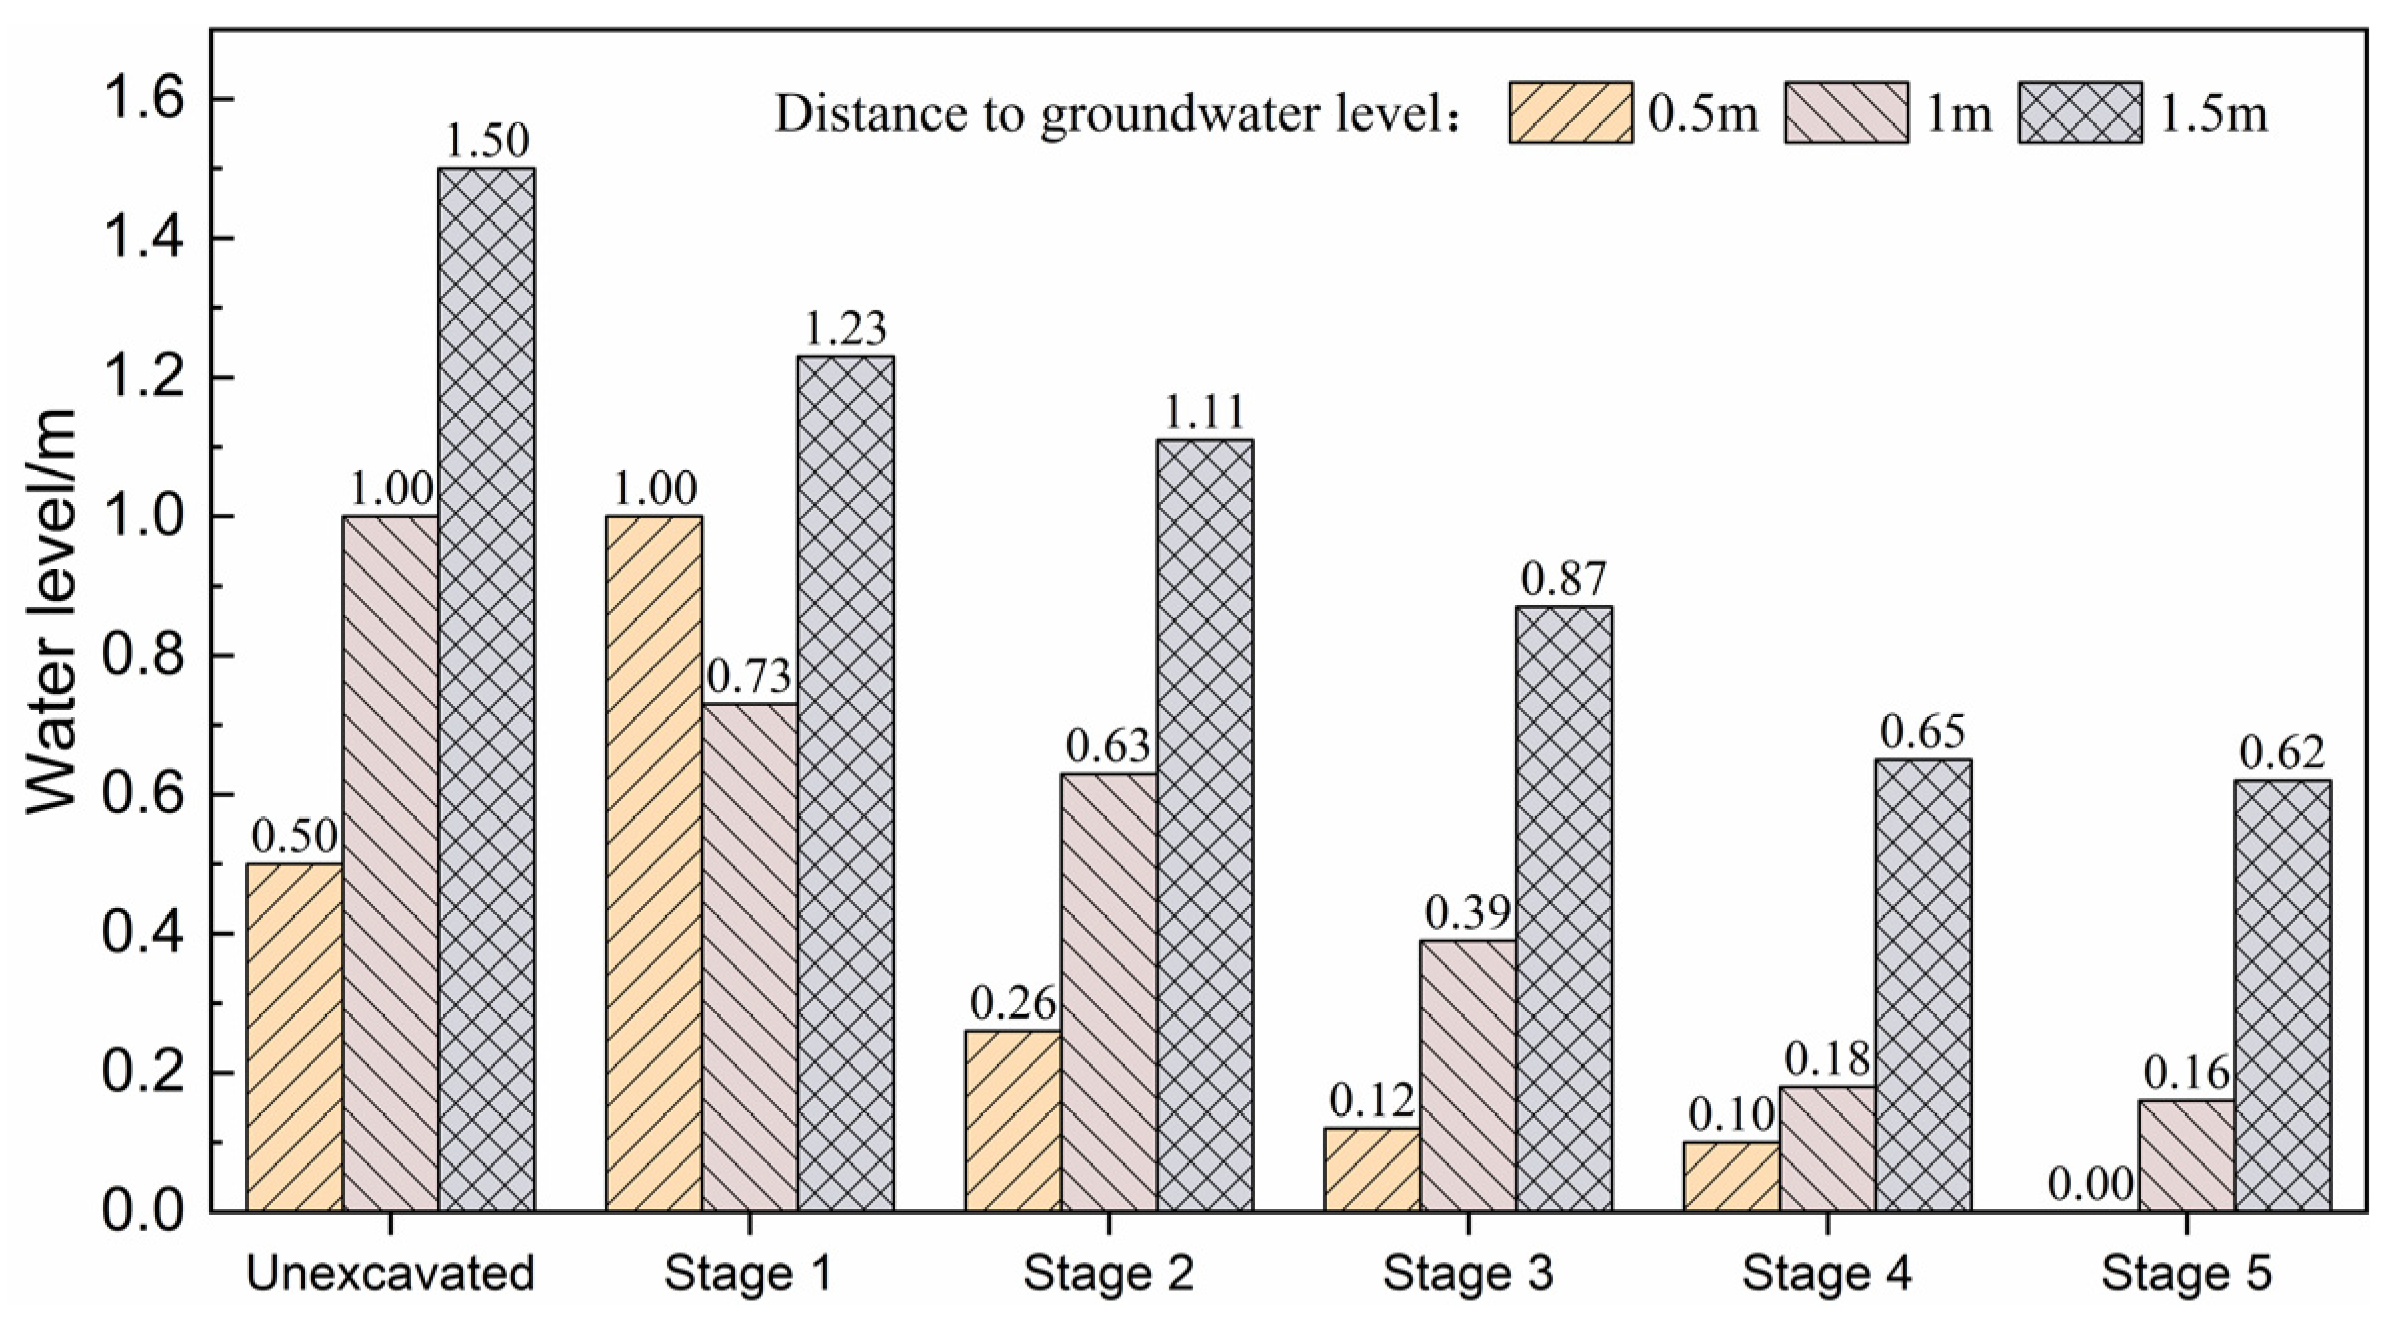
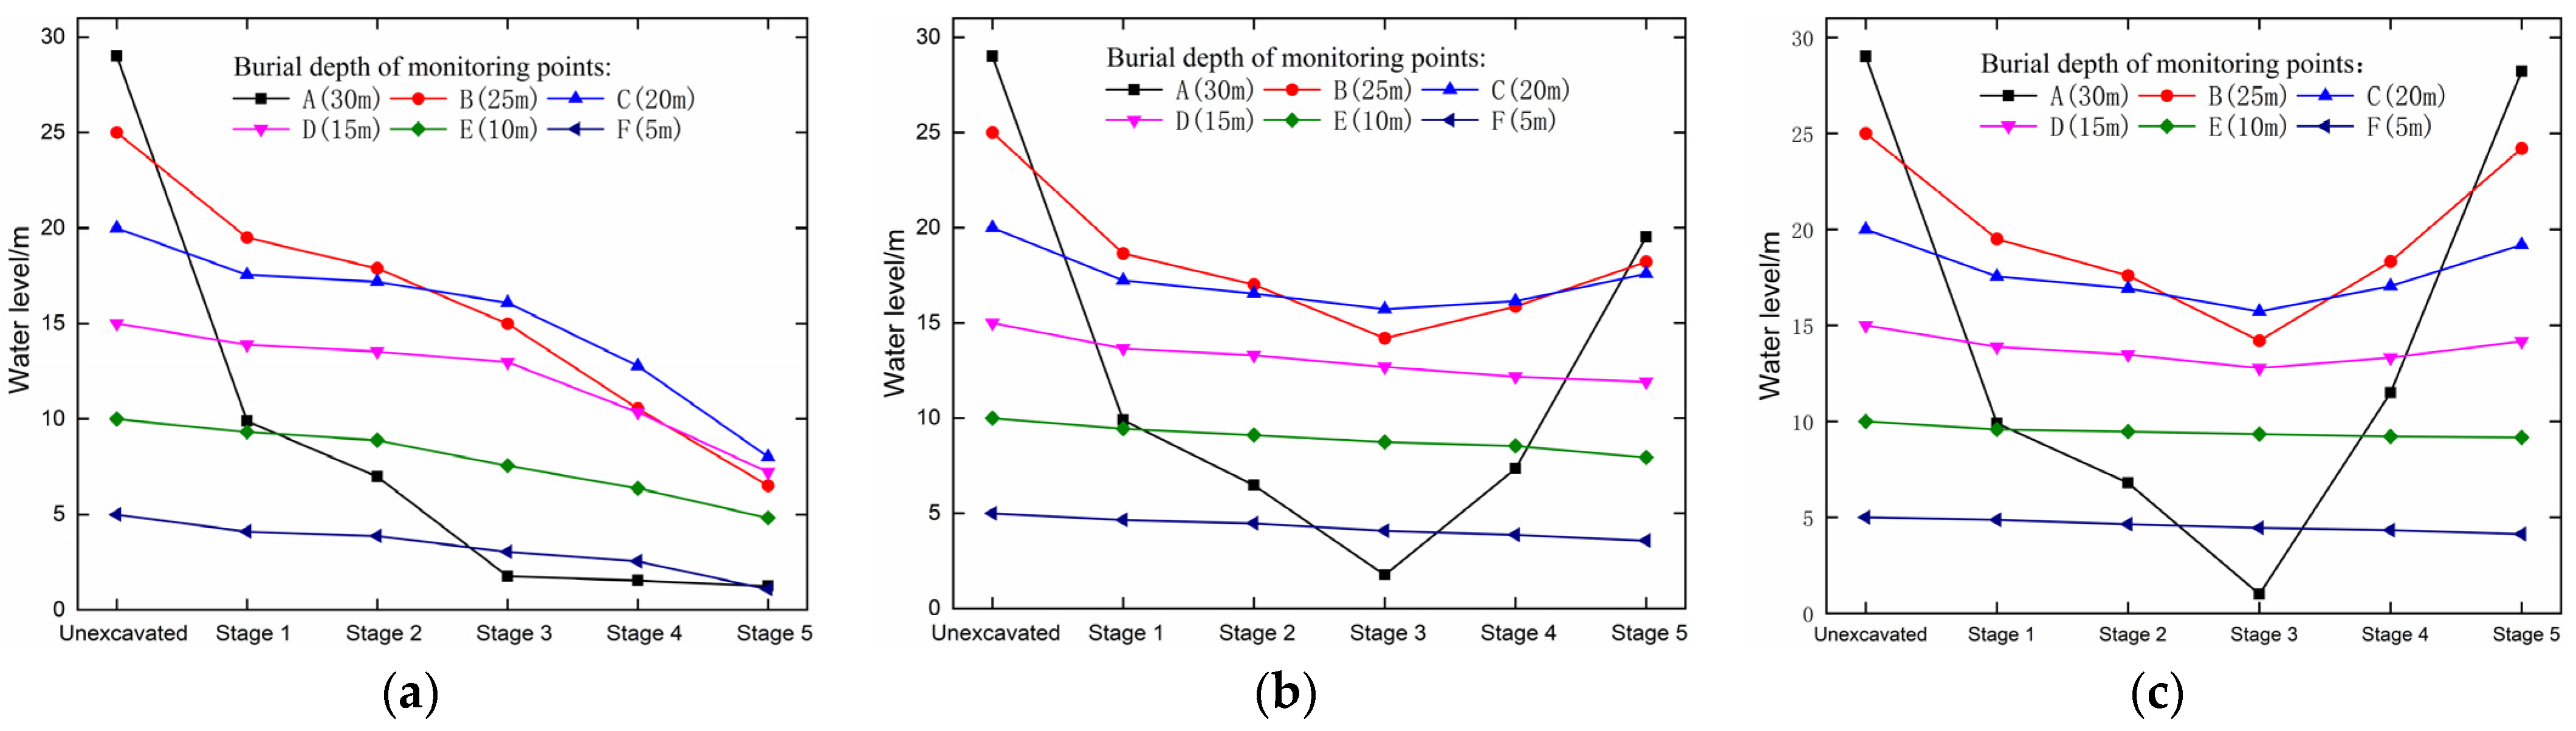
3.3. Groundwater Level

Figure 8 shows the water levels at three measuring points of 0.5 m, 1.0 m, and 1.5 m below the groundwater level during different stages of construction. Throughout the excavation of the upper platform, the tunnel had a substantial drainage capacity, resulting in a significant decline in water level ranging from 0.19 m to 0.27 m at each measuring point. The anti-seepage effect of initial support delayed the decline in groundwater levels during the installation of the upper step support, with a range of 0.05–0.12 m. The excavation and subsequent support of the lower steps had a relatively small impact on the water levels at each measuring point, with a decline ranging from 0.14 m to 0.24 m and 0.02 m to 0.22 m, respectively. Usually, the groundwater level remains lower than the ground level. Under normal circumstances, tunnel construction will cause the groundwater level to decline, exceeding the normal growth needs of typical plants in the area. It is necessary to take effective water blocking measures to minimize the decline in water level.

4. The Influence of Different Waterproofing and Drainage Measures on the Underground Water Level in the Tunnel

The magnitude of groundwater level decline during tunnel construction directly affects the growth of vegetation. To reduce groundwater level decline during tunnel construction, reasonable measures and parameters are taken.

4.1. Influence of Tunnel Drainage Mode on Groundwater Level

Tunnel drainage modes include full drainage, limited drainage, and full sealing. The full drainage mode does not consider tunnel water plugging measures. Groundwater that can be discharged after tunnel excavation is released through the tunnel drainage system. The numerical model is consistent with the permeability coefficient of the initial lining and the permeability coefficient of the surrounding rock. Limited discharge refers to using grouting layer measures to discharge a certain amount of groundwater through the drainage system. The permeability coefficient of the tunnel lining is set as shown in Table 2. Full sealing refers to not installing a drainage system after tunnel excavation and initial support, and setting the pressure boundary of the secondary lining unit as an impermeable boundary in the numerical model.
Figure 9 shows the water level changes at each measuring point during the construction process under three modes. Under the full discharge mode, the groundwater level rapidly declined and did not recover. If the groundwater remained below the ecological burial depth for a long time, it would seriously threaten plant growth and even lead to plant death. Under the limited discharge mode, the groundwater level changes at each measuring point were relatively stable, with a high degree of recovery. Within 15 m from the free water level, the recovery degree exceeded 75%, with the water level at point F declining by 0.81 m. After the construction of the second lining in the fully sealed mode, the groundwater level of the tunnel was almost completely restored, with the most obvious fluctuation at measuring point A. The lowest groundwater level declined to 1.17 m. After restoration, the water level reached 28.24 m, with a recovery degree of 97.3%. The cost of the fully sealed mode is extremely high. Considering the impact of groundwater discharge and cost, the limited discharge mode is more reasonable for the normal growth of plants.

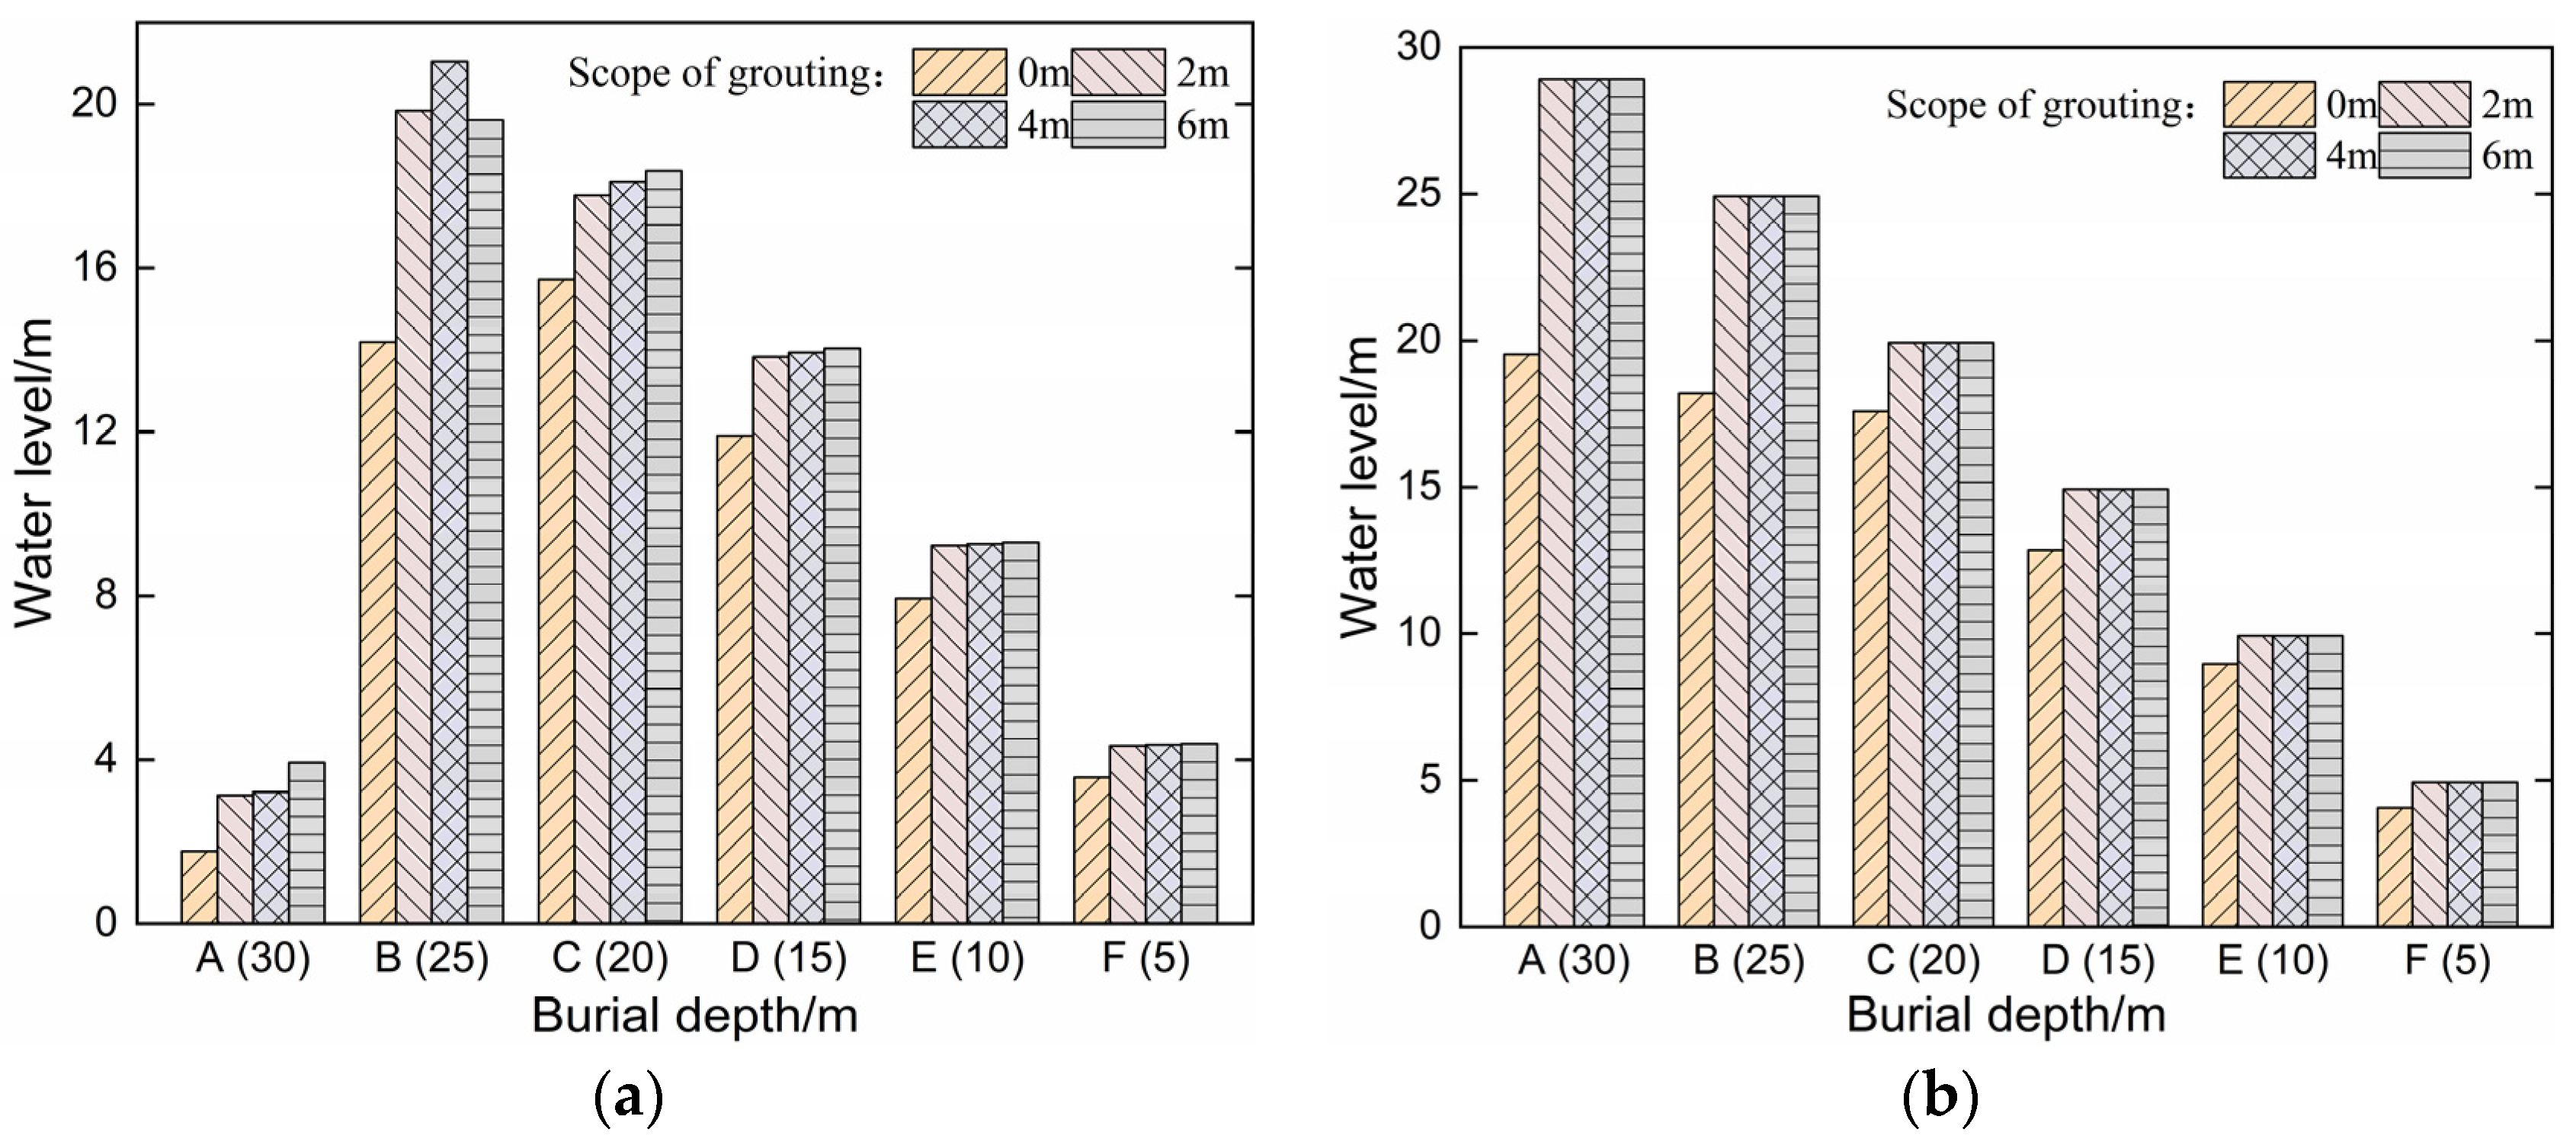
4.2. The Influence of the Thickness of the Water Blocking Grouting Circle on the Groundwater Level of the Tunnel

The same grouting material and different thicknesses of water-blocking grouting circles have a significant impact on groundwater discharge and water levels. To analyze the effect of different thicknesses of water-blocking grouting circles on the variation of groundwater levels during tunnel construction, the permeability coefficient of grouting circles with thicknesses of 4.9 × 10⁻¹ m/d, 0 m, 2 m, 4 m, and 6 m were studied. The results are shown in Figure 10. Measurement point A was located inside the grouting circle, and the water-blocking effect of the grouting circle prevented the groundwater outside the grouting circle from being transported to point A in a timely manner, resulting in an increase in pore pressure inside the grouting circle. The thicker the grouting circle during construction, the higher the lowest water level at point A, with a maximum of 3.93 m. After the construction of the secondary lining, the pressure water level at point A rapidly declined, and the redistribution of the seepage field gradually stabilized. After stabilization, the water level was 28.92 m. Measurement point B was in the grouting range of 4–6 m. When the grouting thickness was 2 m or 4 m, point B was outside the grouting circle, and the water level was larger than that of without grouting. When grouting for 6 m, measurement point B was located inside the grouting circle, with a minimum water level of 19.61 m. The water blocking effect of grouting caused the water level to be slightly lower than in the first two working conditions, but much higher than the situation without grouting.
The other measuring points were all outside the grouting circle. The thicker the grouting circle was, the larger the lowest water level was. After the secondary lining was finished, the recovery degree of water level was larger than that of without grouting. The influence of grouting thickness increasing on water level was relatively small. The range of water level decline within 5 m below the groundwater level after grouting in the tunnel was 0.07–0.66 m. The smaller the burial depth, the smaller the decrease in water level. After the secondary lining construction, the water level gradually recovered, with a degree exceeding 90%. The range of groundwater decline after recovery was 0.06–0.07 m, which can maintain normal plant growth. Based on the consideration of cost control and ecological environment safeguards, it is suggested that the reasonable grouting thickness is about 2 m.

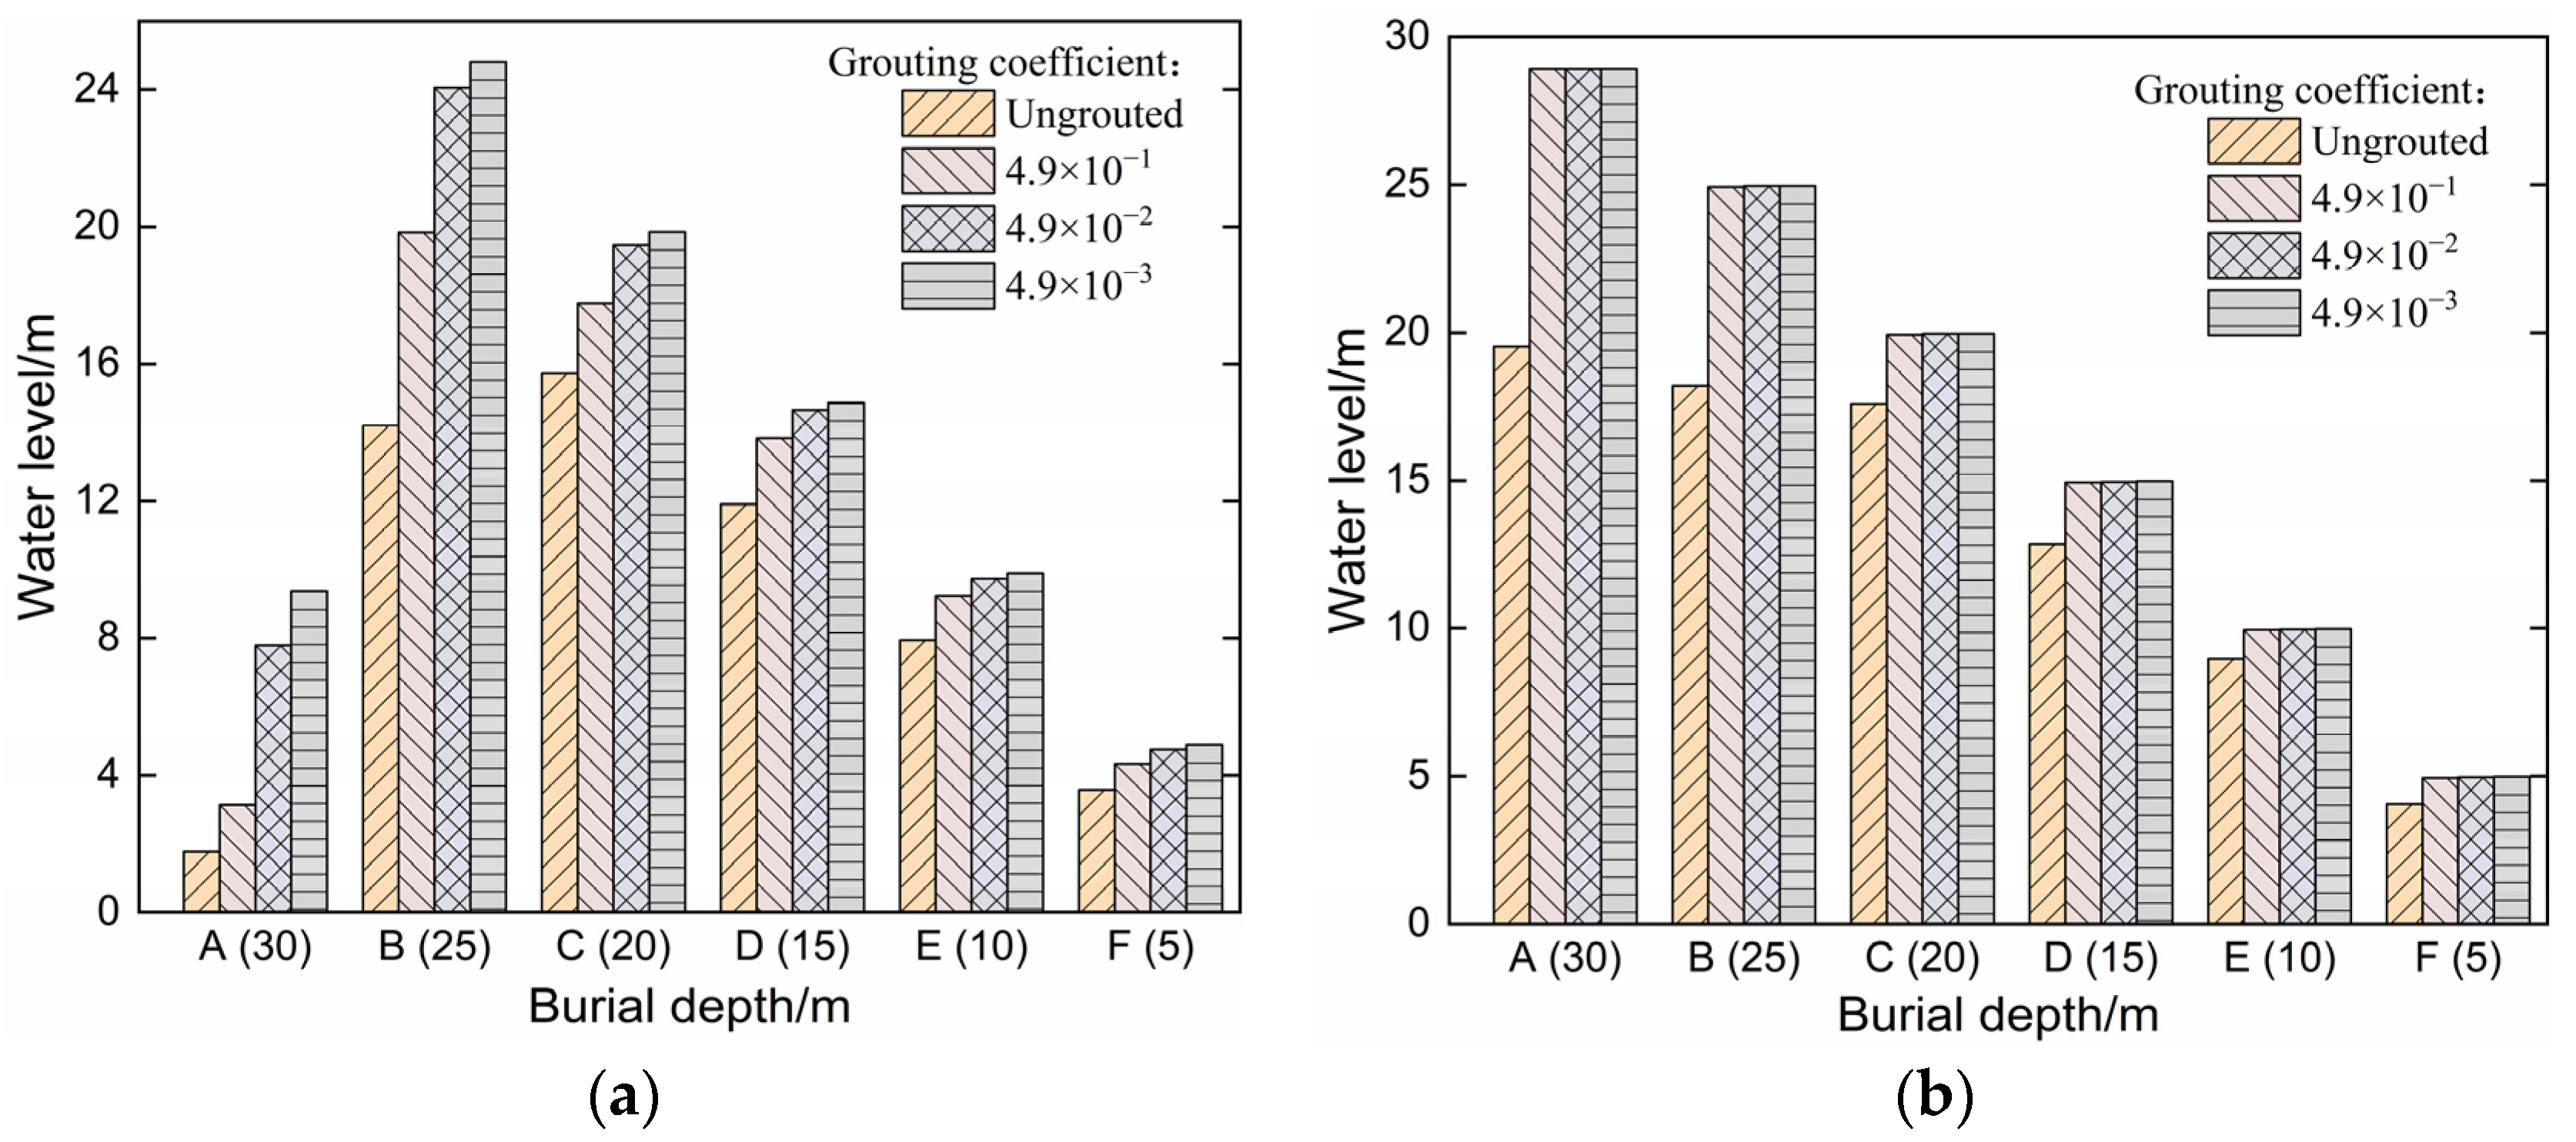
4.3. The Influence of Permeability Coefficient of Water-Blocking Grouting Circle on Tunnel Groundwater Level

Different grouting parameters have significant differences in the permeability coefficient of the water-blocking grouting circle. The permeability coefficient of different water-blocking grouting circles with the same thickness will significantly impact groundwater discharge and water level. To analyze the effect of different permeability coefficients of water-blocking grouting circles on groundwater, three situations were studied: a grouting circle thickness of 2 m with permeability coefficients of 4.9 × 10⁻¹ m/d, 4.9 × 10⁻² m/d, and 4.9 × 10⁻³ m/d. The results are shown in Figure 11. The smaller the permeability coefficient, the more significant the water-blocking effect of the grouting circle, the smaller the change in groundwater level, and the higher the degree of water level recovery at each measuring point. Within a range of 5 m below the groundwater level, the range of water level decline during tunnel construction was from 0.02 m to 0.66 m, and the degree of water level recovery exceeded 90%. After recovery, the maximum range of groundwater level decline was less than 0.07 m, so that it was able to ensure the normal growth of plants. The permeability coefficient of the grouting circle was 4.9 × 10⁻³ m/d, which can effectively control the groundwater level decline and prevent the growth of plants from being affected.

5. Tunnel Limited Discharge Values Based on Vegetation Protection

5.1. Calculation Method for Limited Discharge Values

Mountain tunnels generally have complex hydrogeological conditions, and high water pressure problems are frequently encountered in water-rich areas. “Drainage-based” solutions are often used in regulations. The drainage limit standard for mountain tunnels is relatively large compared to subway tunnels, submarine tunnels, and urban tunnels [24]. According to groundwater theory, the decline in groundwater creates a descending area similar to a precipitation funnel [25]. The impact range of tunnel water inflow corresponds to the surface area of the precipitation funnel, which is approximately elliptical. When the precipitation funnel is in a stable state, the allowable consumption of groundwater in the tunnel should ensure the normal growth of vegetation and balance of groundwater. The calculation of tunnel emissions is based on the steady-state groundwater aquifer formula [26,27].
R = 730 q π p W B 2
π K 2 H 0 s w s w = Q ln R r w
where R —Influence radius; q —Tunnel water inflow; p —Precipitation infiltration coefficient; W —Precipitation recharge intensity; B —Tunnel width; K—Permeability coefficient of aquifer; H 0 —Initial water level of aquifer; s w —The depth reduction value of stable groundwater state; Q —Tunnel emissions; and r w —Tunnel radius.

5.2. Calculation Example of Limited Discharge Values

Based on the Longzang Mountain No. 1 Tunnel, to maintain normal plant growth, the maximum depth reduction was set to 0.8 m according to the experimental results. The precipitation infiltration coefficient was in the range of 0.25–0.45 [28]. The annual rainfall in the tunnel site was about 300–500 mm, and the permeability coefficient of the stratum was 1 × 10⁻³–1 × 10⁻¹ m/d. Based on the smaller maximum burial depth of the left and right tunnels, the maximum water head was calculated to be 90 m, assuming a tunnel length of 50 m in the calculation area. The actual width of the tunnel was 10.25 m, which was equivalent to a radius of 3.81 m. The effects of water head height, annual rainfall, precipitation infiltration coefficient, and formation permeability coefficient on the limited discharge values are shown in Figure 12. The higher the head height, the greater the allowable value of discharge restriction. With an annual rainfall of 400 mm, the precipitation infiltration coefficient was 0.25; the head height was 90 m; the formation permeability coefficient was 1 × 10⁻¹ m/d; and the maximum limit discharge was calculated to be 3.91 m3/(m·d).
When the head height was 30 m, the permeability coefficient of the formation was 10−3 m/d, and the minimum limit discharge was 0.01 m3/(m·d). When the head height was 30 m and the annual rainfall was 300 mm, the minimum limit discharge value was 1.25 m3/(m·d). When the head height was 90 m and the annual rainfall was 500 mm, the maximum limit discharge value was 3.98 m3/(m·d). When the head height was 30 m and the annual rainfall was 300 mm, the minimum limit discharge value was 1.29 m3/(m·d). When the head height was 90 m and the annual rainfall was 500 mm, the maximum limit discharge value was 4.11 m3/(m·d). According to the actual situation, to ensure the normal growth of plants in the alpine meadow areas of Qinghai, it is recommended to limit the discharge of groundwater from tunnels in similar areas to 0.2–4.0 m3/(m·d).

6. Discussion

6.1. The Relationship between Normal Growth of Different Plants and Groundwater Buried Depth

The relationship between vegetation growth and groundwater in mountain tunnels is influenced by the factors such as vegetation type, growth area, and tunnel construction. Different vegetation types have varying demands for groundwater. There are regional differences in soil moisture content in growth areas [9,10,11,29]. This paper selected these regions with relatively low precipitation for comparative analysis, as shown in Table 3. The herbaceous plants of Maixiu District of Qinghai Sanjiangyuan National Nature Reserve were only studied in this paper. The relationship between groundwater and herbaceous and shrub in Horqin Sandy Land of eastern Inner Mongolia was studied by Siteng et al. [30]. The influence of groundwater on Haloxylon ammodendron in Gurbantunggut Desert was investigated by Dai et al. [31]. The water absorption depth of Haloxylon ammodendron from seedlings to mature trees continued to increase. Haloxylon ammodendron had a greater demand for groundwater than others. The suitable groundwater depth range of Artemisia halodendron was also large in Horqin Sandy Land in Inner Mongolia. And the maximum groundwater depth was 2.0 m for normal growth. The range of groundwater depth in this study was slightly smaller than that in Inner Mongolia. But it is largely smaller than arbor. In low-precipitation regions, the root lengths of herbaceous plants, shrubs, and arbor increase in sequence, which leads to an increasing demand for groundwater depth. In order to protect the normal growth of herbaceous vegetation, the groundwater depth range proposed in this study is reasonable and necessary.

6.2. Research on Grouting Parameters for Tunnels

As the nation advances in ecological civilization and high-quality development, stringent ecological requirements have been set for constructing mountain tunnels in fragile ecological areas [34,35]. These areas are environmentally sensitive, and activities such as excavation, support, water inflow, and drainage during construction can cause irreversible ecological damage. Therefore, implementing reasonable grouting parameters to maintain groundwater depth and protect vegetation growth is crucial. Grouting parameters of tunnels are different depending on the specific geological and hydrological conditions of each tunnel (shown in Table 4). For example, the Yuanliangshan Tunnel, which experienced high water pressure, used a grouting circle with a permeability coefficient of 1.0 × 10⁻⁶ cm/s and a thickness of 5 m in high-pressure parts [36]. The groundwater level was 270–280 m above the tunnel crown in the Liaoshan Tunnel, where both radial and circumferential thickness of grouting reinforcement were 1 m [37]. Faults, rock integrity, and weathering affect grouting thickness. The vertical range of grouting reinforcement was 2–8 m in Guangfu Tunnel where there were many faults [38]. A grouting thickness of 6 m was optimal in the Cenxi Tunnel with fully weathered granite [39]. According to the above, these grouting parameters were obtained based on ensuring structure safety and preventing water inflow. In order to guarantee the normal growth of typical herbaceous plants, grouting parameters were studied in this paper. The reasonable grouting parameters were a thickness of 2 m and a permeability coefficient of 4.9 × 10⁻³ m/d. Thus, these parameters were different from the references.

7. Conclusions

This paper investigated the minimum water level requirement for herbaceous plants in alpine meadows, groundwater variation during tunnel construction, waterproofing and drainage parameters, and the discharge limits of tunnel groundwater to protect vegetation. The study employed transplant experiments, numerical simulations of tunnel construction, and calculations of discharge limits. The main conclusions are as follows.
(1)
The transplant experiments showed that Artemisia annua grew 4 cm taller than before the experiment when soil moisture content was 30% and groundwater depth was 80 cm. Stipa grew 2.5 cm taller than before the experiment when soil moisture content was 25% and groundwater depth was 80 cm. These increments of growth were the largest. Artemisia annua and Stipa grew well also when groundwater depth was 60 cm. Thus, it is suggested that groundwater depth be controlled between 0.6 m and 0.8 m to protect the normal growth of herbaceous plants.
(2)
Based on ensuring the normal growth of herbaceous plants around the tunnel, a grouting circle with a thickness of 2 m and a permeability coefficient of 4.9 × 10⁻³ m/d are proposed. In tunnel construction, groundwater level decline was between 0.02 m and 0.66 m. After the secondary lining construction, the water level gradually recovered. These grouting parameters ensure that the recovery degree of water level can exceed 90%. When these grouting parameters were used, these herbaceous plants were able to normally grow in the construction of Longzang Mountain No. 1 Tunnel.
(3)
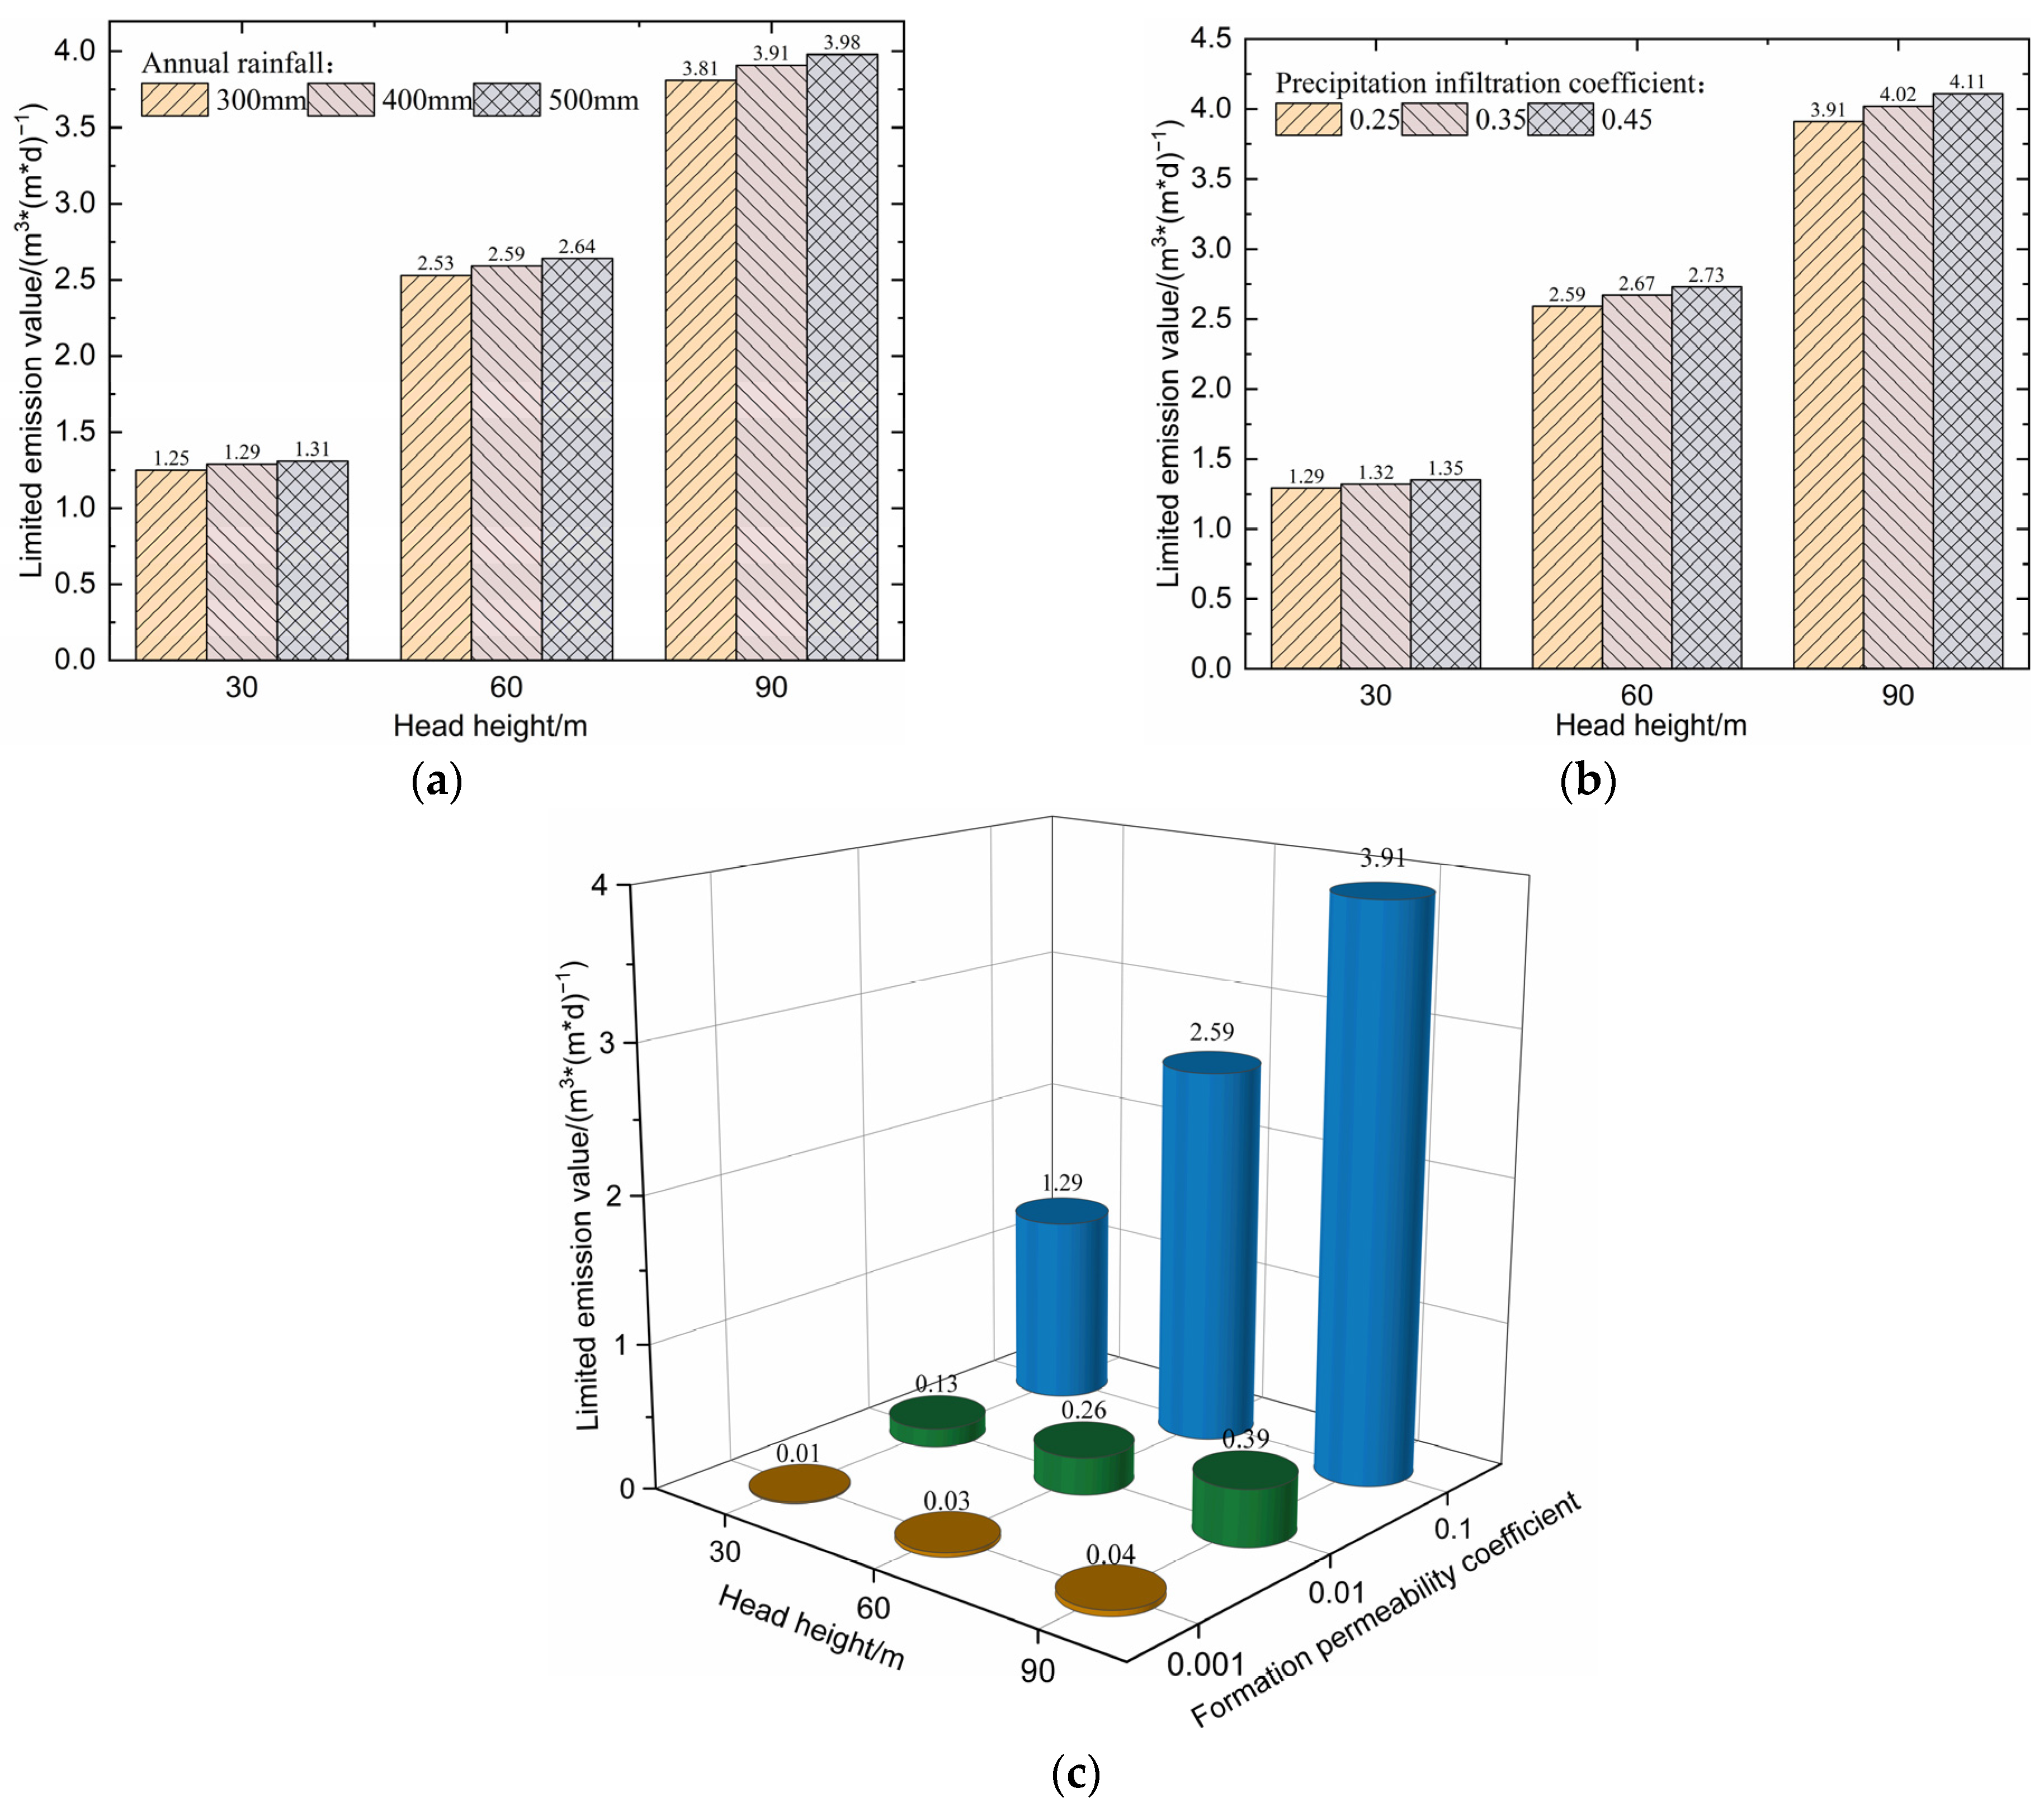
Based on the hydrology, meteorology, and geology information of Longzang Mountain No. 1 Tunnel, the results of the empirical formula calculation showed that when the groundwater discharge limit was 0.2~4.0 m3/(m·d), the groundwater level decline was less than 0.8 m. In this situation, herbaceous plants in Qinghai’s alpine grasslands were able to normally grow. This research offers guidance and support for managing groundwater discharge during tunnel construction in ecologically fragile areas, such as the Three Rivers Source in Qinghai.

Author Contributions

Conceptualization, X.Z.; methodology, Y.Z.; software, Y.L. and Y.Y.; validation, Y.L.; formal analysis, X.Z.; investigation, Y.Y.; writing—original draft preparation, Y.L. and Y.Y.; writing—review and editing, Y.Z. All authors have read and agreed to the published version of the manuscript.

Funding

This study was funded by the National Key Research & Development Program of China (2021YFB2600103), and the Natural Science Foundation Chongqing, China (No. CSTB2022NSCQ-MSX1515).

Institutional Review Board Statement

Not applicable.

Informed Consent Statement

Not applicable.

Data Availability Statement

The data presented in this study are available upon request from the corresponding author. The data are not publicly available due to privacy.

Conflicts of Interest

The authors declare no conflict of interest.

References

  1. Xin, G.; Wang, B.; Zheng, H.; Zeng, L.; Yang, X. Study on Water Inrush Characteristics of Hard Rock Tunnel Crossing Heterogeneous Faults. Appl. Sci. 2024, 14, 2536. [Google Scholar] [CrossRef]
  2. Chen, Z.; He, C.; Zhang, Y.; Xu, Z.; Li, Z.; Yu, B. The impact of formation heterogeneity on water discharge and groundwater depletion of an excavated tunnel. J. Hydrol. 2023, 627, 130403. [Google Scholar] [CrossRef]
  3. Jiang, T.; Pei, X.; Wang, W.; Li, L.; Guo, S. Effects of the Excavation of a Hydraulic Tunnel on Groundwater at the Wuyue Pumped Storage Power Station. Appl. Sci. 2023, 13, 5196. [Google Scholar] [CrossRef]
  4. Lv, Y.; Jiang, J.; Chen, L.; Hu, W.; Jiang, Y. Elaborate simulation and predication of the tunnel drainage effect on karst groundwater field and discharge based on Visual MODFLOW. J. Hydrol. 2022, 612, 128023. [Google Scholar] [CrossRef]
  5. Chen, Y.N.; Chen, Y.P.; Xu, C.C.; Ye, Z.X.; Li, Z.Q.; Zhu, C.G.; Ma, X.D. Effects of ecological water conveyance on groundwater dynamics and riparian vegetation in the lower reaches of Tarim River, China. Hydrol. Process. 2010, 24, 170–177. [Google Scholar] [CrossRef]
  6. Fu, A.; Chen, Y.; Li, W. Water use strategies of the desert riparian forest plant community in the lower reaches of Heihe River Basin, China. Sci. China (Earth Sci.) 2014, 57, 1293–1305. [Google Scholar] [CrossRef]
  7. Stirzaker, R.J.; Passioura, J.B.; Wilms, Y. Soil structure and plant growth: Impact of bulk density and biopores. Plant Soil 1996, 185, 151–162. [Google Scholar]
  8. Behzad, H.M.; Jiang, Y.J.; Arif, M.; Wu, C.; He, Q.F.; Zhao, H.J.; Lv, T. Tunneling induced groundwater depletion limits long-term growth dynamics of forest trees. Sci. Total Environ. 2022, 811, 152375. [Google Scholar] [CrossRef]
  9. Talebnejad, R.; Sepaskhah, A.R. Effect of different saline groundwater depths and irrigation water salinities on yield and water use of quinoa in lysimeter. Agric. Water Manag. 2015, 148, 177–188. [Google Scholar] [CrossRef]
  10. Du, J.; Wang, X.; Huo, Z.; Guan, H.; Xiong, Y.; Huang, G. Response of shelterbelt transpiration to shallow groundwater in arid areas. J. Hydrol. 2021, 592, 125611. [Google Scholar] [CrossRef]
  11. Zhang, W.; Zhu, J.; Zhou, X.; Li, F. Effects of shallow groundwater table and fertilization level on soil physico-chemical properties, enzyme activities, and winter wheat yield. Agric. Water Manag. 2018, 208, 307–317. [Google Scholar] [CrossRef]
  12. Wang, D.; Yu, Z.; Peng, G.; Zhao, C.; Ding, J.; Zhang, X. Water use strategies of Populus euphratica seedlings under groundwater fluctuation in the Tarim River Basin of Central Asia. Catena 2018, 166, 89–97. [Google Scholar] [CrossRef]
  13. Xu, H.; Li, X.; Gokdemir, C. Modeling and assessing the impact of tunnel drainage on terrestrial vegetation. Tunn. Undergr. Space Technol. 2021, 116, 104097. [Google Scholar] [CrossRef]
  14. Gu, J.; Guo, J.; Chen, F.; Li, J. Evolution Law and Grouting Treatment of Water Inrush in Hydraulic Tunnel Approaching Water-Rich Fault: A Case Study. Appl. Sci. 2024, 14, 3407. [Google Scholar] [CrossRef]
  15. Ma, Q.; Wu, H.; Ge, W.; Zhang, J. Investigation of the emergency water supply schemes for youkou groundwater source field in Nanchang using a simulation–optimization model. Sci. Rep. 2024, 14, 2610. [Google Scholar] [CrossRef] [PubMed]
  16. Zhang, W.; Zhou, X.; Wang, B.; Cheng, X.; Wei, W. Methodology for the Prediction of Water Gushing in Tunnels in Igneous Fracture Tectonic Zones: A Case Study of a Tunnel in Guangdong Province, China. Appl. Sci. 2022, 12, 10438. [Google Scholar] [CrossRef]
  17. Zhang, N.; Niu, M.; Wan, F.; Lu, J.; Wang, Y.; Yan, X.; Zhou, C. Hazard Prediction of Water Inrush in Water-Rich Tunnels Based on Random Forest Algorithm. Appl. Sci. 2024, 14, 867. [Google Scholar] [CrossRef]
  18. Fu, H.; An, P.; Cheng, G.; Wen, S.; Li, J. Calculation of the Allowable Drainage of Parallel Tunnels Based on Ecological Environment Protection. KSCE J. Civ. Eng. 2022, 26, 2420–2427. [Google Scholar] [CrossRef]
  19. Gokdemir, C.; Li, Y.D.; Rubin, Y.; Li, X.J. Stochastic modeling of groundwater drawdown response induced by tunnel drainage. Eng. Geol. 2022, 297, 106529. [Google Scholar] [CrossRef]
  20. Huang, D.W.; Zhao, Z.Q.; Xu, C.J.; Luo, W.J.; Geng, D.X.; Shi, Y.F. Experimental study on influences of side grouting on deformation of shield tunnels under loads. Chin. J. Geotech. Eng. 2024, 46, 510–518. [Google Scholar]
  21. Liu, Y.C.; Yuan, Z.Y.; Cheng, X.S.; Li, G.; Zhang, T.X.; Li, Q.H. Experimental study on plugging effect of different grouting materials for water and sand leakage of tunnels. Chin. J. Geotech. Eng. 2021, 43, 249–252. [Google Scholar]
  22. Zheng, L.; Lian, X.; Huang, D.; Li, X.; Zou, J. Research on Seepage of Jointed Rock Mass of Tunnel and Limited Discharge of Grouting. Water 2022, 14, 104. [Google Scholar] [CrossRef]
  23. Ma, X.; Li, W.; Zhu, C.; Chen, Y. Spatio-temporal variation in soil moisture and vegetation along the lower reaches of Tarim River, China. Acta Ecol. Sin. 2010, 30, 4035–4045. [Google Scholar]
  24. Cheng, P.; Li, L.; Zou, J.F.; Zhao, L.H.; Luo, W. Determination Method for Water Discharge of Tunnel Based on the Ecological Water Requirement of Vegetation. J. China Railw. Soc. 2013, 35, 107–113. [Google Scholar]
  25. Shi, C.H.; Peng, L.M.; Zhao, D. Calculation of stratum deformation caused by tunnel excavation and dewatering. China Civ. Eng. J. 2008, 12, 91–96. [Google Scholar]
  26. Pagnozzi, M.; Coletta, G.; Leone, G.; Leone, G.; Catani, V.; Esposito, L.; Fiorillo, F. A steady-state model to simulate groundwater flow in unconfined aquifer. Appl. Sci. 2020, 10, 2708. [Google Scholar] [CrossRef]
  27. Xue, Y.Q. A Discussion on the Stable Well Flow Model and Dupuit Formula—Reply to Professor Chen Chongxi’s “Discussion”. J. Hydraul. Eng. 2011, 42, 1252–1256. [Google Scholar]
  28. Zhu, D.; Li, Q. Prediction of outflow in tunnel based on exper-imental permeating coefficient of precipitation. J. Railw. Eng. Soc. 1995, 1, 100–102. [Google Scholar]
  29. Liu, S.; Roberts, D.A.; Chadwick, O.A.; Still, C.J. Spectral responses to plant available soil moisture in a Californian grassland. Int. J. Appl. Earth Obs. Geoinf. 2012, 19, 31–44. [Google Scholar] [CrossRef]
  30. Siteng, Z.; Xueyong, Z.; Yulin, L. Relationship between the trait response of aboveground and belowground parts of dominant plant species to groundwater depth change in Horqin Sandy Land, eastern China. Ecol. Indic. 2023, 156, 111001. [Google Scholar]
  31. Dai, Y.; Wang, H.W.; Shi, Q.D. Contrasting plant water-use responses to groundwater depth from seedlings to mature trees in the Gurbantunggut Desert. J. Hydrol. 2022, 610, 127986. [Google Scholar] [CrossRef]
  32. Chang, L.N.; Zhao, X.Q. Multi-Functional Management and Natural Protected Area Construction of Grassland in Three-River Source National Park. Nat. Prot. Areas 2022, 2, 1–8. [Google Scholar]
  33. Han, Z.; Song, W.; Deng, X.; Xu, X. Grassland ecosystem responses to climate change and human activities within the Three-River Headwaters region of China. Sci. Rep. 2018, 8, 9079. [Google Scholar] [CrossRef] [PubMed]
  34. Shi, D.M. Study on Eroded Environment and lts Soil and Water Loss Characteristics During Expressway Construction. J. Soil Water Conserv. 2006, 2, 5–9. [Google Scholar]
  35. Lei, D.; Zhang, Y.; Ran, Y.; Gao, L.; Li, J.; Li, Z.; Mo, J.; Liu, X. Assessment of ecosystem health based on landscape pattern in ecologically fragile regions at different spatial scales: A case study of Dianchi Lake basin, China. Front. Environ. Sci. 2023, 11, 1076344. [Google Scholar] [CrossRef]
  36. Zhang, C.P.; Zhang, D.; Wang, M.; Xiang, Y. Study on appropriate parameters of grouting circle for tunnels with limiting discharge lining in high water pressure and water-enriched region. Chin. J. Rock Mech. Eng. 2007, 26, 2270–2276. [Google Scholar]
  37. Hua, T.; Liu, S.; Zhang, X.; Meng, L.; Wang, P. Numerical analysis of grouting of water-enriched karst highway tunnel based on critical water-enriched height. Processes 2023, 11, 149. [Google Scholar] [CrossRef]
  38. Hongpeng, L.; Yongli, X.; Xiaohua, Y. Treatment effect analysis of shallow-buried crushed surrounding rocks under unsymmetrical pressure reinforced with surface pregrouting technology in highway tunnel. Chin. J. Rock Mech. Eng. 2008, 27, 2309–2315. [Google Scholar]
  39. Liu, J.; Chen, W.; Yuan, J.; Li, C.; Zhang, Q.; Li, X. Groundwater control and curtain grouting for tunnel construction in completely weathered granite. Bull. Eng. Geol. Environ. 2018, 77, 515–531. [Google Scholar] [CrossRef]
Figure 1. Box model of experiment.
Applsci 14 06561 g001
Figure 2. The growth height of Artemisia annua, changing with time.
Applsci 14 06561 g002
Figure 3. Transplantation status of Artemisia annua 1 and 6. (a) Artemisia annua 1. (b) Artemisia annua 6.
Applsci 14 06561 g003
Figure 4. The growth height of Stipa, changing with time.
Applsci 14 06561 g004
Figure 5. Transplantation status of Stipa 1 and Stipa 7. (a) Stipa 1. (b) Stipa 7.
Applsci 14 06561 g005
Figure 6. Calculation model diagram.
Applsci 14 06561 g006
Figure 7. Tunnel drainage volume at each construction stage.
Applsci 14 06561 g007
Figure 8. Water level changes at three measuring points near the surface in each construction stage.
Applsci 14 06561 g008
Figure 9. Changes in water level in different construction and discharge stages. (a) Full drainage. (b) Limited drainage. (c) Full sealing.
Applsci 14 06561 g009
Figure 10. Water level at different grouting ranges at various measuring points during the construction process. (a) The lowest water level. (b) The final recovery water level.
Applsci 14 06561 g010
Figure 11. Water level at different measuring points with different permeability coefficients during the construction process. (a) The lowest water level. (b) The final recovery water level.
Applsci 14 06561 g011
Figure 12. The influence of different factors on the limited discharge value of groundwater. (a) Annual rainfall and water head height. (b) Precipitation infiltration coefficient and water head height. (c) Formation permeability coefficient and water head height.
Applsci 14 06561 g012
Table 1. Working conditions of the experiment.
Device NumberDepth of Groundwater Burial (cm)Artemisia Plant NumberActual Measured Soil Moisture ContentStipa Plant NumberActual Measured Soil Moisture Content
1100115.2%115.0%
280217.5%216.1%
360326.0%Plant death/
440430.8%320.3%
580524.6%422.1%
660Plant death/524.1%
740Plant death/624.1%
8100625.3%Plant death/
980730.5%724.0%
1060830.5%Plant death/
Table 2. Calculation parameters.
MaterialBulk Density (kN/m3)Elastic Modulus (GPa)Poisson’s RatioCohesive Force (MPa)Internal Friction Angle (°)Permeability
Coefficient (m/d)
Porosity
Wall rock223.900.300.3304.3 × 10−20.32
Initial support24280.25 3.0 × 10−70.21
Secondary lining26320.20 3.0 × 10−80.25
Table 3. Groundwater depth requirements for normal plant growth in different regions.
NumberResearch RegionSpeciesPlant TypePrecipitationGroundwater Depth/mReference
1QinghaiHerbaceousArtemisia annua, StipaLow0.6~0.8[32,33]
2Inner MongoliaHerbaceous, ShrubPennisetum centrasiaticum
Artemisia halodendron
Low0.5~2.0[30]
3XinjiangArborHaloxylon ammodendronLow4.6~11[31]
Table 4. Grouting parameters for different tunnels.
NameTunnel TypeSurrounding Rock TypeGrouting Thickness/mGrouting Permeability Coefficient/(m/d)
Longzang Mountain Tunnel No. 1Mountain tunnelThe surrounding rock is relatively complete24.9 × 10−3
Yuanliangshan tunnel [36]Water-rich karst tunnelBroken surrounding rock5 or 88.64 × 10⁻⁴
Liaoshan Tunnel [37]Water-rich karst tunnelThe surrounding rock is relatively complete1/
Guangfu Tunnel [38]Shallow buried bias pressure tunnelBroken surrounding rock2–8/
Cenxi Tunnel [39]Fully weathered granite tunnelBroken surrounding rock6/
Disclaimer/Publisher’s Note: The statements, opinions and data contained in all publications are solely those of the individual author(s) and contributor(s) and not of MDPI and/or the editor(s). MDPI and/or the editor(s) disclaim responsibility for any injury to people or property resulting from any ideas, methods, instructions or products referred to in the content.

