Article

Comparison between the Dynamic Responses of Steel Buildings with Medium and Deep Columns under Several Seismic Intensities

by
Federico Valenzuela-Beltrán
,
Mario D. Llanes-Tizoc
,
Eden Bojorquez
,
Juan Bojorquez
,
J. M. Leal-Graciano
,
Victor Baca
,
Robespierre Chavez
and
Alfredo Reyes-Salazar
*
Faculty of Engineering, Autonomous University of Sinaloa, Ciudad Universitaria, Culiacán 80000, Mexico
*
Author to whom correspondence should be addressed.
Appl. Sci. 2024, 14(12), 5067; https://doi.org/10.3390/app14125067
Submission received: 4 May 2024 / Revised: 5 June 2024 / Accepted: 6 June 2024 / Published: 11 June 2024
(This article belongs to the Special Issue Structural Seismic Design and Evaluation)

Abstract

:
Structural engineers often use deep columns in high seismic areas to reduce drifts, yet this somehow contradicts what is stated in some tests in the sense that even though deep columns may satisfy current seismic provisions, they can suffer premature twisting; this is an indication that a lot of research is needed in this area. Numerical and experimental studies have been conducted to estimate the response of steel buildings with medium and deep columns under the action of static and cyclic loading; however, studies accounting for the dynamic characteristics of buildings and strong motions are not common. In addition, responses in terms of local parameters have not been considered either. In this study, the nonlinear seismic responses of steel buildings with perimeter moment-resisting frames and medium (W14) columns are numerically calculated and compared to those of similar steel buildings with equivalent deep columns in terms of cost (W27 and larger). Low-, mid-, and high-rise steel building models with different dynamic characteristics, as well as several strong motions with different frequency contents, are considered. Results indicate that the drifts of the models with medium columns may be up to 140% greater than those of the models with deep columns. Significant reductions are also observed for top displacements, normalized interstory shears, and combined normalized axial loads and bending moments. Hence, the seismic demands of the buildings with deep columns may be much smaller than those of the buildings with medium columns and, therefore, the buildings with deep columns exhibit a superior behavior, which results in more economical designs. The reduction is greater for the case of low- and mid-rise buildings than for high-rise buildings. One of the reasons for this is that as medium columns are replaced by deep columns, the stiffness and the strength increase, which are lower in the tallest model.

1. Introduction and Literature Review

Different arrangements of structural members are continuously studied with the aim of improving the structural behavior of buildings subjected to the action of various types of loads. In the case of steel buildings under the action of severe seismic loads, moment-resisting frames (MRF) are widely used due to their great ductility capacity. In some developed countries, like the United States of America, the common practice is to use in these buildings two MRF in each direction, usually located at the perimeter (PMRF) and gravity frames (GF) at the interior. The first are designed to resist the total seismic load and the second to resist the gravity loads. Hence, for seismic design purposes, the buildings are usually modeled as two-dimensional (2D) structures.
There are many numerical and experimental studies related to the seismic behavior evaluation of steel buildings with MRF. Before the Northridge Earthquake of 1994, a limited number of laboratory tests at reduced scale were conducted to evaluate the seismic behavior of the columns. After the mentioned earthquake, the cyclic behavior of W beams was extensively investigated; however, for columns only a few cases were considered. Historically speaking, the reported studies regarding the seismic behavior evaluation of columns in steel buildings with MRF have mostly been for W14 columns or smaller. Gupta and Krawinkler [1] studied the behavior of several steel building models designed according to design provisions of the United States. Lee and Foutch [2] studied the seismic nonlinear behavior of a set of post-Northridge buildings which represent typical buildings with MRF. Foutch and Yun [3] investigated the accuracy of modeling methods used in the design of MRF. Mele et al. [4] compared the seismic behavior of steel buildings with perimeter MRF with that of steel buildings with spatial MRF. In another study, Fathi et al. [5] proposed modifications for the behavior factor of moment-resisting steel frames modeled as multi-degree-of-freedom systems. Lee and Foutch [6] studied the seismic behavior of three-, nine-, and twenty-story steel moment-resisting frames with W14 columns designed using different force reduction factors. Krishnan et al. [7] determined the damage to two 18-story steel moment-frame buildings, one existing and one new, located in southern California. Black [8] proposed two stability coefficients that can be used to quantify the P–Δ effect during the elastic and inelastic lateral displacement of regular steel moment-resisting frames. Sejal et al. [9] compared the responses of a steel moment-resisting frame designed by the Performance-Based Plastic design method and conventional elastic design method based on the seismic evaluation investigated with both nonlinear static and nonlinear dynamic analysis under different ground motions. Teran-Gilmore et al. [10] studied the pertinence of using an importance factor to promote an adequate structural and nonstructural performance of essential facilities. Athanasios et al. [11] formulated a procedure to estimate lateral displacements at the first yielding of plane steel frames to be used in a performance-based seismic design. Formisano et al. [12] evaluated the robustness assessment of two methods for steel-framed buildings under catastrophic events by using two steel-framed buildings designed according to old and new seismic Italian codes. Liu et al. [13] assessed the structural reliability of low-to-mid-rise steel frames taking into account the system-based design approach. Samanta and Huang [14] investigated the impact of several ground-motion scaling procedures on the response of high-rise moment-resisting frame buildings. Loulelis et al. [15] developed explicit expressions for different values of strength reduction factors for the first significant modes of steel moment-resisting frames where strength deterioration and panel zone effects were considered. Ruiz-García et al. [16] studied the response of three-dimensional steel moment-resisting buildings having three-, nine-, and twenty-story heights under the bidirectional attack of real seismic sequences with different earthquake ground-motion features. Many other important studies aimed at meeting specific objectives, but following the general goal of evaluating the seismic behavior of steel frames with medium columns, can be found in the literature [17,18,19,20,21].
Despite the large amount of research developed in the area of the seismic behavior of steel buildings with MRF and the important contributions of the above-mentioned papers, only a few studies have been developed concerning the performance evaluation of steel buildings with MRF and deep columns. However, because of the compactness of the webs and flanges of a vast number of deep sections of grade 50, and because of the necessity of higher bending and shear stiffness to reduce drifts, structural engineers often use deep columns in high seismic regions resulting in more economical designs. Furthermore, it is stated that using W14 columns or smaller may result in unnecessarily heavy and more expensive columns. This seemingly contradicts what has been stated in some investigations [22] where it is argued that even though deep columns satisfy current seismic provisions, they can suffer premature twisting, which occurs at late stages of loading. Similarly, Chi and Uang [23] conducted an experimental study by using beam–column subassemblies with W27 columns, finding that lateral–torsional buckling of the beams produces twisting of the columns. Another study [24], however, encouraged the use of deep columns, stating that column twisting might have occurred primarily because of the way the specimen was tested where no top flange bracing was used at the beams, which in actual buildings is normally provided by the floors. Hence, if lateral–torsional buckling is avoided, the columns may remain stable even for significant levels of seismic demands. This stable behavior is expected to be better for the case of steel buildings that are symmetrical in plan. Zhang et al. [25] concluded that the behavior of moment connections with reduced beam sections and deep wide-flange columns satisfied the criteria of the AISC seismic provisions. Shao and Hale [26] tested three full-scale beam–column assemblies using W36 × 256 beams and W30 × 261 columns, concluding that the proposed connections satisfy the two interstory displacement cycles of 0.04 and the inelastic rotation of 0.03 required for the Office of Statewide Health Planning and Development (OSHPD). Ricles and Zhang [27] and Zhang and Ricles [28,29] showed that, in steel frames with deep columns, a composite floor slab provides restraint to the top flange of the beams reducing (1) the magnitude of lateral movement of the beam top and bottom flanges in the RBS, (2) column twist, and (3) strength degradation due to beam instability. Elkady and Lignos [30], by using Finite Element simulations, demonstrated that column sections with large web slenderness, close to the web compactness limit requirements, have a high rate of cyclic deterioration in strength and axial shortening due to severe web local buckling. In many other studies [31,32,33], particular aspects of the response of steel buildings with deep columns were also addressed.
Despite the important contributions of the above-mentioned studies concerning the behavior of steel buildings with medium and deep columns, as further stated below, there are many issues that deserve our attention. It is worth mentioning that in the experimental cyclic tests developed to evaluate and compare the behavior of steel buildings with medium and deep columns, the effect of the dynamic properties of buildings as well as that of the frequency content of the strong motions cannot be considered. It seems to be an assumption that the structural demands, namely maximum interstory drifts or top displacements, will be the same for the buildings with medium and deep columns; if so, obviously the buildings with deep columns are more likely to fail. However, as it is shown in this paper, the seismic demands on the buildings with deep columns may be much smaller than those of the buildings with medium columns and, therefore, buildings with deep columns present a superior behavior.

2. Justification and Objectives

It is worth mentioning that most of the studies concerning deep columns have been focused on individual beam–column elements, or on subassemblies of beams and columns representing a part of the building, subjected to the action of static and cyclic loads. In addition, as stated earlier, it seems there is an implicit assumption in many of these studies in the sense that the structural demands, namely maximum interstory drifts or top displacements, are the same for the buildings with both column sizes. The response of steel buildings with deep columns under the action of different strong motions with different frequency contents has not been studied; it is known that the dynamic response of a structure depends not only on the structural properties, but also on the loading properties, such as those of earthquake loading.
It is emphasized that it is not an objective of this paper to compare the seismic responses of steel buildings with medium and deep columns for the same drift demand, but rather to compare their dynamic responses numerically obtained considering models and seismic records with different dynamic characteristics. The comparison is made in terms of displacements and resultant stresses (member forces), which includes overall (global) and local as well as single and combined response parameters. The equivalence of the two column sizes is expressed in terms of weight (equal cost). It is assumed in this study that drifts of up to 3.5% can be reached without the occurrence of lateral buckling of beams or columns twisting.
It is important to mention that a small part of a big issue is addressed in this research; the specific objectives are as follows:
(1) Calculate the nonlinear seismic responses of the building models with medium columns in terms of interstory drifts and roof displacements, which represent overall response parameters. These parameters are compared with those of the same buildings, but with equivalent deep columns in terms of cost (W27 and larger).
(2) Compare the seismic responses of the buildings with medium and deep columns for the case of single global resultant stresses (interstory shears) and local resultant stresses (axial load and bending moments) at the exterior and interior columns located on the ground level.
(3) Compare the responses, as in Objective (2), but now for normalized single global and normalized combined local resultant stresses.

3. Procedure, Structural Models, and Strong Motions

3.1. Parameters of the Study

Three plane frame models, representing steel building structures of low-, mid- and high-rise steel building structures with different dynamic characteristics, and fifteen strong seismic motions with different frequency contents, are considered in the study. The buildings are modeled as complex 2D MDOF systems, which are assumed to have, firstly, columns of medium size (W14), and then columns of deep size. A medium column, in the context of this paper, is a column with a depth of 14 inches; in the same manner, a deep column is a column with a depth of 27 inches or greater. The building responses with the two column sizes are compared in terms of displacements and member forces, which include overall (global), local, and single and combined response parameters. The seismic records are scaled up to obtain several levels of structural demands, which range from elastic to significant inelastic behavior. The vertical seismic component as well as the gravity loads are considered in the seismic analyses.
The Ruaumoko computer program [34] is used to perform the required nonlinear time-history seismic analyses. The Newmark Constant Average Acceleration Method is used to numerically evaluate the seismic response. The lumped mass matrix, Rayleigh Damping, the P-δ effect, and large displacement are also considered. A bilinear hysteresis rule with 5% of post-yielding stiffness as well as the lumped plasticity approach are assumed in the analysis. The axial load–bending moment interaction is given by the yield interaction surface proposed by Chen and Atsuta [35].

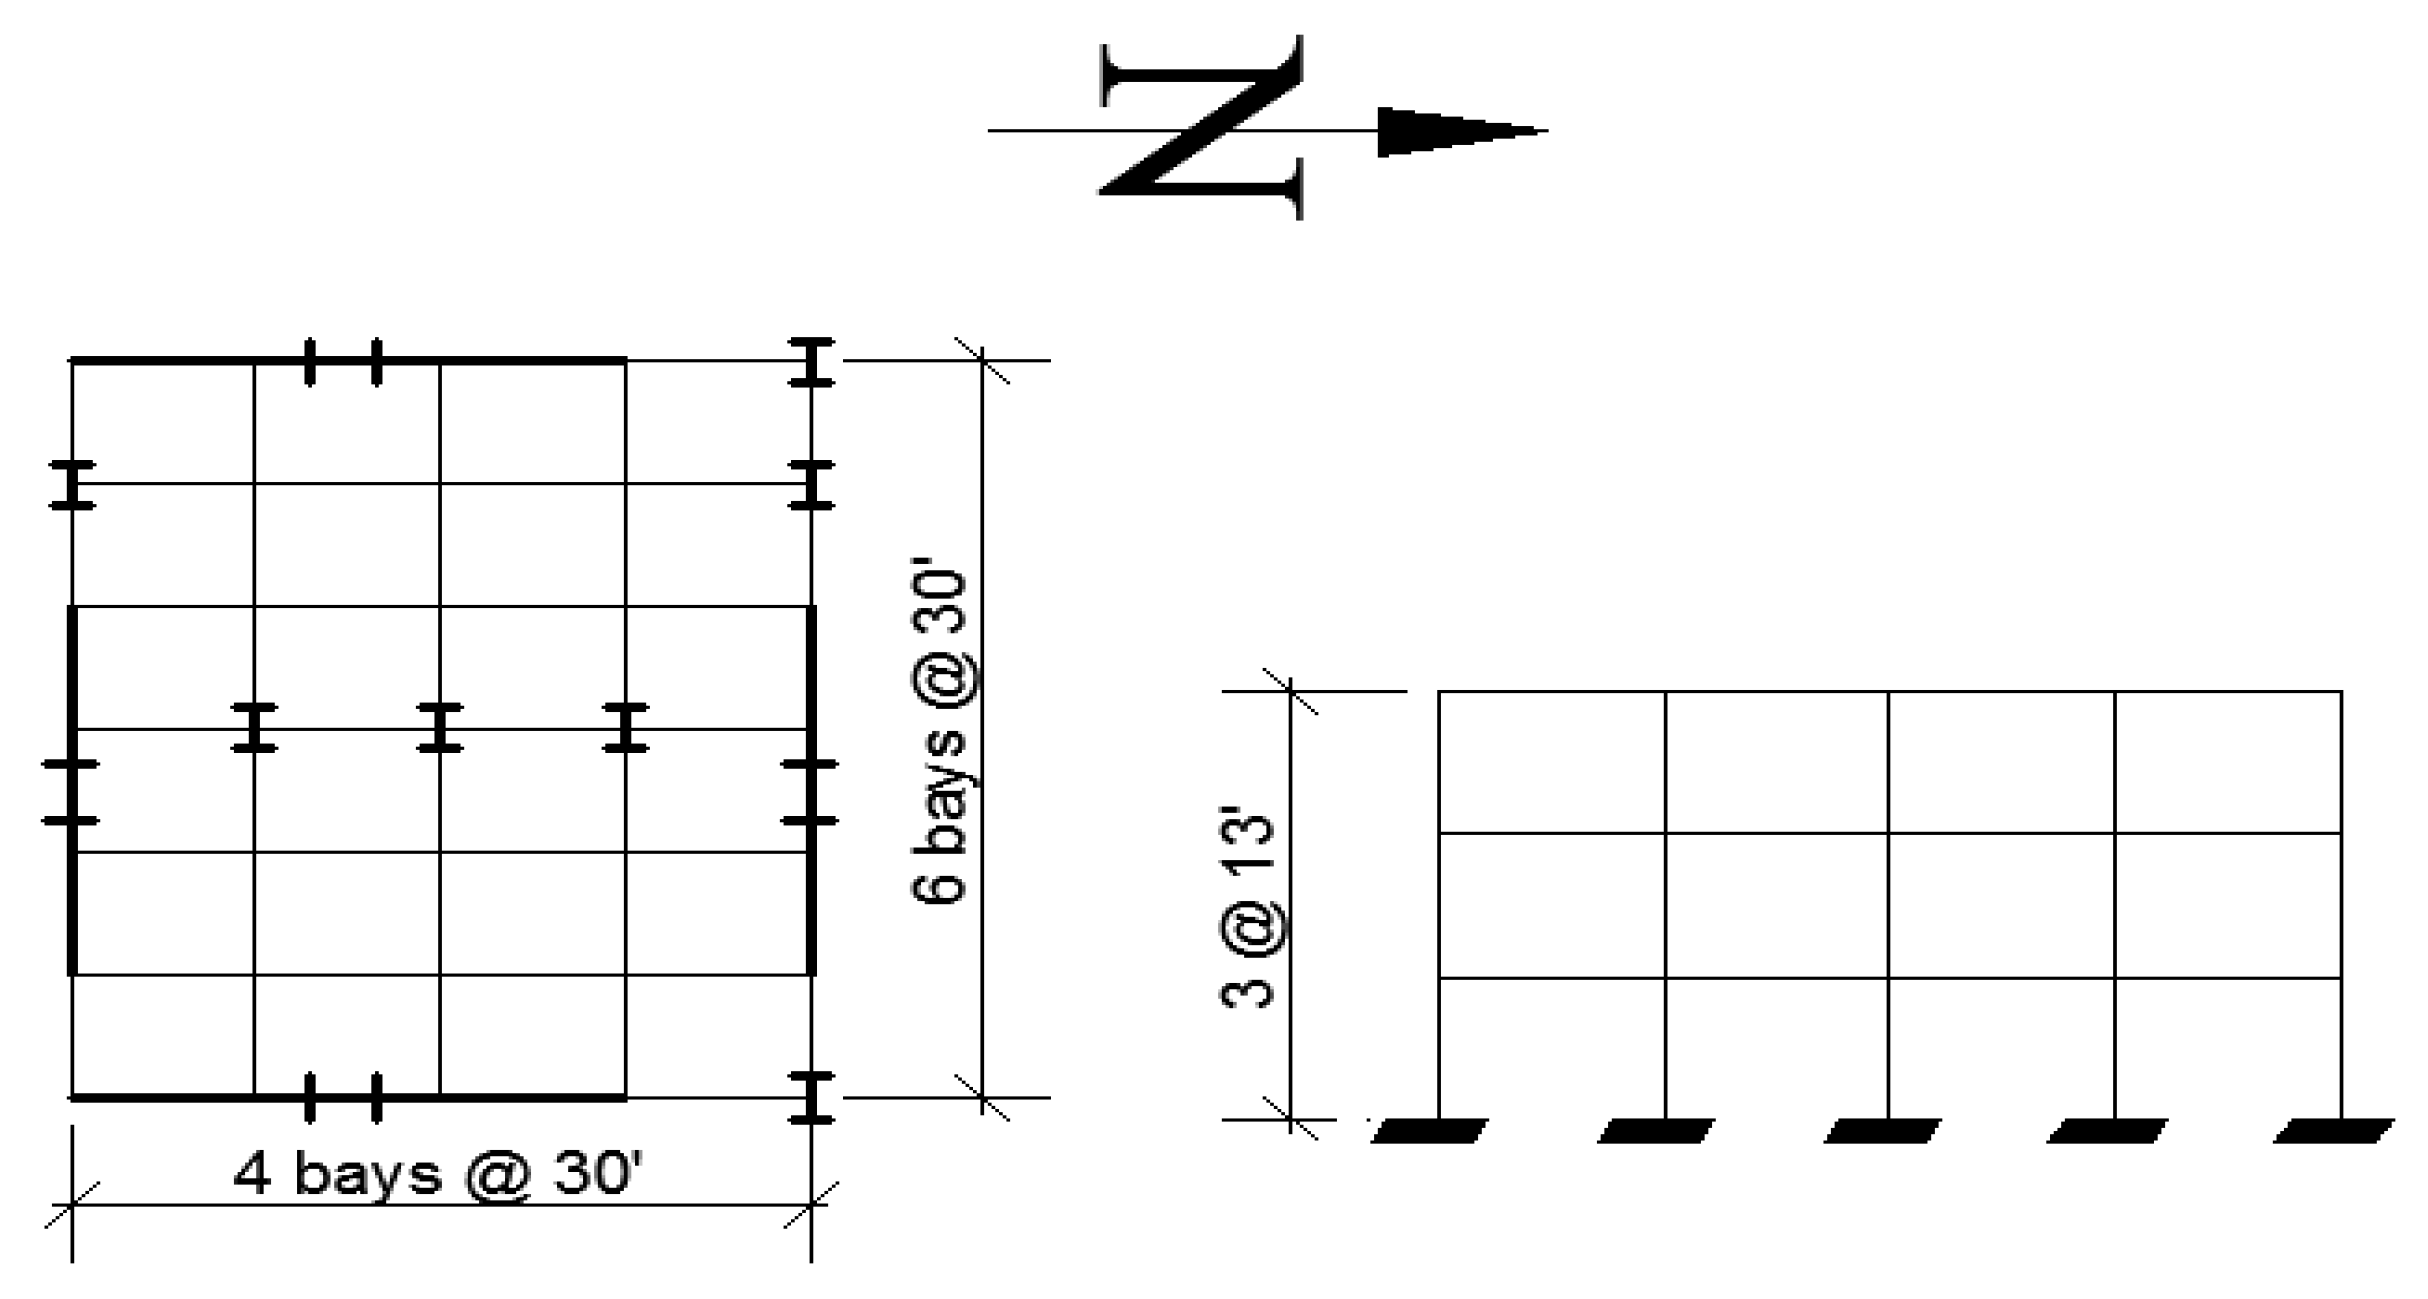
3.2. Structural Models with W14 Columns

The three-, nine-, and twenty-story buildings with PMRF considered in the SAC steel project [36] located in the Los Angeles area are used in this study; they are assumed to satisfy the code requirements existing at the time of the project (Uniform Building Code) [37]. These models are used for the following reasons: (a) they represent a standard design practice in the United States; (b) they were designed for experienced structural engineers in the United States for a very important project; and (c) they are widely used in numerical investigations. They will be referred to, in general, as the SAC models and will be particularly denoted hereafter as Models M1, M2, and M3, respectively. The first three lateral vibration periods of Model M1 are 1.05 s, 0.29 s, and 0.15 s, while those of Model M2 are 2.36 s, 0.79 s, 0.54 s. The corresponding values for Model M3 are 4.15 s, 1.34 s, 0.75 s. Their design base shear coefficients are 0.08, 0.04, and 0.03, for Models M1, M2, and M3, respectively, according to ASD-UBC 94. The damping is considered to be 3% of the critical (ζ = 3%). The plan and the elevations of Models M1, M2, and M3 are given in Figure 1, Figure 2 and Figure 3, respectively. In such Figures (plan), the I-shaped symbol indicates the orientation of the columns; the term “4 bays @ 30′” means “four bays spaced every 30 feet”. The axial loads and bending moments are studied for some exterior (EXT) and interior (INT) columns of the PMRF located at the ground-floor level, as indicated in the figures. The sections, including girders and columns, of Models M1 and M2 can be seen in Table 1, while those of Model M3 are shown in Table 2. It is to be noted that that all column sections used in these models are compact.

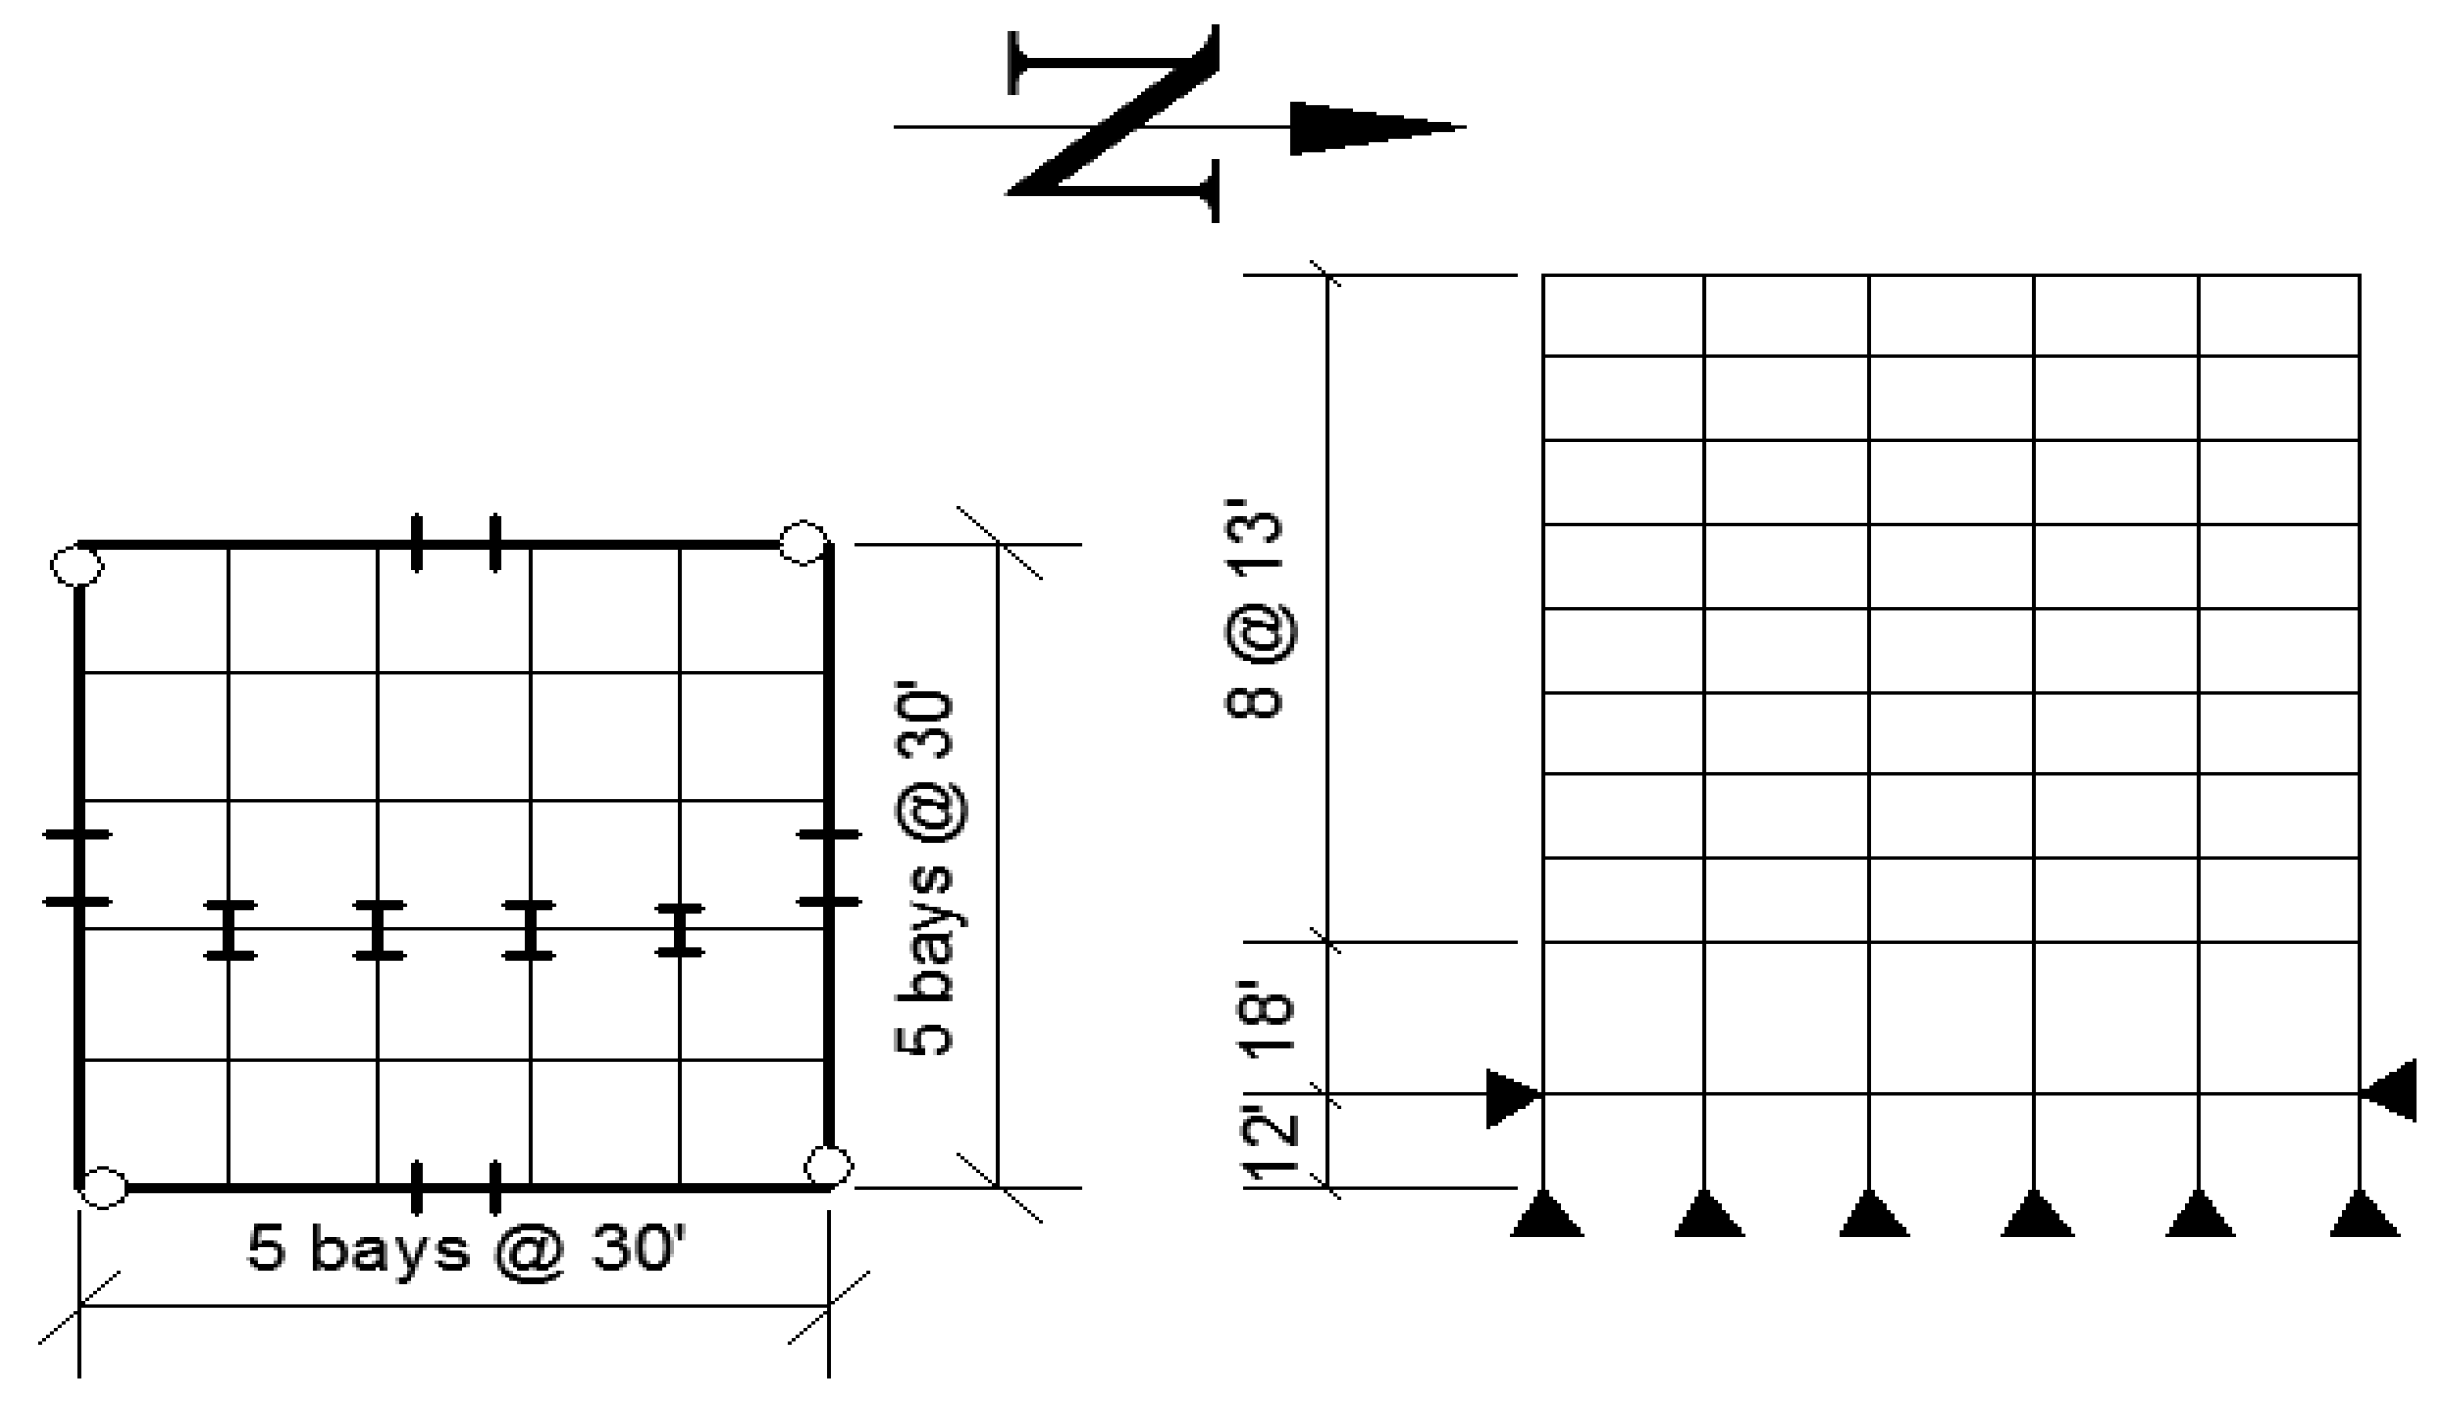
3.3. Structural Models with Deep Columns

The geometry and the beams are the same for the models with medium and deep columns. Obviously, the columns of the PMRF are different. The models with deep columns will be referred to hereafter, in general, as the deep models and, in particular, as Models L1, L2, and L3, respectively. The first three lateral vibration periods of Model L1 are 0.88 s, 0.17 s, and 0.12 s, while those of Model L2 are 1.95 s, 0.40 s, 0.21 s. The corresponding values for Model M3 are 3.87 s, 0.75 s, 0.40 s. The column sections are shown in Table 3 for Models L1 and L2, while those of Model L3 can be seen in Table 4.
The models used in the study are subject to different levels of deformation, including one associated with the formation of plastic hinges. In this regard, lateral–torsional buckling (LTB), flange local buckling (FLB), and web local buckling (WLB) should be avoided. In this research, it is assumed that the slab provides continuous lateral bracing in such a way that LTB may not occur. FLB and WLB may not occur either since the flanges and webs of the section are compact (see Section 3.5). It is to be pointed out that, as for the case of the models with medium columns (Models M1, M2, and M3), only compact sections were used for Models L1 and L2. In order to have a similar increment in stiffness for the case of the twenty-story building (Model L3) as for that of Models L1 and L2, while replacing medium columns with deep columns, whenever it was possible the largest W compact sections (W40) given in the AISC Construction Manual [38] were selected. In fact, equivalent deep compact columns were found for all sections except for the last three upper ones (W24 × 131, W24 × 117 and W24 × 84). However, hypothetical equivalent sections, which are assumed to be compact, were considered (W40 × 131, W40 × 117 and W40 × 84) in such a way that the increment in stiffness and in plastic moment capacity were in the same proportion as that of the other columns. To clarify, the increment in stiffness, as well as in plastic moment, while replacing medium columns with deep columns for the twenty-story building, is smaller (by about 15%) than those of the three- and nine-story models. Another factor contributing to the smaller increment in lateral stiffness in the case of the twenty-story model is due to the fact that deep columns are used only inside since the others (outside) are HSS box columns. It is worth mentioning that there is experimental evidence that if compact sections are used in a moment-resisting steel frame, drifts of up to 5% can be reached and still vibrate in a stable manner [39,40,41,42,43]. Despite that, these examples do not mean that all the connections with compact sections can have the expected seismic behavior. In general, the post-earthquake connection details and highly ductile members are required by the AISC seismic provisions and have been adopted in many new steel constructions in regions of high seismicity.

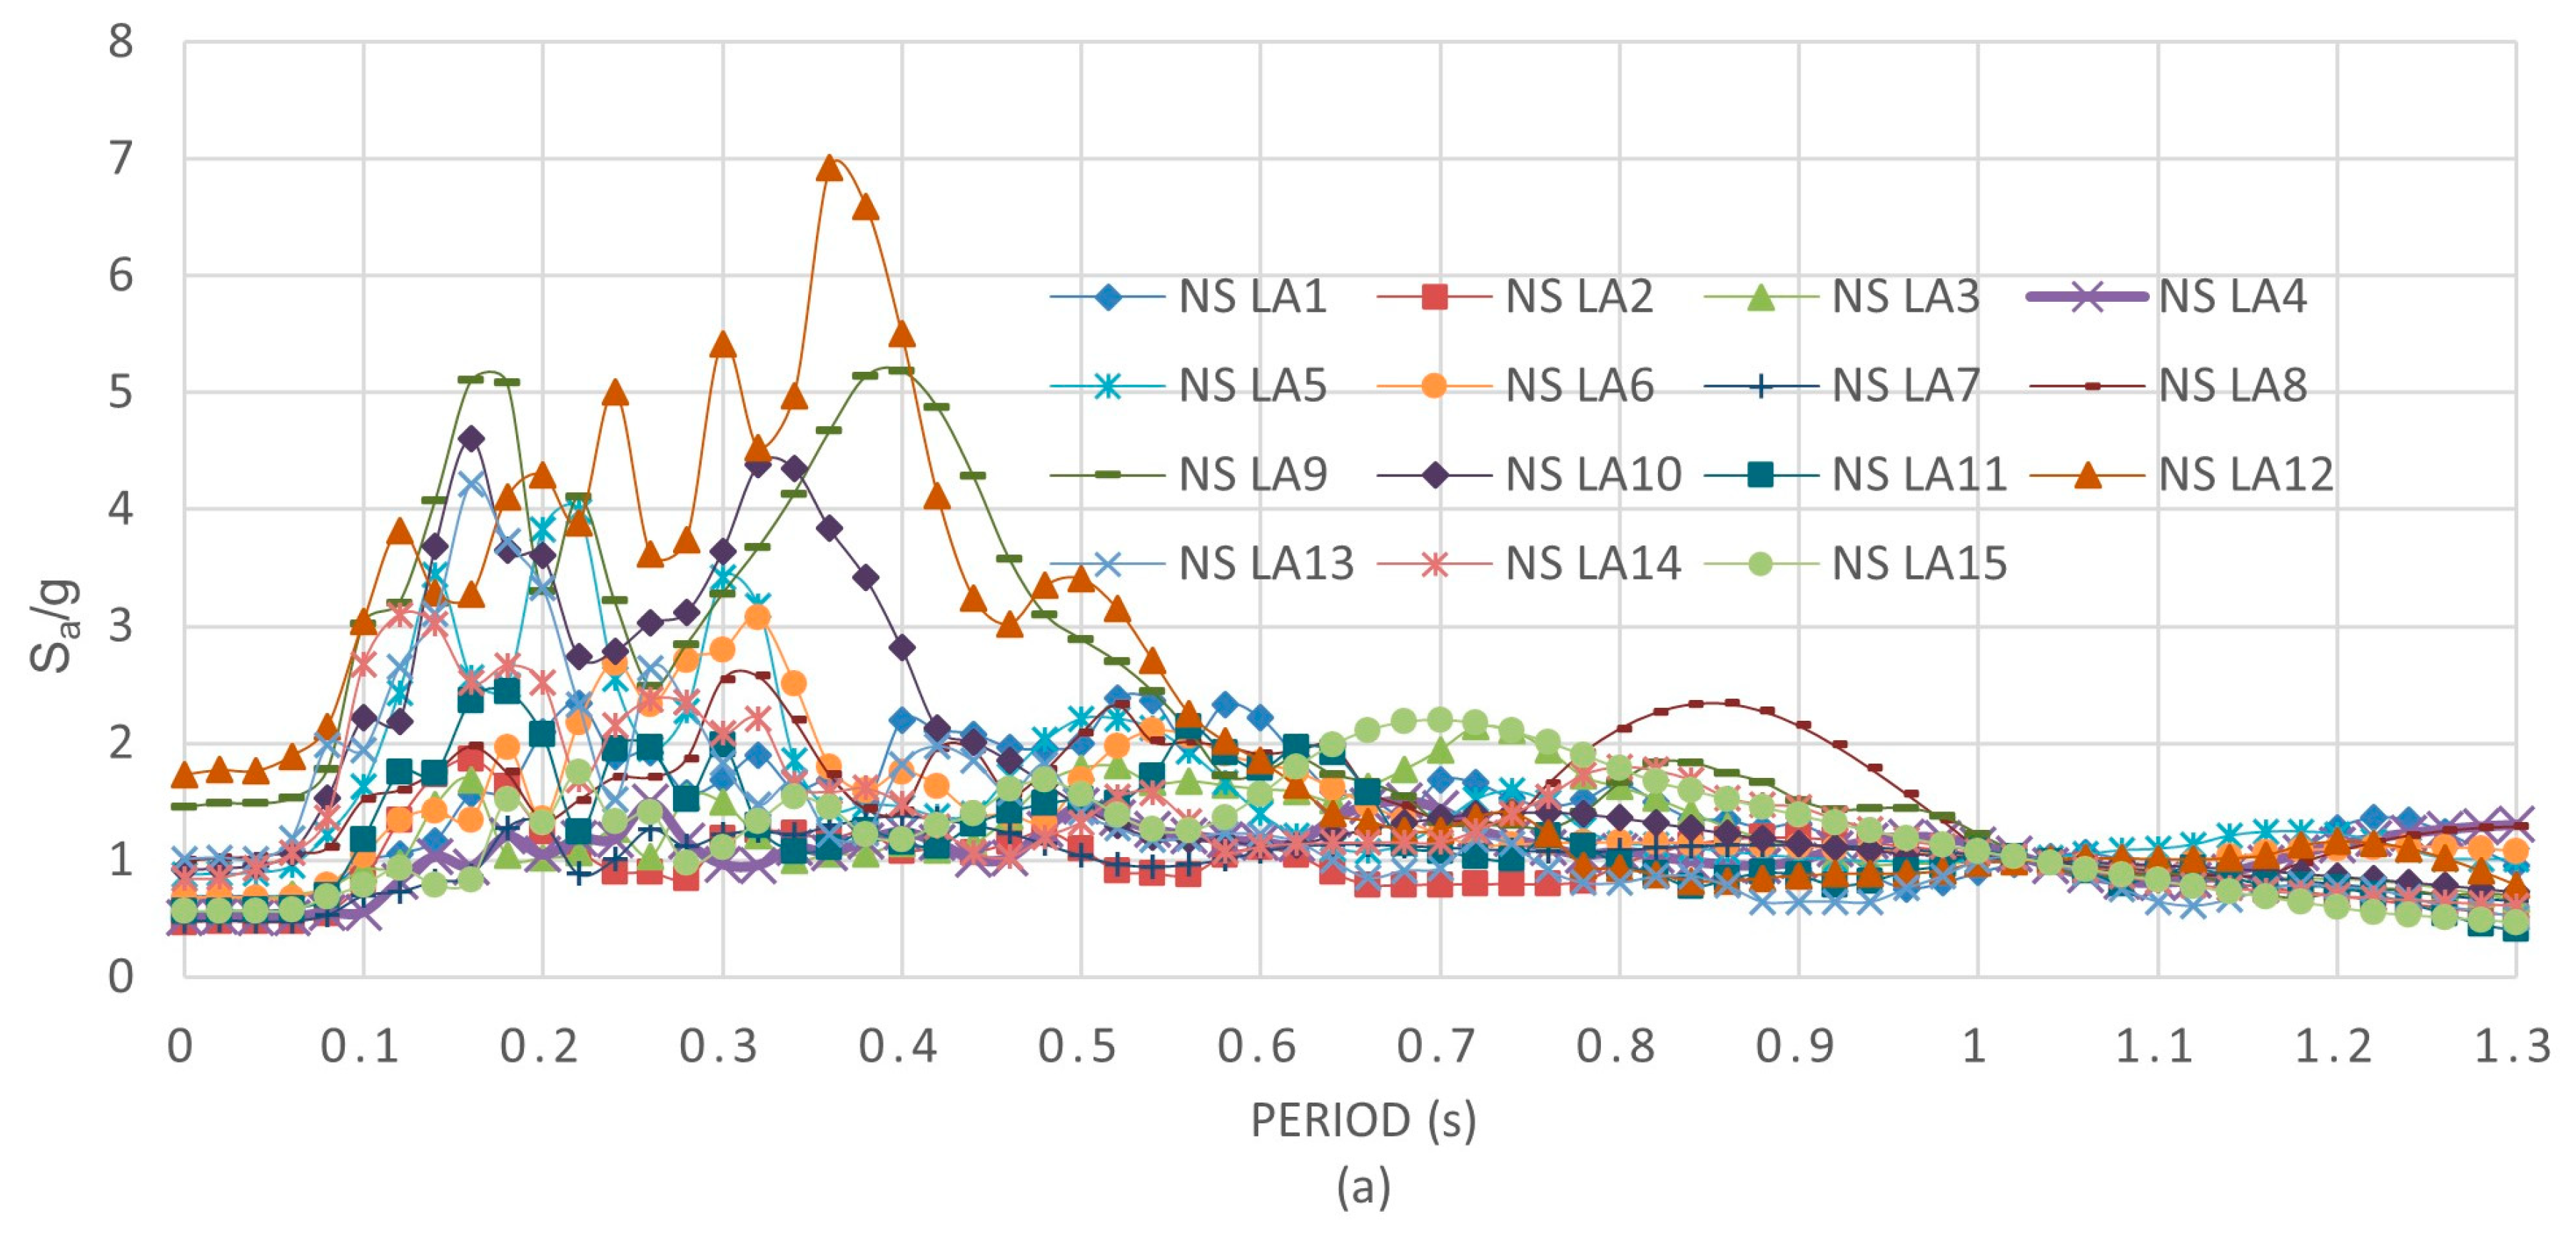
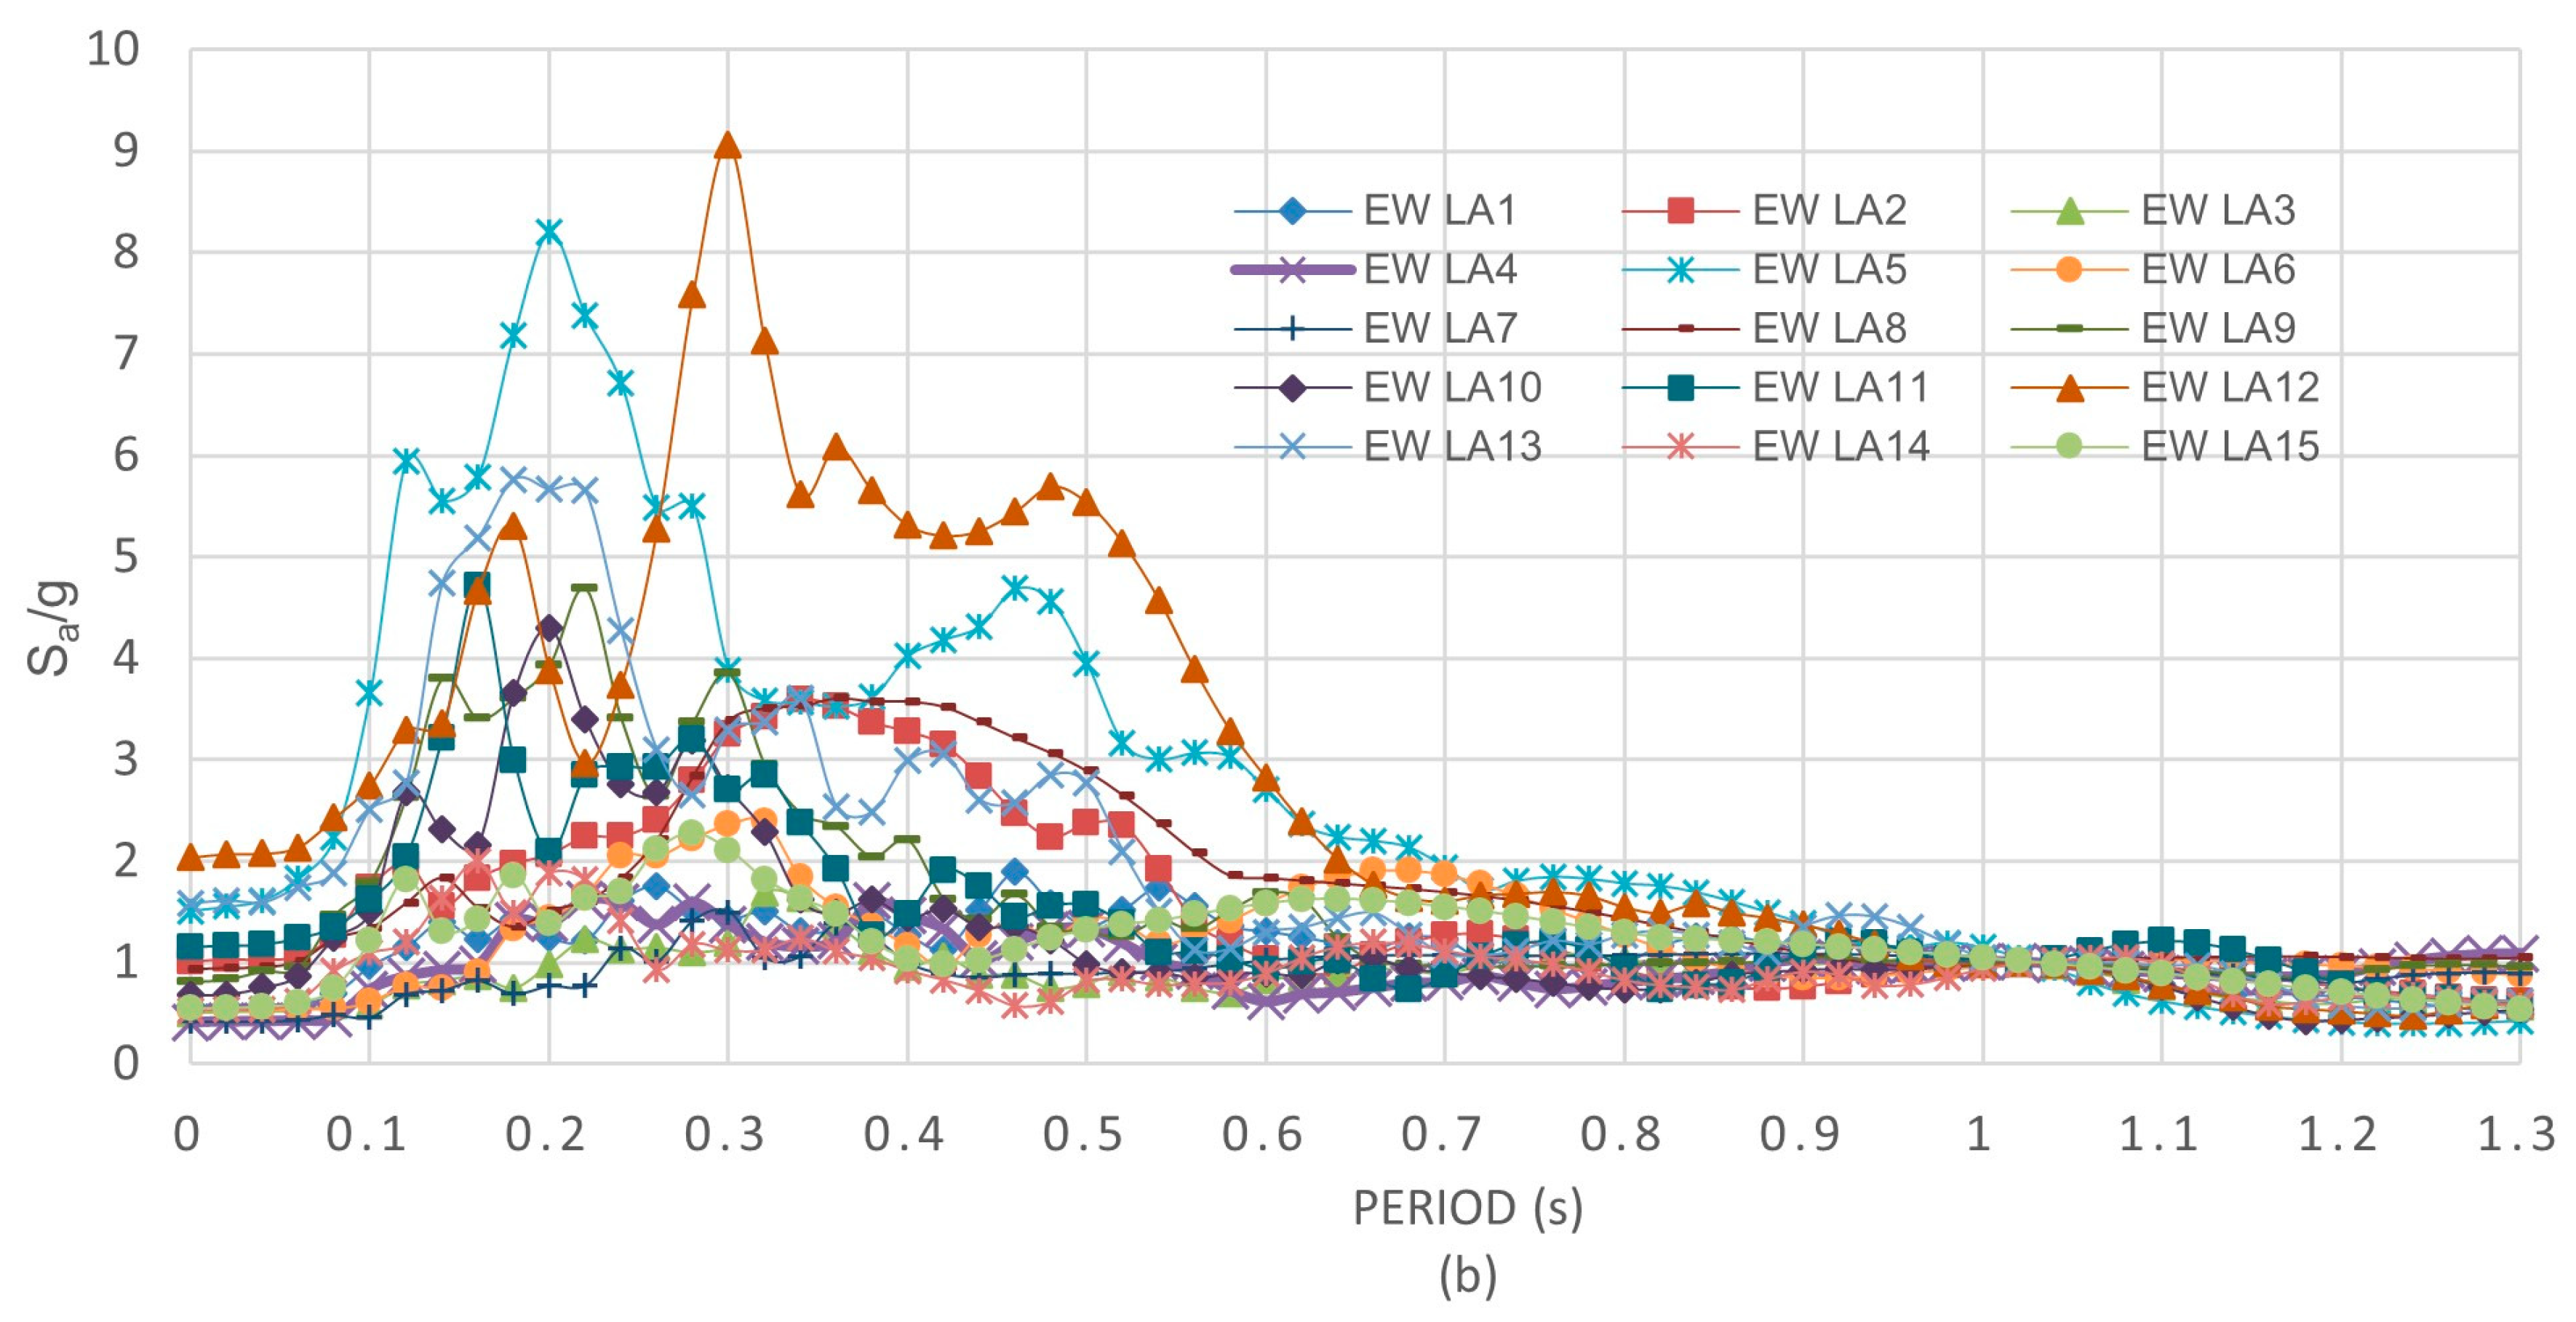
3.4. Strong Motion Records

The models are excited by fifteen strong motion records, which are representative of the area where the structural models are located; their main characteristics are given in Table 5 and are denoted as Strong Motions 1 to 15. It is worth mentioning that, for example, ASCE 7–16 establishes a minimum of eleven motion pairs to achieve reliable estimates of mean structural response in nonlinear dynamic analysis. The data of the seismic records were obtained from the Data Set of the National Strong Motion Program (NSMP) of the United States Geological Survey (USGS). The horizontal seismic component with the greater peak ground acceleration (PGA), as well as the vertical component and the tributary gravity load, are simultaneously applied to the PMRF oriented in the EW structural directions. Then, the horizontal component with the greater PGA is replaced by the other horizontal component (with the lower PGA), which together with the vertical component and the gravity loads are applied to the PMRF oriented in the NS direction. It must be noted that the PMRF oriented in the EW direction of the three-story building, or of the nine-story building, is identical to that of the NS direction, but they are not identical for the twenty-story building. The pseudo-acceleration response spectra for both horizontal components and 3% of critical damping are shown in Figure 4a,b for the NS and EW directions, respectively. The spectra are scaled to have a Sa/g = 1.0 at a period of 1.03 s.
In order to have different levels of deformation, which range from elastic to significant inelastic behavior, the strong motions are scaled in terms of the spectral pseudo-acceleration evaluated at the fundamental vibration period of the structure (Sa (T1)). The values of Sa vary from 0.2 g to 1.2 g with increments of 0.2 g for the three-story building, from 0.1 g to 0.5 g for the nine-story building with increments of 0.1 g, and from 0.1 g to 0.25 g for the twenty-story building with increments of 0.05 g. For the lowest strong motion intensities mentioned above, the buildings’ behavior was essentially elastic (maximum drift of about 0.5%), particularly for the three- and nine-story buildings; for the intermediate seismic intensities, moderate yielding occurred (maximum drift of about 1.6%), while for the highest intensities, a deformation state very close to collapse was developed for some strong motions; the maximum drifts were about 3.5% for a few particular strong motions. Therefore, the largest seismic intensities of 1.2 g, 0.5 g, and 0.25 g produced, for some seismic records, a maximum drift of about 3.5% in the three-, nine-, and twenty-story models, respectively.
The gravity loads used are as follows [36]: (1) the dead load at the floors to calculate the weight is 4.5 kN/m2; (2) the dead load at the floors to calculate the mass is 4.04 kN/m2; (3) the dead load at the roof is 3.9 kN/m2; and (4) the reduced live load at the floors and roof is 0.94 kN/m2. In addition, the seismic mass for the whole structure is as follows: (1) 1023.09 kN-s2/m for the roof of the three-story model; (2) 945.6 kN-s2/m for floor 2 of the three-story building; (3) 1054.83 kN-s2/m for the roof of the nine-story building; (4) 996.25 kN-s2/m for floor 2 of the nine-story building; (5) 979.22 kN-s2/m for floors 3 to 9 of the nine-story building; and (6) for the twenty-story building, the values are 584.88 kN-s2/m, 564 kN-s2/m, and 551.29 kN-s2/m, for the roof, floor 2, and floors 3 to 20, respectively.

3.5. Local, Shear, and Lateral–Torsional Buckling of Deep Columns

The main incentive of structural engineers in using deep columns is to reduce the maximum drifts. Similarly, using deep columns easily helps to achieve the weak-beam strong-column requirements. However, width/thick ratios of webs (hw/tw) and flanges (bf/2tf) are relatively large so revisions of the LTB, FLB, and WLB, as well as of the web shear buckling (WSB), are required. Columns in the MRF of a steel building subjected to significant deformations produced by earthquakes are usually under the action of moderate axial loads but very high bending moments, so plasticization is mainly produced by bending, and, consequently, compactness in bending needs to be revised.
As stated earlier, in this research, it is assumed that the slab provides continuous lateral bracing in such a way that LTB may not occur. Regarding FLB and WLB, from a revision of the properties and dimensions of the deep column sections used in Models L1, L2, and L3 [41], it is observed that the bf/2tf and h/tw ratios do not exceed the limit values given in Chapter B (Table B4.1b of the AISC Specification [44]), so the flanges and webs are both compacts. Similarly, regarding the web shear, it is revised so that the sections satisfy the requirements given in Section G2.1 of the AISC Specifications [42] in such a way that WSB does not occur and the web shear yielding (WSY) is the controlling limit state.

4. Results and Discussion

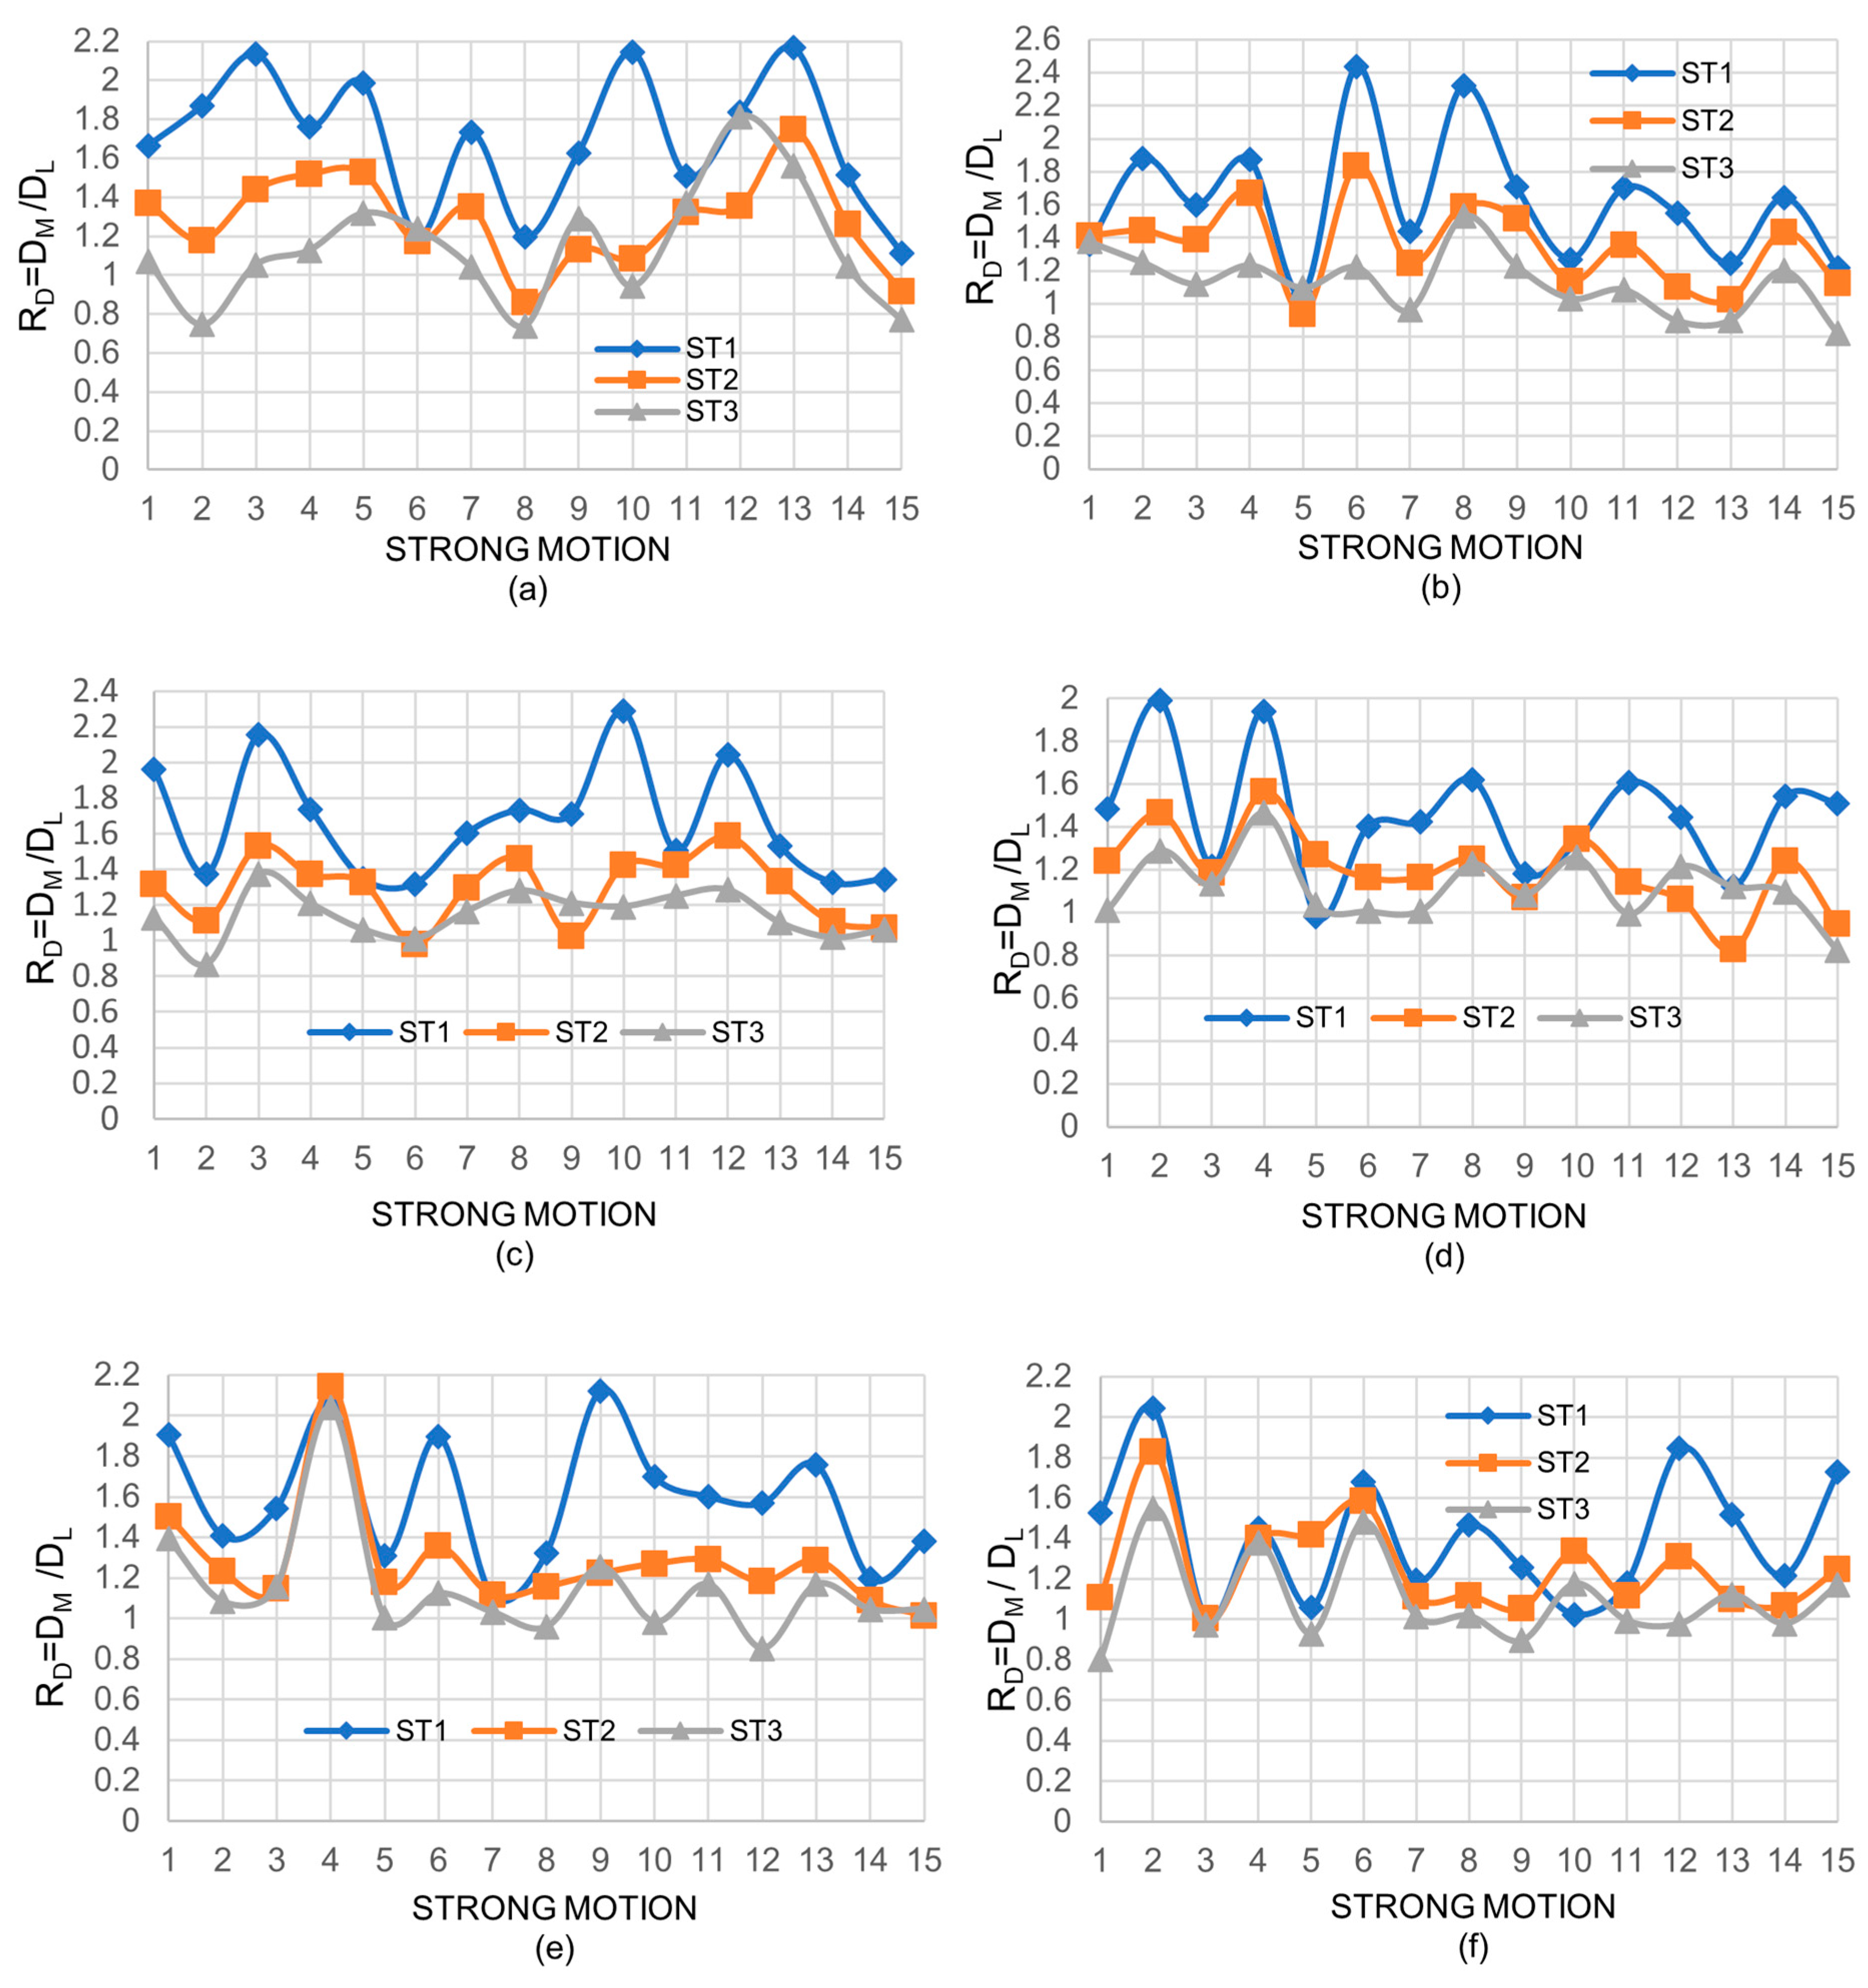
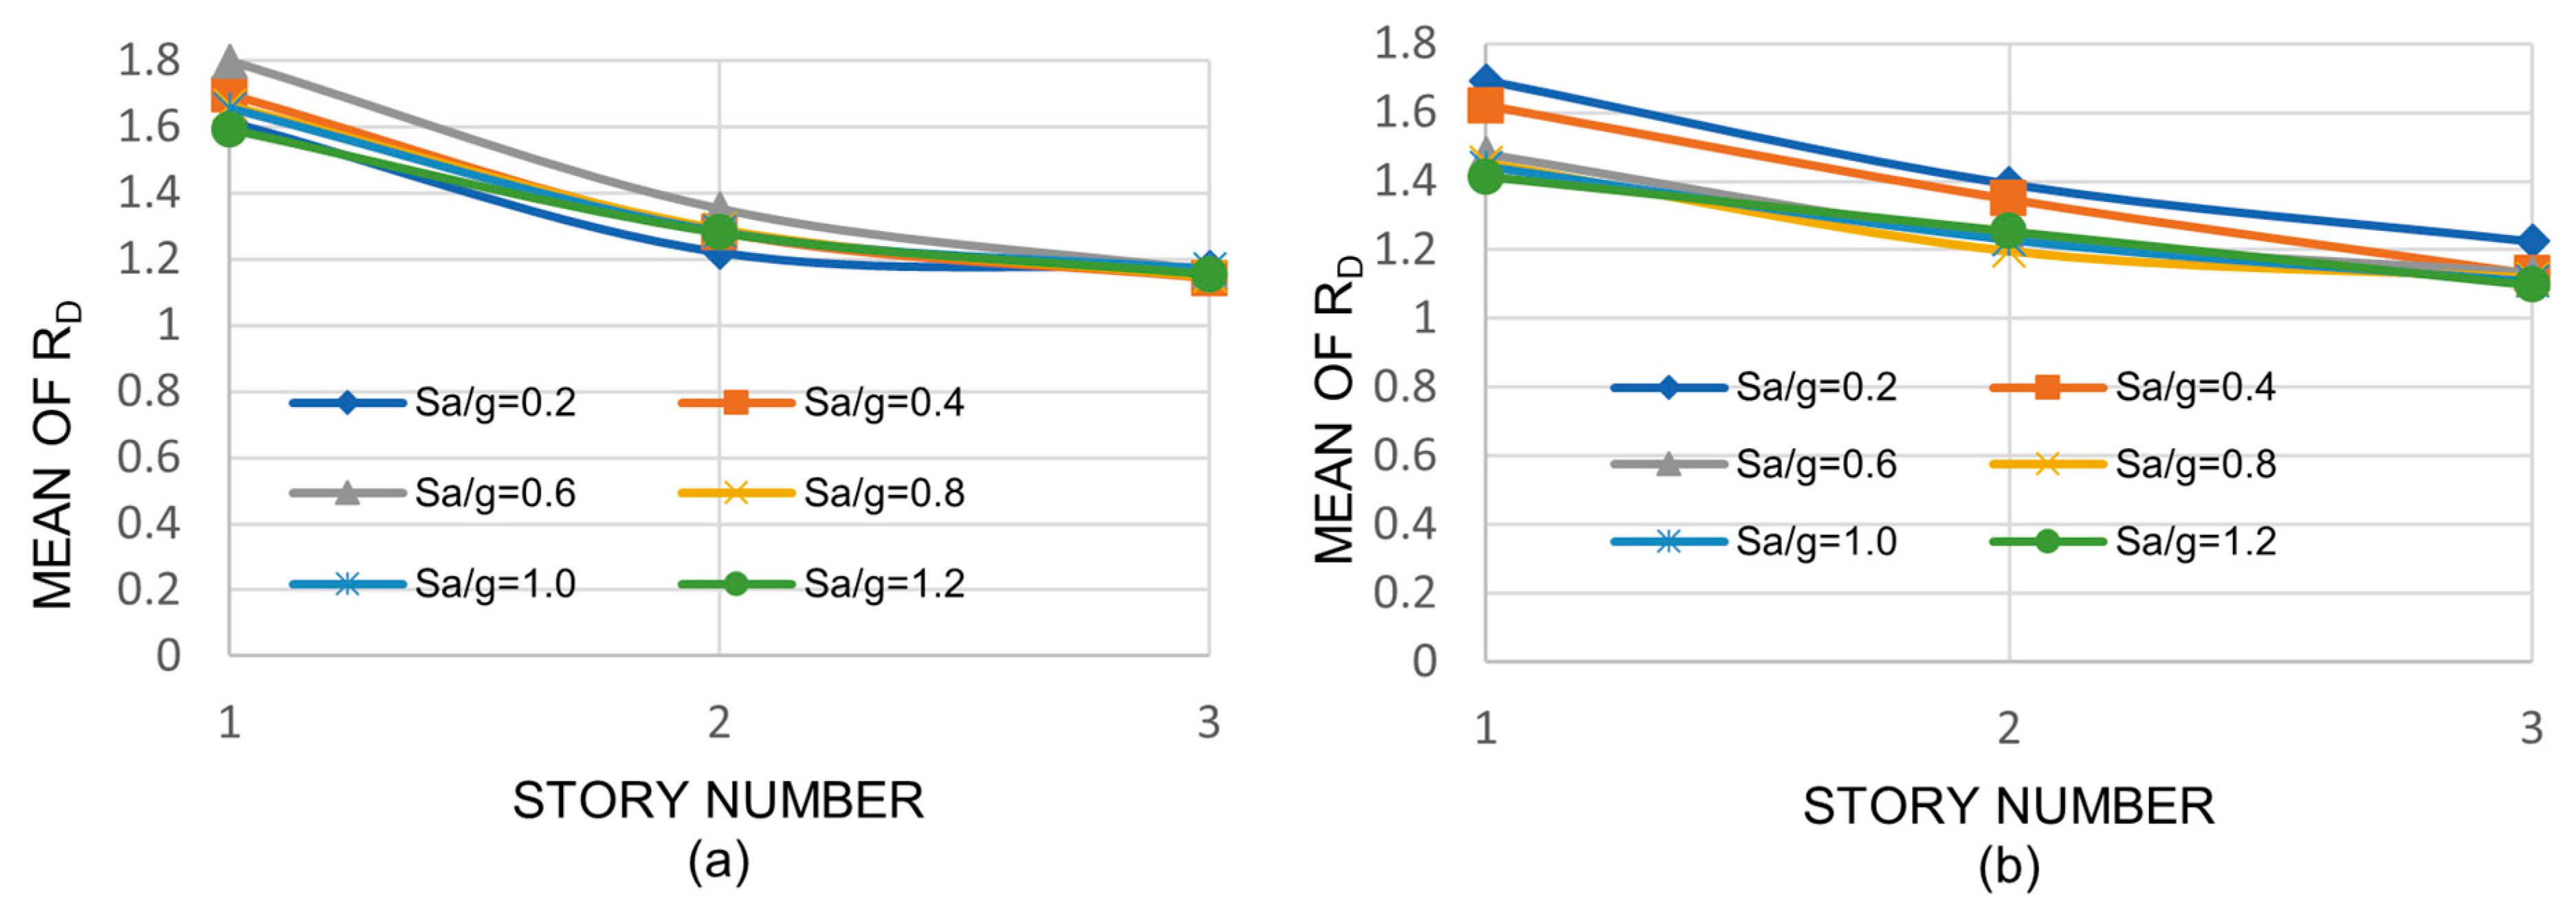
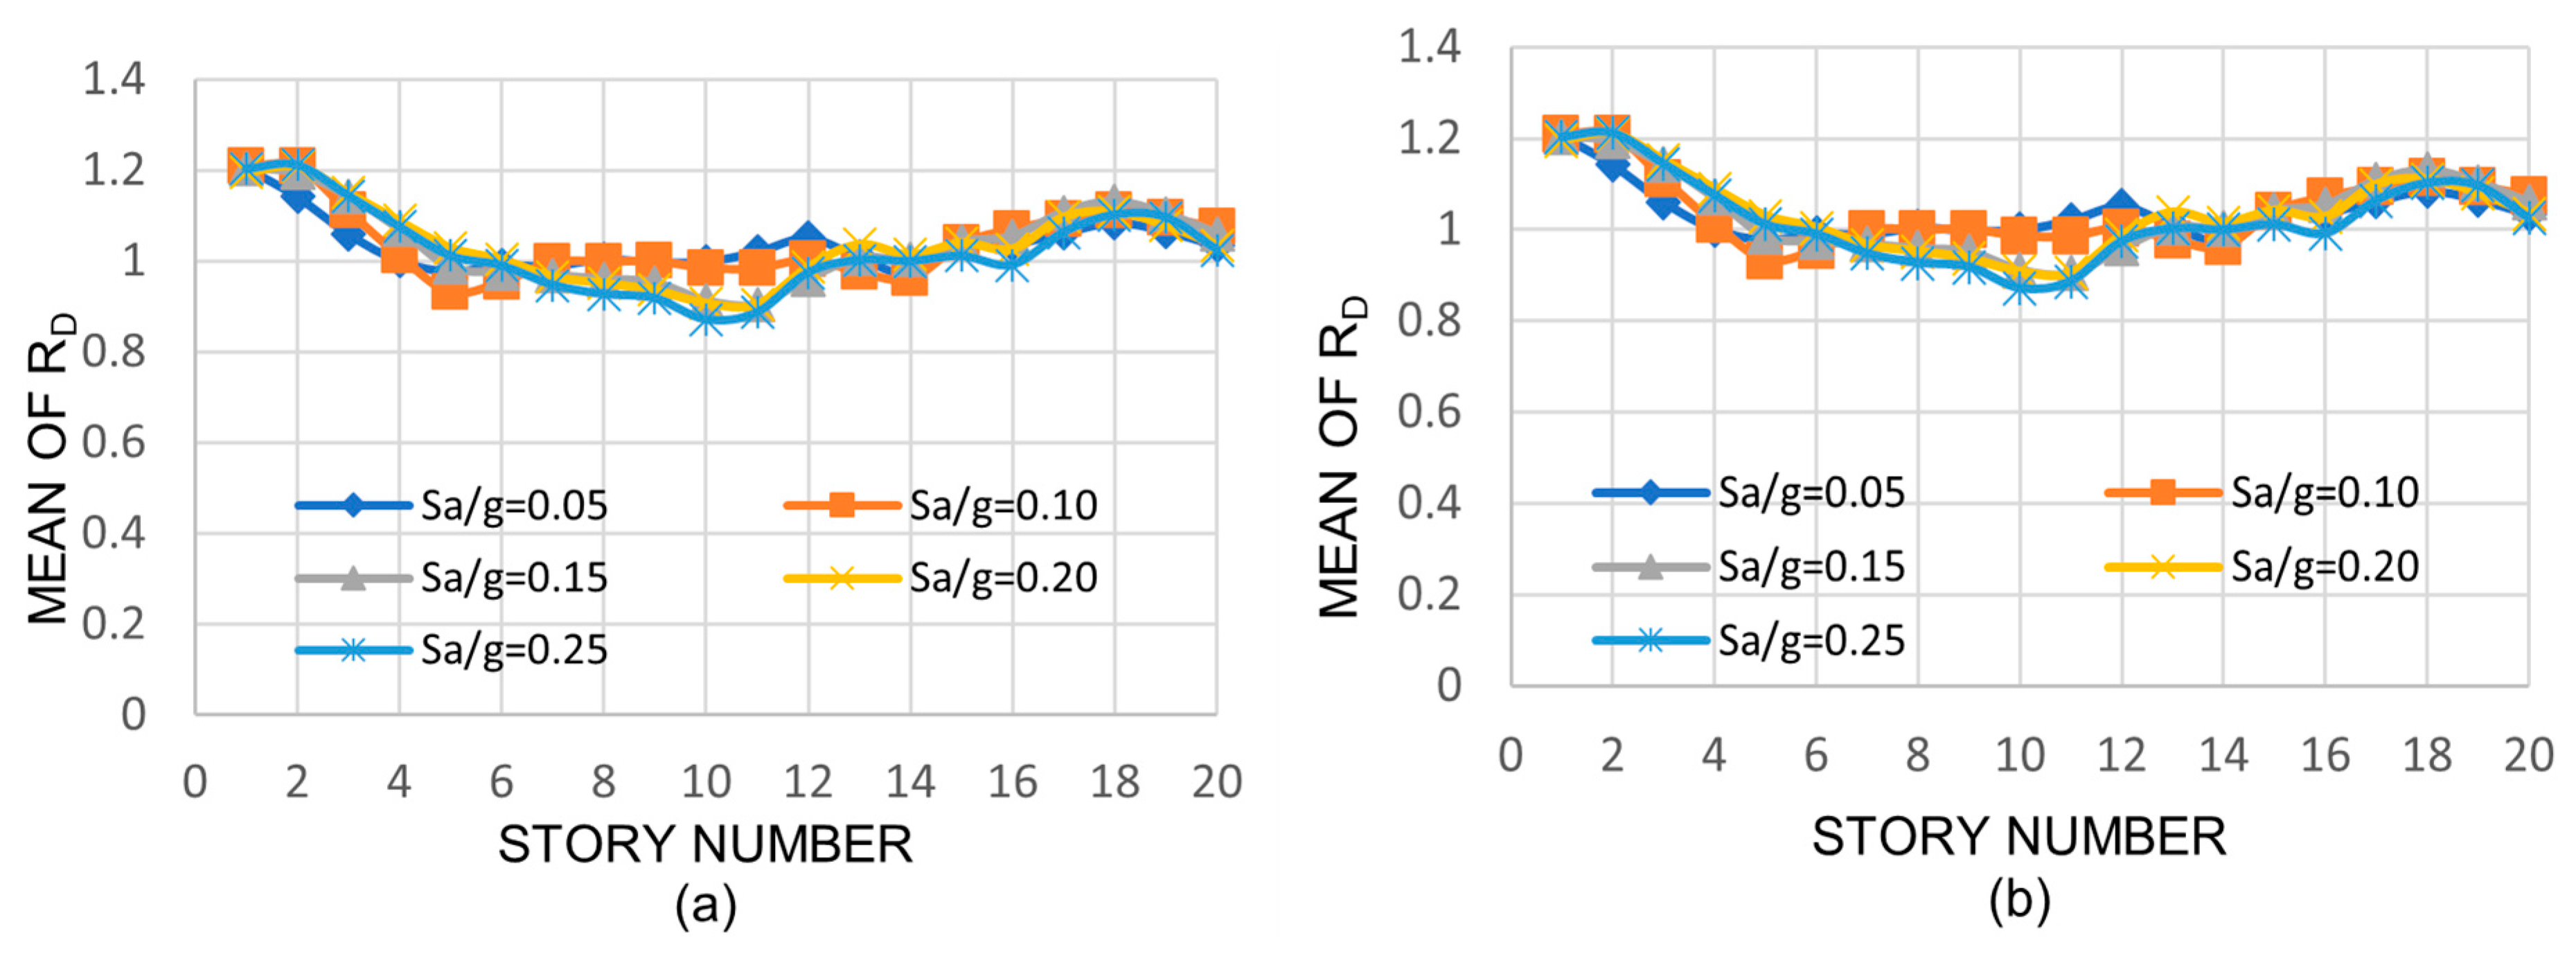
4.1. Objective 1: Results in Terms of Displacements

In this part of the paper, the seismic responses of the building models with medium columns, in terms of drifts and roof displacements, are compared to those of the models with deep columns. To make the comparison, the following ratios (RD and RDT) are used:
R D = D M D L
R D T = D T M D T L
where the symbols R, D, DT, represent the words ratio, drift, top displacement, respectively. Similarly, M and L, represent the words medium and large, which in turn stand for medium and deep columns, respectively. Hence, for a direction and a story of a given model, DM and DL represent the maximum drifts when medium and deep columns are used, respectively. DTM and DTL have a similar meaning except that top displacements are used instead. A value of RD, or RDT, greater than unity will indicate a reduction in the drift, or in the top displacement, when deep columns are used in the buildings. On the other hand, values of RD or RDT smaller than unity will indicate an increment in the above-mentioned response parameters.
Results for drifts are discussed first. Some values of the RD parameter for the NS direction of the three-story model are presented in Figure 5a,c,e for seismic intensities of 0.4 g, 0.8 g, and 1.2 g, respectively; the corresponding results for the EW direction are shown in Figure 5b,d,f. In these graphs, the term ST stands for the number of stories.
A significant variation in the RD parameter can be observed from one strong motion to another without showing any trend, indicating a significant effect of the frequency content of the strong motions and the higher modes of vibration on the drifts of the buildings with medium and deep columns. The values are greater than unity in most cases. For a few cases, however, the values are smaller than unity. These results illustrate the significant differences that exist between the responses of buildings subjected to seismic loading and to static or cyclic loading. If static lateral loading were applied, the structural drifts would decrease in all stories for all cases.
It is also observed that the closer the story is to the base, the greater the RD values will be; however, no clear trend is observed for RD as the seismic intensity increases. The most important observation that can be made so far is that the RD parameter takes values of up to 2.4, which represents a considerable reduction in the structural drifts when deep columns are used.
In addition to the six graphs given in Figure 5, another six were generated for RD considering the other seismic intensities (Sa = 0.2 g, 0.6 g, and 1.0 g) and both directions of the three-story model. Twelve graphs were also developed for roof displacements (RDT). Similar sets of plots were also developed for the nine-story and twenty-story models. However, the total results are presented and discussed in all cases only in terms of the mean values (MVs) of the RD and RDT ratios.
The MVs of RD for the three-story model are shown in Figure 6a,b for the NS and EW directions, respectively. The corresponding values for the nine-story and the twenty-story models can be seen in Figure 7a,b and Figure 8a,b, respectively. It is worth mentioning that the formation pattern of plastic hinges (PHs) can vary significantly from one seismic record to another and from one model to another. For example, for the highest intensity of seismic record number 9 and the three-story model, PHs developed first on the beams of the first floor and then on the exterior columns of the ground level. However, for the case of the highest intensity of seismic record number 3 and the twenty-story model, PHs developed first on some beams located on the middle third of the building height and then on the exterior columns of the second floor.
The results of the three-story model (Figure 6) indicate that, on an average basis and as observed from the plots of individual strong motions, the reduction in the drifts may be significant when deep columns are used; mean values of RD greater than 1.6 can be seen in many cases for the first story. It is also noted that the values tend to monotonically decrease as the story number increases, but no trend is observed with the seismic intensity. The maximum RD mean values are quite similar for the NS and EW directions.
From the results of the nine- and twenty-story buildings (Figure 7 and Figure 8), it is shown that the drift reductions, although smaller than those of the three-story building, may still be considerable; the maximum values are 1.4 and 1.2 for the nine- and twenty-story model, respectively. For the intermediate stories (8–12) of the twenty-story model, values very close to and even smaller than unity (implying an increment) can be observed; however, it does not correspond to the maximum structural demands in terms of drifts in most of these cases.
It is worth mentioning that the mean values of RD for the twenty-story building were also calculated by using hypothetical W44 columns (assuming that they were compact) instead of W40 sections in such a way that the ratios of the moments of inertia, or plastic moment, of the deep columns to those of the medium columns, were approximately the same for the three building models. It is important to say that the maximum observed mean values of RD were only larger by about 4% with respect to those of Figure 8; the maximum observed mean values of RD were about 1.25. Thus, the trend regarding the reduction in RD as the height of the building increases remains unchanged.
As stated earlier, for a given building, the mean values of RD tend to decrease with the story number. In the same manner, the RD mean values tend to also decrease as the building becomes taller. One of the reasons for this is that as medium columns are replaced by deep columns, the stiffness and the strength increase, which are lower in the tallest model. Another reason is that the effectiveness of deep columns in reducing the drifts becomes less significant for the stories away from the base since their stiffness relative to the base decreases. This is similar to the transversal stiffness associated to a point of a cantilever beam, which is inversely proportional to the distance from the fixed support (base) to the point under consideration.
The MVs for the RDT parameter are shown in Column (2) of Table 6 for the three models. The results are similar to those of RD for the case of the three- and nine-story models in the sense that the reduction in the roof displacements is significant when deep columns are used and that no trend is observed with the seismic intensity. However, the maximum values of RDT are smaller than those of RD. For the case of the twenty-story building, the reduction is negligible.
As in the case of RD, the maximum mean values of RDT tend to decrease with the building height: the maximum values are observed to be 1.38, 1.17, and 1.02 for the three-, nine-, and twenty-story models, respectively. These results indicate that the observed reduction in the response in terms of two parameters, which are considered to be similar and widely used to represent the maximum overall structural deformation, may be quite different when deep columns are used.

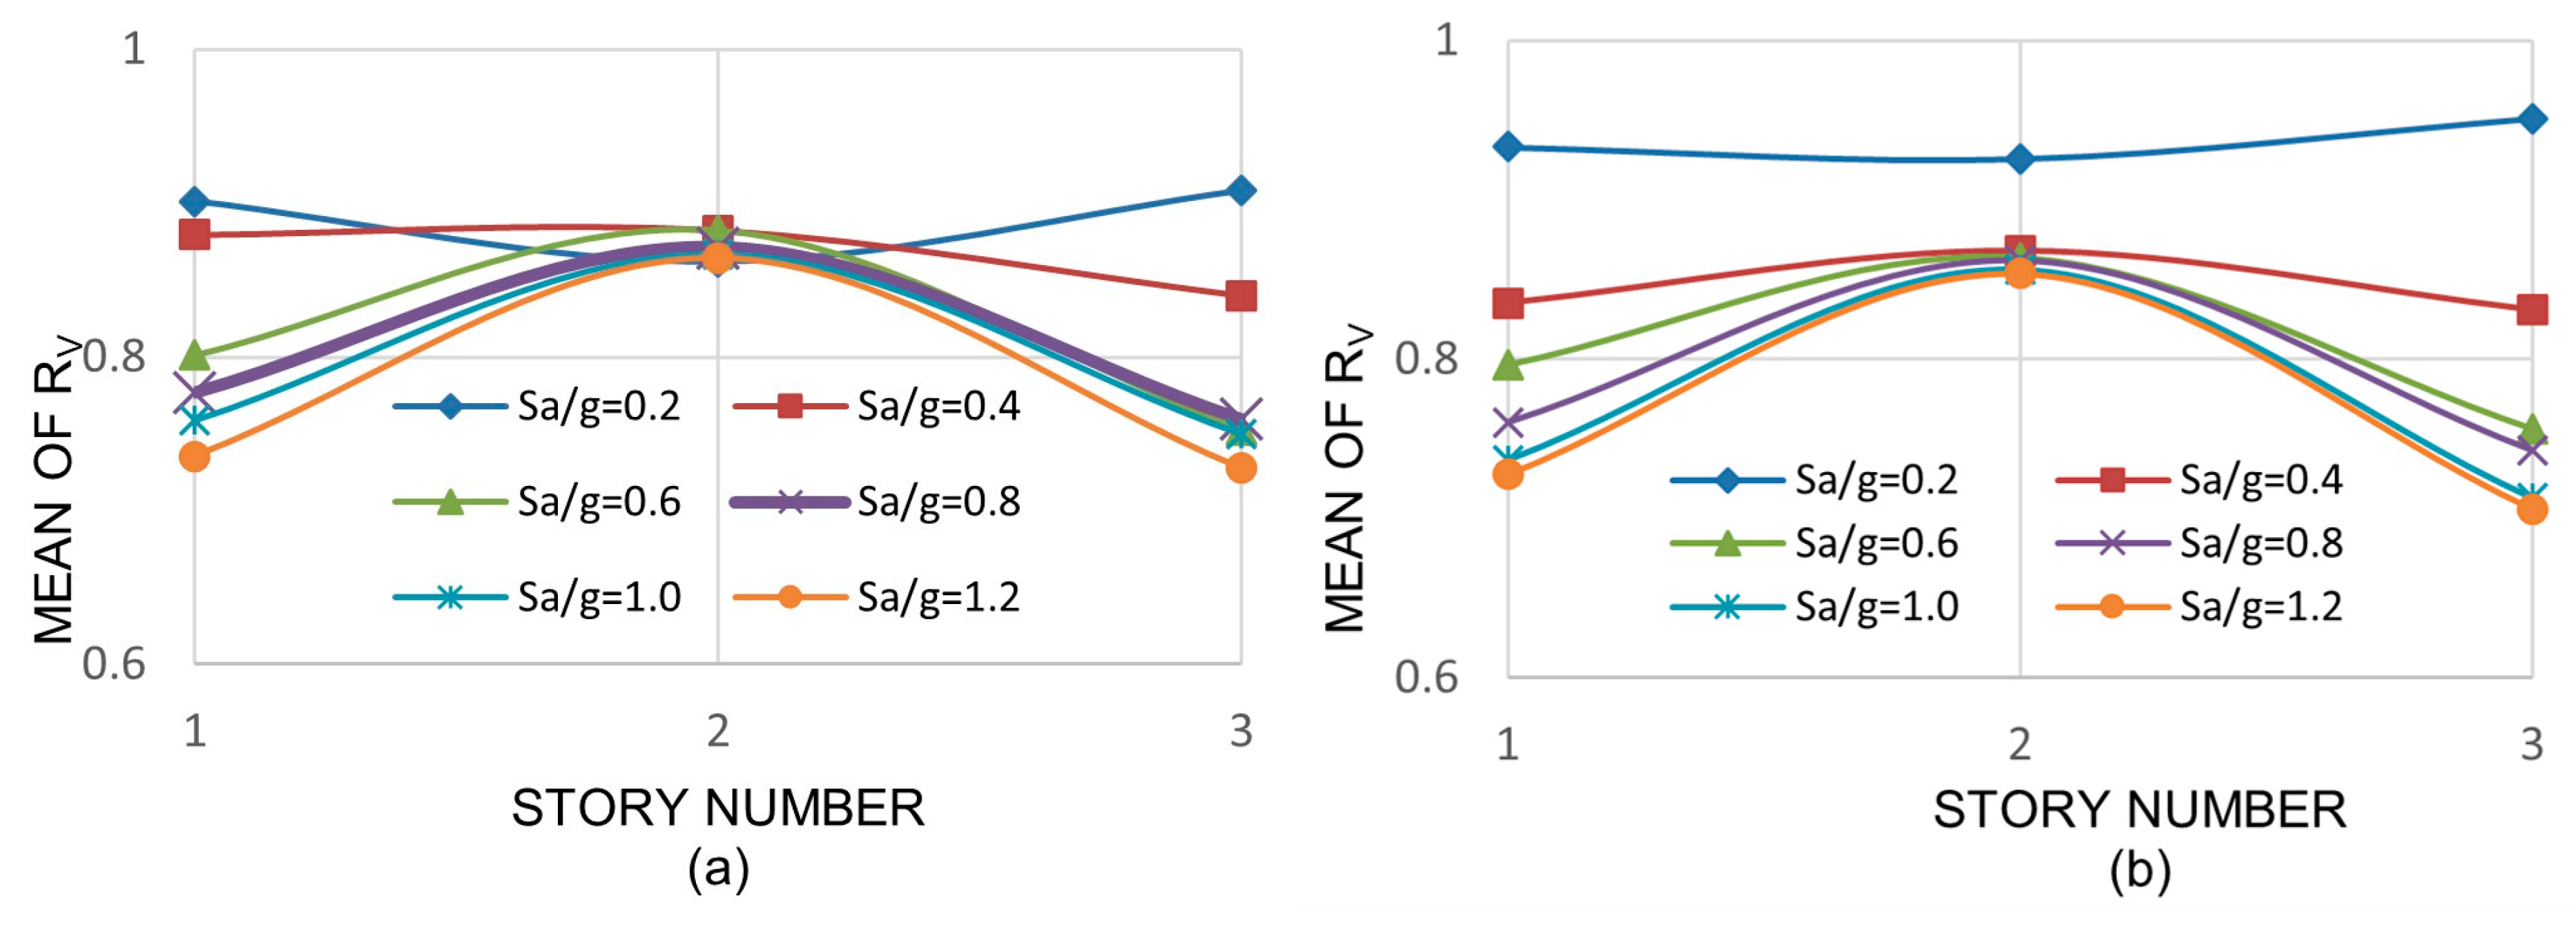
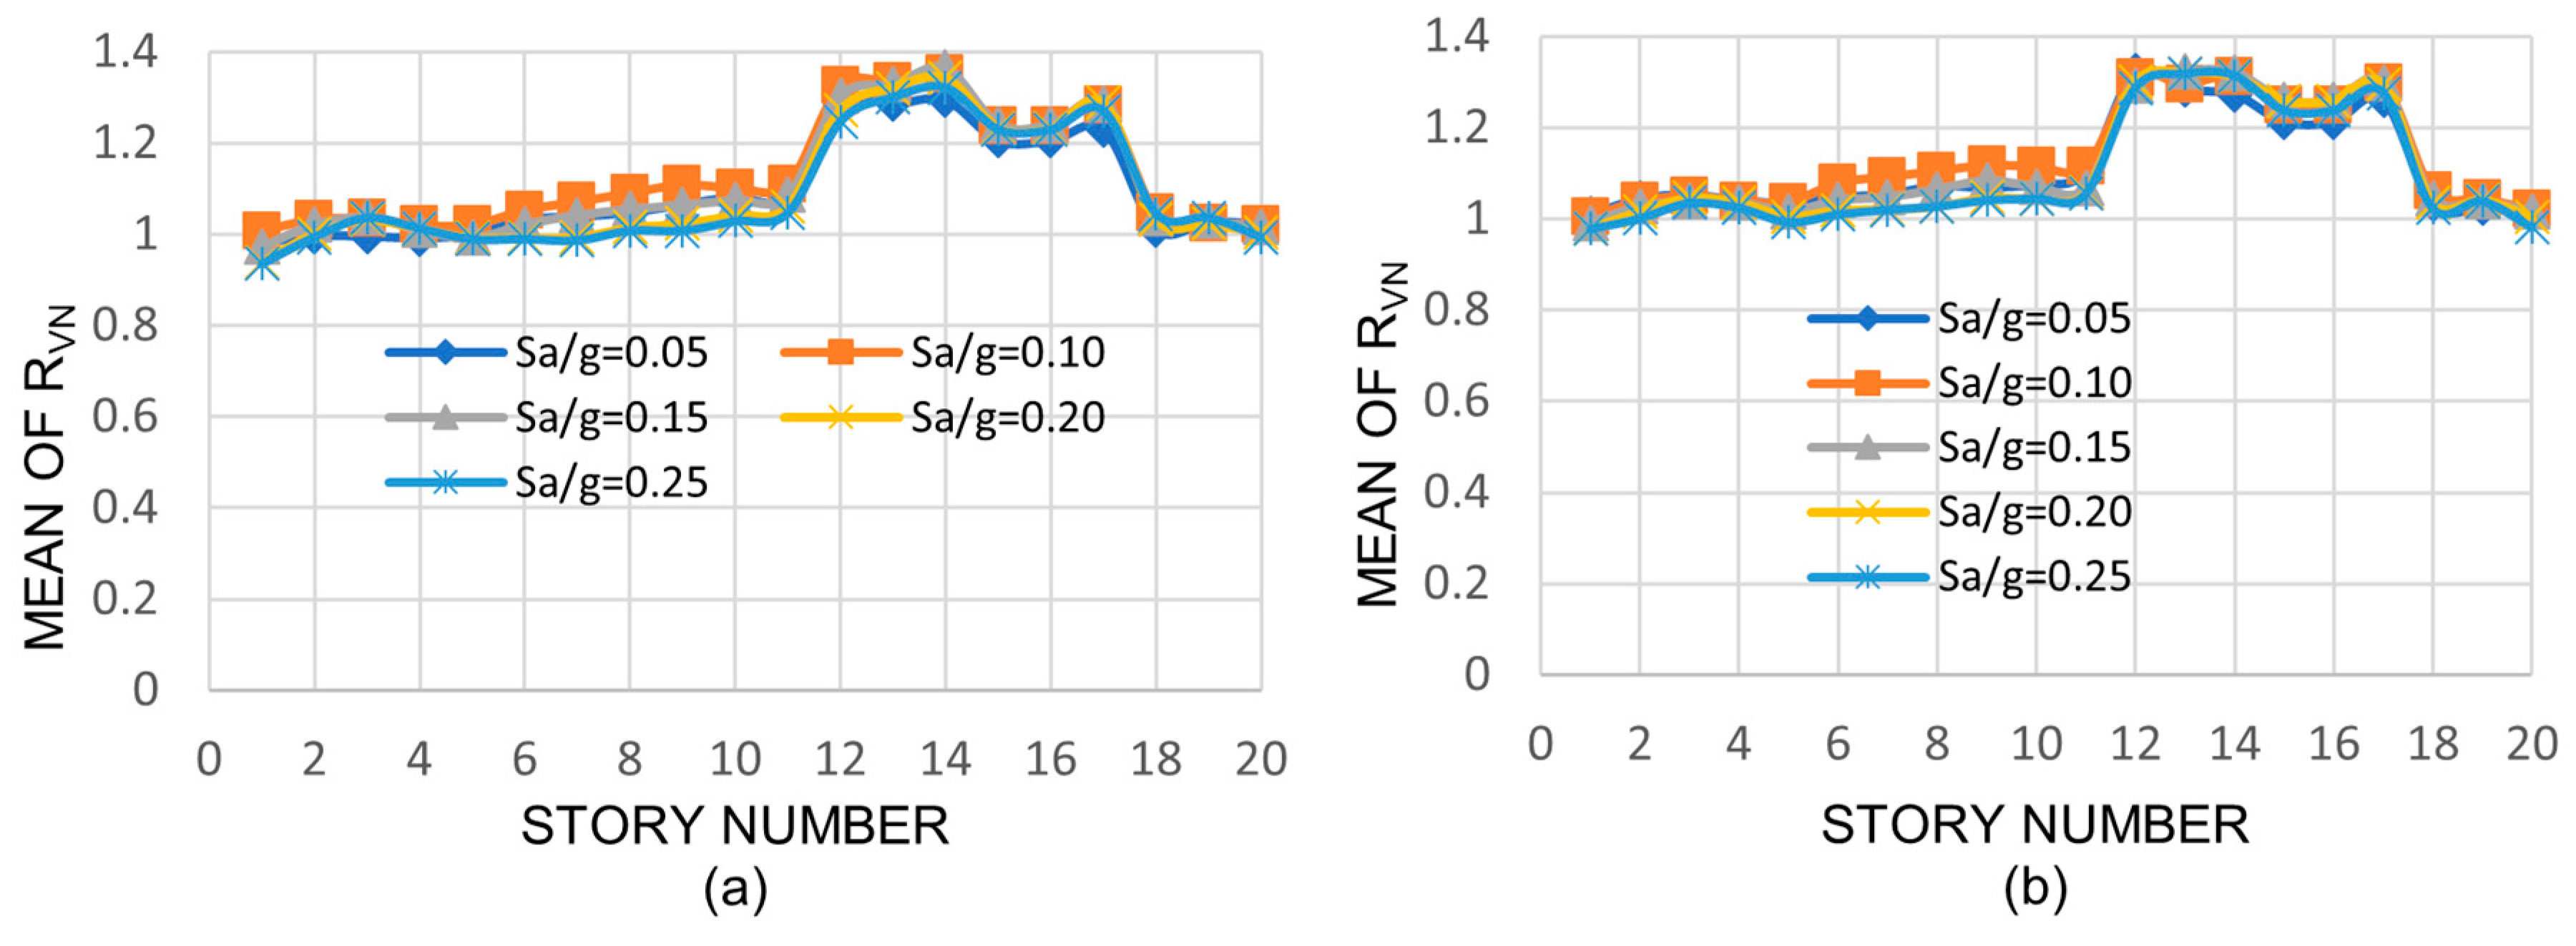
4.2. Objective 2: Results in Terms of Resultant Stresses: Interstory Shears, Axial Loads, and Bending Moments

The structural demands in terms of resultant stresses are now discussed. The ratios RV, RA, and RM, calculated according to Equations (3)–(5) given below, are used to compare the responses of the buildings for the two column depths in terms of interstory shears, axial loads, and bending moments, respectively.
R V = V M V L
R A = A M A L
R M = M M M L
In the above equations, VM and VL, AM and AL, or MM and ML have a similar meaning as that of DM and DL in Equation (1), except that interstory shears, axial loads, and bending moments are now considered. Only the mean values of these ratios are given and discussed. The mean values of RV are shown in Figure 9, Figure 10 and Figure 11 for the three-, nine-, and twenty-story models, respectively, while those of RA and RM are given in Columns (3) through (6) of Table 6. As stated earlier, for a given model, only the exterior column at the base and the one following it (interior column) are considered (see plan of models in Figure 1, Figure 2 and Figure 3).
It can be observed that the mean values of RV are smaller than unity in all cases, indicating that the interstory shears are larger for the models with deep columns. This was expected since the shear stiffness of deep columns is larger than that of medium columns; for example, the design shear strength, ϕVVn, of the exterior base column of the three-story building (W14 × 257) is 572 kips (2545 kN), while that of the corresponding equivalent deep column (W27 × 258) is 852 kips (3791 kN). The values ϕV and Vn are the shear reduction factor and the nominal shear strength, respectively. A little or moderate variation is also observed in the mean values of RV with the seismic intensity, with the story number, or with the model height; the values range from 0.75 to 0.96, from 0.77 to 0.96, and from 0.79 to 0.94 for the three-, nine-, and twenty-story buildings, respectively.
Results of Table 6 indicate that the RA mean values for the three-story building are very close to unity, tending to slightly decrease with the seismic intensity; the values range from 0.99 to 0.91. For the other two models, they are essentially equal to unity; this is explained as follows: the axial load in the columns of the buildings with medium columns is produced by three sources: the horizontal seismic component (AMH), the vertical seismic component (AMV), and the gravity load (AMG). The corresponding parameters for the buildings with deep columns are ALH, ALV, and ALG. The axial loads produced by the combined effect of the vertical seismic component and the gravity load for the models with medium columns (AMV + AMG) are observed to be quite similar to that of the models with deep columns (ALV + ALG). In addition, in both cases (medium or deep columns) the above-mentioned combined effect is much larger than the corresponding effect of the horizontal component (AMH or ALH) in such a way that values of RA very close to unity are expected. In all cases, the values are quite similar for the NS and EW directions as well as for the interior and exterior columns. Hence, it can be stated that the axial load demands are essentially the same for the models with medium and deep columns.
For the case of RM, unlike the RA parameter, the mean values may be much smaller than unity, indicating that the bending moments are greater for the models with deep columns. The reason for this is that, as for the case of RV, the bending stiffness is greater for deep columns; the design flexural strength (ϕbMn) is 1830 kip-ft and 3200 kip-ft for the W14 × 257 and W27 × 258 columns, respectively. It is also observed that the values, in general, tend to slightly decrease as the seismic intensity increases but no clear variation is observed with the model height. The values range from 0.54 to 0.73, from 0.68 to 0.85, and from 0.64 to 0.74 for the three-, nine-, and twenty-story models, respectively.

4.3. Objective 3: Results in Terms of Normalized Single Overall and Normalized Combined Local Resultant Stresses

In Section 4.1 and Section 4.2 of the paper, the seismic demands in terms of displacements and resultant stresses, respectively, were calculated for the models with medium columns and compared to those of the models with deep columns. It is worth mentioning that drifts and top displacements are commonly used to represent the overall behavior of steel buildings; however, interstory shears, axial loads, and bending moments are not. In addition, the comparison between the responses of the buildings with the two columns sizes in terms of these three response parameters may not be representative of the structural response since the shear, the axial load, and the bending capacities are not considered. In this sense, the comparison in terms of the seismic responses normalized with respect to the design strengths is more appropriate.

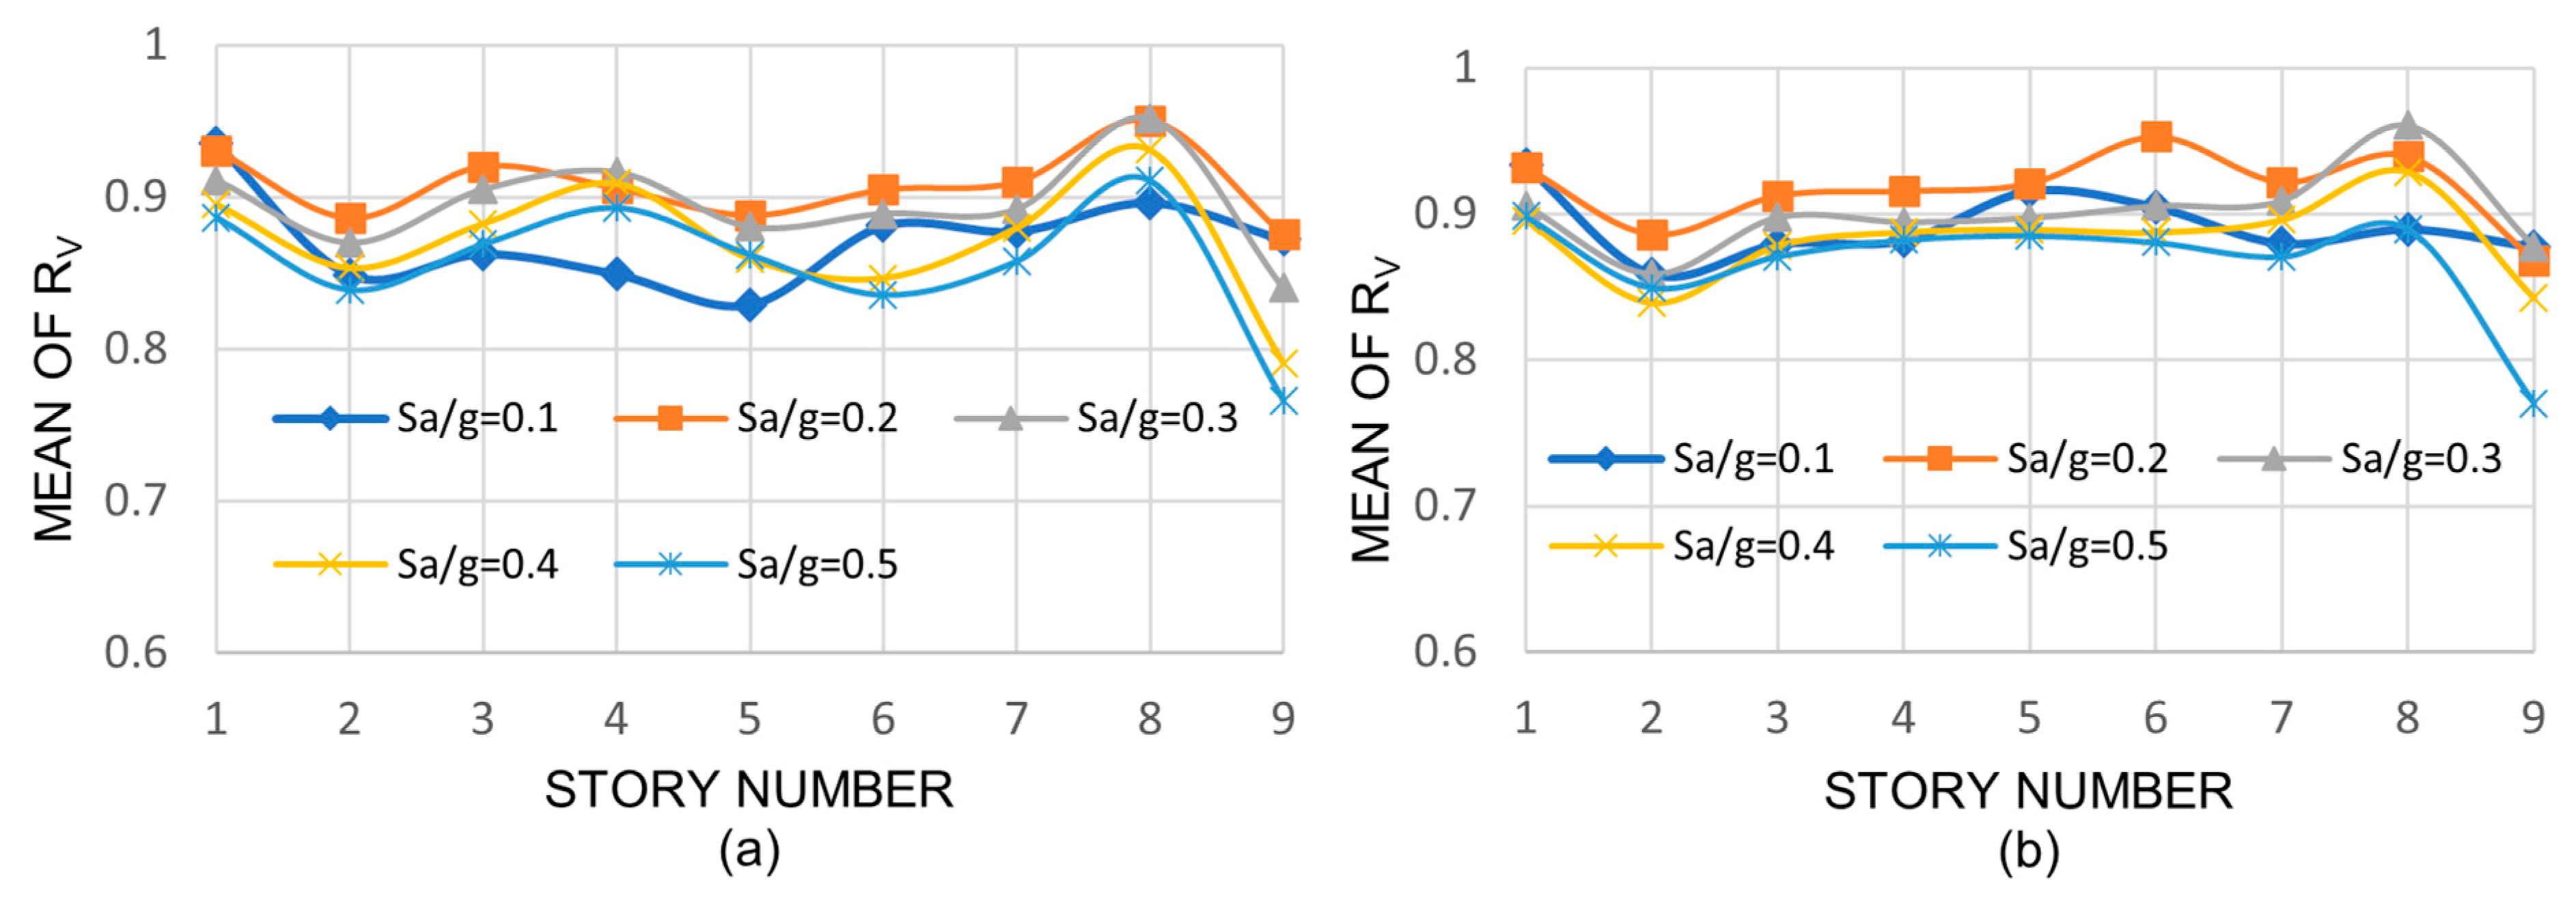
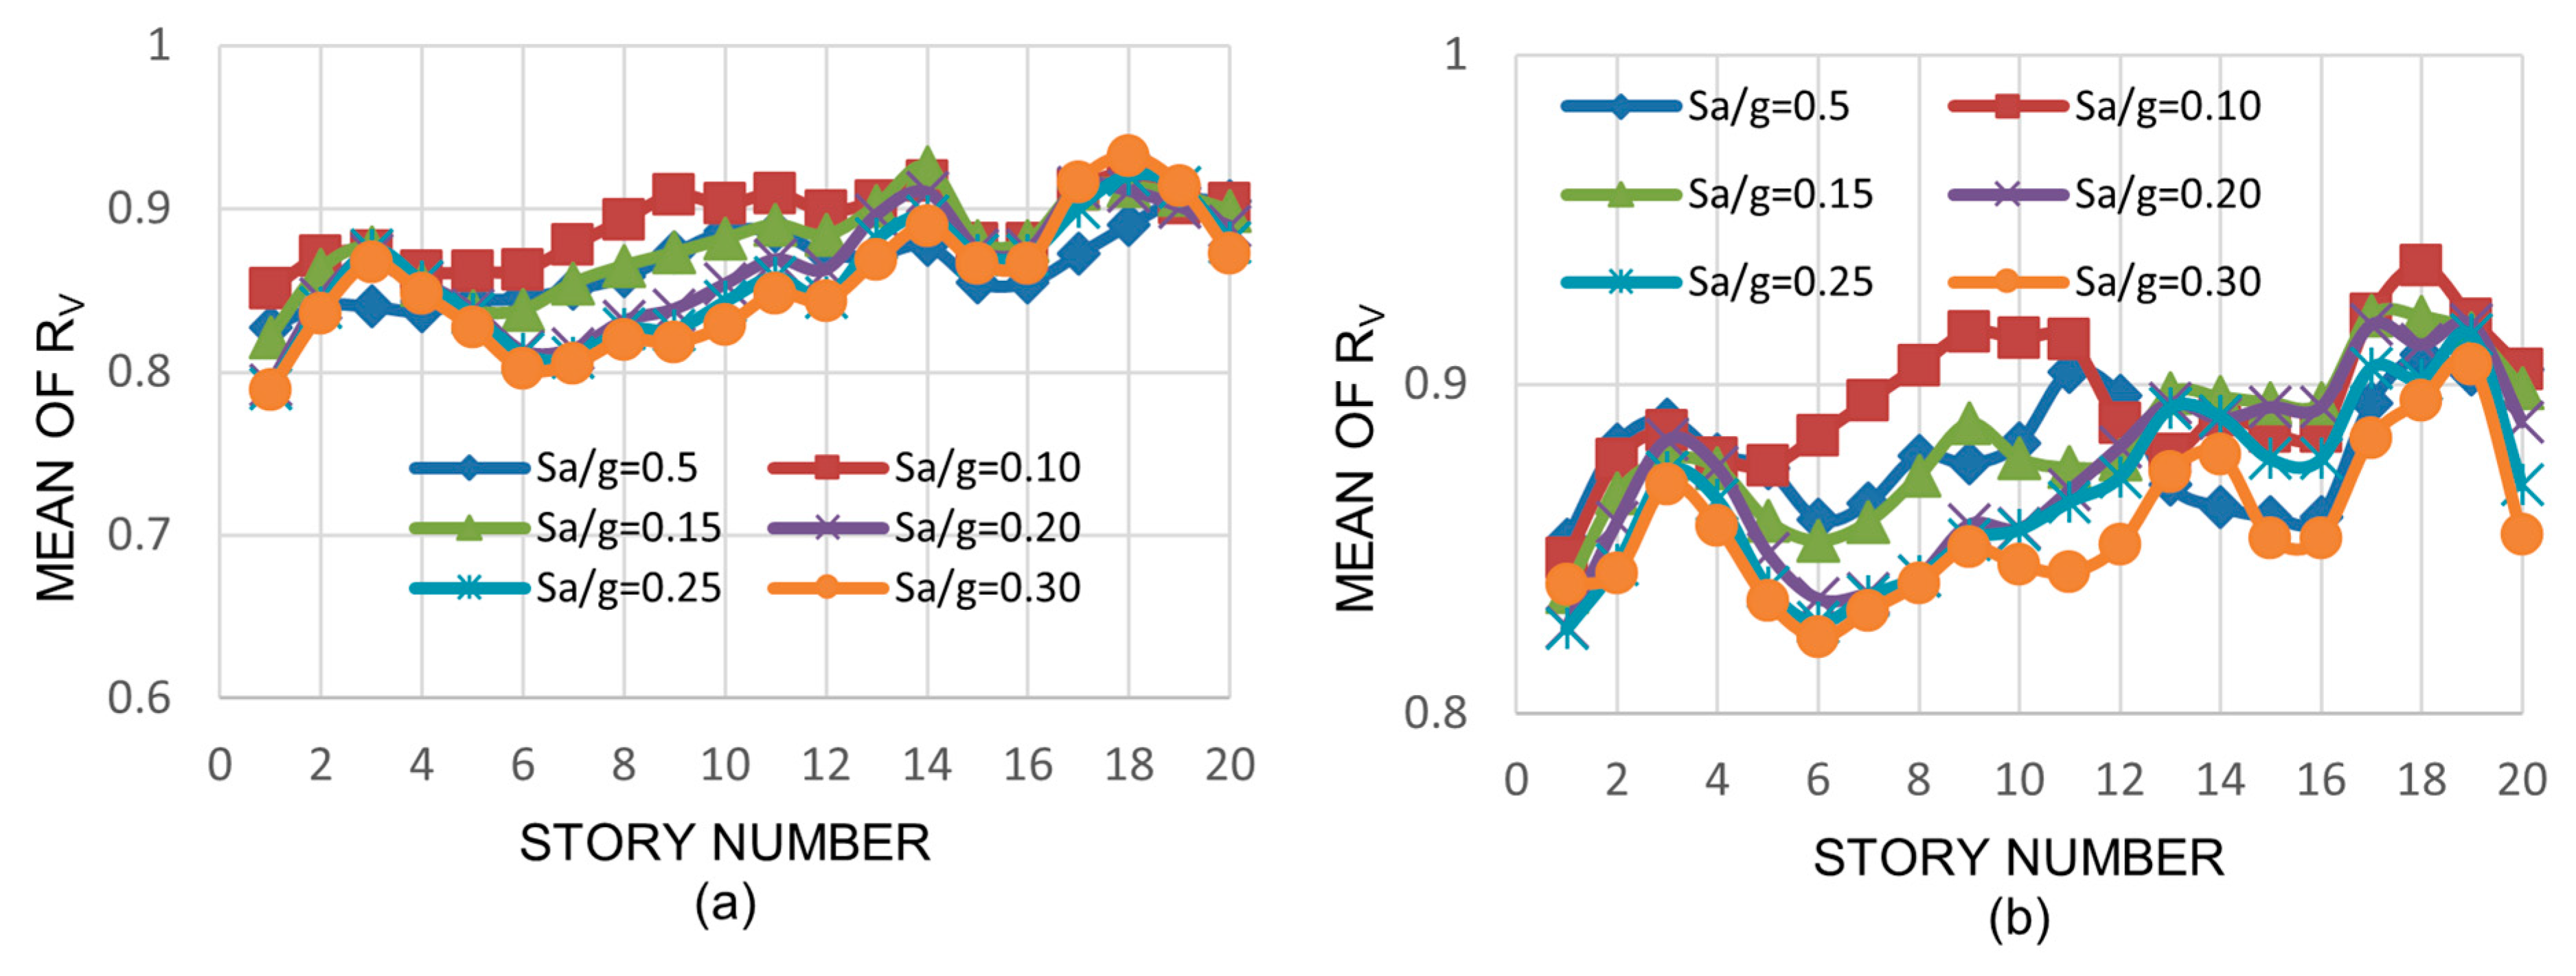
4.3.1. Normalized Shear Strength

The normalized interstory shear ratio, RVN, is calculated as follows:
R V N = V M ϕ V V M , n V L ϕ V V L , n
where ϕVVM, n and ϕVVL, n are the design shear strength of the medium and deep columns, respectively. All other terms were defined earlier. As for the other response parameters, the discussion is made only in terms of the mean values; they are shown in Figure 12, Figure 13 and Figure 14 for the three-, nine-, and twenty-story models, respectively. For the three- and nine-story models, as for the case of the RV ratio, in general, little or moderate variation is observed in the mean values of RVN with the seismic intensity, with the story number, or with the model height. However, the mean values are much larger for the case of RVN indicating that the normalized interstory shears are reduced when deep columns are used; the values are greater than unity in all cases, ranging from 1.05 to 1.40 and from 1.13 to 1.40 for the three- and nine-story buildings, respectively. For the case of the twenty-story building, unlike the three- and nine-story buildings, the mean values of RVN vary from one story to another; they are essentially equal to unity from stories 1 through 11, then they increase from stories 12 to 17, and finally are equal to unity again from stories 18 to 20. The range in variation extends from 0.96 to 1.34. One of the reasons for this is that the ratio of the nominal shear strength of deep to medium columns for stories 1–11 and 18–20 is only a little larger than unity, while for the other stories (12–17), the ratio is considerably larger than unity.

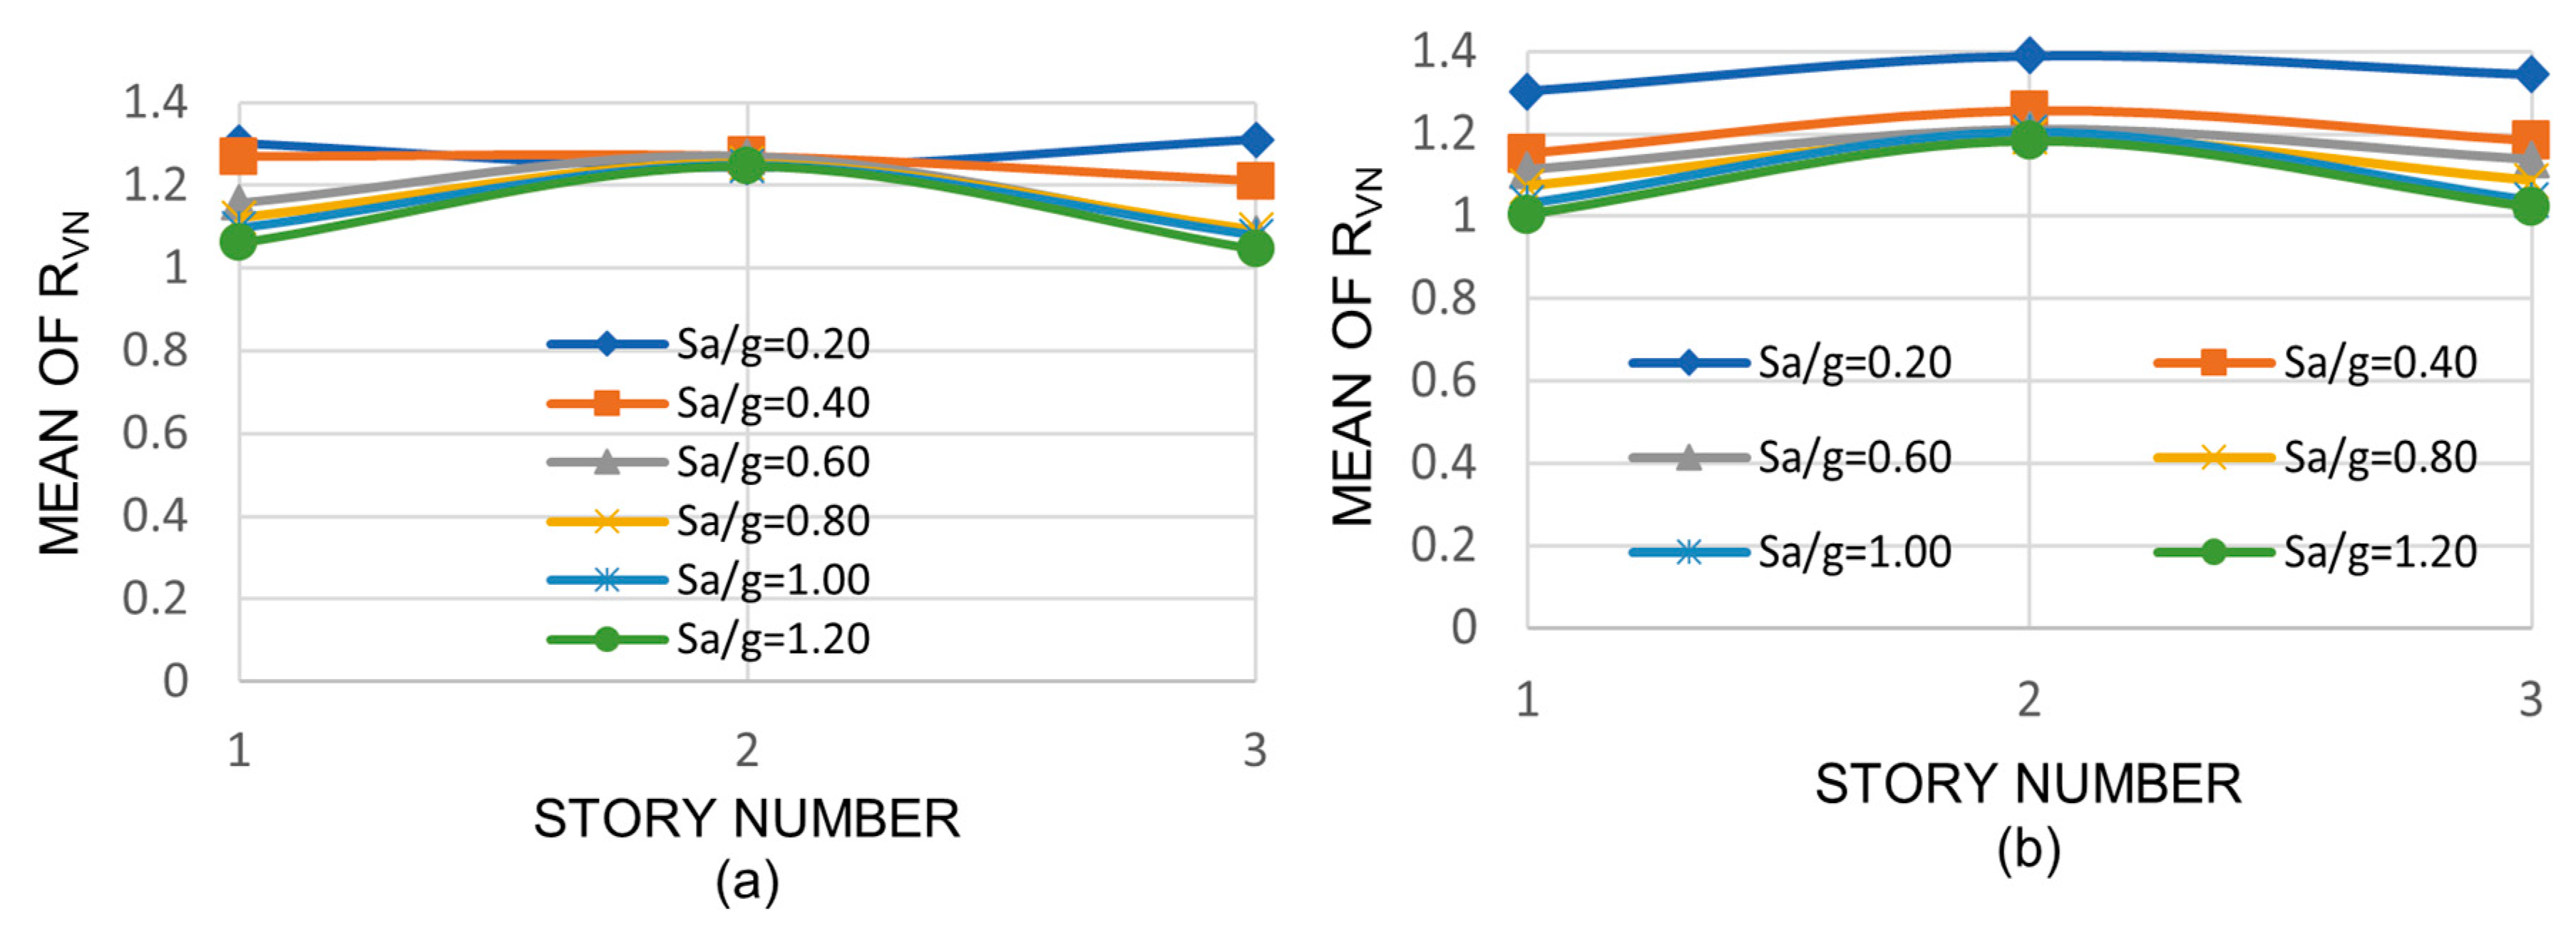
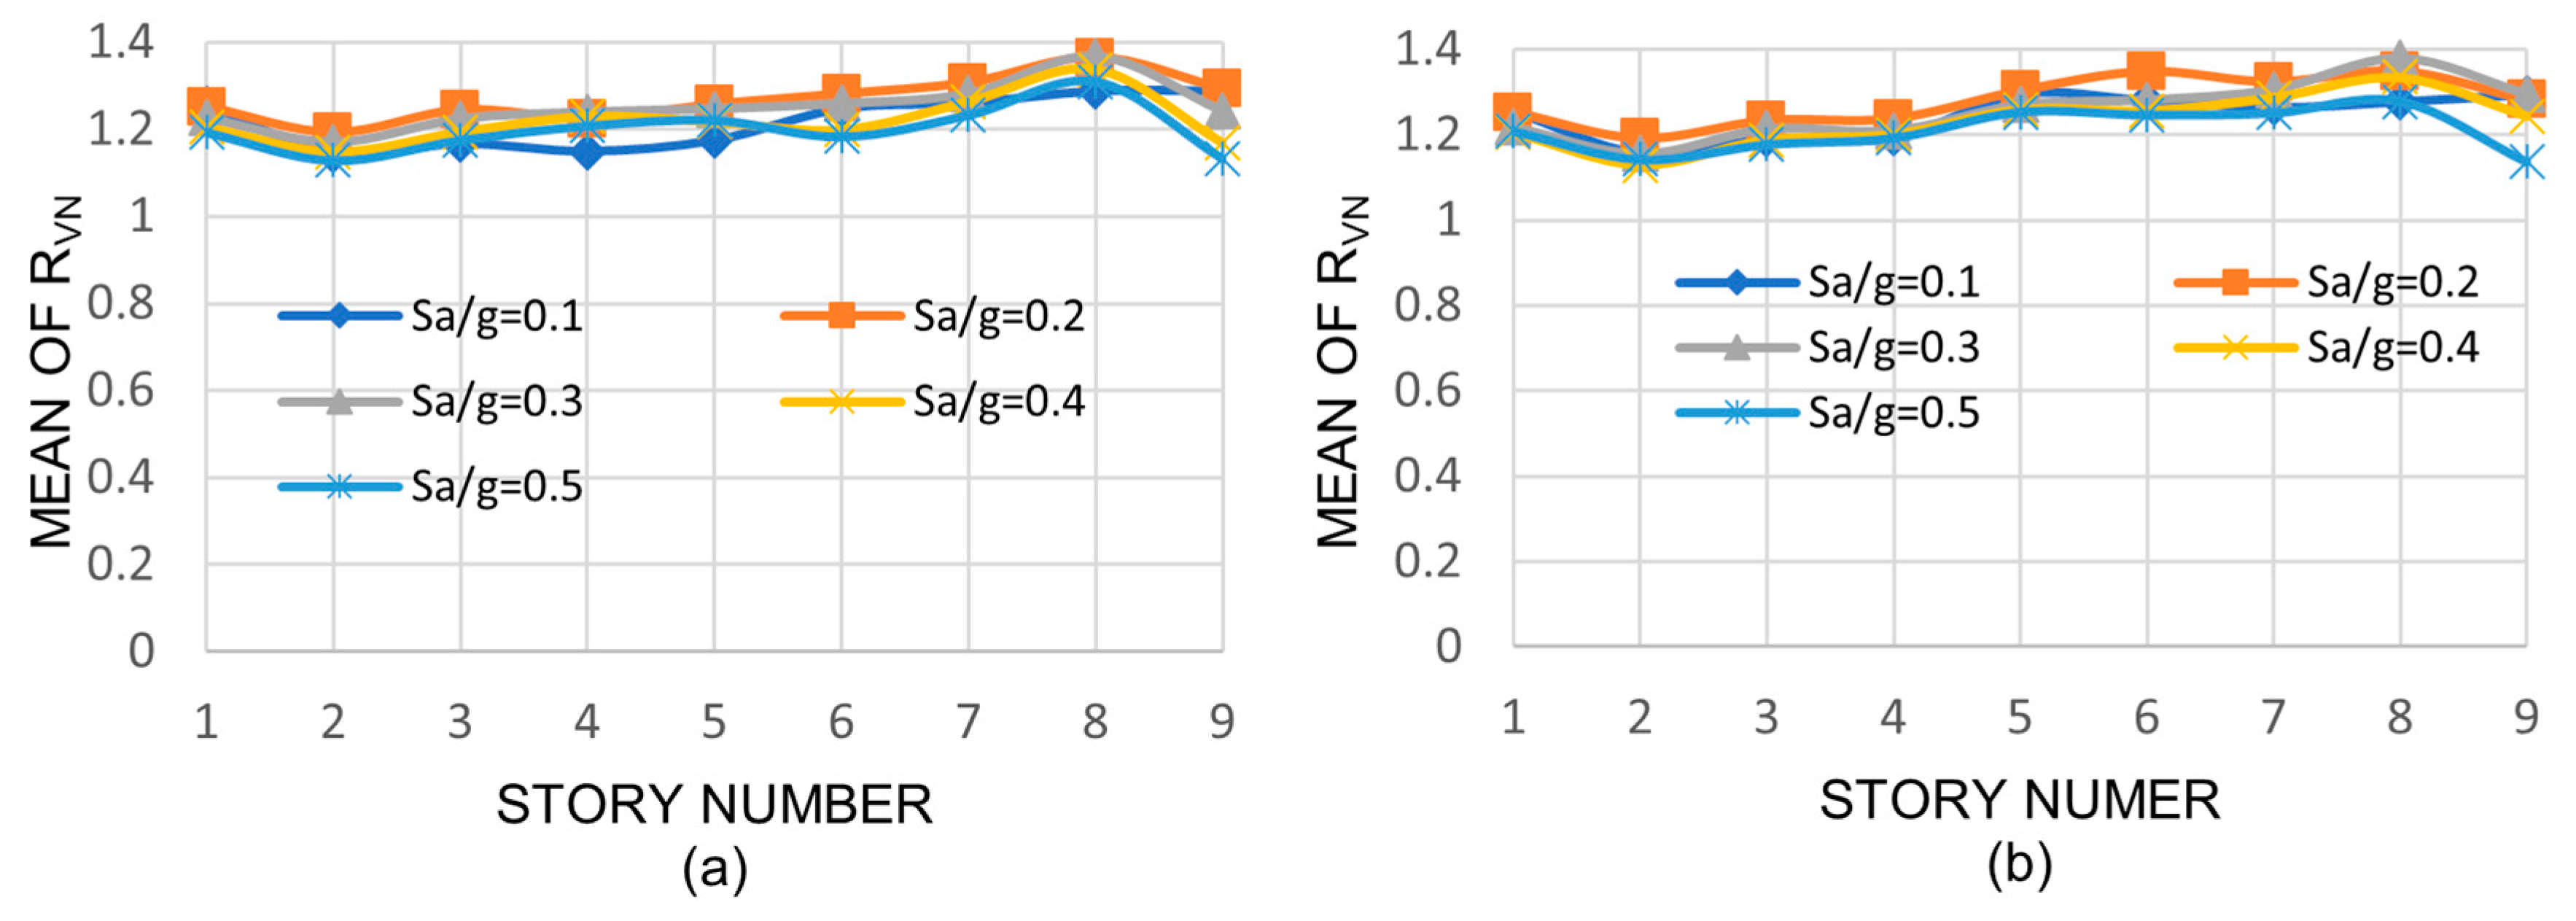
4.3.2. Combined Normalized Axial Loads and Bending Moments

For the case of combined axial loads and bending moments, the AISC [42] interaction equations represent a useful tool to make the comparison between the responses of the buildings with the two different columns since they relate the required strength (demand) and the available strength (capacity). For doubly symmetric steel members under compression and flexure with respect to the major axis, which is the case addressed in this study, these equations are as follows [42]:
f o r P u ϕ c P n 0.2
  P u ϕ c P n + 8 9 M u x ϕ b M n x 1
f o r P u ϕ c P n < 0.2
P u 2 ϕ c P n + M u x ϕ b M n x 1
where the following apply:
Pu = required axial compressive strength
ϕcPn = available axial compressive strength
Mux = required flexural strength with respect to the major axis
ϕbMnx = available flexural strength with respect to the major axis
To make the comparison, the RAM parameter is used, which is defined as follows:
R A M = R C M R C L
where RCM represents the combined axial load and bending moment demands on the medium columns according to Equation (8) or Equation (10); and RCL represents the same, but deep columns are considered instead.
The mean values of RAM are presented in Table 7 for all the models. For the case of the three-story building, the values tend to decrease monotonically as the seismic intensity increases, being larger than unity only for the first three values of Sa/g. The greater observed value is 1.23 indicating that, on an average basis, the combined normalized axial loads and bending moments are significantly reduced when deep columns are used. For the nine-story building, as for the three-story building, the mean values of RAM tend to decrease monotonically with the seismic intensity; however, unlike for the three-story model, the values are larger than unity in all cases, with the maximum values being 1.31. For the twenty-story building, unlike the three- and nine-story buildings, the values are slightly greater or slightly lower than unity, implying the same normalized combined response for the models with medium and deep columns. This behavior was observed before for other parameters (RDT) for the twenty-story building. The results are shown to be similar for the interior and exterior columns as well as for the NS and EW directions.

5. Conclusions

Because of the compactness of the webs and flanges of a vast number of deep steel sections of grade 50, and because of the necessity of higher bending and shear stiffness to reduce drifts, structural engineers often use deep columns in high seismic areas, which results in more economical designs. Yet this contradicts what is stated in some experimental investigations in the sense that even though deep columns satisfy current seismic provisions, they may suffer premature twisting. In other studies, however, which encourage the use of deep columns, it is stated that deep column twisting in the tests might have occurred primarily because there was no lateral bracing at the top flange of the beams, which is normally provided by the floors in actual buildings. This is an indication that much research needs to be developed in this area.
In this study, the nonlinear seismic responses, in terms of several parameters, of steel buildings with perimeter moment-resisting frames and medium (W14) columns are numerically calculated and compared to those of similar steel buildings with equivalent deep columns in terms of cost (W27 and larger). Three building models and fifteen strong motions with different dynamic characteristics are used in the study. The main findings are as follows:
(1) The interstory drifts may be significantly reduced when deep columns are used. For a given model, such reduction tends to decrease through the height of the model; similarly, such reduction becomes less relevant as the height of the building increases. The drifts of the models with medium columns may be up to 140%, 80%, and 60% larger than those of the models with deep columns, for the three-, nine-, and twenty-story models, respectively.
(2) The corresponding percentages for top displacements are 38%, 25%, and 2%, indicating that the maximum reductions in terms of top displacements are smaller than those of drifts. The implication of this is that the observed reduction in the response when deep columns are used in terms of two parameters, which are considered to be similar and widely used to represent the maximum overall structural deformation, may be quite different.
(3) Significant reductions are also observed for normalized interstory shears. However, for the case of normalized combined axial loads and bending moments, the reduction, as for the case of top displacements, is significant only for the three- and nine-story models.
(4) Hence, the seismic demands on the buildings with deep columns may be much smaller than those of the buildings with medium columns and, therefore, buildings with deep columns exhibit a superior behavior, which may result in more economical designs. The reduction is greater for the case of low- and mid-rise buildings than for high-rise buildings. One of the reasons for this is that as the medium columns are replaced by deep columns, the stiffness and the strength increase, which are lower in the tallest model.

Author Contributions

Conceptualization, J.M.L.-G. and A.R.-S.; Methodology, E.B., J.B., V.B., R.C. and A.R.-S.; Software, J.B. and V.B..; Formal analysis, F.V.-B., M.D.L.-T. and J.M.L.-G.; Investigation, V.B.., R.C. and A.R.-S.; Data curation, F.V.-B., M.D.L.-T., J.B., V.B.. and R.C.; Writing – original draft, F.V.-B. and A.R.-S.; Writing – review & editing, E.B. and A.R.-S.; Visualization, M.D.L.-T. and J.M.L.-G.; Supervision, E.B.; Funding acquisition, E.B. and A.R.-S. All authors have read and agreed to the published version of the manuscript.

Funding

This research was funded by the National Council of Science and Technology (CONACyT) under grant number CF-2023-G-1636, and by the Autonomous University of Sinaloa under grant PRO_A8_013_PROFAPI 2022.

Institutional Review Board Statement

Not applicable.

Informed Consent Statement

Not applicable.

Data Availability Statement

The data presented in this study are available in the article.

Conflicts of Interest

The authors declare no conflict of interest.

References

  1. Gupta, A.; Krawinkler, H. Behavior of Ductile SMRFs at Various Seismic Hazard Levels. J. Struct. Eng. 2000, 126, 98–107. [Google Scholar] [CrossRef]
  2. Lee, K.; Foutch, D. Performance Evaluation of New Steel Frame Buildings for Seismic Loads. Earthq. Eng. Struct. Dyn. 2001, 31, 653–670. [Google Scholar] [CrossRef]
  3. Foutch, A.; Yun, S. Modeling of Steel Moment Frames for Seismic Loads. J. Constr. Steel Res. 2002, 58, 529–564. [Google Scholar] [CrossRef]
  4. Mele, E.; Di Sarno, L.; De Luca, A. Seismic Behavior of Perimeter and Spatial Steel Frames. J. Earthq. Eng. 2004, 8, 457–496. [Google Scholar] [CrossRef]
  5. Fathi, M.; Daneshjoo, F.; Melchers, R. A Method for Determining the Behaviour Factor of Moment-Resisting Steel Frames with Semi-Rigid Connections. Eng. Struct. 2006, 28, 514–531. [Google Scholar] [CrossRef]
  6. Lee, K.; Foutch, D. Seismic Evaluation of Steel Moment Frames Buildings Designed Using Different R-Values. J. Struct. Eng. Div. ASCE 2006, 132, 1461–1472. [Google Scholar] [CrossRef]
  7. Krishnan, S.; Ji, C.; Komatitsch, D.; Tromp, J. Performance of Two 18-Storey Steel Moment-Frame Building in Southern California during Two Large Simulated San Andres Earthquakes. Earthq. Spectra 2006, 22, 1035–1061. [Google Scholar] [CrossRef]
  8. Black, E. Use of Stability Coefficients for Evaluating the P–Δ Effect in Regular Steel Moment Resisting Frames. Eng. Struct. 2011, 33, 1205–1216. [Google Scholar] [CrossRef]
  9. Sejal, P.; Vasanwala, S.; Desai, A. Comparison of Steel Moment Resisting Frame Designed by Elastic Design and Performance Based Plastic Design Method Based on the Inelastic Response Analysis. Int. J. Civ. Struct. Eng. 2012, 2, 1081–1097. [Google Scholar]
  10. Teran-Gilmore, A.; Diaz, G.; Reyes, C. Displacement-Based Conception of Moment-Resisting Frames That House Essential Facilities. Soil Dyn. Earthq. Eng. 2013, 46, 96–113. [Google Scholar] [CrossRef]
  11. Athanasios, I.; Dimopoulos, A.; Bazeos, N.; Beskos, D. Seismic Yield Displacements of Plane Moment Resisting and X-Braced Steel Frames. Soil Dyn. Earthq. Eng. 2012, 41, 128–140. [Google Scholar]
  12. Formisano, A.; Landolfo, R.; Mazzolani, F. Robustness Assessment Approaches for Steel Framed Structures under Catastrophic Events. Comput. Struct. 2015, 147, 216–228. [Google Scholar] [CrossRef]
  13. Liu, W.; Rasmussen, K.J.R.; Zhang, H. Systems Reliability for 3D Steel Frames Subject to Gravity Loads. Structures 2016, 8, 170–182. [Google Scholar] [CrossRef]
  14. Samanta, A.; Huang, Y. Ground-Motion Scaling for Seismic Performance Assessment of High-Rise Moment-Resisting Frame Building. Soil Dyn. Earthq. Eng. 2017, 94, 125–135. [Google Scholar] [CrossRef]
  15. Loulelis, D.; Papagiannopoulos, G.; Beskos, D. Modal Strength Reduction Factors for Seismic Design of Steel Moment Resisting Frames. Eng. Struct. 2018, 154, 23–37. [Google Scholar] [CrossRef]
  16. Ruiz-García, J.; Yaghmaei-Sabegh, S.; Bojórquez, E. Three-Dimensional Response of Steel Moment-Resisting Buildings under Seismic Sequences. Eng. Struct. 2018, 175, 399–414. [Google Scholar] [CrossRef]
  17. Fogarty, J.; Wu, T.Y.; El-Tawil, S. Collapse Response and Design of Deep Steel Columns Subjected to Lateral Displacement. J. Struct. Eng. 2017, 143, 04017130. [Google Scholar] [CrossRef]
  18. Elkady, A.; Lignos, D.G. Full-Scale Testing of Deep Wide-Flange Steel Columns under Multiaxis Cyclic Loading: Loading Sequence, Boundary Effects, and Lateral Stability Bracing Force Demands. J. Struct. Eng. 2018, 144, 04017189. [Google Scholar] [CrossRef]
  19. Sediek, O.A.; Wu, T.-Y.; McCormick, J.; El-Tawil, S. Prediction of Seismic Collapse Behavior of Deep Steel Columns Using Machine Learning. Structures 2022, 40, 163–175. [Google Scholar] [CrossRef]
  20. Wu, T.-Y.; Pal, P.S.; Wang, H.-C. Collapse Risk of Steel Framed Buildings with Deep Columns under Tri-Directional Excitation. J. Constr. Steel Res. 2023, 208, 108030. [Google Scholar] [CrossRef]
  21. Sepulveda, C. Seismic Behavior of Deep and Slender Steel Columns through Full-Scale Cyclic and Hybrid Testing. Ph.D. Thesis, University of California San Diego, La Jolla, CA, USA, 2024. [Google Scholar]
  22. Gilton, C.; Chi, B.; Uang, C. Cyclic Response of RBS Moment Connections: Weak-Axis Configuration and Deep Column Effects; University of California San Diego: La Jolla, CA, USA, 2000. [Google Scholar]
  23. Chi, B.; Uang, C. Cyclic Response and Design Recommendations of Reduced Beam Section Moment Connections with Deep Columns. J. Struct. Eng. 2002, 128, 464–473. [Google Scholar] [CrossRef]
  24. Shen, J.; Astaneh-Asl, A.; McCallen, D. Use of Deep Columns in Special Steel Moment Frames. Steel Tip Rep. 2002. [Google Scholar]
  25. Zhang, X.; Ricles, J.; LuL, W.; Fisher, J. Analytical and Experimental Studies on Seismic Behavior of Deep Column-to-Beam Welded Reduced Beam Section Moment Connections. In Proceedings of the 13th World Conference on Earthquake Engineering, Vancouver, BC, Canada, 1–6 August 2004. Paper No 1599. [Google Scholar]
  26. Shao, D.; Hale, T. Full Scale Testing and Project Application of Sideplate Moment Connection for SMRF Using Deep Columns. In Proceedings of the 2004 SEAOC Convention, Monterey, CA, USA, 25–28 August 2004. [Google Scholar]
  27. Ricles, J.; Zhang, X. Seismic Performance of Reduced Beam Section Moment Connections to Deep Columns. In Proceedings of the Structures Congress, St Louis, MI, USA, 18–21 May 2006. [Google Scholar]
  28. Zhang, X.; Ricles, J. Experimental Evaluation of Reduced Beam Section Connections to Deep Columns. J. Struct. Eng. 2006, 132, 346–357. [Google Scholar] [CrossRef]
  29. Zhang, X.; Ricles, J. Seismic Behavior of Reduced Beam Section Moment Connections to Deep Columns. J. Struct. Eng. 2006, 132, 358–367. [Google Scholar] [CrossRef]
  30. Elkady, A.; Lignos, D. Collapse Assessment of Steel Moment Resisting Frames Designed with Deep Members. In Proceedings of the Vienna Congress on Recent Advances in Earthquake Engineering and Structural Dynamics, Vienna, Austria, 28–30 August 2013; p. 249. [Google Scholar]
  31. Islam, A.; Imanpour, A. Stability of Wide-Flange Columns in Steel Moment-Resisting Frames: Evaluation of the Canadian Seismic Design Requirements. Bull. Earthq. Eng. 2022, 20, 1591–1617. [Google Scholar] [CrossRef]
  32. Monjardin-Quevedo, J.G.; Reyes-Salazar, A.; Tolentino, D.; Gaxiola-Camacho, O.D.; Vazquez-Becerra, G.E.; Gaxiola-Camacho, J.R. Seismic Reliability of Steel SMFs with Deep Columns Based on PBSD Philosophy. Structures 2022, 42, 1–15. [Google Scholar] [CrossRef]
  33. Boushehri, K.; Tsavdaridis, K.D.; Cai, G. Seismic Behaviour of RWS Moment Connections to Deep Columns with European Sections. J. Constr. Steel Res. 2019, 161, 416–435. [Google Scholar] [CrossRef]
  34. Carr, A. RUAUMOKO, Inelastic Dynamic Analysis Program 2016.
  35. Preserve, L.; Chen, W.F.; Atsuta, T. Interaction Equations for Biaxially Loaded Sections. J. Struct. Div. 1972, 98, 1035–1052. [Google Scholar]
  36. Federal Emergency Management Agency. State of the Art Report on Systems Performance of Steel Moment Frames Subjected to Earthquake Ground Shaking. 2000. Available online: https://www.atcouncil.org/pdfs/FEMA355Ctoc.pdf (accessed on 11 December 2023).
  37. UBC. Structural Engineering Design Provisions, Uniform Building Code. In Proceedings of the International Conference of Building Officials, Whittier, CA, USA, 16–19 April 1997. [Google Scholar]
  38. AISC Steel Construction Manual; American Institute of Steel Construction: Chicago, IL, USA, 2010.
  39. Roeder, C.W.; Schneider, S.P.; Carpenter, J.E. Seismic Behavior of Moment-Resisting Steel Frames: Analytical Study. J. Struct. Eng. 1993, 119, 1866–1884. [Google Scholar] [CrossRef]
  40. Leon, R.T.; Shin, K.J. Performance of Semi-Rigid Frames. In Proceedings of the Structures XIII Congress, Boston, MA, USA, 2–5 April 1995; ASCE: New York, NY, USA, 1995; pp. 1020–1035. [Google Scholar]
  41. Nader, M.N.; Astaneh, A. Dynamic Behavior of Flexible, Semirigid and Rigid Steel Frames. J. Constr. Steel Res. 1991, 18, 179–192. [Google Scholar] [CrossRef]
  42. Osman, A.; Ghobarah, A.; Korol, R.M. Implications of Design Philosophies for Seismic Response of Steel Moment Frames. Earthq. Eng. Struct. Dyn. 1995, 24, 127–143. [Google Scholar] [CrossRef]
  43. Schneider, S.P.; Roeder, C.W.; Carpenter, J.E. Seismic Behavior of Moment-Resisting Steel Frames: Experimental Study. J. Struct. Eng. 1993, 119, 1885–1902. [Google Scholar] [CrossRef]
  44. AISC Specification for Structural Steel Buildings; American Institute of Steel Construction: Chicago, IL, USA, 2010.
Figure 1. Plan and elevation, 3-story model.
Applsci 14 05067 g001
Figure 2. Plan and elevation, 9-story model.
Applsci 14 05067 g002
Figure 3. Plan and elevation, 20-story model.
Applsci 14 05067 g003
Figure 4. Response spectra: (a) NS direction, (b) EW direction.
Applsci 14 05067 g004aApplsci 14 05067 g004b
Figure 5. Values of the RD parameter for the 3-story building: (a) Sa = 0.4 g NS, (b) Sa = 0.4 g EW, (c) Sa = 0.8 g NS, (d) Sa = 0.8 g EW, (e) Sa = 1.2 g NS, and (f) Sa = 1.2 g EW.
Applsci 14 05067 g005
Figure 6. Mean values of RD, 3-story building: (a) NS direction, (b) EW direction.
Applsci 14 05067 g006
Figure 7. Mean values of RD, 9-story building: (a) NS direction, (b) EW direction.
Applsci 14 05067 g007
Figure 8. Mean values of RD, 20-story building: (a) NS direction, (b) EW direction.
Applsci 14 05067 g008
Figure 9. Mean values of RV, 3-story building: (a) NS direction, (b) EW direction.
Applsci 14 05067 g009
Figure 10. Mean values of RV, 9-story building: (a) NS direction, (b) EW direction.
Applsci 14 05067 g010
Figure 11. Mean values of RV, 20-story building: (a) NS direction, (b) EW direction.
Applsci 14 05067 g011
Figure 12. Mean values of RVN, 3-story building: (a) NS direction, (b) EW direction.
Applsci 14 05067 g012
Figure 13. Mean values of RVN, 9-story building: (a) NS direction, (b) EW direction.
Applsci 14 05067 g013
Figure 14. Mean values of RVN, 20-story building: (a) NS direction, (b) EW direction.
Applsci 14 05067 g014
Table 1. Beam and column sections, PMRF of Models M1 and M2.
ModelStoryColumnsGirders
OutsideInside
3-story1W14 × 257W14 × 311W33 × 118
2W14 × 257W14 × 311W30 × 116
3/RoofW14 × 257W14 × 311W24 × 68
9-storyBasement-1W14 × 370W14 × 500W36 × 160
1W14 × 370W14 × 500W36 × 160
2W14 × 370W14 × 500W36 × 160
3W14 × 370W14 × 455W36 × 135
4W14 × 370W14 × 455W36 × 135
5W14 × 283W14 × 370W36 × 135
6W14 × 283W14 × 370W36 × 135
7W14 × 257W14 × 283W30 × 99
8W14 × 257W14 × 283W27 × 84
9/roofW14 × 233W14 × 257W24 × 68
Table 2. Beam and column sections, PMRF of Model M3.
StoryColumnsGirders
OutsideInside
Basement-115 × 15 × 2.00W24 × 335W14 × 22
Basement-215 × 15 × 2.00W24 × 335W30 × 99
115 × 15 × 2.00W24 × 335W30 × 99
215 × 15 × 2.00W24 × 335W30 × 99
315 × 15 × 1.25W24 × 335W30 × 99
415 × 15 × 1.25W24 × 335W30 × 99
515 × 15 × 1.25W24 × 335W30 × 108
615 × 15 × 1.00W24 × 229W30 × 108
715 × 15 × 1.00W24 × 229W30 × 108
815 × 15 × 1.00W24 × 229W30 × 108
915 × 15 × 1.00W24 × 229W30 × 108
1015 × 15 × 1.00W24 × 229W30 × 108
1115 × 15 × 1.00W24 × 229W30 × 99
1215 × 15 × 1.00W24 × 192W30 × 99
1315 × 15 × 1.00W24 × 192W30 × 99
1415 × 15 × 1.00W24 × 192W30 × 99
1515 × 15 × 0.75W24 × 131W30 × 99
1615 × 15 × 0.75W24 × 131W30 × 99
1715 × 15 × 0.75W24 × 131W27 × 84
1815 × 15 × 0.75W24 × 117W27 × 84
1915 × 15 × 0.75W24 × 117W24 × 62
20/Roof15 × 15 × 0.50W24 × 84W21 × 50
Table 3. Deep columns of Models L1 and L2.
ModelStoryColumns
OutsideInside
11/2W27 × 258W27 × 307
2/3W27 × 258W27 × 307
3/roofW27 × 258W27 × 307
2−1/1W27 × 368W27 × 494
1/2W27 × 368W27 × 494
2/3W27 × 368W27 × 494, W27 × 448
3/4W27 × 368W27 × 448
4/5W27 × 368, W27 × 281W27 × 448, W27 × 368
5/6W27 × 281W27 × 368
6/7W27 × 281, W27 × 258W27 × 368, W27 × 281
7/8W27 × 258W27 × 281
8/9W27 × 258, W27 × 235W27 × 281, W27 × 258
9/roofW27 × 235W27 × 258
Table 4. Deep columns of Model L3.
ModelStoryColumns
Inside
3Basement-1W40 × 328
Basement-2W40 × 328
1/2W40 × 328
2/3W40 × 328
3/4W40 × 328
4/5W40 × 328
5/6W40 × 328
6/7W40 × 221
7/8W40 × 221
8/9W40 × 221
9/10W40 × 221
10/11W40 × 221
11/12W40 × 221
12/13W40 × 192
13/14W40 × 192
14/15W40 × 192
15/16W40 × 131
16/17W40 × 131
17/18W40 × 131
18/19W40 × 117
19/20W40 × 117
20/roofW40 × 84
Table 5. Seismic records.
DesignationRecord InformationMagnitude (Mw)PGA (m/s2)Period (s)
NSEWNSEW
LA1Imperial Valley, 19406.94.526.630.530.46
LA2Imperial Valley, 19796.53.864.780.160.34
LA3Landers, 19927.34.144.170.730.33
LA4Kern, 19527.35.113.530.250.23
LA5Loma Prieta, 198976.539.500.210.2
LA6Northridge, 1994, Newhall6.76.656.450.310.31
LA7Northridge, 1994, Rinaldi6.75.235.690.390.29
LA8Northridge, 1994, Sylmar6.75.598.030.310.36
LA9North Palm Springs, 1986610.019.680.170.21
LA10Coyote Lake, 19795.75.793.280.150.21
LA11Morgan Hill, 19846.23.125.360.180.16
LA12Parkfield, 1966, Cholame 5W6.17.656.200.370.3
LA13Parkfield, 1966, Cholame 8W6.16.817.750.170.21
LA14North Palm Springs, 198665.083.710.130.21
LA15Whittier, 198767.544.700.70.28
Table 6. MVs for the RDT, RA, RM parameters.
ModelDirectionSa/g
(1)
RDT
(2)
RARM
EXT
(3)
INT
(4)
EXT
(5)
INT
(6)
1NS0.21.210.990.970.660.70
0.41.240.980.950.660.68
0.61.330.950.940.600.62
0.81.290.930.940.570.59
1.01.290.910.930.560.58
1.21.270.910.930.550.57
EW0.21.381.010.980.680.73
0.41.290.960.950.610.65
0.61.200.940.940.580.60
0.81.170.930.940.560.58
1.01.190.930.930.550.57
1.21.200.930.930.540.56
2NS0.11.220.990.980.780.84
0.21.160.980.970.780.83
0.31.170.980.970.740.79
0.41.110.970.970.710.75
0.51.060.980.970.690.72
EW0.11.150.990.980.780.85
0.21.130.980.980.770.82
0.31.130.970.970.710.76
0.41.080.960.970.680.72
0.51.060.960.970.680.70
3NS0.050.970.930.990.670.70
0.101.020.950.980.680.70
0.151.010.970.990.660.68
0.201.010.960.980.640.65
0.251.010.960.980.650.66
EW0.050.990.951.000.700.74
0.101.000.960.990.690.71
0.151.000.990.990.660.68
0.201.010.980.990.660.67
0.251.010.980.980.650.65
Table 7. MVs for the RAM parameter.
ModelDirectionSa/gRAM
EXTINT
1NS0.21.141.19
0.41.131.15
0.61.051.05
0.80.991.00
1.00.980.99
1.20.960.97
EW0.21.171.23
0.41.061.10
0.61.011.02
0.80.970.98
1.00.960.97
1.20.950.96
2NS0.11.241.31
0.21.241.31
0.31.191.24
0.41.131.19
0.51.101.14
EW0.11.241.32
0.21.221.30
0.31.141.19
0.41.081.13
0.51.081.11
3NS0.051.031.03
0.100.981.05
0.150.991.03
0.200.970.99
0.250.980.99
0.300.980.99
EW0.051.071.10
0.101.001.06
0.151.011.02
0.201.001.01
0.250.990.99
0.300.990.99
Disclaimer/Publisher’s Note: The statements, opinions and data contained in all publications are solely those of the individual author(s) and contributor(s) and not of MDPI and/or the editor(s). MDPI and/or the editor(s) disclaim responsibility for any injury to people or property resulting from any ideas, methods, instructions or products referred to in the content.

