Article

Prediction of Tooth Profile Deviation for WEDM Rigid Gears Based on ISSA-LSSVM

by
Yazhou Wang
*,
Zhen Wang
,
Gang Wang
and
Huike Xu
School of Mechanical and Electrical Engineering, Lanzhou University of Technology, Lanzhou 730050, China
*
Author to whom correspondence should be addressed.
Appl. Sci. 2024, 14(11), 4596; https://doi.org/10.3390/app14114596
Submission received: 8 April 2024 / Revised: 22 May 2024 / Accepted: 24 May 2024 / Published: 27 May 2024
(This article belongs to the Special Issue Advanced Manufacturing and Precision Machining)

Abstract

:
This study aimed to develop and validate an improved sparrow search algorithm (ISSA)-optimized Least Squares Support Vector Machine (LSSVM) model for accurately predicting the tooth profile deviation of rigid gears produced by wire electrical discharge machining (WEDM). The ISSA was obtained by optimizing the sparrow search algorithm (SSA) using Tent chaotic mapping, adaptive adjustment strategy, dynamic inertia weights, and grey wolf hierarchy strategy. The effectiveness of the ISSA was verified using four different classes of benchmark test functions. Four main process parameters (peak current, pulse width, pulse interval, and tracking) were taken as inputs and the tooth profile deviations of rigid gears were considered as outputs to develop an ISSA-LSSVM-based profile deviation prediction model. The prediction performance of the ISSA-LSSVM model was evaluated by comparing it with the LSSVM model optimized by three standard algorithms. The prediction results of the ISSA-LSSVM model were R2 = 0.9828, RMSE = 0.0029, and MAPE = 0.0156. The results showed that the established model exhibits high prediction accuracy and can provide reliable theoretical guidance for predicting the tooth profile deviation of rigid gears.

1. Introduction

Harmonic gear reducers offer numerous advantages, such as a significant transmission ratio, robust load-carrying ability, and exceptional transmission precision. Consequently, they find widespread application in aerospace, robotics, the defense industry, and other high-end precision technology fields [1,2]. Given the precision transmission characteristics of harmonic gear reducers, it becomes crucial to guarantee the accuracy and quality of each mechanism during the manufacturing process. This is necessary to guarantee that the transmission performance of the finished parts aligns with the design requirements. Being the core component of the harmonic gear reducer, the tooth profile deviation of the rigid gear significantly impacts the performance and assembly performance of the harmonic gear transmission system.
Numerous researchers have conducted extensive studies on gear tooth deviation in different machining processes. Guo et al. [3] explored the computation approach of tooth profile deviation in conventional turning, assessed the impact of turning tool rake angle, and proposed a method to improve tooth profile deviation through turning tool grinding. Yuan et al. [4] developed a comprehensive tooth profile deviation model using conjugate surface meshing theory, the Box–Behnken experimental design, and the artificial immune clone algorithm. The model optimizes and actively controls the internal gear power honing (IGPH) process parameters to obtain high gear geometry accuracy. Wang et al. [5] established quantitative mapping models for hob geometry errors and gear geometric errors, revealing essential mapping rules and laying a theoretical foundation for achieving higher precision in roll-cutting gears. Sun et al. [6] provided a forecast model for hobbing gear geometric errors. They used a modified PSO-BP algorithm to analyze the correlation between the hobbing process parameters and tooth shape deviation. Peng et al. [7] analyzed the tooth profile deviation in the hobbing forming process base on the theory of gear meshing, and adjusted the hobbing process parameters for the deviation size. Yusron et al. [8] performed a study analyzing how wire-cutting parameters, including pulse width, open circuit voltage, wire tension, and pulse current, affect the deviation of the straight-toothed cylindrical gear tooth profile through orthogonal experiments. Vishal et al. [9] found that adjusting hobbing parameters can greatly impact the microgeometry deviation and average deviation of gears. By determining the optimal combination of parameters, gear precision can be significantly improved. Mo et al. [10] presented a model to analyze the time-varying meshing stiffness of asymmetric gear pairs, which yields outcomes more similar to primitive meshing by taking into account the tooth shape deviations. They also highlight the significant effect of small shape deviations on gear meshing characteristics. Chen et al. [11] presented a new method to solve the meshing stiffness and analyzed the variation in the stiffness and load distribution ratio with tooth profile deviation during gear meshing. Tsai et al. [12] introduced a mathematical method to investigate the variation in tooth profile deviation that occurs when cutting gears under various parameters using the same turning tool. Their findings indicated that reducing the helix angle or the number of teeth can result in a change in tooth profile deviation.
The existing literature primarily focuses on the gear processing mechanism and uses theoretical modelling and simulation analysis to explore the causes of tooth profile errors. Traditional machining methods, such as hobbing and shaping, have been extensively studied. However, these methods often face limitations in flexibility and precision, especially when dealing with complex gear geometries. Recent advances in gear manufacturing have highlighted the potential of wire electrical discharge machining (WEDM) for improving gear quality and performance. These methods allow for higher precision and the ability to handle intricate designs that are challenging for traditional techniques. R. Chaudhari et al. [13] studied the effect of WEDM process parameters on surface morphology, highlighting its significant impact on gear quality.
Additionally, the importance of free-form milling has been underscored in the recent literature. This method offers a universal tool geometry and the ability to machine various gear types and sizes within one manufacturing system. Studies have shown that free-form milling enhances the quality and performance of gears by providing higher flexibility and precision [14]. Moreover, the emergence of 5-axis double-flank CNC machining for spiral bevel gears presents new opportunities in flank form design and manufacturing, overcoming kinematic restrictions of traditional methods [15].
However, there are limited studies on the impact of actual machining process parameters and changes in tooth profile deviations. In this paper, we investigate the tooth profile machining process of rigid gears, a key challenge in the manufacturing process of harmonic gears. The study utilizes wire electrical discharge machining (WEDM), a machining method that employs pulsed spark discharges from an electrode wire to machine workpieces. Unlike conventional machining technologies that rely on mechanical force and energy, WEDM can machine workpieces with complex shapes [16,17]. Currently, the setting of WEDM process parameters mostly relies on the operator’s experience, which is unable to adapt to the processing of variable working conditions and affects the processing quality of the workpiece. Prediction problems have been tackled using a range of algorithms in recent years, including neural networks, random forests, support vector machines (SVMs), and the least squares support vector machine (LSSVM) [18,19,20,21]. Neural networks, despite their complex structure, have poor generalization ability. Random forest has drawbacks, including a long training time and poor interpretability. An SVM is primarily used for classification problems and is not well-suited for data prediction. For this particular study, we have chosen to use the LSSVM as the preferred predictive algorithm model. The LSSVM is an efficient machine learning technique employed when dealing with limited sample data analysis. However, it encounters challenges regarding intricate parameter selection and a lack of interpretability [22]. In order to tackle this issue, researchers have been investigating the application of various methods like particle swarm optimization (PSO), grey wolf optimization (GWO), genetic algorithm (GA), and others for the purpose of optimizing parameter selection [23,24,25]. This practice has led to an enhancement in prediction accuracy. The sparrow search algorithm (SSA) is a commonly used intelligent optimization algorithm. However, as with other algorithms, increasing the number of iterations can result in a reduction in population diversity, leading to a tendency for local optimization. Hence, the objective of this research is to enhance the diversity of the SSA through the utilization of a hybrid strategy. Additionally, the parameters in the LSSVM model are optimized to make it more suitable for predicting the tooth profile deviation in rigid gears with limited sample sizes.
In summary, this paper presents a novel approach to predict tooth profile deviation in rigid gears by proposing an ISSA-optimized LSSVM model. By incorporating Tent chaotic mapping, adaptive adjustment strategy, dynamic adaptive weights, and grey wolf hierarchy strategy to refine the SSA algorithm, the LSSVM model is enhanced. Based on these improvements, an ISSA-LSSVM model is established to accurately predict tooth profile deviation in rigid gears using WEDM experimental data as input.
The study’s primary components are categorized as follows: In Section 2, the algorithmic principles and innovations of the research are outlined. Section 3 presents the experimental design and data analysis. The effectiveness and better prediction performance of the ISSA-LSSVM model are demonstrated in Section 4. Finally, Section 5 summarizes the key findings throughout the text.

2. Methodology

2.1. LSSVM Model

With the increase in sample data and the complexity of sample relationships, traditional SVMs tend to lose noise immunity, resulting in a decrease in computational speed. To address this issue, Suykens et al. [26] proposed the LSSVM as an improvement over the original SVM. The LSSVM replaces the inequality constraints in the SVM with equations and utilizes a least-squares linear equation as the loss function. This modification transforms the training process from quadratic programming to solving a system of linear equations, thereby reducing computational complexity and increasing computational speed.
Common nonlinear kernel functions include the radial basis kernel function (RBF), polynomial kernel function, and sigmoid kernel function [27]. The RBF was chosen for this study due to its superior performance in practical applications. The RBF is known for its ability to handle nonlinear relationships and its robustness in various scenarios, making it more suitable for the complex nature of the data in this research compared to other kernel functions such as polynomial or sigmoid functions. The basic principles and operational steps of the LSSVM are described in the literature [28].

2.2. Sparrow Search Algorithm

The LSSVM model relies significantly on the exploration of optimal parameters, including penalty factors and kernel function parameters. Traditional optimization approaches often face challenges in finding the optimal parameter settings due to the complex and nonlinear nature of the LSSVM model. By combining the SSA with the LSSVM, we aim to enhance the parameter optimization process of the LSSVM for improved performance and generalization ability. The synergy of the SSA’s global search advantage and the LSSVM’s powerful generalization capability facilitates effective parameter optimization, addressing challenges in complex parameter selection and enhancing model performance and stability.
The SSA was developed based on sparrows’ foraging and defense strategies [29]. Depending on the main responsibilities of the search process, sparrow populations typically consist of three types: discoverers, followers, and guards. Discoverers, constituting around 10–20% of the population, hold a significant role in locating food sources and directing the collective movement of the entire sparrow population. Discoverers take the lead in the search for food and lead the population to migrate in time when predators are detected. The followers obtain food by following the discoverers. When the follower’s position is at the outermost end of the population and food is scarce, it will follow the discoverer’s tracks and feed in the discoverer’s foraging area. The main responsibility of the guards is to monitor the status of the entire search process and provide early warning information. They monitor the performance metrics, convergence, and other key parameters of the search process, and the guardians send out early warning signals as soon as they notice that the search process is going wrong or needs to be adjusted. The basic principles and operational steps of the SSA are described in the literature [29].

2.3. Improved Sparrow Search Algorithm

In the optimization process, the SSA demonstrates high convergence accuracy. However, in the later iterations, the population diversity decreases, making it susceptible to the issue of local extremes [30]. Therefore, this paper proposes the ISSA algorithm that incorporates the four strategies. The specific strategies are outlined below.

2.3.1. Improved Tent Chaotic Mapping

The initial populations of the SSA are randomly generated, leading to an uneven distribution of sparrow populations in the search space. This lack of population diversity can be addressed by using chaotic mapping techniques. Logistic and Tent mapping are algorithm optimization technologies that are highly regarded among researchers. Tent chaotic mapping, renowned for its simple form, tunable parameters, and reversibility, distinguishes itself among a myriad of chaotic mappings. However, the iteration sequence of Tent mapping may contain small cycles and unstable cycle points. Therefore, a random variation factor rand(0,1) was introduced in the Tent mapping strategy to increase the diversity of the initial population according to the literature [31]. Equation (1) is the improved Tent expression:
x n + 1 = 2 x n + rand 0 , 1 × 1 T , 0 x n 1 2 2 1 x n + rand 0 , 1 × 1 T , 1 2 < x n 1
The expression after the Bernoulli transform is:
x n + 1 = 2 x n mod 1 + rand 0 , 1 × 1 T
T denotes the number of particles in the Tent mapping. Figure 1 displays the initial distribution of chaotic sequences generated by Logistic, Tent, and improved Tent chaotic mapping in a 2D region. It is evident that the improved Tent chaos mapping exhibits better distribution uniformity.

2.3.2. Adaptive Adjustment Strategy

The proportional balance between the number of discoverers and followers is crucial during the iteration of the algorithm. However, during the initial iteration phase, the limited number of discoverers hampers the effectiveness of a global search. Conversely, as the iteration progresses, it becomes necessary to augment the quantity of discoverers and followers to enhance the precision of a local search [32]. Therefore, the present study proposes an adaptive adjustment strategy for the ratio of sparrow discoverers and followers. This strategy aims to enhance the algorithm’s general convergence precision. Equations (3)–(5) reflect the specific form of the strategy.
λ = 0.15 2 e 2 t / K 0.1 q + 0.1
D n = λ N
F n = 1 λ N
In the above expression, λ is a proportion factor with a nonlinear decreasing trend. Dn and Fn represent the number of discoverers and followers, respectively. N is the population size. K denotes the maximum iterations, and t indicates the current iteration number. q [ 0 , 1 ] denotes a randomly generated number for perturbing λ . The performance of this strategy is depicted in Figure 2. After a series of iterations, the discoverer–follower ratio demonstrates convergence. This approach aims to balance early global exploration and later local optimization.

2.3.3. Dynamic Inertia Weights

The SSA often exhibits a jumping step during the iterative process, which helps improve the convergence speed. However, this can also lead to a decrease in the diversity of the search process and result in local optima. To address this, a perturbation strategy using inertia weights is proposed in this study. This strategy updates the positions of the discoverers, enhancing their global search capability and promoting information exchange among sparrow populations. The weighting factor ω is shown in Equation (6), and the location update formula for the discoverer is shown in Equation (7):
ω ( t ) = ω max 1 sin π t 2 K + ω min sin π t 2 K
x i , j t + 1 = x i , j t ω ( t ) exp i z K , R 2 < S T x i , j t + ω ( t ) Q L , R 2 S T
where ω max and ω min are the maximum and minimum values of weight changes; t and K, respectively, denote the current number of iterations and the maximum number of iterations; x i , j represents the current position of the discoverer; z ( 0 , 1 ] is a random number; Q is a random number which obeys normal distribution; and L is a 1 × dim matrix with all elements of 1.

2.3.4. Grey Wolf Hierarchy Strategy

In situations of danger, individual sparrows escape in a progressively narrower manner, focusing solely on the best possible solution at the present state without considering alternative suboptimal solutions. This leads to all individuals converging prematurely to the current optimal individual. When the current optimal individual is not the global extreme value, a local solution will emerge. Therefore, this paper introduces a hierarchical strategy in the GWO algorithm that selects the top 3 historically optimal locations x α , x β , x δ to obtain the potential optimal solution. This strategy enables more flexibility in finding reliable solutions nearby, thus avoiding the SSA from falling into a local optimum. Equation (8) is an expression for the grey wolf hierarchy strategy.
x 1 , j = x α , j t + γ x i , j t x α , j t x 2 , j = x β , j t + γ x i , j t x β , j t x 3 , j = x δ , j t + γ x i , j t x δ , j t
where x 1 , x 2 , and x 3 denote the positions of the remaining grey wolf individuals that need to be adjusted under the influence of α, β, and δ wolves, respectively; x i , j k represents the position vector of the current grey wolf individual; and γ is a random variable obeying a normal distribution.
The expressions for the weights θi corresponding to α, β, and δ wolves are shown below:
ω i = 3 f δ f i 3 f δ f α
θ i = ω i j = α , β , δ ω j , i α , β , δ
where f α , f β , and f δ denote the optimal fitness of α, β, and δ wolves.
From the principle of the grey wolf optimization algorithm, it is clear that the closer the head wolf is to the prey, the higher the weight will be. α wolves have the highest status in the pack and provide the main direction of movement for the grey wolf population. β wolves and δ wolves provide the secondary direction to speed up the encirclement and attack on the prey.
The improved expression for the guard’s position is presented in Equation (11):
x i , j t + 1 = θ 1 x 1 , j + θ 2 x 1 , j x 2 , j + θ 3 x 1 , j x 3 , j , f i > ( f α or   f β or   f δ ) x i , j t + m x i , j t x w o r s t t f i f w + ε , f i = ( f α or   f β or   f δ )
where θ1, θ2, and θ3 represent the weights of α, β, and δ wolves, respectively; m [ 1 , 1 ] is a random number; f i is the fitness value of the present sparrow; f w is the current global worst fitness value; and ε is the smallest constant so as to avoid zero-division-error.

2.4. Performance Test of ISSA

To assess the effectiveness and innovation of the ISSA, simulation experiments were conducted using four benchmark test functions listed in Table 1 [33]. Specifically, F1 and F2 represent unimodal functions, while F3 and F4 represent complex multimodal functions. The optimization performance of the ISSA algorithm was demonstrated by comparing it with PSO, GWO, and SSA.
The following are the initial parameter settings for each optimization algorithm. The number of populations N and the number of iterations K remained consistent (N = 30, K = 100). For PSO, the learning factors c1 and c2 were set to the same value (c1 = c2 = 1.5), with an elasticity coefficient of 0.8. The safety thresholds for the ISSA and SSA were defined as 0.8, and the discoverers and guards accounted for 20% each of the sparrow population. In the ISSA, the maximum coefficient of dynamic inertia weights is 0.9, while the minimum coefficient is 0.6.
In order to minimize the influence of chance events and enhance the persuasiveness of the experiment, the average value and standard deviation were selected to assess the optimization ability and stability of each algorithm. The results of optimizing the benchmark functions using the ISSA, SSA, GWO, and PSO are presented in Table 2. The ISSA demonstrates superior global optimization ability for both unimodal and multimodal functions compared to the SSA, GWO, and PSO. Figure 3 illustrates the convergence curves of each algorithm, showing that the ISSA converges to the global optimal solution faster and performs well across various classes of test functions.

3. Experimental Section and Methods

3.1. Experimental Conditions

The rigid gears were machined using the FZT-540SF middle-walking WEDM machine manufactured by Fangzhen Company in Jiangsu, China. The structure of the machine and the machining process are shown in Figure 4a,b. In this study, an involute harmonic rigid gear with a reduction ratio of 50 and a module of 0.416 is used as the object of study. Table 3 reflects the basic characteristics of rigid gears. The electrode wire chosen for machining is molybdenum wire (wire diameter ϕ = 0.18 mm), and the working medium utilized is emulsion, considering the gear teeth’s characteristics and the machining process. The gear material selected is AISI 1045 steel due to its favorable machinability and mechanical properties, with its chemical composition detailed in Table 4.
Due to constraints in acquiring sufficient experimental resources and the time-consuming nature of conducting precise WEDM tests, the number of experimental data used in this study is relatively low. This limitation should be considered when interpreting the results of the evaluation of prediction methods. Nevertheless, the study provides valuable insights and serves as a preliminary assessment for predicting the tooth profile deviation of rigid gears.

3.2. Orthogonal Test Scheme

To accurately predict the tooth profile error of rigid gears and to improve product quality and performance, the WEDM tests were arranged using Taguchi’s orthogonal method. The Taguchi method can be used to analyze the effects of test factors on performance indicators through fewer tests and then obtain a better combination of solutions to form optimal production conditions [35]. To investigate the effect of machining process parameters on the tooth deviation of rigid gears, an L16 orthogonal array was used for the wire-cutting machining test. The main factors considered in the test were peak current, pulse width, pulse interval, and tracking. Table 5 displays the chosen four process parameters and the level settings for each parameter.

3.3. Total Tooth Profile Deviation Measurement

The machined rigid gear, a small modulus multi-tooth internal gear, is shown in Figure 4c. Small module gears typically have small tooth slot clearance and poor tooth rigidity. Conventional contact measuring instruments are inefficient and difficult to use for measuring small module gears [36]. This study uses a fully automated image measuring machine (MED-5040CNC, Leader Metrology Inc, MD, America) shown in Figure 5 to measure the total tooth profile deviation of rigid gears. This machine utilizes machine vision inspection technology, enabling accurate gear measurement and online detection of gear defects. The measurement results are presented in Table 6, with the total tooth profile deviation denoted by Fα.

4. Tooth Profile Deviation Prediction Model Based on ISSA-LSSVM

4.1. Model Construction

Utilizing the ISSA, two core parameters C and σ 2 of the LSSVM are iteratively optimized to enhance the model’s prediction capability. Figure 6 illustrates the procedure for predicting tooth profile deviation in rigid gears using the ISSA-LSSVM approach.
The concrete steps for predicting tooth profile deviation in rigid gears cover the following stages:
Step 1: Data set division. The WEDM process parameters are used as inputs to the model, and the rigid gear profile deviation is used as the output of the model. Then divide the WEDM test data into training and test sets and normalize them.
Step 2: Initialize the parameters of the model, including the optimization intervals for C and σ 2 , population size, maximum number of iterations, and safety threshold. Adjust the proportions of discoverers and followers according to Equations (4) and (5).
Step 3: Select the mean squared error (MSE) as the model fitness function. The MSE is commonly used in the evaluation of regression models to help measure the predictive effectiveness of the model for continuous variables.
Step 4: Calculate and sort the individual adaptation values for all sparrows to determine the current best and worst fitness, along with their respective positions.
Step 5: Update the positions of the discoverer, follower, and guard, respectively. Calculate and update the fitness value of each sparrow and find the best position for the global fitness values through comparison.
Step 6: Determine whether the current iteration number reaches the maximum value. If this condition is satisfied, optimize the model parameters and build a prediction model for tooth profile deviation using ISSA-LSSVM. If not, return to step 3 and repeat the iteration process.
Step 7: Predict the profile deviation of rigid gears using the constructed ISSA-LSSVM model and generate all prediction results.

4.2. Model Setup and Indicators’ Selection

The results of the orthogonal experiments were used as the dataset for the model, and it was separated randomly into a training set and a test set (training set–test set = 8:2). To evaluate the performance and accuracy of the rigid gear tooth deviation prediction model based on ISSA-LSSVM, the prediction results were compared with the PSO-LSSVM, GWO-LSSVM, and SSA-LSSVM models. All four models were configured with the same basic parameters: a search interval of [0.01, 1000] for the LSSVM model parameters. The remaining parameters for each algorithm were consistent with those described in Section 2.4.
This paper evaluates and compares the optimization results for four prediction models using three metrics: the RMSE, MAPE, and R2. The RMSE quantifies the average discrepancy between the model’s predicted and actual values. The MAPE expresses the accuracy of a model as a percentage, indicating how close the predicted values are to the actual values on average. A lower RMSE and MAPE indicate better performance in model prediction. The statistic R2 reflects the degree of closeness between the data points and the fitted curve, with values ranging from 0 to 1. A higher R2 value approaching 1 indicates a more ideal fit between the model and the data.
The formulas for each of the three evaluation indicators are shown below:
R M S E = 1 l i = 1 l y i f i 2
M A P E = 1 l i = 1 l y i f i y i × 100 %
R 2 = 1 i = 1 l ( y i f i ) 2 i = 1 l ( y i y ¯ ) 2 = i = 1 l y i y ¯ 2 i = 1 l f i y ¯ 2
In the above equation, l denotes the number of samples, y i denotes the total deviation of the actual measured tooth profile, and f i represents the predicted values. In Equation (12), y ¯ denotes the arithmetic mean of the true values.

4.3. Model Validation

The performance of the rigid gear tooth profile deviation prediction model based on ISSA-LSSVM is demonstrated by comparing it with other models including PSO-LSSVM, GWO-LSSVM, and SSA-LSSVM. Figure 7 presents the links between real and simulated values, respectively, showing the performance of the prediction models. The results show that the ISSA-LSSVM model closely aligns with the actual prediction curve, with minimal error between the actual and predicted values.
The predictive indicators of the four models are presented in Table 7. The R2 value of the ISSA-LSSVM model (R2 = 0.9828) significantly exceeds 0.95, whereas the R2 values of the other models fall below 0.95. The comparison shows that the ISSA-LSSVM model has the highest degree of fit. Additionally, the RMSE and MAPE of the ISSA-LSSVM model are smaller than other models (RMSE = 0.0029, MAPE = 0.0156). In comparison to the SSA-LSSVM model, the ISSA-LSSVM model shows an increase in R2 value by 0.0389, a decrease in RMSE by 0.0009, and a decrease in MAPE by 0.0070. The above analyses also validate the feasibility and superiority of the ISSA, which incorporates multiple strategies for improvement. Both Table 7 and Figure 7 demonstrate that the ISSA-LSSVM model outperforms other models in terms of prediction accuracy and stability.

5. Conclusions

In this study, a novel profile deviation prediction model (ISSA-LSSVM) is proposed for accurately predicting the profile error of WEDM rigid gears. The model is utilized to analyze the impact of WEDM process parameters on the profile error of rigid gears and to enable intelligent adjustment of the profile error. The key findings are outlined below:
  • The standard SSA is improved by introducing Tent chaotic mapping, adaptive adjustment strategy, dynamic inertia weights, and grey wolf hierarchy strategy, which significantly improve the effectiveness and robustness of the algorithm. The improved ISSA is verified to have better convergence speed and global optimization capability than PSO, GWO, and SSA by four different types of benchmark test functions.
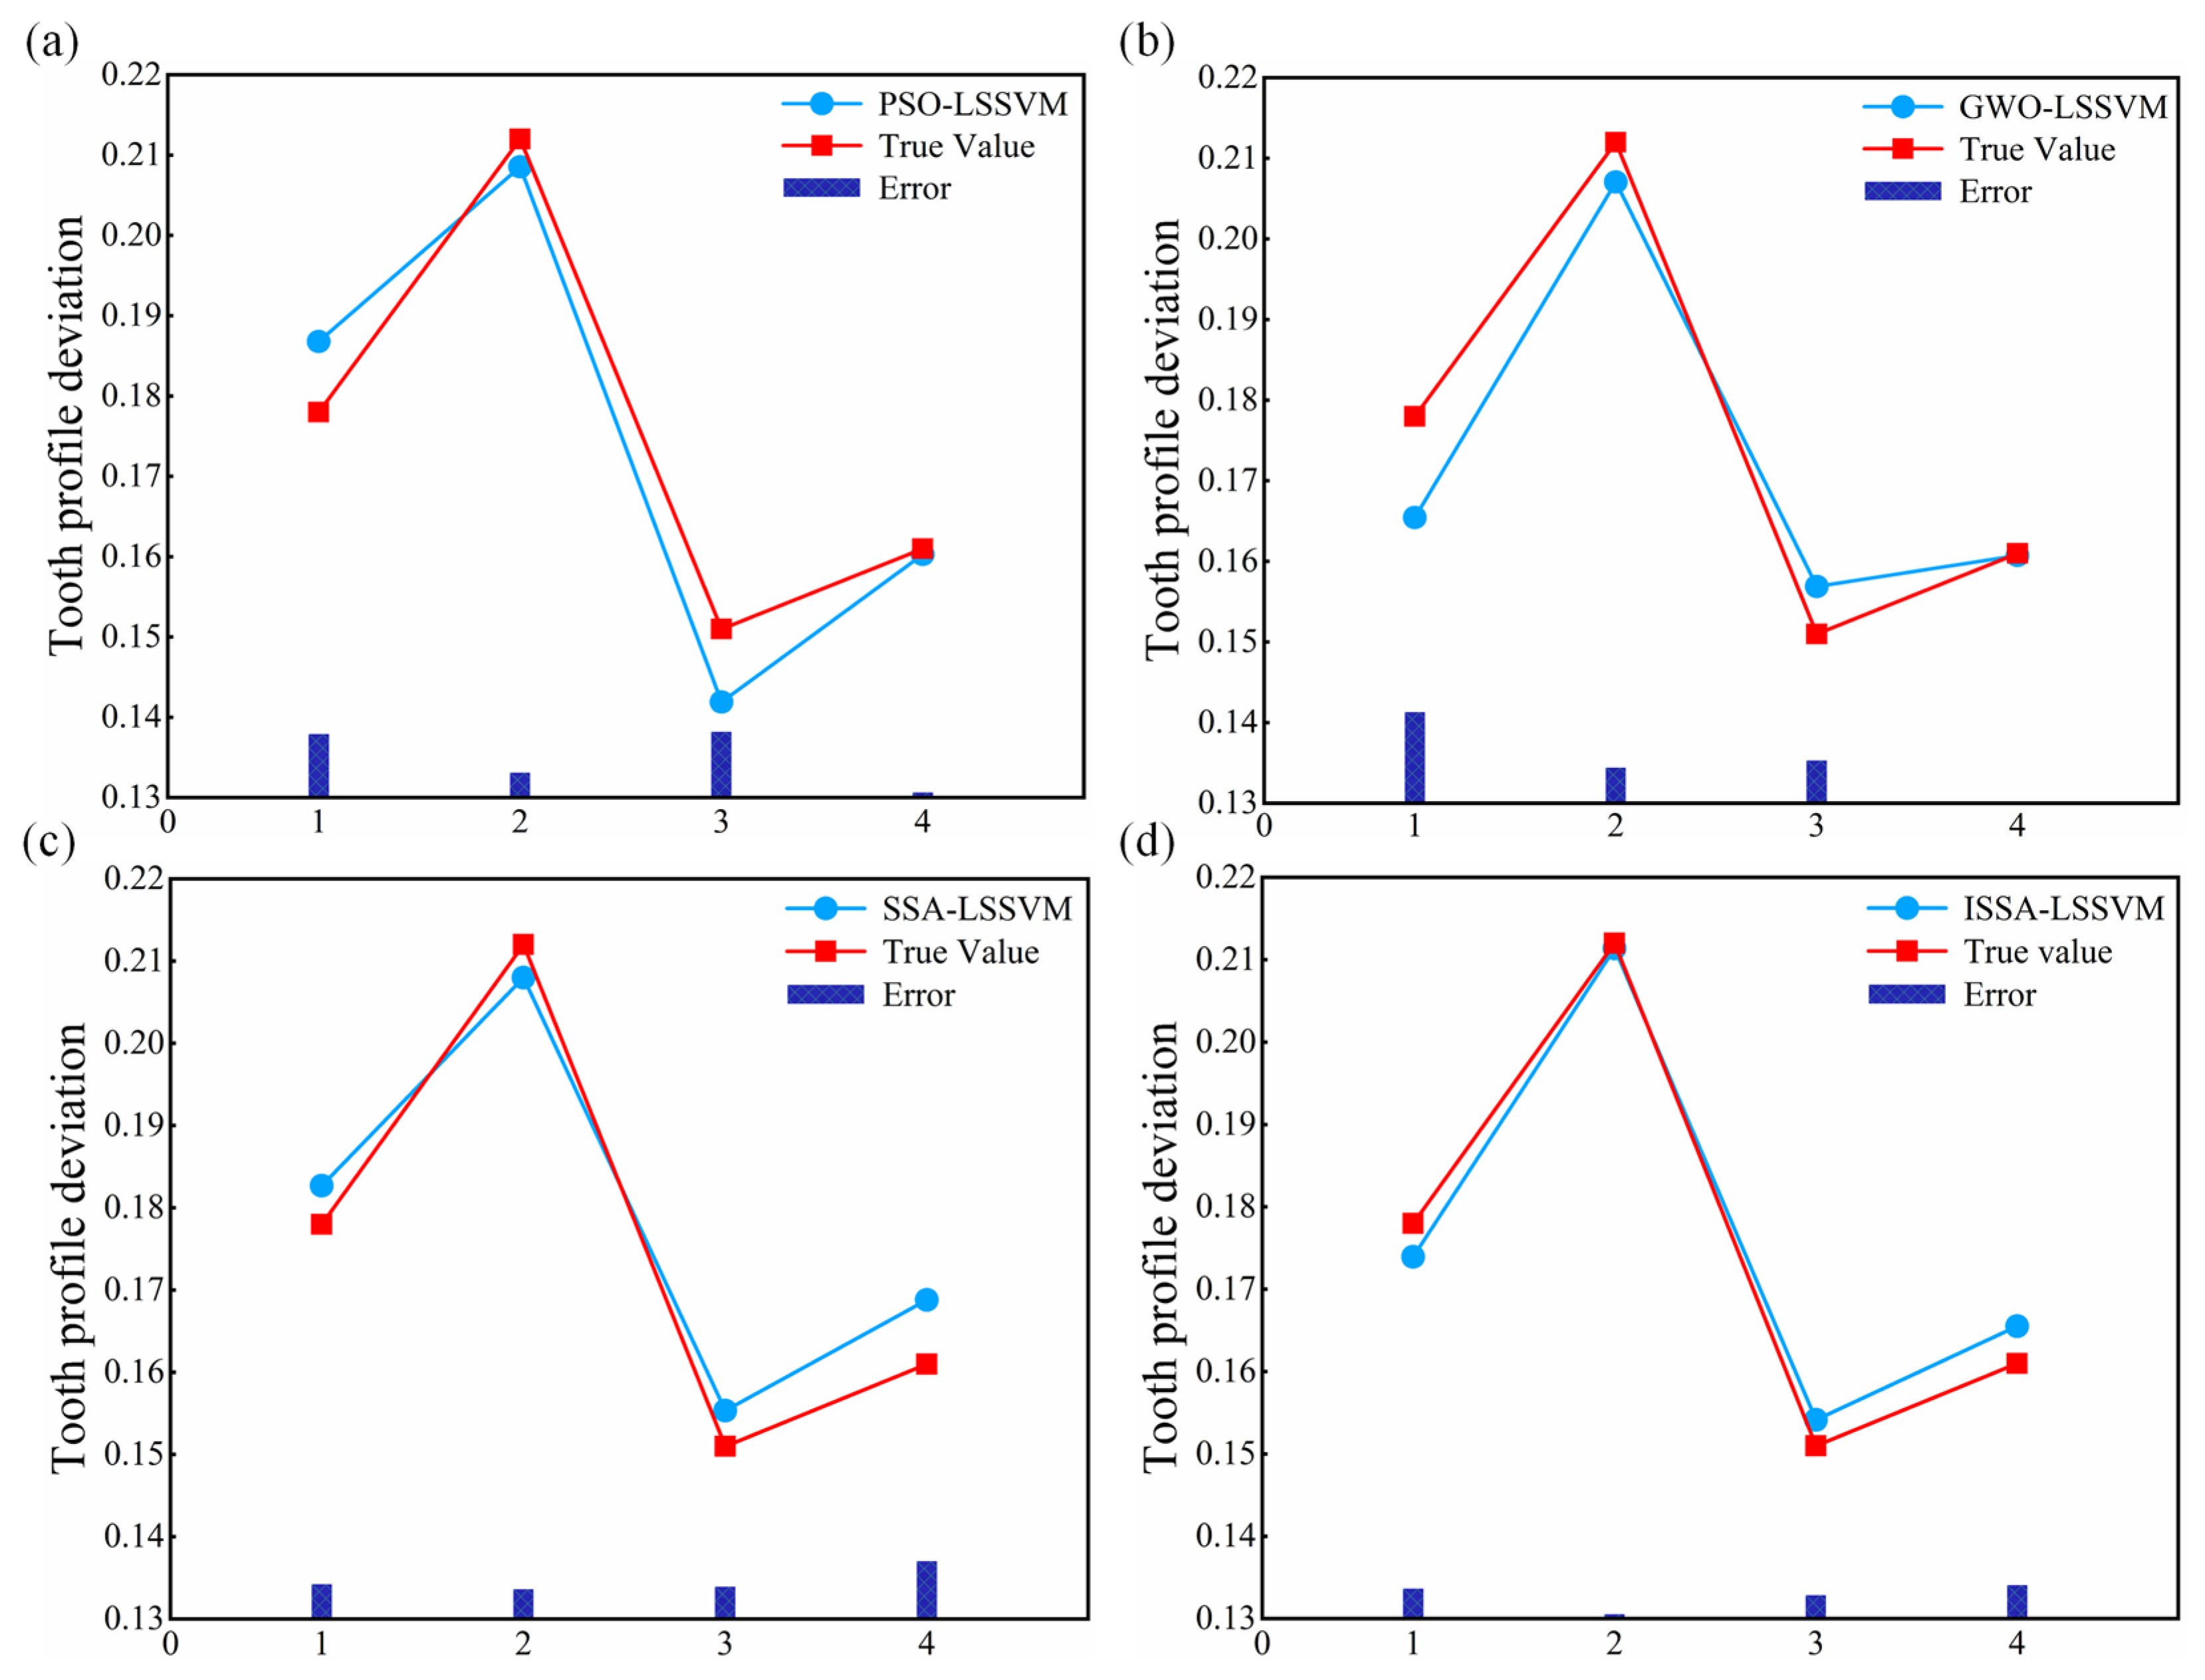
  • The prediction results and errors of the ISSA-LSSVM tooth profile deviation prediction model were compared with those of the PSO-LSSVM, GWO-LSSVM, and SSA-LSSVM prediction models on different datasets. The results show that the ISSA-LSSVM prediction model has a higher prediction accuracy and faster convergence speed (ISSA-LSSVM model: R2 = 0.9828, RMSE = 0.0029, MAPE = 0.0156).
  • The developed ISSA-LSSVM model exhibits superior prediction capability and can provide reliable theoretical guidance for predicting the tooth profile deviation of rigid gears.
This research provides an innovative and reliable model for predicting tooth profile deviation in WEDM rigid gears. Despite the promising results, this study has several limitations that should be addressed in future research. Firstly, the dataset used for model training and validation is relatively small and specific to certain types of rigid gears and WEDM conditions. To enhance the generalizability of the proposed ISSA-LSSVM model, it is essential to collect and utilize more diverse and extensive datasets. Secondly, while the ISSA optimization strategy has been shown to be effective, the influence of different parameter settings on the model’s performance needs further exploration. Additionally, the current model’s applicability to other types of gears and machining methods remains uncertain and warrants further investigation.
Future research could focus on several key areas to further improve and validate the proposed ISSA-LSSVM model. One important direction is the collection and analysis of more diverse and extensive datasets to ensure the model’s robustness and generalizability across different types of rigid gears and machining conditions. Additionally, exploring the combination of the LSSVM with other advanced optimization algorithms could potentially enhance the model’s prediction accuracy and stability. Furthermore, developing new models or improving existing ones to handle more complex prediction tasks and larger datasets will be crucial for advancing the state of the art in gear profile deviation prediction.

Author Contributions

Conceptualization, Y.W. and Z.W.; methodology, Y.W. and Z.W.; software, Z.W.; validation, Z.W.; formal analysis, Y.W., Z.W., G.W. and H.X.; investigation, Z.W., G.W. and H.X.; resources, Y.W. and Z.W.; data curation, Z.W., G.W. and H.X.; writing—original draft preparation, Z.W.; writing—review and editing, Y.W.; visualization, Y.W. and Z.W.; supervision, Y.W.; project administration, Y.W.; funding acquisition, Y.W. All authors have read and agreed to the published version of the manuscript.

Funding

This research was funded by the Natural Science Foundation of Gansu Province, grant number 22JR5RA268.

Institutional Review Board Statement

Not applicable.

Informed Consent Statement

Not applicable.

Data Availability Statement

Data are contained within the article.

Conflicts of Interest

The authors declare no conflicts of interest.

References

  1. Ma, J.; Li, C.; Luo, Y.; Cui, L. Simulation of meshing characteristics of harmonic reducer and experimental verification. Adv. Mech. Eng. 2018, 10, 1687814018767494. [Google Scholar] [CrossRef]
  2. Song, C.; Li, X.; Yang, Y.; Sun, J. Parameter design of double-circular-arc tooth profile and its influence on meshing characteristics of harmonic drive. Mech. Mach. Theory 2022, 167, 104567. [Google Scholar] [CrossRef]
  3. Guo, Z.; Mao, S.; Li, X.; Ren, Z. Research on the theoretical tooth profile errors of gears machined by skiving. Mech. Mach. Theory 2016, 97, 1–11. [Google Scholar] [CrossRef]
  4. Yuan, B.; Han, J.; Tian, X.; Xia, L. Optimization and active control of internal gearing power honing process parameters for better gear precision. Mech. Sci. 2022, 13, 449–458. [Google Scholar] [CrossRef]
  5. Shilong, W.; Shouli, S.U.N.; Jie, Z.; Ling, K.; Cheng, C. Research on Mapping Rules of Hob Geometric Errors and Gear Geometric Precision. J. Mech. Eng. 2013, 49, 119–125. [Google Scholar]
  6. Sun, S.; Wang, S.; Wang, Y.; Lim, T.; Yang, Y. Prediction and optimization of hobbing gear geometric deviations. Mech. Mach. Theory 2018, 120, 288–301. [Google Scholar] [CrossRef]
  7. Peng, B.; Luo, Y.; Wang, H.; Niu, T.; Wang, Y. Investigation on the effects of tooth profile deviation in gear rolling process. Int. J. Adv. Manuf. Technol. 2023, 126, 1877–1887. [Google Scholar] [CrossRef]
  8. Yusron, R.M.; Prasetyo, T.; Pramudia, M. Investigation of Involute Profile Error on Spur Gear Processed using Wire EDM. IOP Conf. Ser. Mater. Sci. Eng. 2021, 1125, 012119. [Google Scholar] [CrossRef]
  9. Kharka, V.; Jain, N.K.; Gupta, K. Influence of MQL and hobbing parameters on microgeometry deviations and flank roughness of spur gears manufactured by MQL assisted hobbing. J. Mater. Res. Technol. 2020, 9, 9646–9656. [Google Scholar] [CrossRef]
  10. Mo, S.; Li, Y.; Luo, B.; Wang, L.; Bao, H.; Cen, G.; Huang, Y. Research on the meshing characteristics of asymmetric gears considering the tooth profile deviation. Mech. Mach. Theory 2022, 175, 104926. [Google Scholar] [CrossRef]
  11. Chen, Z.; Zhou, Z.; Zhai, W.; Wang, K. Improved analytical calculation model of spur gear mesh excitations with tooth profile deviations. Mech. Mach. Theory 2020, 149, 103838. [Google Scholar] [CrossRef]
  12. Tsai, C. Simple mathematical approach for analyzing gear tooth profile errors of different gears cut using same power-skiving tool. Mech. Mach. Theory 2022, 177, 105042. [Google Scholar] [CrossRef]
  13. Chaudhari, R.; Vora, J.J.; Patel, V.; Lacalle, L.N.L.D.; Parikh, D.M. Effect of WEDM Process Parameters on Surface Morphology of Nitinol Shape Memory Alloy. Materials 2020, 13, 4943. [Google Scholar] [CrossRef]
  14. Sliusarenko, O.; Escudero, G.G.; González, H.; Calleja, A.; Bartoň, M.; Ortega, N.; de Lacalle, L.N.L. Constant probe orientation for fast contact-based inspection of 3D free-form surfaces using (3+2)-axis inspection machines. Precis. Eng. 2023, 84, 37–44. [Google Scholar] [CrossRef]
  15. Escudero, G.G.; Bo, P.; González-Barrio, H.; Calleja-Ochoa, A.; Bartoň, M.; de Lacalle, L.N.L. 5-axis double-flank CNC machining of spiral bevel gears via custom-shaped tools—Part II: Physical validations and experiments. Int. J. Adv. Manuf. Technol. 2022, 119, 1647–1658. [Google Scholar] [CrossRef]
  16. Gupta, K.; Jain, N.K. On Micro-Geometry of Miniature Gears Manufactured by Wire Electrical Discharge Machining. Mater. Manuf. Process. 2013, 28, 1153–1159. [Google Scholar] [CrossRef]
  17. Nain, S.S.; Garg, D.; Kumar, S. Evaluation and analysis of cutting speed, wire wear ratio, and dimensional deviation of wire electric discharge machining of super alloy Udimet-L605 using support vector machine and grey relational analysis. Adv. Manuf. 2018, 6, 225–246. [Google Scholar] [CrossRef]
  18. Li, Z.; Li, X.; Zhang, H.; Huang, D.; Zhang, L. The prediction of contact force networks in granular materials based on graph neural networks. J. Chem. Phys. 2023, 158, 054905. [Google Scholar] [CrossRef]
  19. Zhu, C.; Li, G.; Luis, N.V.J.; Dong, W.; Wang, L. Optimization of RF to alloy elastic modulus prediction based on cuckoo algorithm. Comput. Mater. Sci. 2024, 231, 112515. [Google Scholar] [CrossRef]
  20. He, J.; Cu, S.; Xia, H.; Sun, Y.; Xiao, W.; Ren, Y. High accuracy roll forming springback prediction model of SVR based on SA-PSO optimization. J. Intell. Manuf. 2023, 1–17. [Google Scholar] [CrossRef]
  21. Shi, M.; Tan, P.; Qin, L.; Huang, Z. Research on Valve Life Prediction Based on PCA-PSO-LSSVM. Processes 2023, 11, 1396. [Google Scholar] [CrossRef]
  22. Feng, Y.; Hong, Z.; Gao, Y.; Lu, R.; Wang, Y.; Tan, J. Optimization of variable blank holder force in deep drawing based on support vector regression model and trust region. Int. J. Adv. Manuf. Technol. 2019, 105, 4265–4278. [Google Scholar] [CrossRef]
  23. Li, S.; Li, S.; Liu, Z.; Vladimirovich, P.A. Roughness prediction model of milling noise-vibration-surface texture multi-dimensional feature fusion for N6 nickel metal. J. Manuf. Process. 2022, 79, 166–176. [Google Scholar] [CrossRef]
  24. Zhao, Z.; Chen, K.; Chen, Y.; Dai, Y.; Liu, Z.; Zhao, K.; Wang, H.; Peng, Z. An Ultra-Fast Power Prediction Method Based on Simplified LSSVM Hyperparameters Optimization for PV Power Smoothing. Energies 2021, 14, 5752. [Google Scholar] [CrossRef]
  25. Wan, P.; Zou, H.; Wang, K.; Zhao, Z. Hot deformation characterization of Ti–Nb alloy based on GA-LSSVM and 3D processing map. J. Mater. Res. Technol. 2021, 13, 1083–1097. [Google Scholar] [CrossRef]
  26. Suykens, J.A.K.; Vandewalle, J. Least Squares Support Vector Machine Classifiers. Neural Process. Lett. 1999, 9, 293–300. [Google Scholar] [CrossRef]
  27. Ge, Y.; Zhang, J.; Song, G.; Zhu, K. An effective LSSVM-based approach for milling tool wear prediction. Int. J. Adv. Manuf. Technol. 2023, 126, 4555–4571. [Google Scholar] [CrossRef]
  28. Yu, C.; Xi, Z.; Lu, Y.; Tao, K.; Yi, Z. LSSVM-based color prediction for cotton fabrics with reactive pad-dry-pad-steam dyeing. Chemometr. Intell. Lab. 2020, 199, 103956. [Google Scholar] [CrossRef]
  29. Xue, J.; Shen, B. A novel swarm intelligence optimization approach: Sparrow search algorithm. Syst. Sci. Control Eng. 2020, 8, 22–34. [Google Scholar] [CrossRef]
  30. Dokeroglu, T.; Sevinc, E.; Kucukyilmaz, T.; Cosar, A. A survey on new generation metaheuristic algorithms. Comput. Ind. Eng. 2019, 137, 106040. [Google Scholar] [CrossRef]
  31. Ouyang, C.; Qiu, Y.; Zhu, D. Adaptive Spiral Flying Sparrow Search Algorithm. Sci. Program. 2021, 2021, 6505253. [Google Scholar] [CrossRef]
  32. Qiu, S.; Li, A. Application of Chaos Mutation Adaptive Sparrow Search Algorithm in Edge Data Compression. Sensors 2022, 22, 5425. [Google Scholar] [CrossRef] [PubMed]
  33. Sharma, P.; Raju, S. Metaheuristic optimization algorithms: A comprehensive overview and classification of benchmark test functions. Soft Comput. 2023, 28, 3123–3186. [Google Scholar] [CrossRef]
  34. Zhao, J.; Wang, Q.; Wang, Y.; Wu, D.; Zhang, L.; Shen, B. Research on the Tooth Surface Integrity of Non-Circular Gear WEDM Based on HPSO Optimization SVR. Appl. Sci. 2022, 12, 12858. [Google Scholar] [CrossRef]
  35. Erkoçak, Y.; Kayır, Y. Analyzing the Impacts of Cutting Parameters on Cutting Forces in the Taguchi Method for Boring High-Alloy White Cast Irons with CBN Inserts. Arab. J. Sci. Eng. 2023, 48, 12569–12585. [Google Scholar] [CrossRef]
  36. Luo, M.; Zhong, S. Non-Contact Measurement of Small-Module Gears Using Optical Coherence Tomography. Appl. Sci. 2018, 8, 2490. [Google Scholar] [CrossRef]
Figure 1. Initial distribution of chaotic sequences.
Applsci 14 04596 g001
Figure 2. Ratio of discoverers to followers.
Applsci 14 04596 g002
Figure 3. Fitness curves of four optimization algorithms with different benchmark functions. (a) F1 function curve; (b) F2 function curve; (c) F3 function curve; (d) F4 function curve.
Applsci 14 04596 g003
Figure 4. Rigid gears wire electrical discharge machining. (a) WEDM machine; (b) WEDM process; (c) machined rigid gear.
Applsci 14 04596 g004
Figure 5. Image measuring machine and measuring procedure for total tooth profile deviation.
Applsci 14 04596 g005
Figure 6. Flowchart of ISSA-LSSVM model prediction.
Applsci 14 04596 g006
Figure 7. Prediction results and errors for each model. (a) PSO-LSSVM model; (b) GWO-LSSVM model; (c) SSA-LSSVM model; (d) ISSA-LSSVM model.
Applsci 14 04596 g007
Table 1. Selected 4 benchmark functions.
FunctionDimensionRangeFmin
F 1 ( x ) = i = 1 d j = 1 d x j 2 30[−30,30]0
F 2 x = i = 1 d 100 x i + 1 x i 2 2 + x i 1 2 30[−30,30]0
F 3 x = i = 1 d x i 2 10 cos 2 π x i + 10 30[−600,600]0
F 4 x = 1 4000 i = 1 d x i 2 i = 1 d cos x i i + 1 30[−5.12,5.12]0
Table 2. Comparison and analysis of ISSA and other algorithms.
FParametersOptimization Algorithm
ISSASSAGWOPSO
F1Average value6.86 × 10−2916.62 × 10−2210.002186.08 × 103
Standard deviation000.003062.28 × 103
F2Average value3.17 × 10−61.33 × 10−426.752.78 × 102
Standard deviation5.83 × 10−62.40 × 10−40.778461.48 × 102
F3Average value006.9927.20
Standard deviation005.087.43
F4Average value000.002974.07 × 102
Standard deviation000.0068532.34
Table 3. Main parameters of rigid gears.
Module
(mm)
Pressure Angle
(°)
Number of TeethTooth Width (mm)Tip Diameter
(mm)
Root Diameter (mm)
0.416201021342.1343.07
Table 4. Chemical composition of AISI 1045 steel [34].
CompositionSiCMnCuCrNiFe
(%)0.17–0.370.42–0.500.50–0.80≤0.25≤0.25≤0.25balance
Table 5. Input parameters and levels.
LevelPeak Current/(A)Pulse Width/(μs)Pulse Interval/(µs)Tracking/
(Hz/s)
1186100
21.5167150
32248200
42.5329250
Table 6. Orthogonal test results of total tooth profile deviation.
Test NumberPeak Current
(A)
Pulse Width
(μs)
Pulse Interval
(µs)
Tracking
(Hz/s)
Fα (mm)
11861000.151
211671500.149
312482000.154
413292500.157
51.5872000.146
61.51662500.155
71.52491000.161
81.53281500.173
92882500.156
1021692000.165
1122461500.178
1223271000.185
132.5891500.158
142.51681000.171
152.52472500.212
162.53262000.223
Table 7. Results of the evaluation indicators for the four models.
ModelR2RMSEMAPE
PSO-LSSVM0.93070.00560.0327
GWO-LSSVM0.92050.00710.0357
SSA-LSSVM0.94390.00380.0226
ISSA-LSSVM0.98280.00290.0156
Disclaimer/Publisher’s Note: The statements, opinions and data contained in all publications are solely those of the individual author(s) and contributor(s) and not of MDPI and/or the editor(s). MDPI and/or the editor(s) disclaim responsibility for any injury to people or property resulting from any ideas, methods, instructions or products referred to in the content.

