Article

Updating Durability Models for Concrete Structures in Chlorine Environment Based on Detection Information

School of Architecture and Engineering, Liaocheng University, Liaocheng 252000, China
*
Author to whom correspondence should be addressed.
Appl. Sci. 2024, 14(11), 4516; https://doi.org/10.3390/app14114516
Submission received: 21 March 2024 / Revised: 20 May 2024 / Accepted: 22 May 2024 / Published: 24 May 2024

Abstract

:
The assessment of concrete structure durability in chlorine environments is significantly impacted by the uncertainty inherent in existing durability models. It introduces an integrated approach for updating these models based on the detection information of existing structures. This approach narrows the gap between theoretical predictions and observed structural durability. Specifically, we refined the probability model of critical chloride content by analyzing steel bar corrosion sample proportions using Bayesian theory for greater accuracy. The enhanced model enables more reliable life expectancy prediction, forming a solid foundation for maintaining and strengthening existing structures. This method was demonstrated through a case study of a reinforced concrete industrial building with a service life of 12 years.

1. Introduction

Chloride-induced rebar corrosion, often resulting from marine exposure and the widespread use of deicing salts. It is a common cause of degradation in reinforced concrete structures [1]. The durability of concrete structures in chloride environments seriously affects their long-term performance. The durability of concrete structures refers to the ability to maintain their applicability and safety under normal use and maintenance conditions [2]. Usually, the durability of concrete structures in chloride environments, especially permeability and diffusion, is influenced by their characteristics, such as concrete quality, environmental exposure conditions, and the presence of stress or cracks [3,4,5,6,7]. Many studies developed durability models that link corrosion and service life [2]. In practical environments, the actual durability of concrete is different from the theoretical durability [8,9]. In addition, due to the different experimental methods, parameters, and modeling assumptions used by different researchers, the prediction results of different theoretical degradation models vary greatly. In order to minimize the variability of these predictions and improve the confidence of the results, on-site durability inspection information is usually used to calibrate and modify these durability models, which requires the consideration and proper handling of uncertainties related to various measurements and the development of methods that can appropriately use on-site inspection information [10].
Updating durability models for concrete structures is an important research direction in the field of civil engineering, aiming at continuously optimizing and updating the durability prediction models for concrete structures by means of monitoring or inspection data so as to more accurately assess the remaining life of the structures [10]. In Europe and the United States, research on the update of durability models for concrete structures is relatively mature, with many studies focusing on the integration of sensor technology and data-driven methods to achieve real-time monitoring and model updates. For example, Heitner et al. [11] proposed a concrete durability model based on the Bayesian updating method, which can adjust model parameters according to real-time monitoring data to improve prediction accuracy. Suo et al. [12] studied the update method of concrete structure durability models based on reliability theory. By considering the uncertainties of environmental and material properties, they proposed a more flexible and reliable model update framework. Research on the update of durability models for concrete structures in China started late but has made some progress in recent years. Many universities and research institutions have begun to focus on this field, especially in the application of combining Internet of Things technology and big data analysis. Xiao et al. [13] proposed a concrete structure durability monitoring and model update system based on the reliability method in their research. It can realize the real-time data collection and processing of large-scale structures, providing effective technical support for model updates. Gu et al. [14] explored the update method of concrete durability models based on machine learning algorithms. By analyzing historical monitoring data, the model parameters are automatically adjusted, improving the predictive performance and adaptability of the model.
To narrow the gap between theoretical predictions and observed structural durability, this paper proved an updating method for durability models with inspection data through Bayesian updating. It is organized as follows: In Section 2, the durability models in chlorine environment with Fick’s second law and probabilistic lifetime prediction model are presented. Section 3 introduces Bayesian updating and the actual numerical method used. Finally, a case study is presented in Section 4, where the different detection information is applied, evaluated, and compared.

2. Existing Durability Model in Chlorine Environment

The durability damage of concrete structures under a chloride environment is mainly caused by the degradation of structural performance caused by the corrosion of steel bars. Chlorine ions reach the surface of steel through external channels and accumulate to the critical concentration of chloride ions, which can damage the surface passivation film of the steel and form a corrosive cell. The corrosion process in a chlorine environment goes through three stages: the initial corrosion stage of concrete when chloride ions reach a critical concentration; the stage of concrete protective layer cracking caused by corrosion and expansion; and the stage of the severe degradation of the structural performance due to crack propagation. The deterioration process of reinforcement corrosion is shown in Figure 1, adapted from Tuutti [15] and from fib bulletin 34 [16]. Before the concrete protective layer cracks, the corrosion rate caused by chloride salt erosion is slower. After the concrete protective layer cracks, the corrosion rate increases, and the remaining life of the structure significantly decreases.
When evaluating durability, different standards should be set according to the functional requirements of the structure to determine the corresponding durability limit state. For example, for components that do not allow corrosion within the target service life, such as prestressed steel bars in prestressed components, the initial corrosion limit state of the steel bars should be evaluated. For components that do not allow concrete cover cracking within the target service life, the limit state of concrete cover rust expansion cracking should be evaluated. This article only discusses the initial corrosion limit state to explain how the model was updated.

2.1. Chloride Ion Diffusion Model

The process of chloride ions from the concrete surface is an unstable diffusion process, which can be characterized using Fick’s second law [17]. When considering a nonstationary diffusion process, the partial derivative of a concentration (C) to time (t) is equal to the negative value of the diffusion flux (J) to the partial derivative of distance:
C t = J x
Further, in the process of unstable diffusion, the diffusion flux can be written as the negative value of the concentration change rate with distance, and the above equation can be rewritten as follows:
C t = D C l 2 C x 2
where D C l is the unstable diffusion coefficient of chloride ions. When analyzing the diffusion of chloride ions into concrete, it can be considered that this unstable diffusion of chloride ions is one-dimensional. Thus, it can take the following boundary conditions for Equation (2):
C | x = 0 = C s ,   C | x > 0 t = 0 = C 0
The analytical solution of the PDE (Partial Differential Equation) can be obtained from the boundary conditions and considering the initial chloride content:
C ( x , t ) = ε 1 [ C 0 + ( C s C 0 ) [ 1 e r f ( x / ( 2 D C l t ) ) ] ]
where C s is the chloride ion concentration on the surface of concrete, expressed in % by mass of the cementitious material; C 0 is the initial chloride ion content inside the concrete, with a unit of % cementing material mass; D C l is the apparent chloride diffusion coefficient in concrete, with a unit of m2/s; ε 1 is the uncertainty coefficient of the model, which is a random variable that reflects significant uncertainty related to the chloride concentration model. It can be calculated by the ratio of actual measured values to the calculated values of C ( x , t ) ; C ( x , t ) is the chloride concentration of concrete along the depth x and with time t , measured in % by mass of cementitious material; e r f ( · ) is an error function expressed as follows:
e r f ( u ) = 2 π 0 u e t 2 d t
This analytical solution provides a method for calculating the chloride concentration within a certain distance from the concrete surface after time t. Currently, Equation (4) is widely used for calculating the diffusion distribution of chloride ions in concrete structures under chloride environments, and its results can serve as a basis for predicting the durability life of concrete structures.

2.2. Initial Corrosion Model of Steel Reinforcement

When the chloride concentration on the surface of the steel bar reaches a certain value C c r (critical chloride concentration), the steel bar loses its passivation layer and corrode, which is defined as the initial corrosion durability limit state [18]. The code ‘Code for design of concrete structures’ [19] specifies that for marine concrete structures with a design service life of 50 years, the maximum chloride ion content is 0.1% (of the total amount of cementitious materials), and the maximum chloride ion content in prestressed concrete components is 0.06% (of the total amount of cementitious materials). The American Concrete Institute’s ACI 318 standard [20] has clear regulations on the maximum allowable chloride ion content in concrete to ensure that the reinforcement is not corroded. For prestressed concrete, the chloride ion content must not exceed 0.06% of the weight of the total amount of cementitious materials. Therefore, to simplify the calculations, taking the initial chloride ion content inside the concrete equal to 0, as C 0 = 0, the durability limit state equation is expressed as follows:
G = C c r ε 1 C s [ 1 e r f ( x d / ( 2 D C l t ) ) ]
Here, x d is the thickness of the concrete protective layer, with the unit in mm. The diffusion coefficient of chloride ions D C l in the model is a function of time [12], expressed as follows:
D C l ( t ) = D C l 0 ( t 0 / t ) a = D C l 0 η ( t 0 , t , a )
where D C l 0 is the instantaneous chloride diffusion coefficient at the t 0 moment, D C l ( t ) is the chloride diffusion coefficient at the t moment, and a is the age attenuation index. Generally, it takes t 0 as 28 days and D C l 0 as the chloride ion diffusion coefficient of concrete at 28 days (m2/s). Usually, the chloride ion diffusion coefficient in concrete materials does not decay exponentially over time. Life-365 [21] defines the diffusion coefficient of chloride ions as only increasing within 25 years, assuming a constant after 25 years. In the durability design of the Hong Kong–Zhuhai–Macau offshore passage project, the decay time of the chloride ion diffusion coefficient over time is set to 30 years [22]. That is to say, after 30 years, the chloride ion diffusion coefficient of concrete is no longer attenuated:
η ( t 0 , t , a ) | t > t D = η ( t 0 , t D , a )   with   t D = 30   years
The effect of the fly ash and slag incorporation on the age decay index is the following:
a = 0.2 + 0.4 ( % F A / 50 + % S G / 70 )
Life-365 [20] also specifies the relationship between the diffusion coefficient of chloride ions and temperature:
D C l ( T ) = D C l 0 exp [ U / R ( 1 / T 0 1 / T ) ]
where D C l ( T ) is the diffusion coefficient at time t and temperature T; D C l 0 is the chloride diffusion coefficient over a 28-day period; T 0 is the temperature, set at 293 K (20 °C); U is the activation energy of the diffusion process (35,000 J/mol); R is the gas constant; and T is the temperature.
When G = 0 in Equation (6), we can calculate the initial corrosion time t i n i :
t i n i = x d 2 ( 4 D C l ) 1 [ e r f 1 ( 1 C c r / ( ε 1 C s ) ) ] 2
According to the limit equation of the state of initial corrosion durability of reinforcement, considering the statistical characteristics of each parameter in the equation, the probability of reinforcement initial corrosion at any time t can be calculated as follows:
p cor ( t ) = Pr { G < 0 } = Pr { C c r ε 1 C s [ 1 e r f ( x d / ( 2 D C l t ) ) ] < 0 } 0 < p cor ( t ) < 1

3. Bayesian Updating with Detection Information

Using the testing methods specified in ‘Technical standard for building structure detection’ [23], ‘Technical standard for the field inspection of concrete structure’ [24], ‘Technical regulations for detecting the compressive strength of concrete by rebound method’ [25], and ‘Technical regulations for non-damage detection of port engineering concrete’ [26], this study investigated and tested on existing concrete structures in a chlorine environment. The detection information obtained includes the strength of the concrete, the thickness of the concrete cover, the distribution of chloride ions in the different thickness layers of the concrete cover in the concrete, the corrosion of the steel bar determined by the half-cell potential method, and the observed cracking of the concrete surface.

3.1. Updating of the Chloride Diffusion Model

Assuming that the structure is tested after t 0 years of use, experiments and analyses have been conducted on the distribution and diffusion of chloride ions in concrete structures. In general, components with different degrees of corrosion were selected to sample drilled powder concrete at different depths. In order to make the data representative and facilitate statistical analysis, no fewer than three sampling points were selected for each sample (with the same component and elevation), with depths of 0–10 mm, 10–20 mm, 20–40 mm, 40–60 mm, and 60–80 mm, respectively. The chloride ion content in the concrete powder samples was measured using the potential titration method. After calculation, the Cl concentration of concrete at different depths could be obtained. Regression fitting based on Fick’s second law of Cl concentration was performed at different depths to calculate surface chloride ion concentration C s , chloride ion diffusion coefficient D C l , and model uncertainty coefficient ε 1 .
Scholars from different countries have determined the values of surface chloride ion concentration based on their respective national survey data. Val et al. [27], based on the inspection data of concrete structures on the coasts of Victoria and Tasmania in Australia, determined that the distribution of surface chloride ion concentration in the splash zone was described by a log-normal distribution, with a mean of 7.35 kg/m3 and a coefficient of variation of 0.7. Fluge et al. [28], based on the inspection data of 36 coastal bridges in Norway, considered that the C s mean value was 0.51% (of the concrete mass) at 0 m to 3 m above sea level, with a standard deviation of 0.23% (of the concrete mass). The European DuraCrete method [29] considered that the average value of C s was related to environmental conditions, the water–cement ratio of the concrete, and the type of cementitious materials, which could be represented as C s = A c · ( W / B ) , where W / B is the water–binder ratio, and for ordinary Portland cement in the splash zone, A c was 7.76% (of the cementitious material mass). In the American Life-365 [20] calculation program, the instantaneous value in the tidal splash zone C s was set to 0.8% (of the concrete mass). Li et al. [30] measured the statistical values of surface chloride ion concentration in concrete structures of Chinese docks and considered that they followed a log-normal distribution, with a mean of 0.27% (of the concrete mass) and a standard deviation of 0.04% (of the concrete mass). Stewart and Fluge [27,28] also suggested describing the distribution of C s using a log-normal distribution.

3.2. Updating of the Reinforcement Initial Corrosion Model

The updated chloride diffusion model calculates the limit state of initial corrosion durability at structure detection time t 0 :
G = C c r C ( x d , t 0 ) = C c r ε 1 C s [ 1 e r f ( x d / ( 2 D C l t 0 ) ) ]
According to the limit state equation of initial corrosion durability of steel bars, considering the probability distribution of concrete cover thickness and the prior critical chloride ion concentration model, the prior corrosion probability of reinforcement is calculated as follows:
p cor ( t 0 ) = Pr { G < 0 } = Pr { C c r ε 1 C s [ 1 e r f ( x d / ( 2 D C l t 0 ) ) ] < 0 } 0 < p cor ( t 0 ) < 1
The probabilistic model for critical chloride concentration is commonly used to assess the risk of reinforcement corrosion in concrete structures, taking into account the uncertainty and variability of chloride ion concentration. The critical chloride ion concentration values can vary depending on several factors, including the type of cement, the quality of concrete, the type of reinforcement, and the environmental conditions. Stewart MG [31] suggested that the value of C c r followed the normal distribution mean of 2.4 kg/m3 and the COV (coefficient of variation) of 0.2. Matsushima et al. [32] advised C c r as the mean of 3.07 kg/m3 and a COV (coefficient of variation) of 0.41. The Japanese Civil Society criteria [33] considered C c r with 0.3~2.4 kg/m3 when predicting the service life. For reinforced concrete with high durability requirements, the chloride ion mass of C c r does not exceed 0.3 kg/m3. It is a higher value of C c r than in laboratory conditions measured in the actual environment, with 1.2~2.4 kg/m3.
Bayesian updating is a statistical method based on Bayesian theory, used to update existing probability distributions or model parameters based on new evidence or data. Bayesian updating describes how to update the conditional probability of an event based on new evidence. The theorem can be expressed as follows:
P ( A | B ) = P ( A ) P ( B | A ) P ( B )
where P ( A | B ) is the probability of event A occurring given that event B has occurred, P ( B | A ) is the probability of event B occurring given that event A has occurred, P(A) is the prior probability of event A occurring, and P(B) is the total probability of event B occurring. In Bayesian updating, the prior distribution represents the estimation of the probability distribution of model parameters before obtaining new data, while the posterior distribution is the updated probability distribution of model parameters after considering the new data. The goal of Bayesian updating is to obtain a more accurate posterior distribution by combining the prior distribution with new data. The likelihood function is a key concept that represents the probability of observing new data given the model parameters. In Bayesian updating, the likelihood function is used to measure the fit between the new data and the model parameters.
Assuming that there are n samples of detected half-cell potential, m are corrosion samples. It is expressed as event H here. Then, the likelihood function of the rust probability can be expressed as follows:
l ( p cor | H ) = ( n m ) p cor m ( 1 p cor ) n m        
where ( n m ) refers to the number of combinations of m samples selected from n samples. According to Bayesian update theory, the posterior probability density function of corrosion probability is the following:
f ( p cor | H ) = l ( p cor | H ) f ( p cor ) p cor l ( p cor | H ) f ( p cor ) d p cor = p cor m ( 1 p cor ) n m f ( p cor ) p cor p cor m ( 1 p cor ) n m f ( p cor ) d p cor
where f ( p cor ) is the prior probability density function of the corrosion probability, which can be assumed to follow a normal distribution (truncation), Weibull distribution, or Beta distribution. The mean value μ p cor was calculated using Formula (14), and a coefficient of variation of 0.5 was assumed. Experiments have shown that the selection of prior distributions has little impact on the updated results. Considering that the Beta distribution has the characteristics of a conjugate prior distribution, it is recommended to use the Beta distribution for convenient calculation. In the case of the test result H, the mean value of the posterior probability density function of the corrosion probability f ( p cor | H ) was μ p cor . Using the posterior mean of the density function of corrosion probability, with the updated chloride diffusion model and the measured concrete cover thickness, the updated mean value (assuming constant of standard deviation) of C c r was calculated as follows:
μ C c r = { μ C c r : Pr [ C c r C ( x d , t 0 ) < 0 ] = μ p cor }
The above formula adopts the traversal algorithm, selects the mean of C c r in the effective interval, adopts the Monte Carlo simulation algorithm, and calculates the initial corrosion probability p cor ( t 0 ) of the steel bar at the time point t 0 . The mean of C c r consistent with the updated mean of the rust probability was selected and determined in the above equation μ C c r to complete the right updating of C c r . With the updating C c r , combined with the updated model of chloride ion diffusion and protective layer thickness probability distribution, Formula (19) was used to predict the initial corrosion probability of t ( t > t 0 ) years, the prediction results of the initial corrosion probability of future reinforcement with comprehensive theoretical knowledge and historical information of components. The updated method above essentially assumes that the corrosion probability of different components in the same structure is the same in a certain year. Subsequently, the updated initial corrosion time tini was calculated, providing the basis for the updating of the rust swelling and cracking model:
t i n i = x d 2 ( 4 D C l ) 1 [ e r f 1 ( 1 ( C c r ) / ε 1 C s ) ] 2
In the formula, an updated distribution model was used for each parameter, and the calculated initial corrosion time is a variable rather than a specific value.
In summary, the steps for updating the reinforcement initial corrosion model are as follows:
  • Calculate the mean value of the prior corrosion probability of reinforcement p cor ( t 0 ) using Formula (14) with the updated chloride diffusion model in Section 3.1. List the mean value of the prior probability μ P c o r ( t 0 ) and the coefficient of variation as 0.5.
  • In the case of the test result H (number of corrosion samples in a number of test samples), calculate the mean value and the standard deviation of the posterior probability density function of the corrosion probability f ( p cor | H ) as μ p cor ( t 0 ) and σ p cor ( t 0 ) using Formula (17).
  • Calculate the updated mean value (assuming constant of standard deviation) of C c r as μ C c r using Formula (18).
  • Calculate the updated initial corrosion time tini and the future corrosion probability in time t with the updated chloride diffusion model and the updated mean value (assuming constant of standard deviation) of C c r using Formulas (14) and (19).

4. Case Study

A concrete bridge (Figure 2) built in 2011 years and detected in 2023 years in Huizhou was taken as an example to explain the effectiveness of the method improved in this paper. The water-to-cement ratio is 0.55. The cement is ordinary silicate cement. The concrete strength is more than 30 MPa. With the test, the thickness of concrete cover c followed the normal distribution, with the statistical results shown in Table 1. The sample drilled powder concrete at different depths of 0–10 mm, 10–20 mm, 20–40 mm, 40–60 mm, and 60–80 mm, respectively. The chloride ion content in the concrete powder samples could be obtained by the potential titration method, as listed in Figure 3. The mean value of the calculated value of chloride ion content at different depths of 5 mm, 15 mm, 30 mm, 50 mm, and 70 mm were 0.171, 0016, 0.0001, 0, and 0 (% of the concrete mass) (plate); 0.126, 0.012, 0.0001, 0, and 0 (% of the concrete mass) (Beam); 0.222, 0.088, 0.020, 0.0001, and 0 (% of the concrete mass) (column in atmospheric area); 0.289, 0.114, 0.026, 0.0002, and 0 (% of the concrete mass) (column in water level change area); 0.435, 0.172, 0.039, 0.0003, and 0 (% of the concrete mass) (column in splash zone); and 0.702, 0.278, 0.063, 0.0005, and 0 (% of the concrete mass) (column in underwater area). Based on the layered detection of chloride ion concentration in the structure, it was determined that ε 1 followed a log-normal distribution, and the statistical results are shown in Table 2.
Due to the material characteristics of concrete, the test environment temperature and humidity, the diversity of test methods and the diversification of expression, the critical chloride ion concentration was highly discrete. The prior distribution of C c r value here was selected according to Stewart’s recommendations [31], with the conversion to follow the normal distribution mean of 0.1% of the concrete mass and a COV of 0.2.
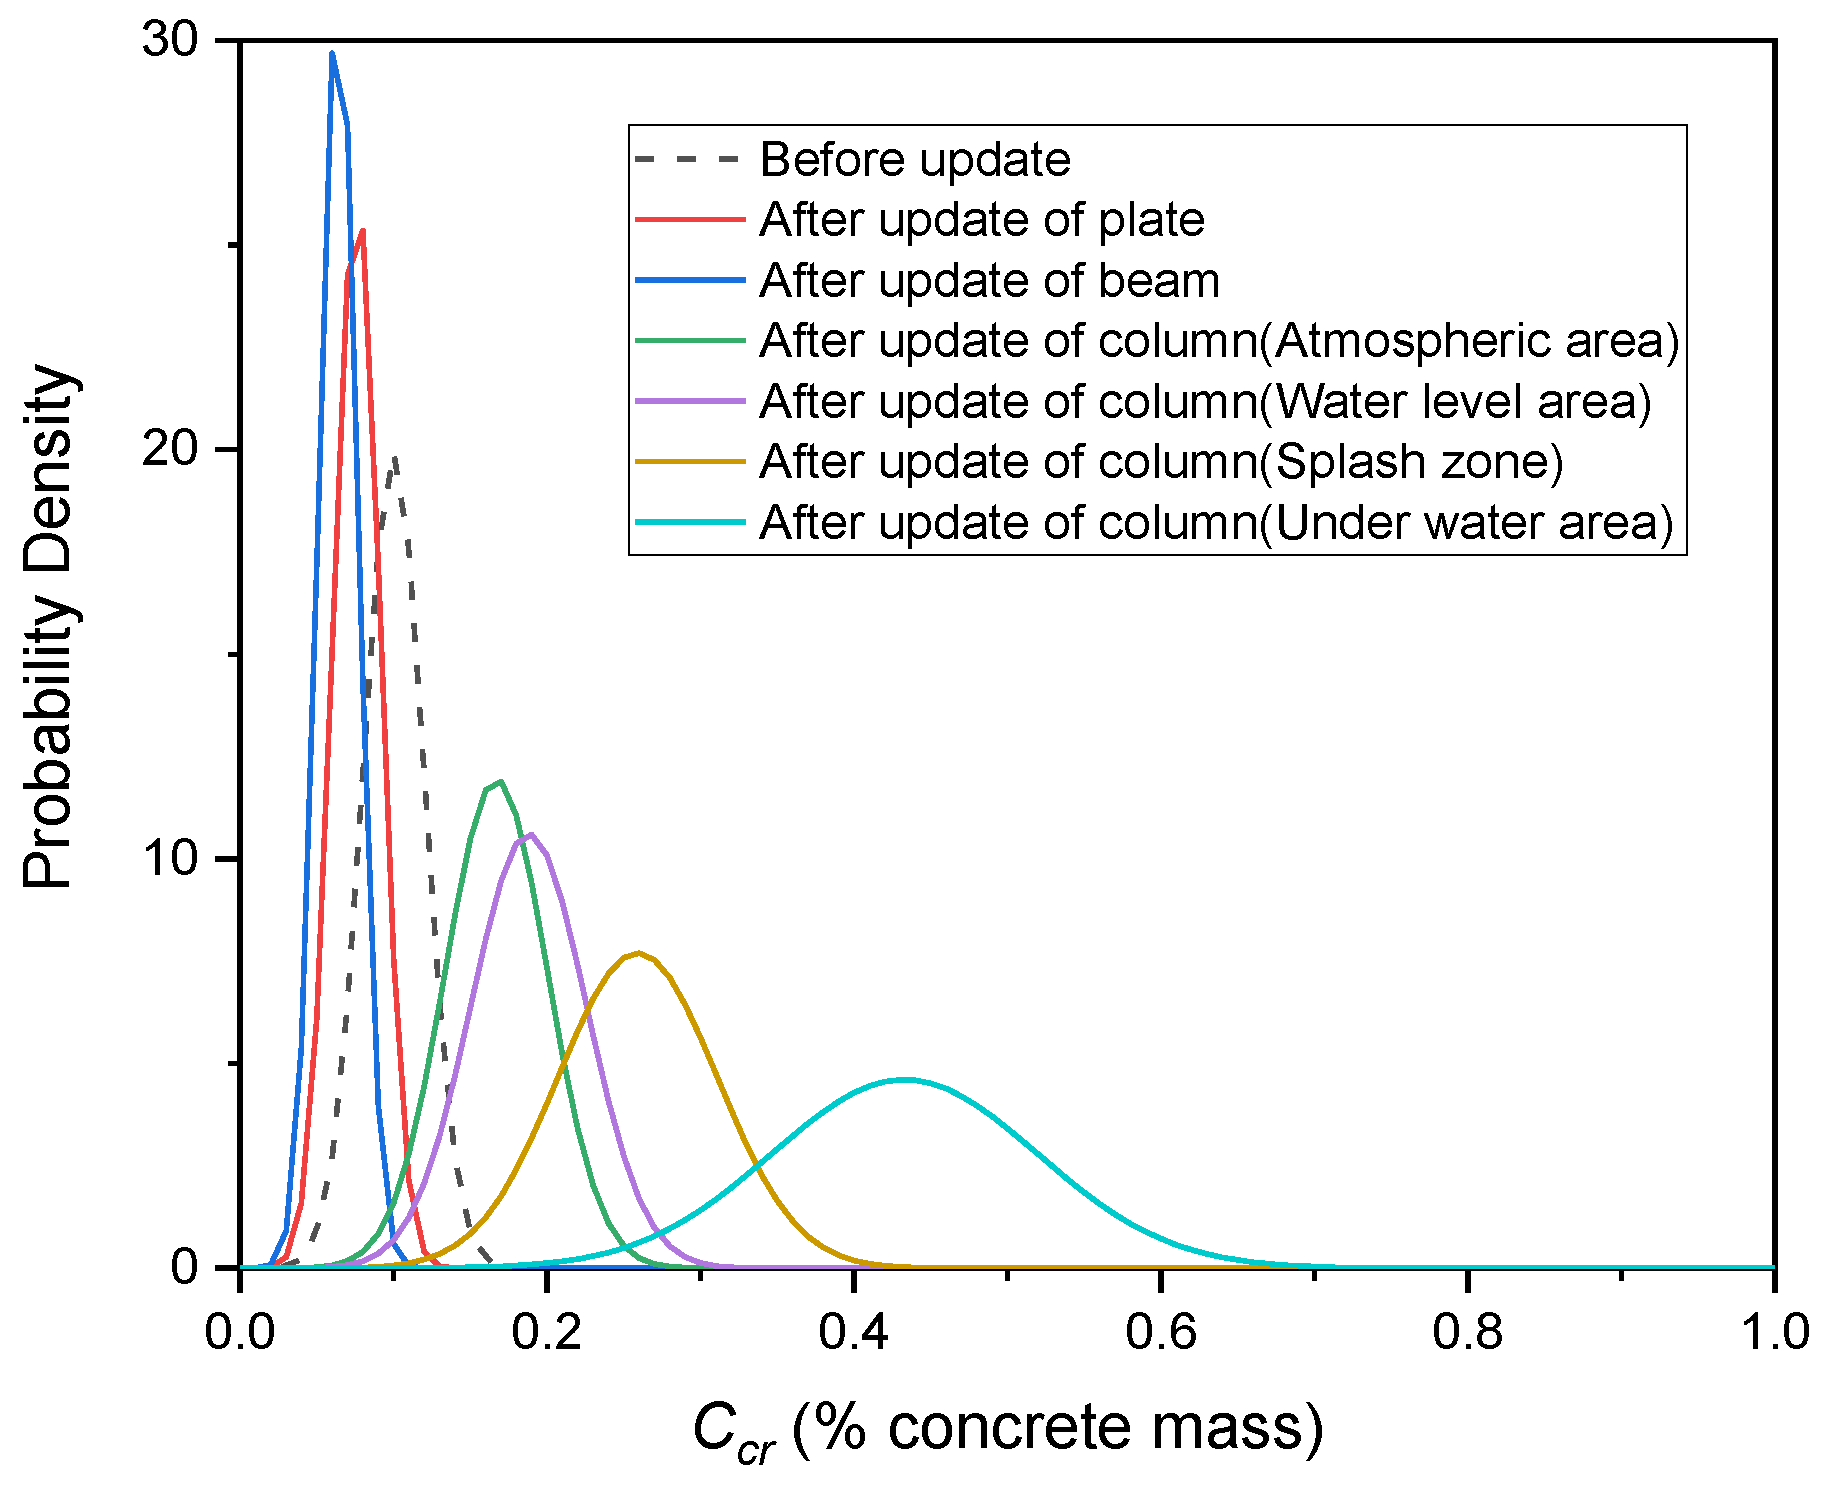
The mean of the prior corrosion probability of reinforcement μ P c o r ( t 0 ) using 12 years was calculated with Formula (14). The corrosion detection sample results are shown in Table 3. The test samples were selected for half-cell potential detected samples, and the corrosion samples were the HCP (half-cell potential) level (mV) < −350 mV samples. With the Formula (17), the mean value and the standard deviation of the posterior probability density function of the corrosion probability f ( p cor | H ) as μ p cor ( t 0 ) and σ P c o r ( t 0 ) were calculated. Then, the updated mean value of the critical chloride concentration μ C c r is listed in Table 3. According to Table 3, for different positions, the mean update result of the critical chloride ion was significantly different from the initial value of 0.1. The critical chloride ion concentrations before and after the update are shown in Figure 4. For different structural components with different inspection results, the critical chloride ion concentrations after the update varied greatly. For plates and beams, the updated critical chloride ion concentration was much lower than the theoretical value of 0.1, which was 0.076 and 0.064. For the column, the updated critical chloride ion concentration was about 1.67–4.33 times the theoretical value, indicating a significant updating effect. The traditional assessment method, which uses a consistent critical chloride ion concentration, can lead to significant assessment errors. The assessment results after the update are relatively accurate.
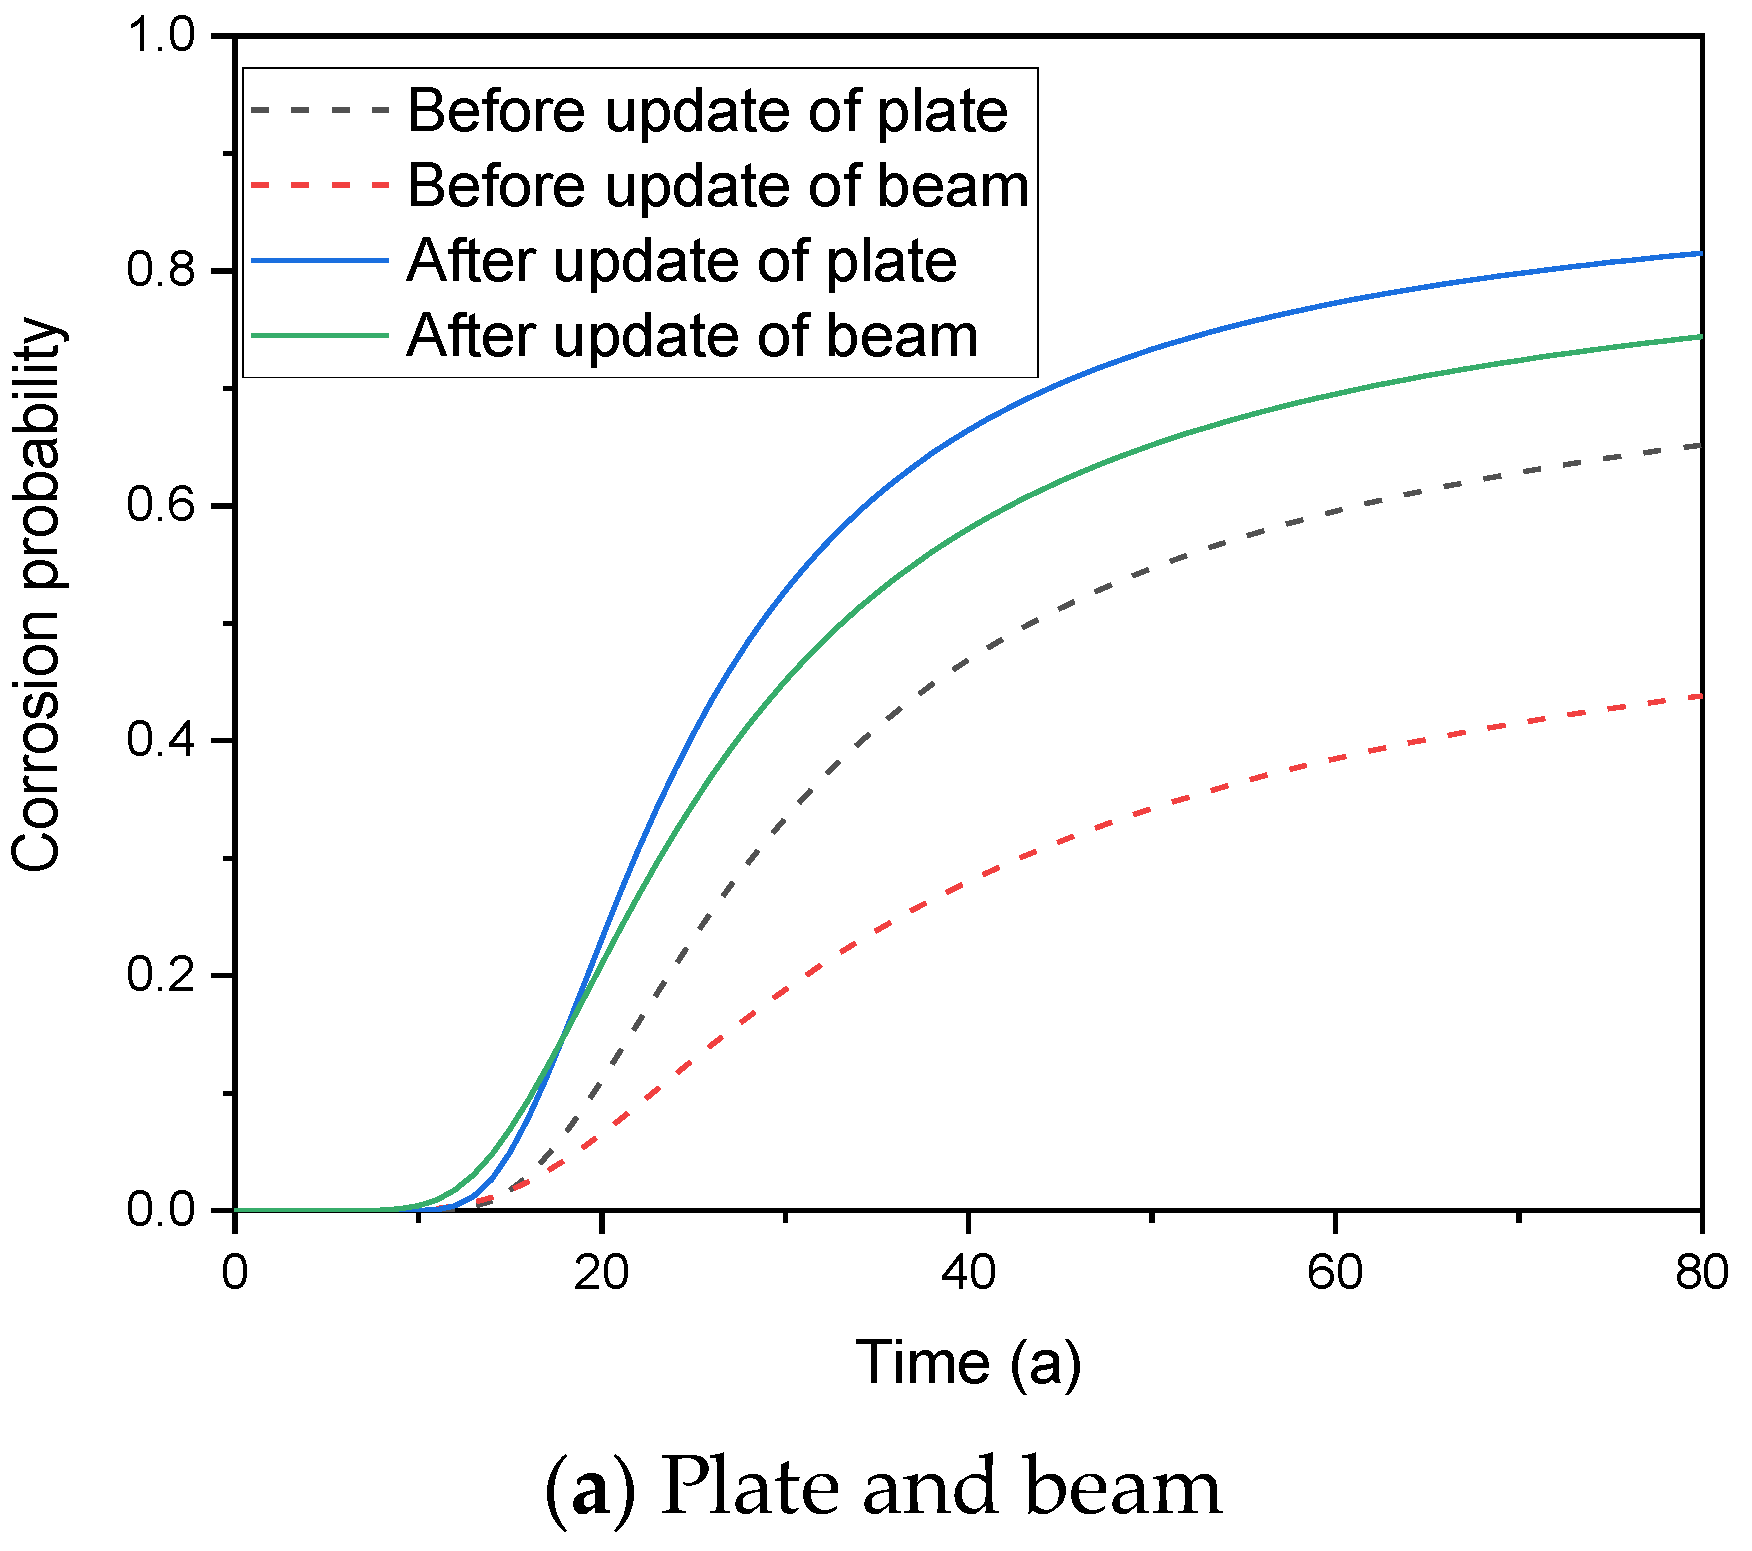
With the updated critical chloride concentration model, the corrosion probabilities are plotted in Figure 5. Figure 5 also provides the corrosion probabilities before updating (using actual concrete cover thickness, surface chloride ion concentration, and diffusion coefficient obtained through detection) for comparison. According to Figure 5, it can be seen that the corrosion probability in concrete structures calculated using the updated model differs significantly from the original theoretical model. The updating method of durability models based on actual detection results provided in this article is of great significance.

5. Conclusions

The corrosion of steel bars in concrete structures under a chloride environment is the main cause of structural damage. For important marine concrete structures, the durability of the structure is often evaluated based on the durability life criterion of concrete steel corrosion. The traditional evaluation method involves incorporating detection data into the theoretical model without updating the model in accordance with reality, resulting in inaccurate evaluation results. According to the detection information, the chloride diffusion model and the reinforcement initial corrosion model can be updated. This article proposes a complete method for updating the durability models of concrete structures based on the proportion of corrosion obtained through detection in order to reduce the evaluation error of durability and more accurately predict the remaining life of the structure.
This article discusses the updating methods based on the durability model of concrete structures in conventional chloride environments. Currently, there is no unified durability model at home and abroad. Further discussion is needed on whether the selection of models will affect the updating effect. At the same time, the updating efficiency of the methods in the article depends to a certain extent on the number of detection samples. The more samples there are, the more accurate the grasp of the actual situation of the component, and the higher the confidence in the detection information, the more obvious the updating effect. However, the number of samples is influenced by both actual testing conditions and economic factors. How to determine the optimal number of testing samples based on the actual structure is a problem that needs further consideration in engineering.

Author Contributions

Conceptualization and methodology, H.G.; Writing—review and editing, Z.M. All authors have read and agreed to the published version of the manuscript.

Funding

National Natural Science Foundation of China (NSFC) No. 51578315.

Institutional Review Board Statement

Not applicable.

Informed Consent Statement

Not applicable.

Data Availability Statement

The original contributions presented in the study are included in the article, further inquiries can be directed to the corresponding author.

Conflicts of Interest

The authors declare no conflict of interest.

References

  1. Alexander, M.; Beushausen, H. Durability, service life prediction, and modelling for reinforced concrete structures-review and critique. Cem. Concr. Res. 2019, 122, 17–29. [Google Scholar] [CrossRef]
  2. Maaddawy, T.E.; Soudki, K. A model for prediction of time from corrosion initiation to corrosion cracking. Cem. Concr. Compos. 2007, 29, 168–175. [Google Scholar] [CrossRef]
  3. Kim, A.V.; Stewart, M.G. Structural reliability of concrete bridges including improved chloride-induced corrosion models. Struct. Saf. 2000, 22, 313–333. [Google Scholar]
  4. Fakhri, H.; Fishman, K.L.; Ranade, R. Rapid determination of critical chloride content in cement-based composites. Constr. Build. Mater. 2020, 268, 121–148. [Google Scholar] [CrossRef]
  5. Guo, H.; Shi, C.; Guan, X.; Zhu, J.; Ding, Y.; Ling, T.C.; Zhang, H.; Wang, Y. Durability of recycled aggregate concrete-a review. Cem. Concr. Compos. 2018, 89, 251–259. [Google Scholar] [CrossRef]
  6. Nganga, G.; Alexander, M.; Beushausen, H. Practical implementation of the durability index performance-based design approach. Constr. Build. Mater. 2013, 45, 251–261. [Google Scholar] [CrossRef]
  7. Zhu, W.; François, R.; Fang, Q.; Zhang, D. Influence of long-term chloride diffusion in concrete and the resulting corrosion of reinforcement on the serviceability of RC beams. Cem. Concr. Compos. 2016, 71, 144–152. [Google Scholar] [CrossRef]
  8. Angst, U.; Ronnquist, A.; Elsener, B.; Larsen, C.K.; Vennesland, O. Probabilistic considerations on the effect of specimen size on the critical chloride content in reinforced concrete. Corros. Sci. 2011, 53, 177–187. [Google Scholar] [CrossRef]
  9. Ke Ler, S.; Fischer, J.; Straub, D.; Gehlen, C. Updating of service-life prediction of reinforced concrete structures with potential mapping. Cem. Concr. Compos. 2014, 47, 47–52. [Google Scholar] [CrossRef]
  10. Gu, H.; Li, Q. Updating deterioration models of reinforced concrete structures in carbonation environment using in-situ inspection data. Struct. Infrastruct. Eng. 2022, 18, 266–277. [Google Scholar] [CrossRef]
  11. Heitner, B.; OBrien, E.J.; Yalamas, T.; Schoefs, F.; Leahy, C.; Décatoire, R. Updating probabilities of bridge reinforcement corrosion using health monitoring data. Eng. Struct. 2019, 190, 41–51. [Google Scholar] [CrossRef]
  12. Suo, Q.; Stewart, M.G. Corrosion cracking prediction updating of deteriorating RC structures using inspection information. Reliab. Eng. Syst. Saf. 2009, 94, 1340–1348. [Google Scholar] [CrossRef]
  13. Xiao, X.; Wang, Z.; Li, Q.; Cao, M. Bayesian model updating based on structural reliability method: Case study for chloride-induced durability analysis. Eng. Mech. 2022, 39, 336–341. [Google Scholar] [CrossRef]
  14. Gu, H.; Li, Q.; Hou, G. Updating method for durability models of concrete structures in carbonation environment. Eng. Mech. 2021, 38, 113–121. [Google Scholar]
  15. Tuutti, K. Corrosion of Steel in Concrete; Report No. CBI Research 4; Swedish Cement and Concrete Research Institute: Stockholm, Sweden, 1982; p. 82. [Google Scholar]
  16. FIB. Model Code for Service Life Design; Fib Bulletin 34; FIB: Lausanne, Switzerland, 2006. [Google Scholar]
  17. Angst, U.M. Predicting the time to corrosion initiation in reinforced concrete structures exposed to chlorides. Cem. Concr. Res. 2019, 115, 559–567. [Google Scholar] [CrossRef]
  18. Cao, Y.; Gehlen, C.; Angst, U.; Wang, L.; Yao, Y. Critical chloride content in reinforced concrete-an updated review considering chinese experience. Cem. Concr. Res. 2019, 117, 58–68. [Google Scholar] [CrossRef]
  19. GB/T50010-2010; Code for Design of Concrete Structures. China Architecture & Building Press: Beijing, China, 2010.
  20. American Concrete Institute. ACI 318 Standard: Building Code Requirements for Structural Concrete; American Concrete Institute: Farmington Hills, MI, USA, 2020. [Google Scholar]
  21. American Concrete Institute. Life-365 Service Life Prediction Model TM Version 2.0; American Concrete Institute: Farmington Hills, MI, USA, 2009. [Google Scholar]
  22. Li, Q.; Li, K.; Zhou, X.; Zhang, Q.; Fan, Z. Model-based durability design of concrete structures in Hong Kong-Zhuhai-Macau sea link project. Struct. Saf. 2015, 53, 1–12. [Google Scholar] [CrossRef]
  23. GB/T 50344-2004; Technical Standards for Building Structure Testing. China Architecture & Building Press: Beijing, China, 2004.
  24. GB/T 50784-2013; Technical Standards for On-Site Testing of Concrete Structures. China Architecture & Building Press: Beijing, China, 2013.
  25. JGJ/T 23-2011; Technical Specification for Testing Compressive Strength of Concrete Using Rebound Method. China Architecture & Building Press: Beijing, China, 2011.
  26. JTJ/T272-99; Technical Specification for Non-Destructive Testing of Concrete in Port Engineering. China Architecture & Building Press: Beijing, China, 2016.
  27. Val, D.V.; Stewart, M.G. Life-cycle cost analysis of reinforced concrete structures in marine environments. Struct. Saf. 2003, 25, 343–362. [Google Scholar] [CrossRef]
  28. Fluge, F. Marine chlorides: A probabilistic approach to derive provisions for EN 206-1. In Proceedings of the 3rd Workshop on Service Life Design of Concrete Structures: From Theory to Standardisation, DuraNet. Troms¢: 47–68, Tromso, Norway, 10–12 July 2001. [Google Scholar]
  29. General Guidelines for Durability Design and Redesign: DuraCrete, Probabilistic Performance Based Durability Design of Concrete Structures; The European Union-Brite EuRam: Lyngby, Denmark, 2000.
  30. Li, Q.; Ye, X. Surface deterioration analysis for probabilistic durability design of RC structures in marine environment. Struct. Saf. 2018, 75, 13–23. [Google Scholar] [CrossRef]
  31. Stewart, M.G. Spatial and time-dependent reliability modelling of corrosion damage, safety and maintenance for reinforced concrete structures. Struct. Infrastruct. Eng. 2012, 8, 607–619. [Google Scholar] [CrossRef]
  32. Matsushima, M.; Tsutsumi, T.; Seki, H.; Matsui, K. Optimum thickness of concrete cover of RC structure based on reliability theory. Concr. Libr. JSCE 1995, 25, 45–57. [Google Scholar] [CrossRef]
  33. Horiguchi, K.; Yamaguchi, T.; Maruya, T.; Takewaka, K. Study on the Method of Measuring the Chloride Threshold Value of Corrosion and Estimation of the Values in Durability Design of Concrete Structures. J. Adv. Concr. Technol. 2020, 18, 571–587. [Google Scholar] [CrossRef]
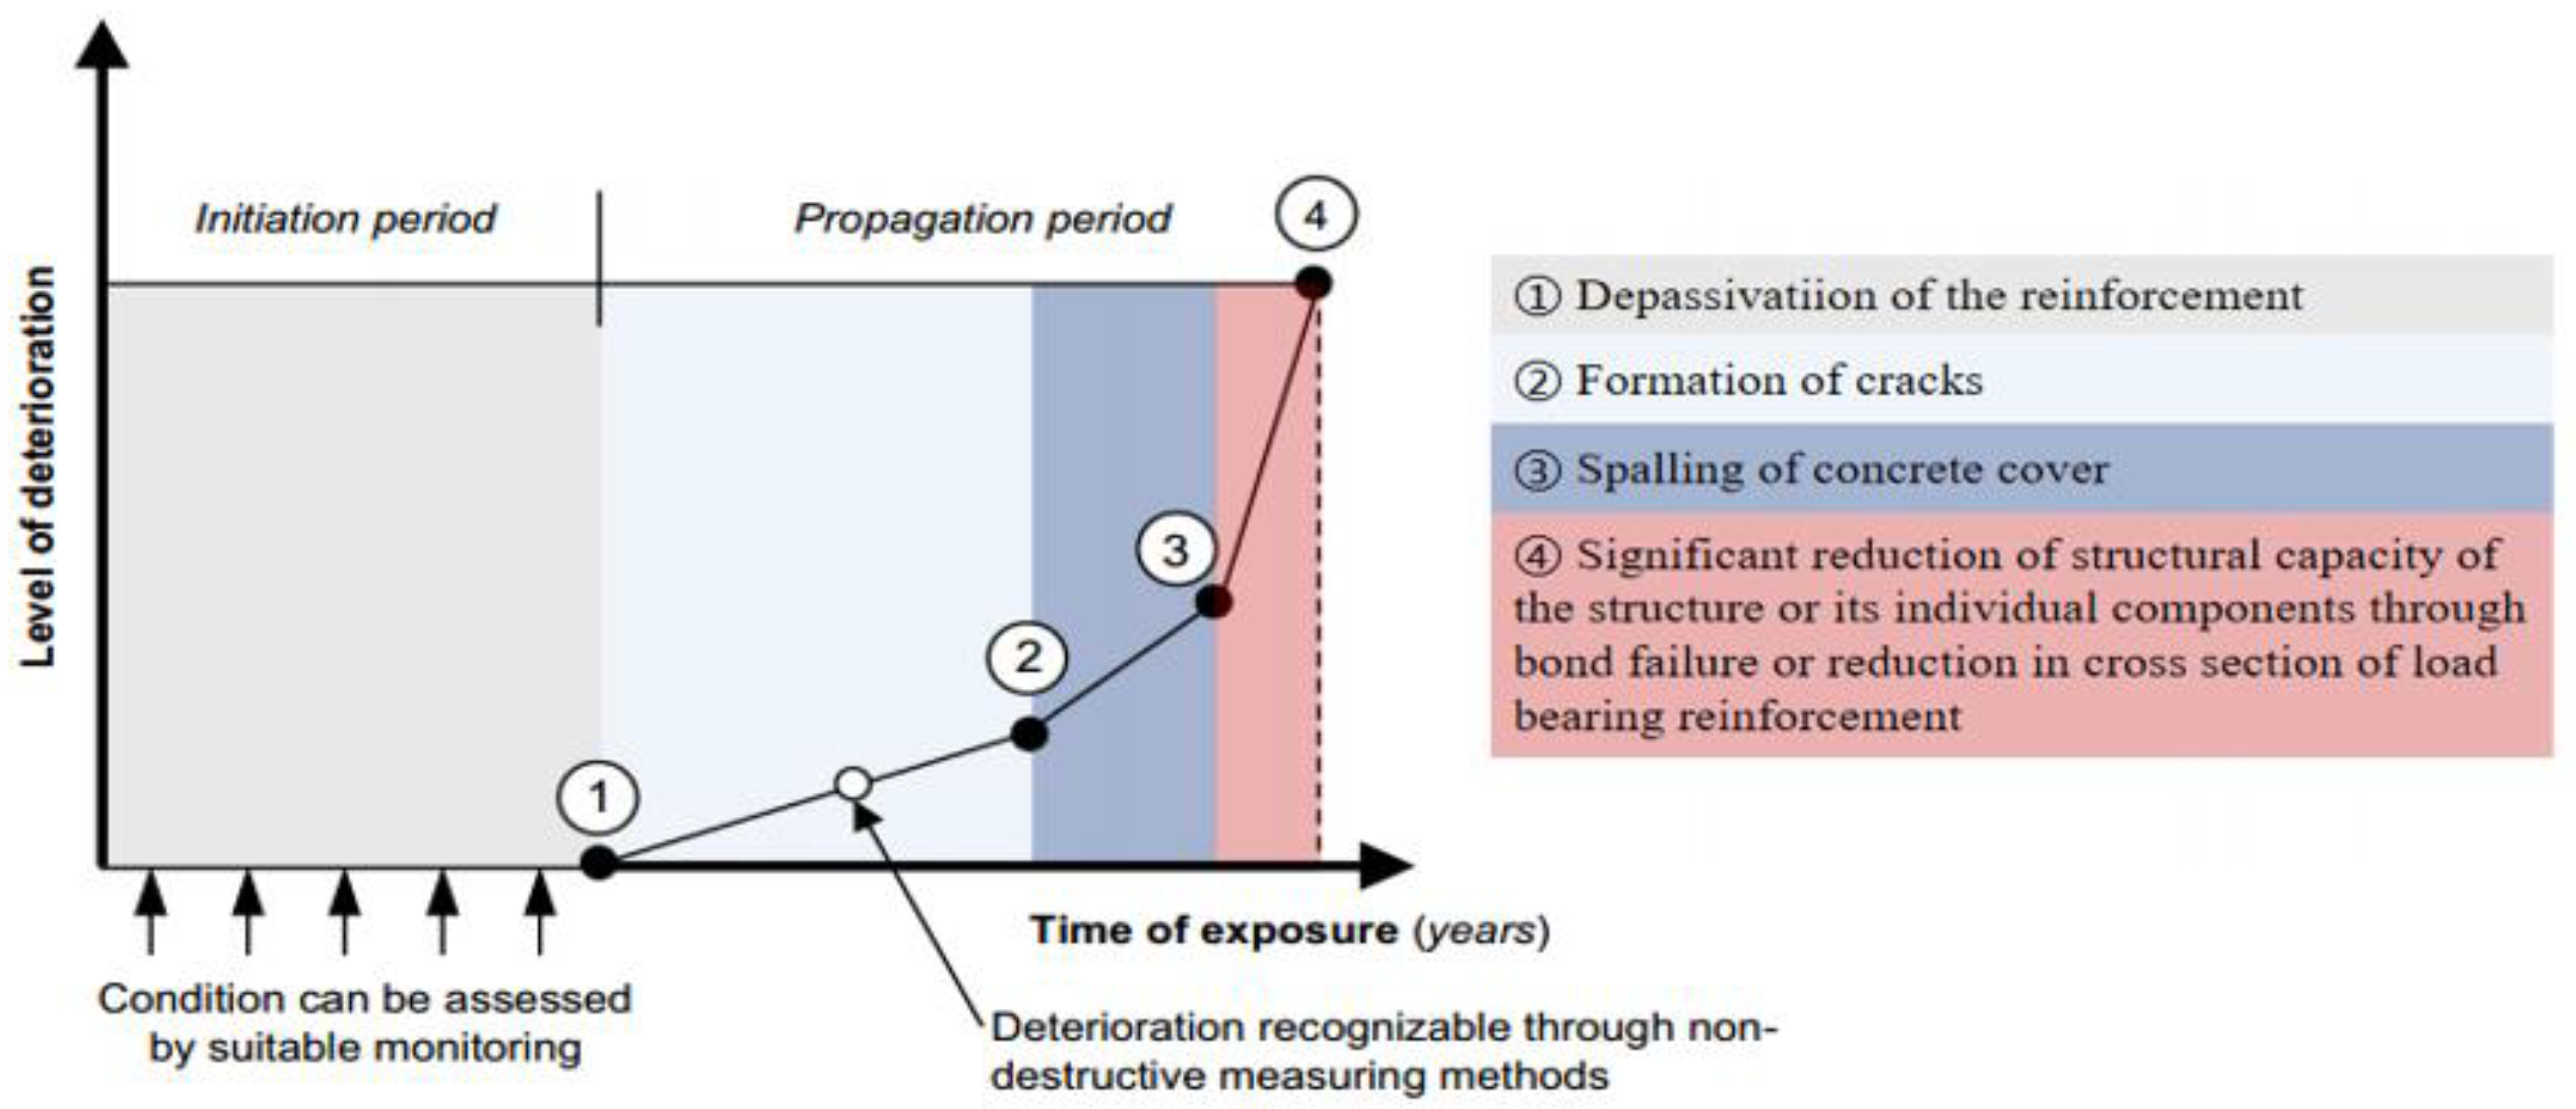
Figure 1. The deterioration process of reinforcement corrosion [1].
Applsci 14 04516 g001
Figure 2. Concrete bridge as an example of a concrete structure in a chlorine environment.
Applsci 14 04516 g002
Figure 3. The test chloride contents with different depths in 12 service years.
Applsci 14 04516 g003
Figure 4. The critical chloride ion concentrations before and after the update.
Applsci 14 04516 g004
Figure 5. The corrosion probabilities before and after the update.
Applsci 14 04516 g005aApplsci 14 04516 g005b
Table 1. Statistical results of the concrete cover thickness.
ProjectPlateBeamColumn
Mean/mm41.139.7556.5
Standard Deviation/mm0.824.374.52
Coefficient of Variation0.020.110.08
Table 2. The statistical results with detection information.
PositionService Years/aSurface Chloride Ion Concentration C s /% of the Concrete MassDiffusion Coefficient D C l /10−8 cm2.s−1Mean Value of ε 1 Standard Deviation of ε 1
Plate120.06701.49092.54591.8535
Beam0.0494
Column (Atmospheric area)120.16245.76751.36880.1648
Column (Water level change area)0.2101
Column (Splash zone)0.3178
Column (Underwater area)0.5129
Table 3. The prior and posterior probability parameters with the updated process.
Position μ P c o r ( t 0 ) Number of Test SamplesNumber of Corrosion Samples μ P c o r ( t 0 ) σ P c o r ( t 0 ) μ C c r
Plate0.001148120.00420.00100.076
Beam0.004048150.01800.00410.064
Column (Atmospheric area)0.69353060.21230.07260.167
Column (Water level change area)0.882930100.32460.08470.188
Column (splash zone)0.989730130.41500.08990.259
Column (Underwater area)0.999930120.37930.08860.433
Disclaimer/Publisher’s Note: The statements, opinions and data contained in all publications are solely those of the individual author(s) and contributor(s) and not of MDPI and/or the editor(s). MDPI and/or the editor(s) disclaim responsibility for any injury to people or property resulting from any ideas, methods, instructions or products referred to in the content.