Article

Progressive Damage Simulation of Wood Veneer Laminates and Their Uncertainty Using Finite Element Analysis Informed by Genetic Algorithms

1
School of Engineering, Faculty of Science Engineering and Built Environment, Deakin University, Geelong, VIC 3216, Australia
2
Department of Mechanical Engineering, University of Alberta, Edmonton, AB T6G 1H9, Canada
3
Institute of Vehicle Concepts, German Aerospace Center (DLR), 70569 Stuttgart, Germany
*
Author to whom correspondence should be addressed.
Appl. Sci. 2024, 14(11), 4511; https://doi.org/10.3390/app14114511
Submission received: 26 April 2024 / Revised: 23 May 2024 / Accepted: 23 May 2024 / Published: 24 May 2024
(This article belongs to the Special Issue Recent Advances in Fatigue and Fracture of Engineering Materials)

Abstract

:
Within the search for alternative sustainable materials for future transport applications, wood veneer laminates are promising, cost-effective candidates. Finite element simulations of progressive damage are needed to ensure the safe and reliable use of wood veneers while exploring their full potential. In this study, highly efficient finite element models simulate the mechanical response of quasi-isotropic [ 90 / 45 / 0 / 45 ] s beech veneer laminates subjected to compact tension and a range of open-hole tension tests. Genetic algorithms (GA) were coupled with these simulations to calibrate the optimal input parameters and to account for the inherent uncertainties in the mechanical properties of wooden materials. The results show that the continuum damage mechanistic simulations can efficiently estimate progressive damage both qualitatively and quantitatively with errors of less than 4%. Variability can be assessedthrough the relatively limited number of 400 finite element simulations as compared to more data-intensive algorithms utilised for uncertainty quantification.

1. Introduction

To advance the aim of mitigating greenhouse gas emissions, the utilisation of wood-based materials will contribute significantly due to wood’s ability to store carbon. In the context of transportation, particularly electromobility, sustainability has become increasingly important in the last decade [1]. To minimise the CO2 footprint of electromobility structures over their entire life cycle, attention is being directed towards sustainable materials such as wood. Opposed to state-of-the-art lightweight materials such as aluminium or fibre reinforced plastics, wood has a significantly lower carbon footprint. This reduces greenhouse gas emissions on the material level prior to production. Furthermore, lightweight construction holds significant importance in cutting down on in-service energy requirements. Wood, with its favourable combination of low density and good mechanical properties, presents a promising candidate for the use as a sustainable lightweight material in vehicle construction. Given the present reliance on simulation in the development of vehicle structures, it is essential to establish efficient simulation techniques for the safe and reliable design of thin wooden structures as a sustainable alternative in transport applications [1].
Over the past three decades, various engineered wood products, such as glue-laminated timber and cross-laminated timber, have gained widespread acceptance. Since these products require up to 45 mm thick boards, thinner alternatives in the form of laminated veneer lumber have been explored [2]. Recently, the integration of thin wooden panels into automotive door panels has been studied. Kaese et al. [3] and Heyner et al. [4] studied veneers in multi-material systems for future vehicle structures in the publicly funded project “For(s)tschritt” by the German federal ministry of economic affairs [1]. The study contained the development of a hybrid wood-steel structural component subjected to crash loads. A laminated veneer lumber beam, hybridised with thin steel strips, was shown to compensate the low elongation at fracture and ensure the structural integrity. Although the wood–steel hybrid beams showed high energy absorption and stable failure in the wooden component, they were not able to achieve the maximum deformation and exceeded the target weight as opposed to conventional steel beams used in current vehicle doors. Therefore, further optimisation is required to make wood-based materials a viable option for sustainable vehicle structures. This motivates the work presented in this paper, aiming to explore highly efficient simulations to design and certify future sustainable structures made from wood.
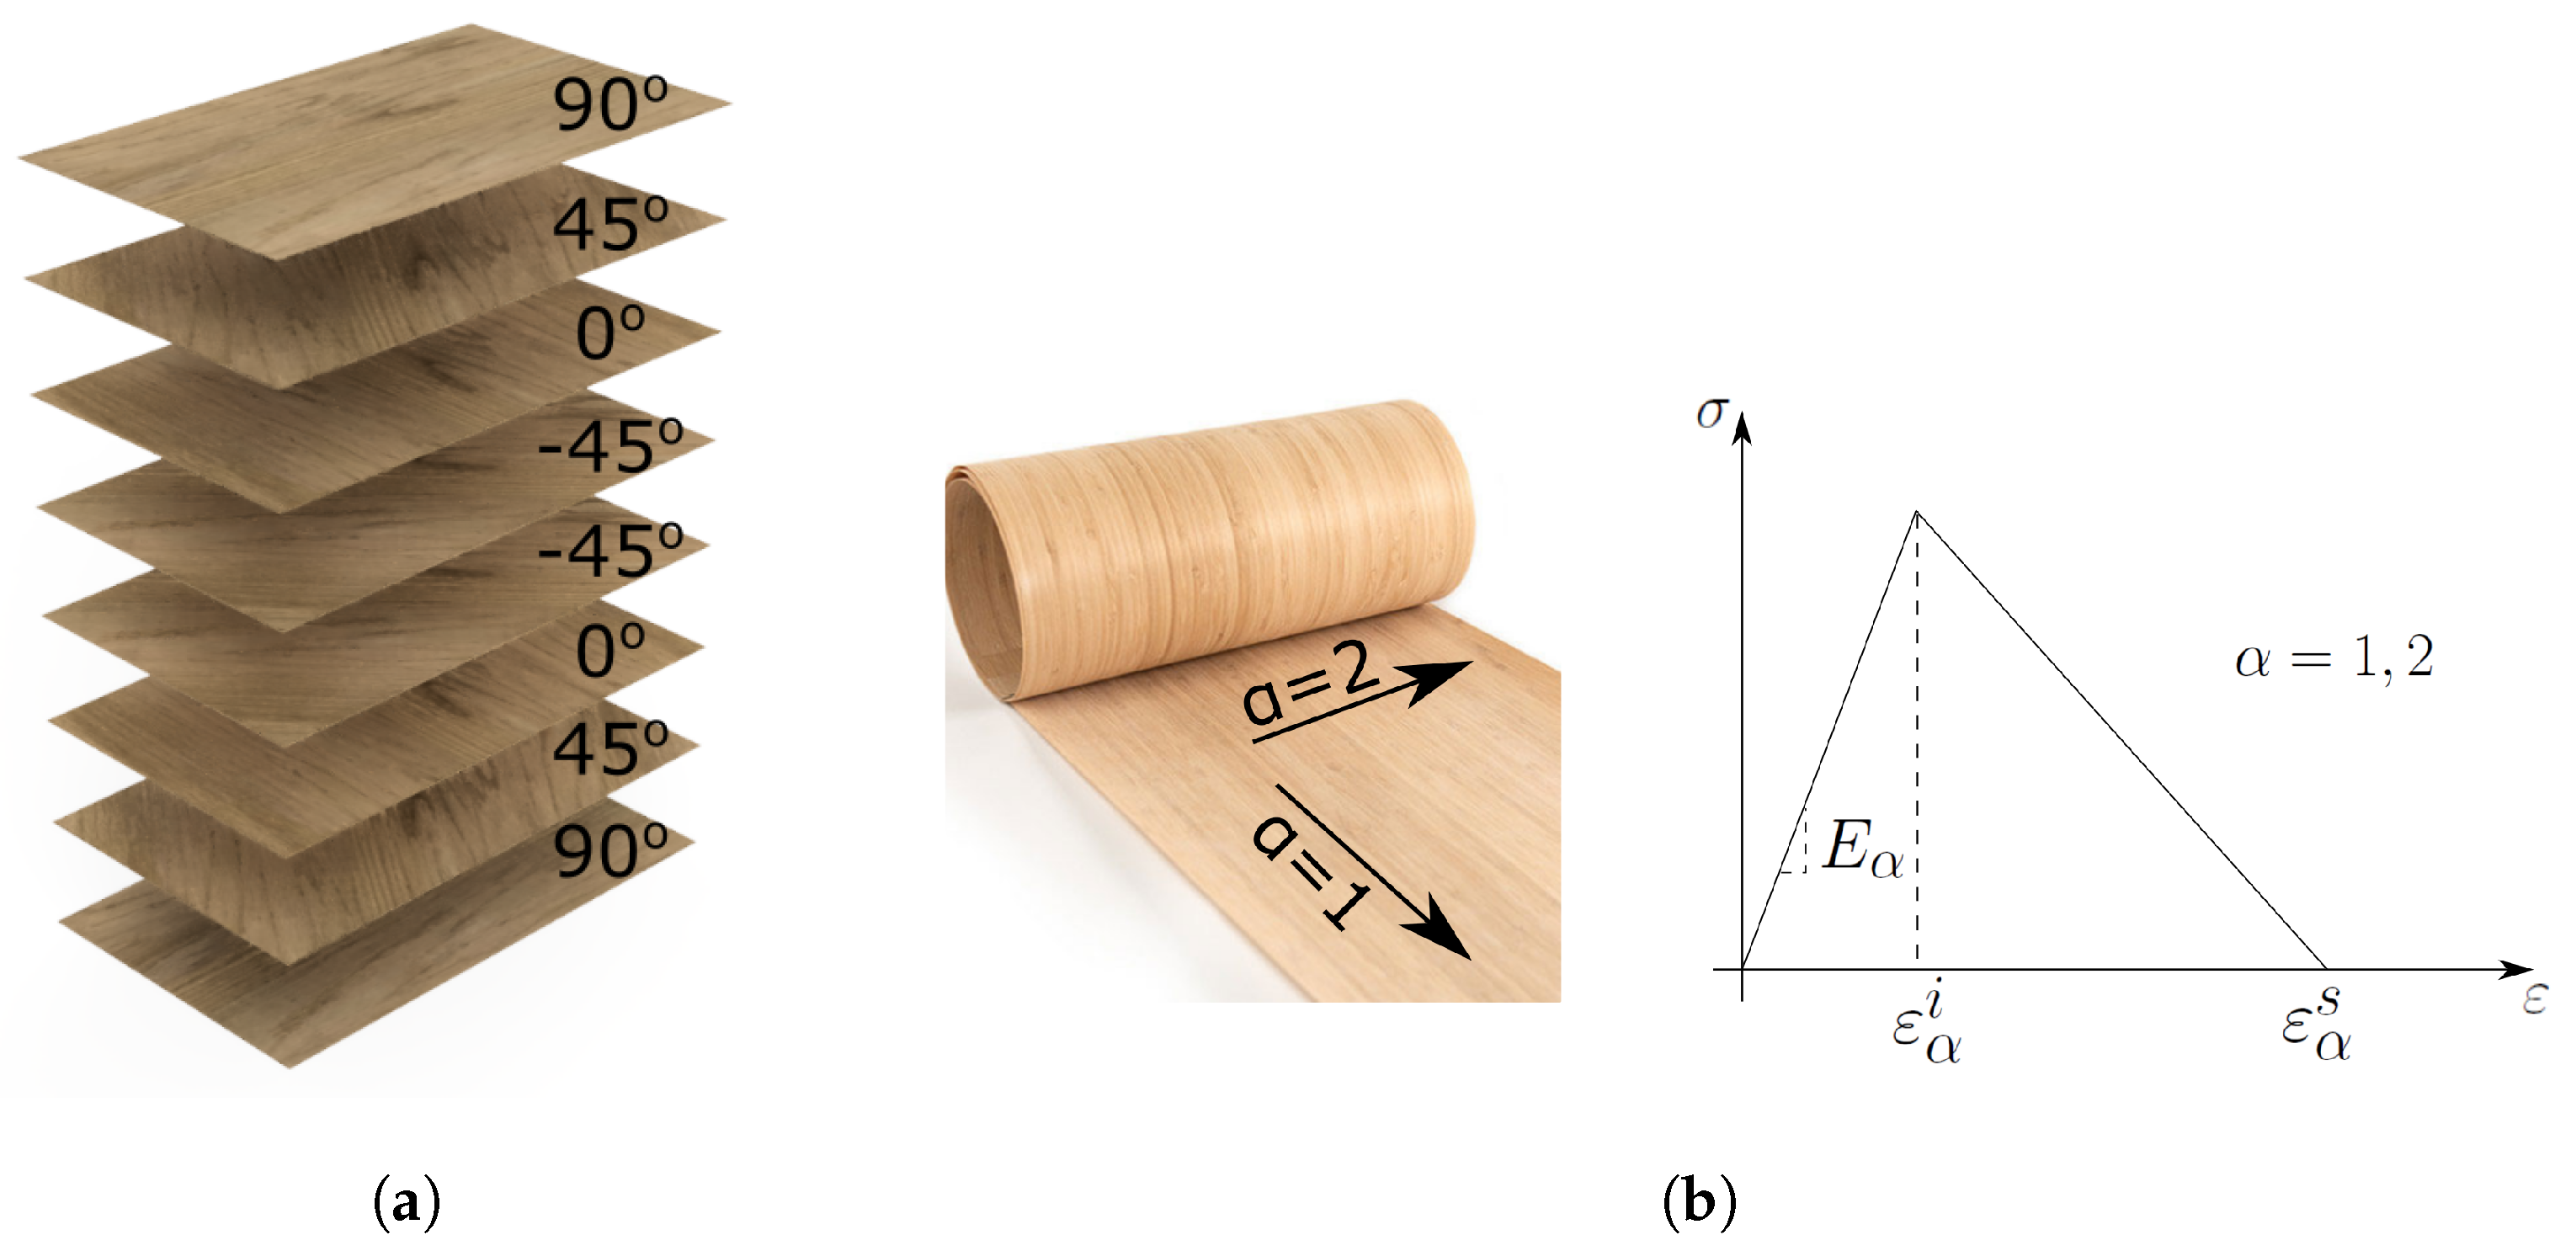
It has been found that well-established mechanical tests developed for fibre-reinforced polymers (FRPs) can also be applied to thin wood veneer laminates [5], particularly when subjected to tensile loads [6]. The results of standard tensile, compact tension, and open-hole tension tests indicate that it is possible to characterise the elastic and strength properties, as well as the damage resistance, of these materials. As the mechanical behaviours of FRPs and wood veneer laminates under tensile loads are comparable, these experimental findings motivate the present study to adopt efficient finite element (FE) simulation methods from FRPs to thin wooden materials.
Finite element analysis (FEA) of progressive damage can be broadly categorised into discrete or continuous methods. Discrete approaches directly integrate fracture into the FE formulation. The cohesive zone model (CZM), a fracture energy-based approach, is the most commonly utilised discrete tool in FEA and is typically available in most commercial FE software packages. To eliminate the need for prior knowledge of crack paths in CZM, more advanced enrichment techniques based on the partition of unity have been developed for mesh-independent modelling of arbitrary fractures [7,8]. Although discrete techniques enable the precise modelling of cracks, they also lead to increased computational cost and complexity.
Continuum damage models preserve the FE mesh continuity by decreasing local stiffness to account for damage in a distributed manner. Continuum damage mechanics (CDM) takes into account progressive degradation, where the loss of stiffness can be attributed to a series of microcracks. Early CDM-based simulations of FRPs were conducted in the 1990s [9,10]. Due to its ease of implementation and computational efficiency, CDM has become a popular framework for simulating progressive damage in FRPs, such as in axial crushing [11], impact analysis [12], compression after impact tests [13], bi-axial load cases [14], and the prediction of fibre kinking [15].
Compared to studies on FRPs, research on wood and wood-based materials using numerical methods is relatively scarce. Although several 3D constitutive CDM-based material models have been developed (e.g., [16,17,18,19,20]), many of these models are implemented in user-defined subroutines, which limits their general use. In addition, 3D material models typically require a large number of input parameters, and hence a comprehensive calibration procedure is needed [16]. Rahman et al. [21] investigated built-in CDM-based material models in the commercial FE software LS-DYNA and found that most FRP models are applicable to wood when considering ply-based input parameters.
Irrespective of the applied material model, it is important to consider how to obtain the corresponding FE input data, particularly when simulating progressive damage where some parameters cannot be measured in isolated experimental tests. When computationally efficient FE models are considered, data-driven calibration techniques have shown significant potential in providing a transparent and objective means of determining optimal input parameters. Examples include the use of machine learning methods [22,23] and the application of genetic algorithms (GA) [24,25].
This paper presents a ply-based material model in combination with a GA-based calibration procedure for the efficient FE simulation of progressive damage in thin wood laminates, including the consideration of uncertainty. Section 2 describes the material model and its incorporation into an efficient FEA in the commercial software LS-DYNA. The input parameters are calibrated in Section 3 by means of a data-driven calibration algorithm. Section 4 validates the FE framework against experimental results obtained from a range of open-hole tension tests. The benefits and limitations are discussed in Section 6 before concluding remarks in Section 7.

2. Material and Modelling

2.1. Material

Sliced European beech (Fagus sylvatica) veneers (supplied by Metz & Co, Stuttgart, Germany) with a thickness of 0.6 mm and density of 720 kg/m3 are stacked up in a quasi-isotropic [ 90 / 45 / 0 / 45 ] s layup resulting in a laminate thickness of approximately 3.8 mm due to compaction, see Figure 1a. Details about the manufacturing process can be found in [6]. In short, the beech veneers were adhesively bonded with PURBOND HB S309. After stacking up the veneers, a uniform pressure of 1 MPa for 20 h was applied to the stack. Mechanical tensile tests of the quasi-isotropic laminates resulted in a measurement of the laminate modulus E of 5.5 GPa (7.3% cv) and a laminate strength X of 70.90 MPa (7.3% cv) [6].

2.2. Material Model: CODAM2

To describe the mechanical behaviour of the [ 90 / 45 / 0 / 45 ] s beech veneer laminates, the strain-based COMposite DAMage Model (CODAM2) was applied, which is incorporated as MAT219 in the commercial FE software LS-DYNA [26]. In the following, the governing equations of this material model are presented. More details can be found in related literature [27,28,29].
Figure 1b illustrates a general stress–strain curve to describe progressive damage in the two principal axes in the grain direction ( α = 1 ) and perpendicular ( α = 2 ) to it. Strains are evaluated in each ply of the laminate. Hence, ply-based damage is formulated in terms of equivalent strain functions. The longitudinal (associated with the fibre or grain) equivalent strain ε 1 eq is taken to be equal to the magnitude of the longitudinal normal strain ε 11
ε 1 eq = ε 11 .
The transverse (matrix) equivalent strain ε 2 eq considers transverse tensile ε 22 and shear strains γ 12 such that
ε 2 eq = sign ε 22 ε 22 2 + γ 12 2 2 .
The sign of the transverse normal strain ε 22 is used to determine compressive (negative) or tensile (positive) loadings in the transverse direction. Here, only tensile load cases are considered.
The damage variables ω α in the longitudinal α = 1 and transverse α = 2 directions are defined in terms of damage initiation strain ε α i and damage saturation strain ε α s such that
ω α = ε α eq ε α i ε α s ε α i ε α s ε α eq for ε α eq ε α i > 0 .
A damage variable 0 < ω α < 1 indicates partial damage while ω α = 1 denotes fully saturated damage.
The parameters for the damage initiation and saturation strains, ε α i and ε α s , are crucial in modelling progressive fracture. The fracture energy of each ply G α f can be related to the damage saturation strains ε α s and ply strength X α by
ε α s = 2 G α f X α l * .
Note that the fracture energy G α f in CDM is typically distributed over the volume of a finite element by considering a characteristic element length l * according to Bazant’s crack band scaling law [30]. This characteristic length plays an important role when different element sizes are considered.
CODAM2 is capable of describing laminate behaviour using only one through-thickness integration point, which is particularly advantageous when dealing with [ 90 / 45 / 0 / 45 ] s beech laminates. This feature makes CODAM2 a much more efficient material model compared to other CDM-based models that require assigning ply-based material properties to multiple integration points through the thickness to describe laminates with various ply angles. The enhanced efficiency of CODAM2 also allows for its integration with data-driven calibration methods, such as genetic algorithms, as discussed in Section 3.

2.3. Finite Element Modelling

The CODAM2 material model presented in previous section is applied to simulate progressive damage in compact tension (CT) and open-hole tension (OHT) tests shown in Figure 2 and Figure 3, respectively. The FE simulation of the CT tests serves as calibration to determine an optimal set of material input parameters where details are presented in Section 3. Furthermore, the simulation of OHT tests in Figure 3 will validate the calibrated properties in Section 4.
Each FE model features a mesh that incorporates only one shell element through its thickness. In the expected fracture process zone of CT and OHT models, the in-plane element size measures 1 mm × 1 mm. In cases where alternative element sizes are utilised, Bazant’s crack-band scaling [30], as detailed in Equation (4), can be used to adjust the damage properties to ensure that the fracture energy of the material remains constant, regardless of the finite element size.
For the simulation of CT tests, a displacement is prescribed to the rigid loading pins (grey) in opposite vertical directions shown in Figure 2. The simulation of OHT tests uses fully constrained nodes at one edge of the test sample in Figure 3 while a prescribed displacement is applied to the opposite edge. Multiple OHT geometries with varying hole diameters D will be virtually assessed as part of the validation in Section 4.
The modelling of the quasi-isotropic [ 90 / 45 / 0 / 45 ] s beech veneer laminates consisting of only one through-thickness shell element leads to highly efficient computation times. The simulations of the CT and OHT tests only take 2–3 min and 1–2 min, respectively, on a conventional computer with four CPUs. Note that this is faster than the corresponding physical tests.

3. Calibration: Compact Tension Testing

Identifying the damage input parameters in CODAM2 to simulate progressive damage in the quasi-isotropic [ 90 / 45 / 0 / 45 ] s wood veneer laminates is among the objectives previously outlined. The elastic properties are not subject to calibration. Instead, these values were extracted from literature [1] as listed in Table 1.

3.1. Genetic Algorithm

The objective here is to identify a specific set of input parameters for simulations that can accurately replicate the results observed in corresponding physical experiments. In a simulation model, the input parameters affecting numerical results are denoted as design variables x = [ x 1 , x 2 , , x n ] T where x is the vector of n design variables, x 1 , x 2 , , x n . The mean squared error (MSE) between the experimental and simulation outcomes can be used to determine the extent to which simulations can replicate experimental measurements accurately. The ordinate-based MSE given by
f MSE ( x ) = 1 P p = 1 P f p num ( x ) G p exp 2
evaluates P number of points to compare numerical results f p num ( x ) with target experimental measurements G p exp .
In order to identify the most suitable input parameters, the following optimisation problem is formulated aiming at minimising the MSE value related to Equation (5). The general optimisation problem with (in)equality constraints is expressed by
min f MSE ( x ) subject to L x U g m ( x ) = 0 , m Ξ g m ( x ) 0 , m ζ
where L and U are the lower and upper bounds of the design variables x , respectively; Ξ and ζ are sets of indices for equality and inequality constraints, respectively; and g m ( x ) represent constraint functions.
The optimisation software LS-OPT [31] is employed to perform data-driven calibration of the CODAM2 material parameters. The direct coupling of LS-OPT to CODAM2 simulations enables the determination of the most suitable design variables (input parameters) by solving the optimisation problem described in Equation (6) in conjunction with experimentally measured load vs. displacement data obtained from CT tests [6]. To solve the optimisation problem, a genetic algorithm (GA) is selected, a metaheuristic inspired by the process of natural selection [31]. In GA, selection, crossover, and mutation are the primary genetic operators utilised to achieve optimisation. For more specific details about GA parameters and implementation, please refer to [24].
As visualised in the stress–strain curve in Figure 1, the CODAM2 material model requires a total of four input parameters related to damage initiation and progression in the two principal directions: two damage initiation strains ε 1 i and ε 2 i and two damage saturation strains ε 1 s and ε 2 s in the direction of the grains and perpendicular to it, respectively. Therefore, the design variables [ x 1 , x 2 , x 3 , x 4 ] T in GA are defined as x = [ ε 1 i , ε 2 i , ε 1 s , ε 2 s ] T .
The lower L and upper bounds U are set as follows:
  • 0.0001 ≤ ε 1 i ≤ 0.15,
  • 0.0001 ≤ ε 2 i ≤ 0.15,
  • 0.001 ≤ ε 1 s ≤ 0.3,
  • 0.001 ≤ ε 2 s ≤ 0.3,
enforcing that ε α s > ε α i for α = 1 , 2 .
The constraint functions g m ( x ) can ensure that the optimisation process yields physically meaningful parameters [25]. Here, the two following constraint functions are applied:
  • g 1 ( x ) > 0 with g 1 ( x ) = 200 E 1 ε 1 i so that the strength in grain direction is less than 200 MPa based on experimentally measured strength of 100 MPa [1].
  • g 2 ( x ) > 0 with g 2 ( x ) = 20 E 2 ε 2 i to ensure that the maximum strength perpendicular to the grain is 20 MPa. Experiments yield equivalent strength values of 8 MPa [1].

3.2. Calibration Results

Figure 4 shows the evolution of the MSE (errors in load vs. displacement graphs between experiments and simulations) according to Equation (5). The optimisation algorithm converges after 17 generations. Considering the evaluation of 24 FE simulations in each generation, the optimisation process results in a total of 17 × 24 = 408 FE simulations. Note that the simulations within one generation can be computed in parallel.
To further illustrate the optimisation process, Figure 5 compares the force vs. displacement data from experiments [6] to the best simulation results obtained from different generations during the execution of the GA optimisation. It can be seen that the simulation results successively approach the target curves from experiments, minimising the MSE until convergence is achieved in the 17th generation. The input parameters associated with the optimal results in the last generation are listed in Table 2.
In order to ensure that the parameters yield physically meaningful results, it is important to compare the simulated damage evolution with experimental measurements. Figure 6 compares measurements of the crack length Δ a from the initial notch at approximately 1.5 mm displacement during simulated CT tests with the corresponding experimental data [6]. The FE simulation shows damage in the 0° ply of the [ 90 / 45 / 0 / 45 ] s laminates in vertical loading direction, indicated by the white lines in the top right corner of the FE contour plot. It can be seen that FE simulation with the optimal damage input parameters can reproduce the extent of damage observed in experiments. Note that Figure 6 shows that damage grows along a single row of elements. This is typically seen in local CDM analyses and will be discussed in detail in later sections.
With confidence in the FE modelling and the associated optimal damage input parameters obtained from GA, a range of OHT tests will be simulated to investigate how these parameters can predict tension tests other than CT.

4. Validation I: Simulation of Open-Hole Tension Tests with Optimal GA Solution

The FE model of the OHT test samples is shown in Figure 3 with details described in Section 2.3. The following section investigates mesh-size sensitivities and the simulation of size effects and compares virtually obtained damage patterns to experimental observations.

4.1. Mesh-Size Sensitivity

The FE mesh size of the CT geometry used for the calibration of damage input parameters in previous section is 1 mm × 1 mm. The investigation of different mesh sizes requires the application of Bazant’s crack band scaling approach outlined in Equation (4) where the characteristic length l * is adjusted based on a given fracture energy G f and ply strength X. With the optimal damage input parameters shown in Table 2, the ply strength values X 1 = E 1 ε 1 i = 82.6 MPa and X 2 = E 2 ε 2 i = 14.8 MPa can be calculated. Similarly, the fracture energy can be considered as the area of each stress–strain curve (see Figure 1), therefore G 1 f = 0.5 X 1 ε 1 s = 3.5 kJ/m2 and G 2 f = 0.5 X 2 ε 2 s = 0.6 kJ/m2. With the aim to dissipate the same amount of energy for a given strength, regardless of the underlying FE mesh size, Equation (4) suggests scaling the damage saturation strains along the grain direction ε 1 s and perpendicular to it ε 2 s with respect to the characteristic length l * . Here, three different mesh sizes are compared in OHT test samples with hole diameter of 8 mm. Table 3 lists these mesh sizes with the adjusted damage saturation strains.
The quantitative and qualitative simulation results using different mesh sizes are shown in Table 4 and Figure 7, respectively. OHT testing of composites typically yields linear mechanical behaviour up to brittle failure [32,33]. Therefore, only strength data are calculated by considering the maximum measured force and the cross-section of the OHT test sample. Note that the net cross-section (without accounting for the open hole) is used to calculate the OHT strength. Table 4 shows that there are only minor changes to the open-hole strength with maximum differences of less than 1%, implying that mesh convergence has been achieved. It can be concluded that the coarse mesh (1 mm × 1 mm) is sufficiently fine to simulate progressive damage of the wood veneer laminates. This is consistent with previous findings on carbon fibre-reinforced laminates [34] where such a coarse mesh achieved mesh-insensitive damage simulations. The qualitative comparison of the damage patterns in Figure 7 further shows that the mesh size does not alter the damage path. The three simulations with different mesh sizes predict a similar damage path that is aligned in a perpendicular direction to the tensile loading. The observed damage refers to the 0° plies of the [ 90 / 45 / 0 / 45 ] s beech veneer laminates as indicated by the white in the bottom right corner of each contour plot. The obvious qualitative difference between the simulation results is the damage height since damage localises in one row of elements in typical CDM approaches [34]. This highlights the need for Bazant’s crack band scaling in Equation (4) and the adjustment of the damage saturation strains shown in Table 3 so that an equal amount of energy is dissipated regardless of the underlying mesh size.

4.2. Simulation of Size Effects

With confidence in the mesh-insensitive damage simulations, different hole sizes can be investigated to further assess the prediction capabilities of the GA-derived CODAM2 material model using a coarse mesh of 1 mm × 1 mm. Table 5 shows the three different OHT test configurations where the hole diameter D varies from 8 mm to 16 mm with constant specimen width W and length L. This results in varying hole-to-width ratios D / W from 0.4 to 0.8.
Table 6 compares the simulated OHT strength to experimental mean values for each of the three OHT test geometries. It shows that the OHT strength can be predicted with errors of less than 8%. Note that simulations complete in 1–2 min on a conventional computer using four CPUs.
Figure 8 further compares the simulated and experimental results of the size effect study to theoretical bounds. The ratio between the simulated/measured OHT notch strength σ n from Table 6 to the experimentally measured un-notched strength σ un = 70.0 MPa [6] decreases with increasing hole-to-width ratio D / W . The theoretical bounds are given by ideally ductile behaviour ( 1 D / W ) and ideally brittle fracture 1 D / W K t where the stress concentration factor K t is given by [35]
K t = 3 3.14 D W + 3.667 D W 2 1.527 D W 3 .
with hole diameter D and sample width W = 20 mm.
The results in Figure 8 show that it is possible to find reasonable lower and upper bounds by analytical models shown in Equation (7). However, it can also be seen that the presented FE simulation method on progressive damage analysis significantly improves the prediction of the OHT strength where the simulated strength ratios are much closer to experimental results compared to the theoretical bounds. The computation time of the presented FE models with less than 2 min for the simulation of one OHT test on a conventional computer is certainly larger than the evaluation of these analytical models. In contrast, the analysis of FE results offers more details, in particular the analysis of qualitative results as discussed in the following.

4.3. Qualitative Damage Analysis

Figure 9 shows a qualitative comparison of the strain fields in vertical y direction obtained from FE simulation (using element size of 1 mm × 1 mm) and Digital Image Correlation (DIC) [6] for the OHT8 specimen geometry at 90% of the maximum simulated/measured OHT strength. Both strain fields show similar concentrations in magnitude and shape around the hole in the normal direction to the applied load. Minor differences can be explained by the natural inhomogeneity of wood where microscopic imperfections can alter the load path leading to a slightly asymmetric DIC strain field shown in Figure 9. Nonetheless, the good qualitative match of the strain fields in Figure 9 and the reasonable quantitative comparison of OHT strength data show that the presented FE methodology can yield fast and accurate results for the simulation of progressive damage in wood veneer laminates.
Apart from the strain field, it is important to compare the simulated damage zones with experimentally observed fracture. Figure 10 shows the predicted damage zones for each OHT test geometry next to a corresponding photo of a post-mortem OHT sample from experiments. Again, the simulations using the coarse mesh of 1 mm × 1 mm are able to accurately estimate the location and extent of damage which is concentrated around the hole and in normal direction to the applied loads. Similar to the observation of simulated CT tests shown in Figure 6, the virtual damage bands in OHT tests grow along one row of elements. As mentioned before, this motivates the application of Bazant’s crack band scaling to ensure physically meaningful damage simulations.

5. Validation II: Simulation of Open-Hole Tension Tests with GA-Based Uncertainty

The previous section validated the computational framework against the mean values from experiments. Now, the calibration results obtained from GA in Section 3 are used to account for uncertainty in simulating progressive damage in the wood veneer laminates. The numerical results are compared to statistical measurements from experiments that capture the inherent variation of damage properties in the wood veneer laminates.

5.1. Information from Last GA Generation of CT Simulations

Figure 5 presented the best FE simulation within the 17 generations of the GA algorithm to replicate the load vs. displacement curves from experiments. The optimal input settings were validated in Section 4.
In addition to this optimal set of FE input parameters, all of the 24 sets of input parameters obtained from the last generation of the GA algorithm are considered. Figure 11 shows the load vs. displacement graphs (in blue colour) from these 24 FE simulations of the last GA generation. It can be seen that the FE simulations cover the range of experimental results, motivating the consideration of all sets of input parameters to account for the inherent uncertainty of the wood veneer laminates subjected to progressive damage. Table 7 demonstrates that the previously determined optimal input data lie well within the resulting ranges of the four FE input parameters.

5.2. Statistical Comparison of OHT Tests and FE Simulations

To validate the ranges of FE input parameters listed in Table 7, the OHT8 and OHT12 tests are considered, as 20 test results are available, which ensures statistically meaningful experimental data. The 24 sets of FE input parameters obtained from the last GA generation are applied to the OHT8 and OHT12 models using element sizes of 1 mm × 1 mm.
Figure 12a,b show the distribution of the resulting open-hole strength from the 20 experiments and 24 FE simulations for the OHT8 and OHT12 tests, respectively. The dashed lines represent a best fit normal distribution from each test case. The statistical simulation results agree well with the experimental counterparts for both open-hole tension tests. Table 8 compares the mean values and the coefficients of variation between experiments and FE simulation. It can be seen that the mean values are accurately predicted with errors of less than 2%. However, the coefficients of variation from simulations are nearly double those of their experimental counterparts. Overall, the results demonstrate that the GA-based calibration of input parameters cannot only accurately determine the optimal FE parameters, but it can also elegantly account for uncertainty without the need for an excessive number of FE model evaluations.

6. Discussion

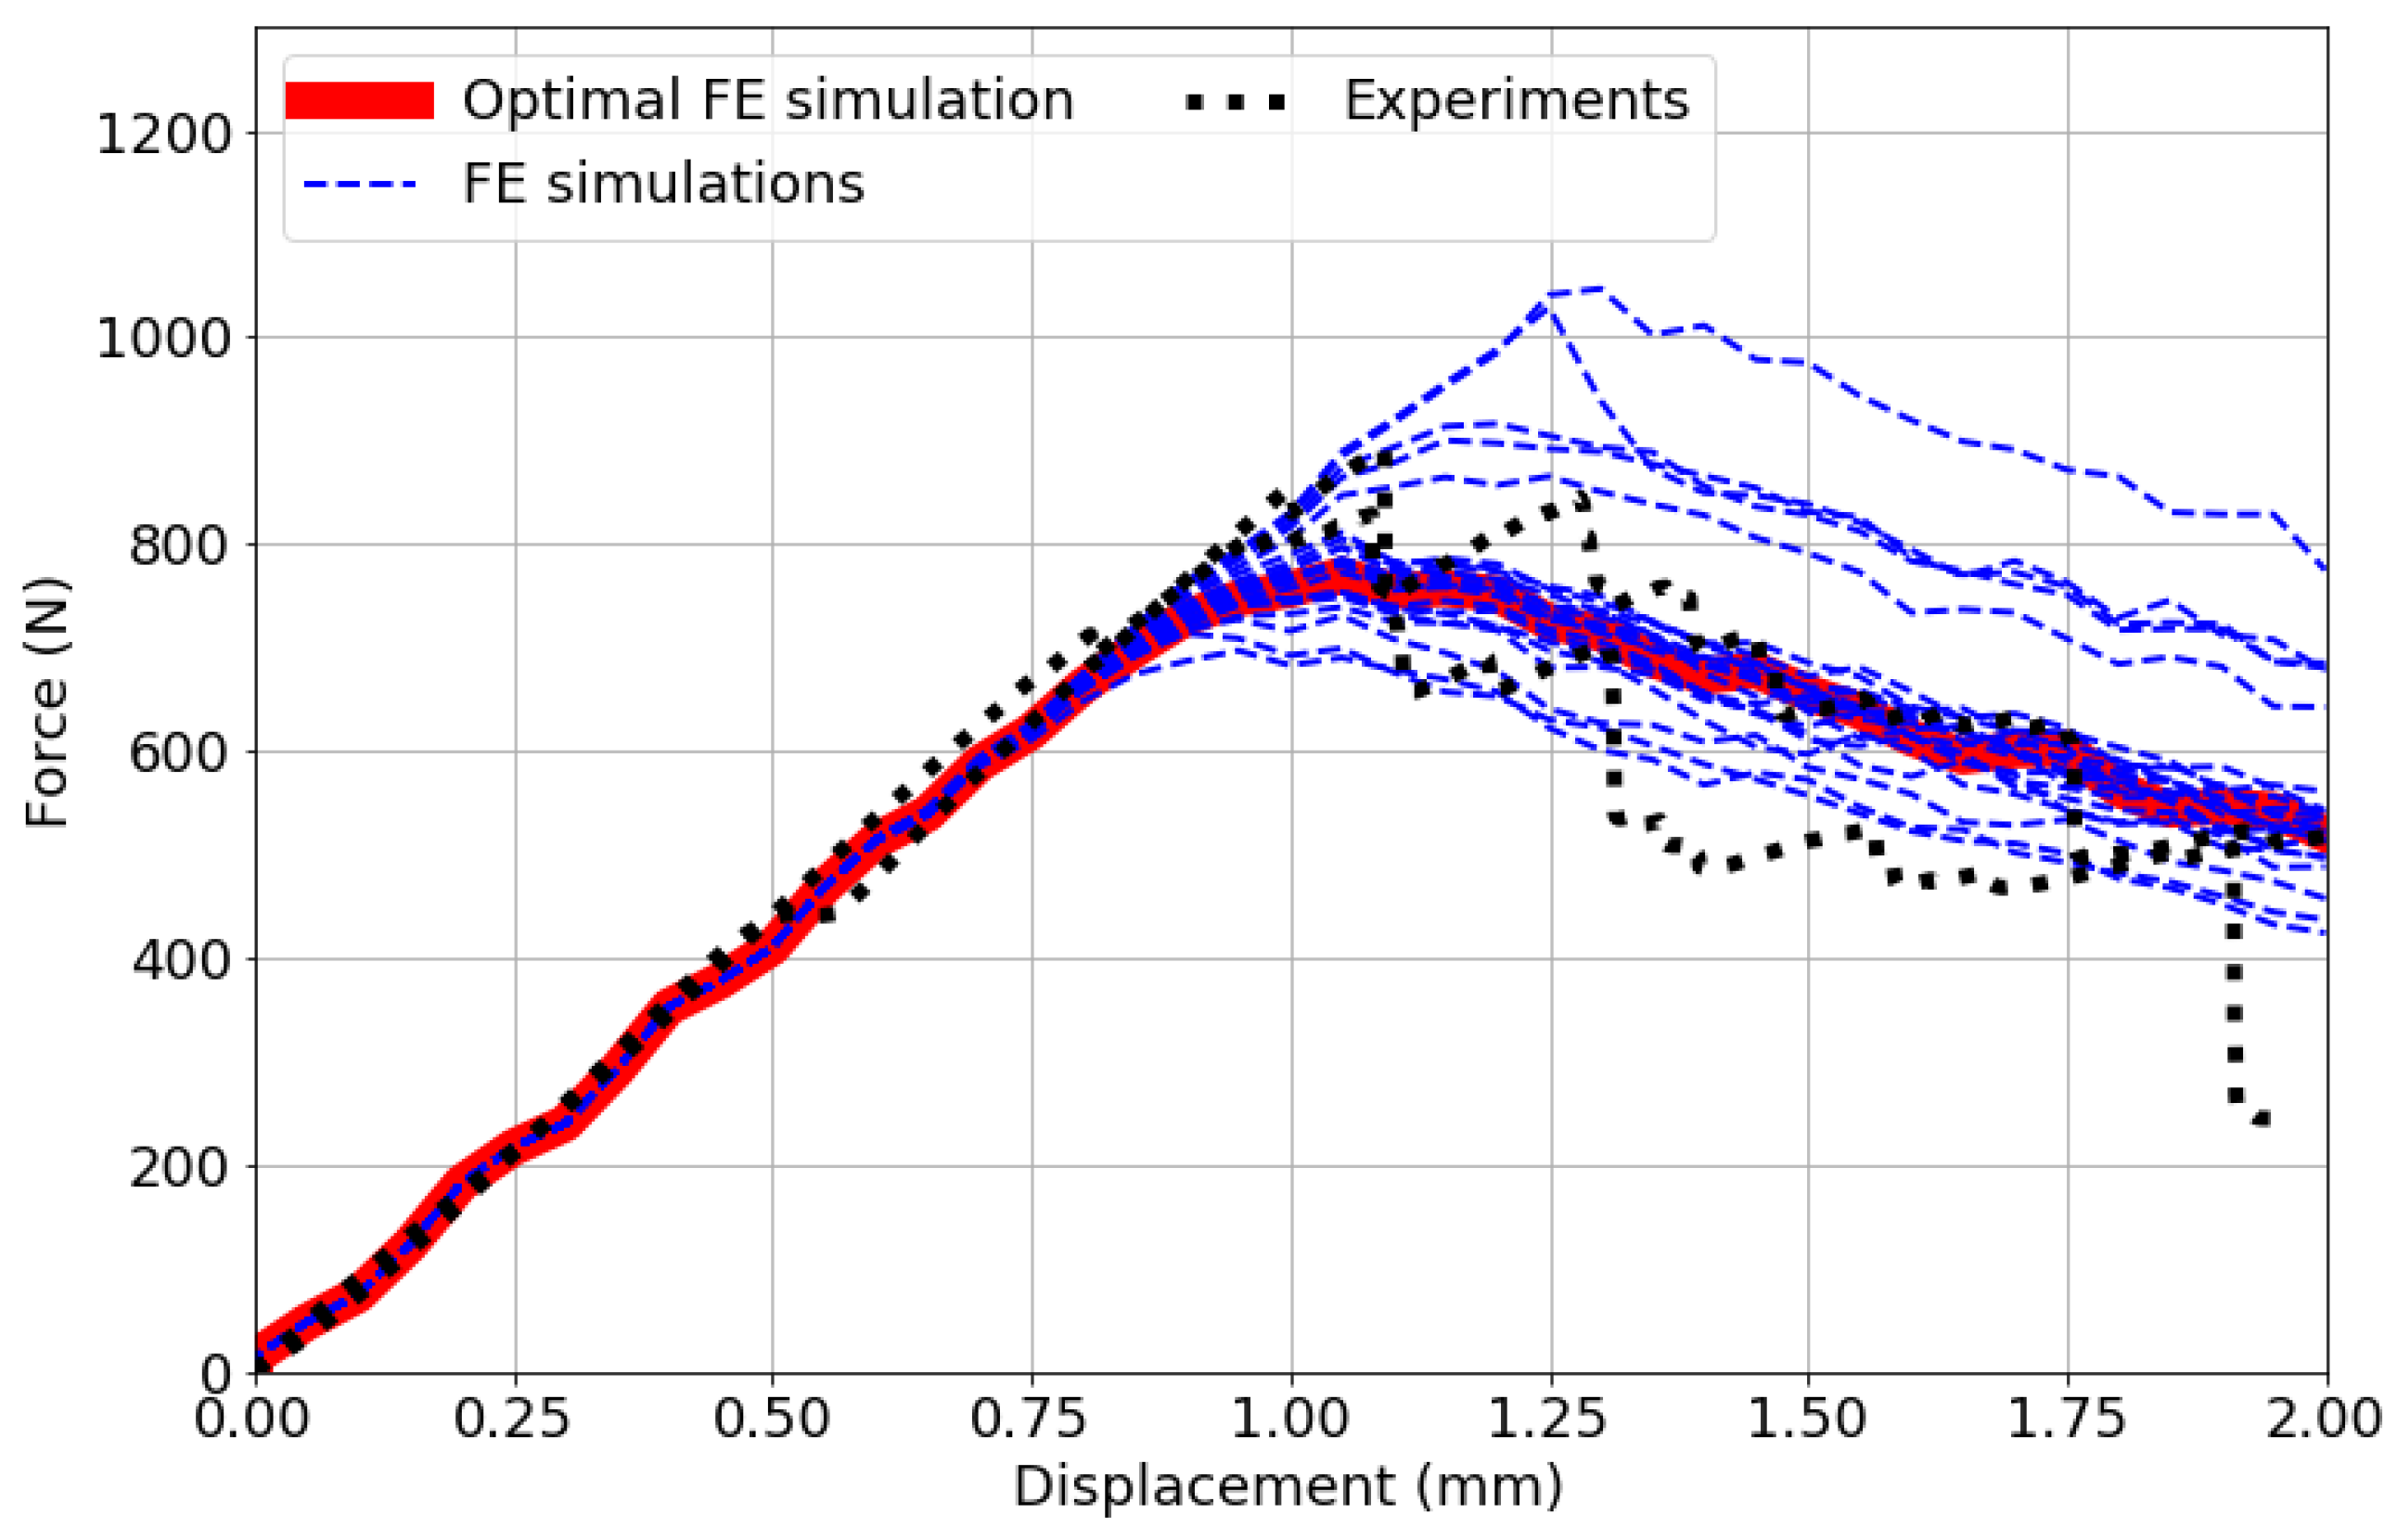
The results of the validation in Section 4 show that the efficient FE simulation and GA-based calibration technique can be successfully applied to wood veneer laminates. While the simulation results correlate well qualitatively and quantitatively with experimental measurements, it is important to highlight other benefits and fundamental limitations of the presented computational strategy. Every FE simulation is completed within 2 min on a conventional computer with four CPUs. The use of high-performance computing will further reduce computation times significantly.

6.1. GA-Based Uncertainties

The fast computation enables the application of statistical analyses [23,36], probabilistic approaches, and data-driven machine learning techniques [
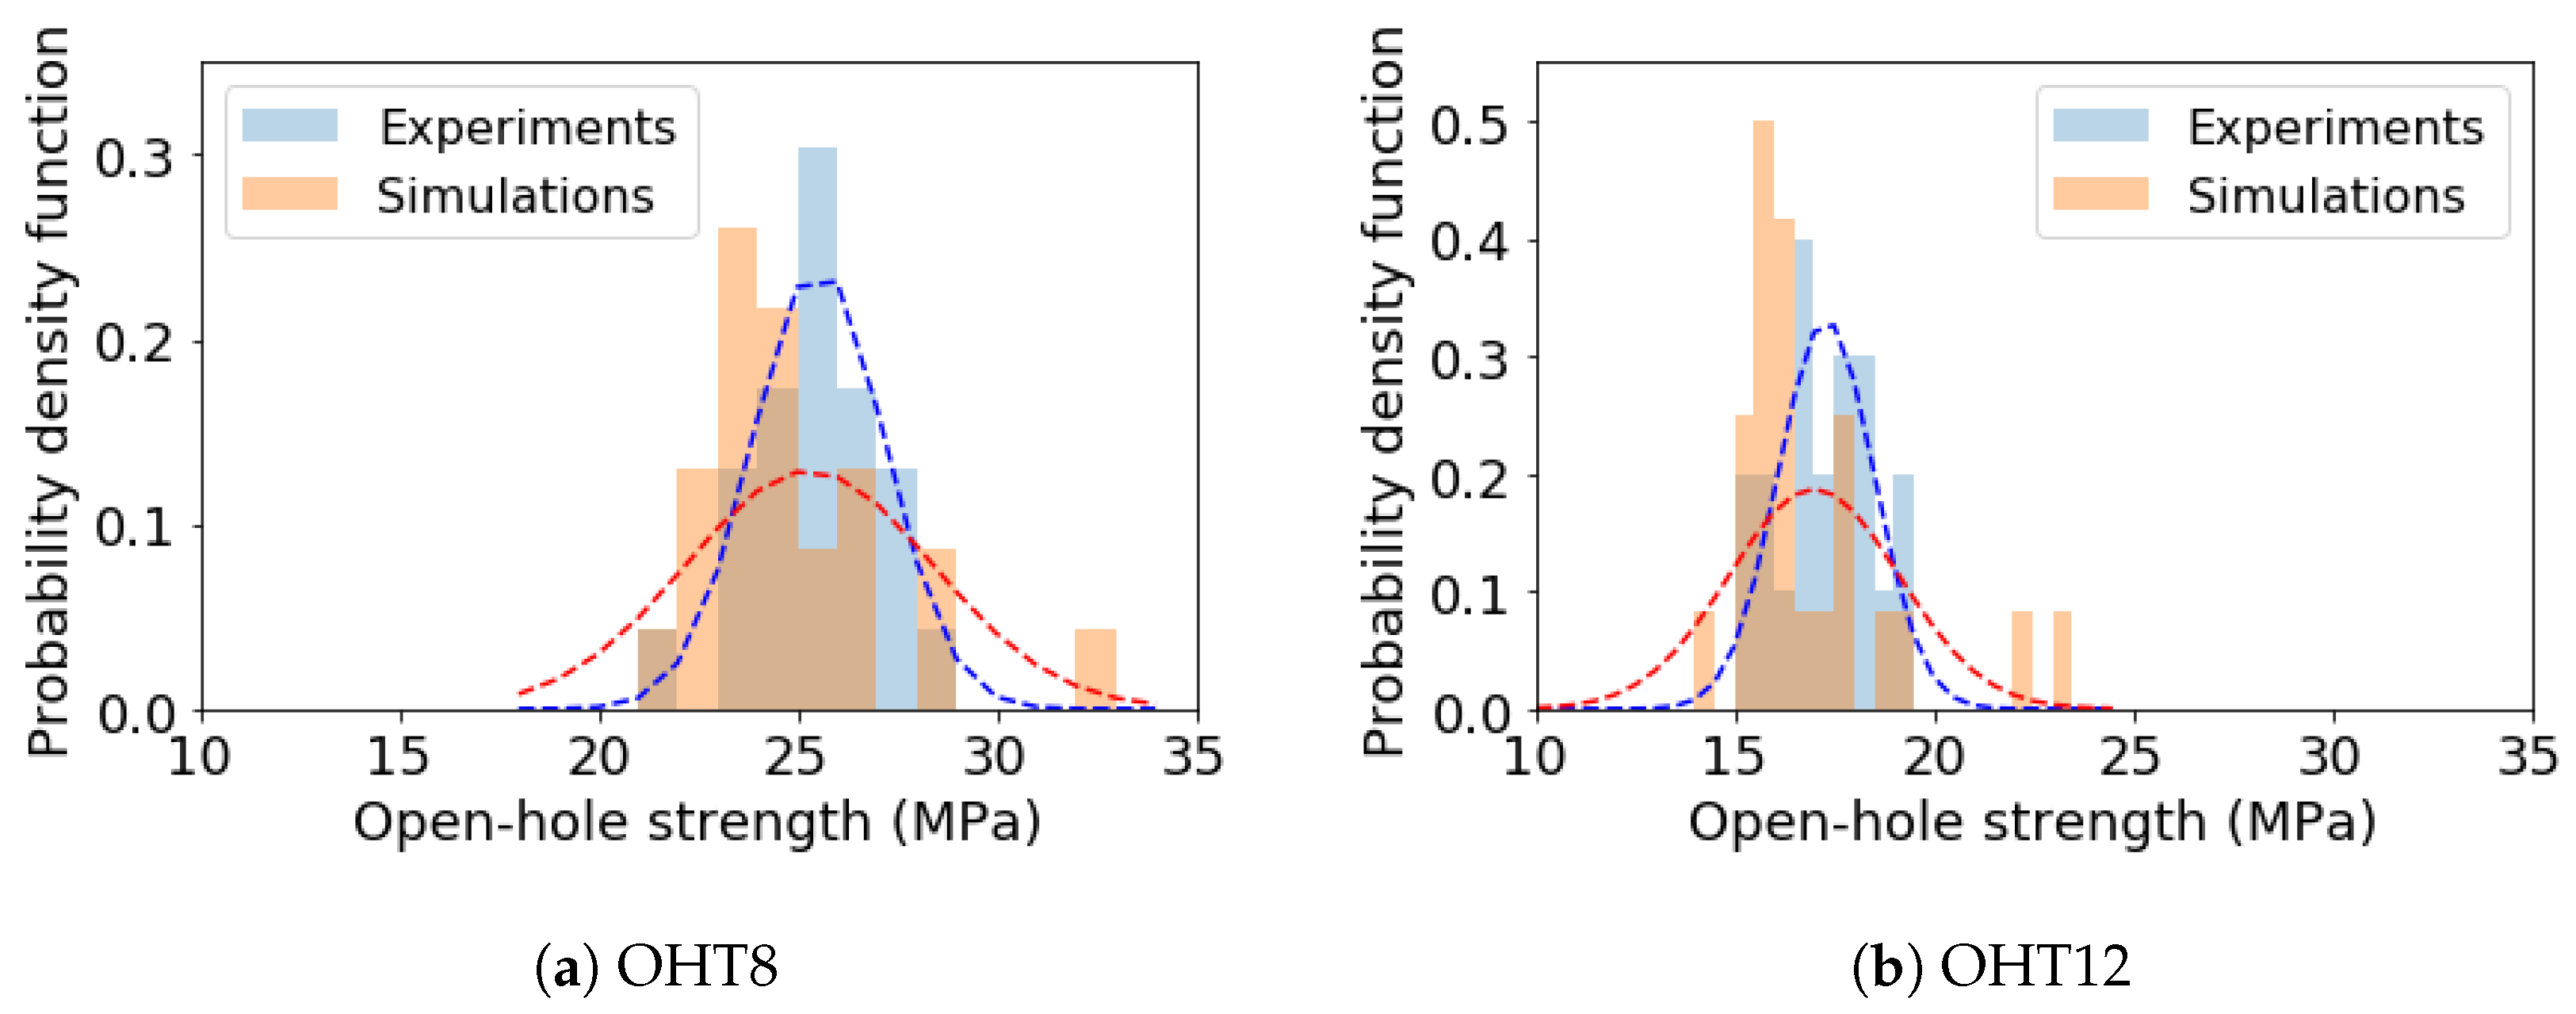
22]. This is particularly beneficial for the consideration of inherent material uncertainties which is an important aspect when analysing natural materials such as wood veneers. The results in 
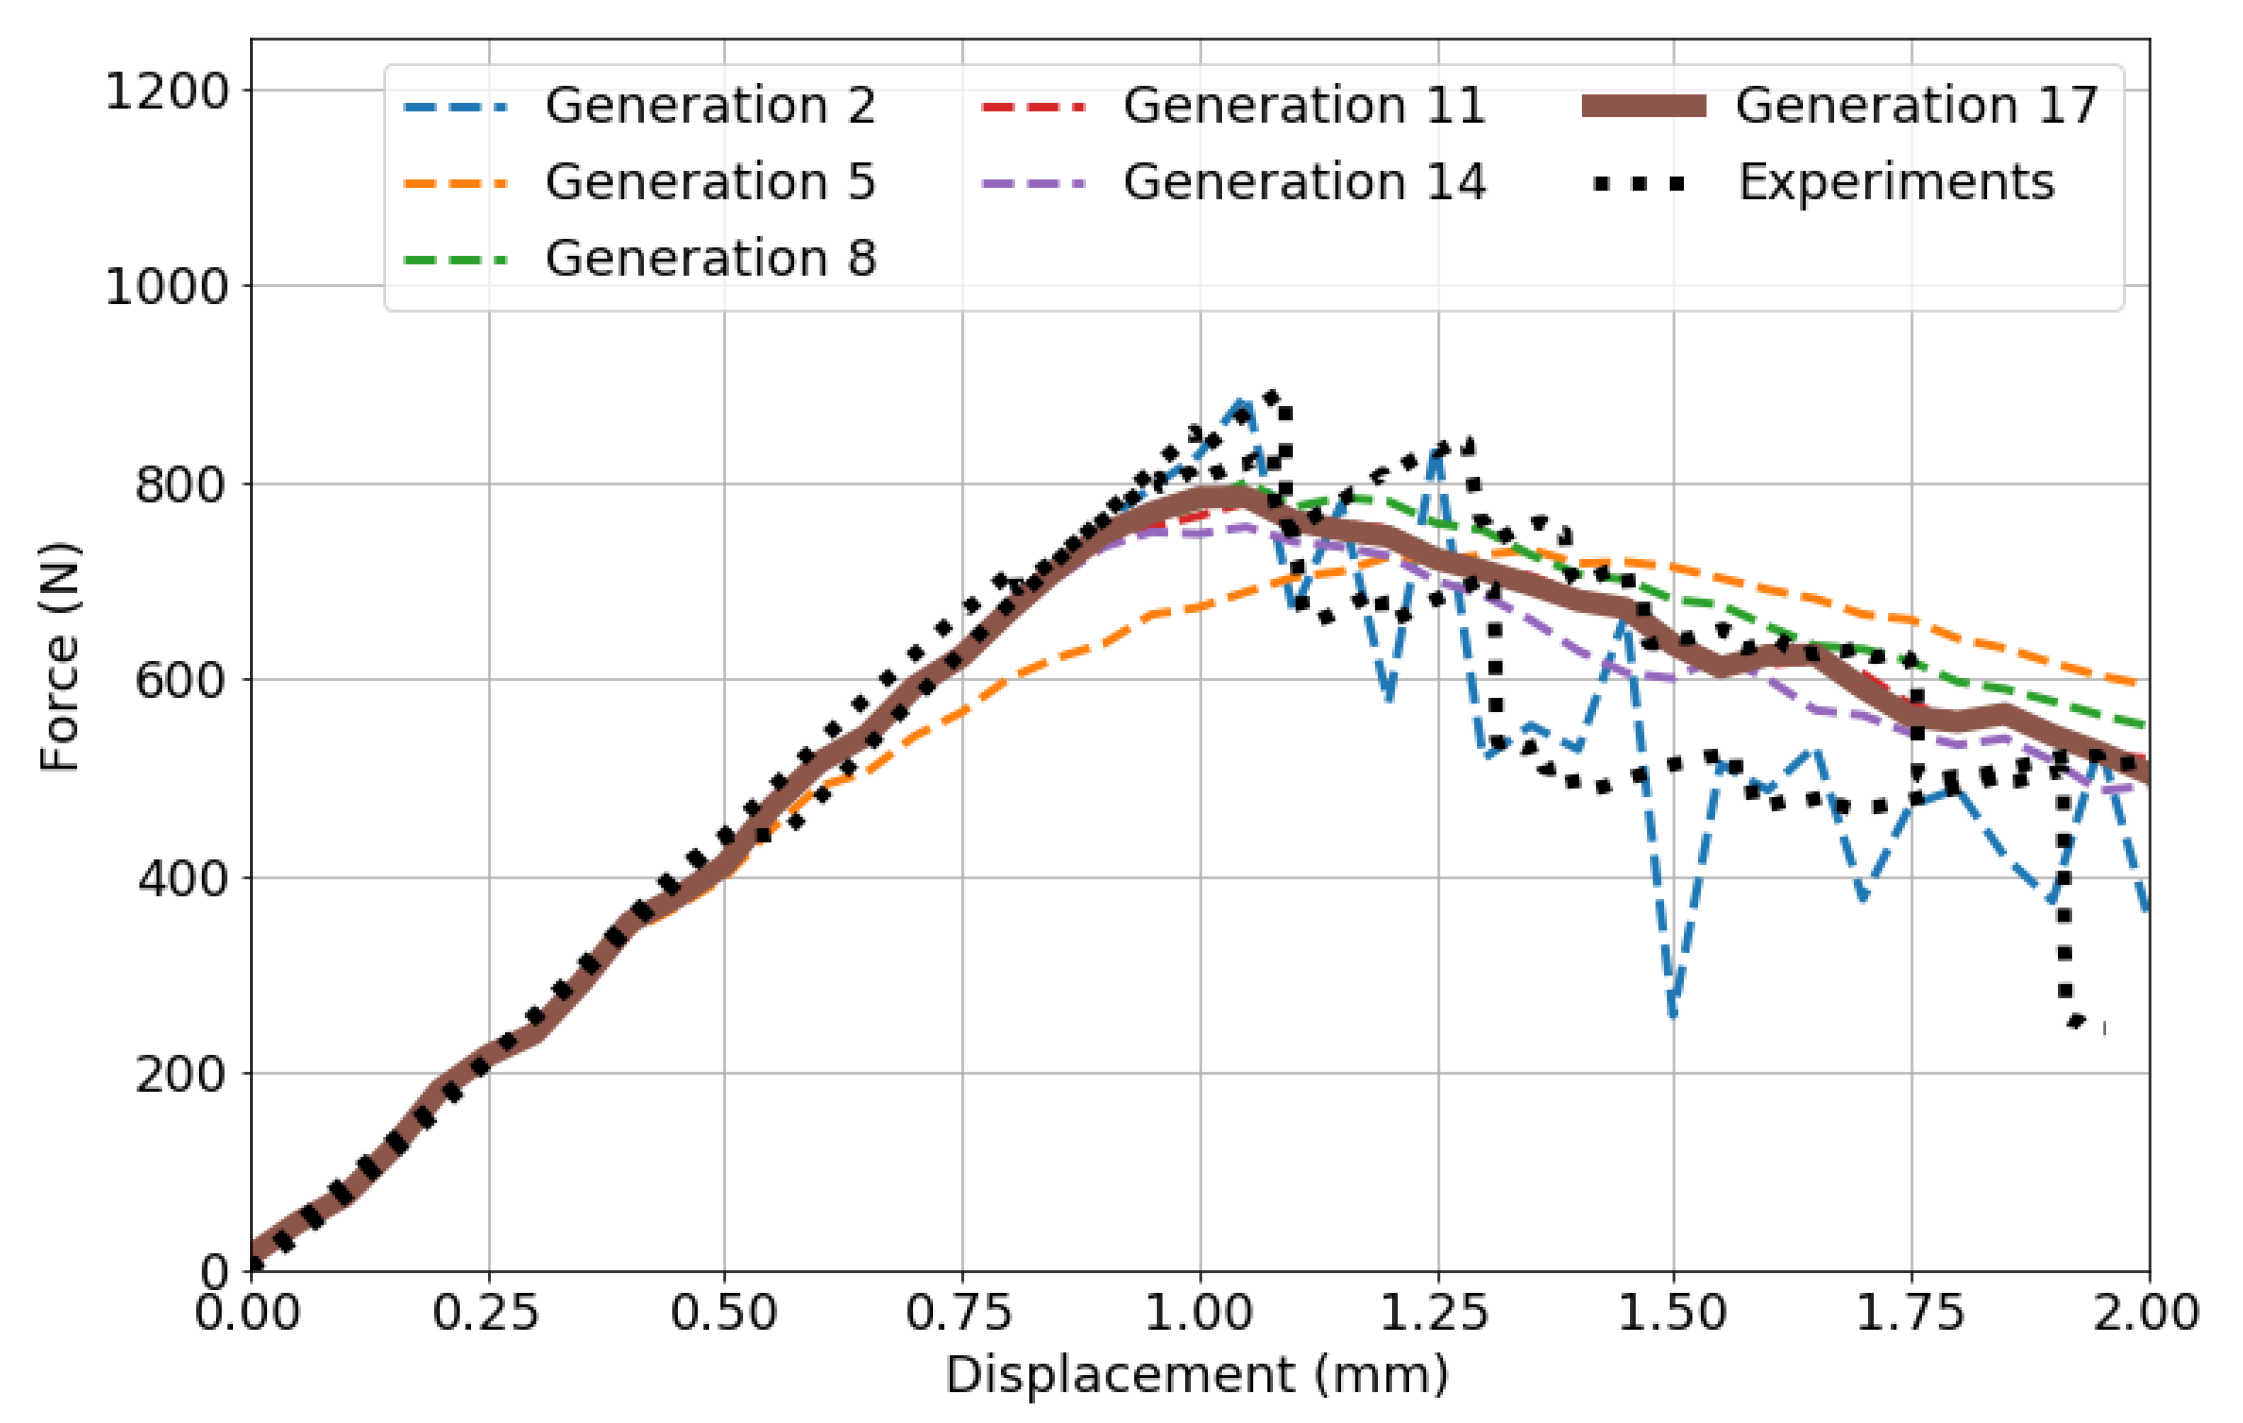
Section 5 demonstrate that the GA-based calibration of FE input ranges present an efficient and simple way to successfully include uncertainty into the simulation of wood veneer laminates subjected to progressive damage.
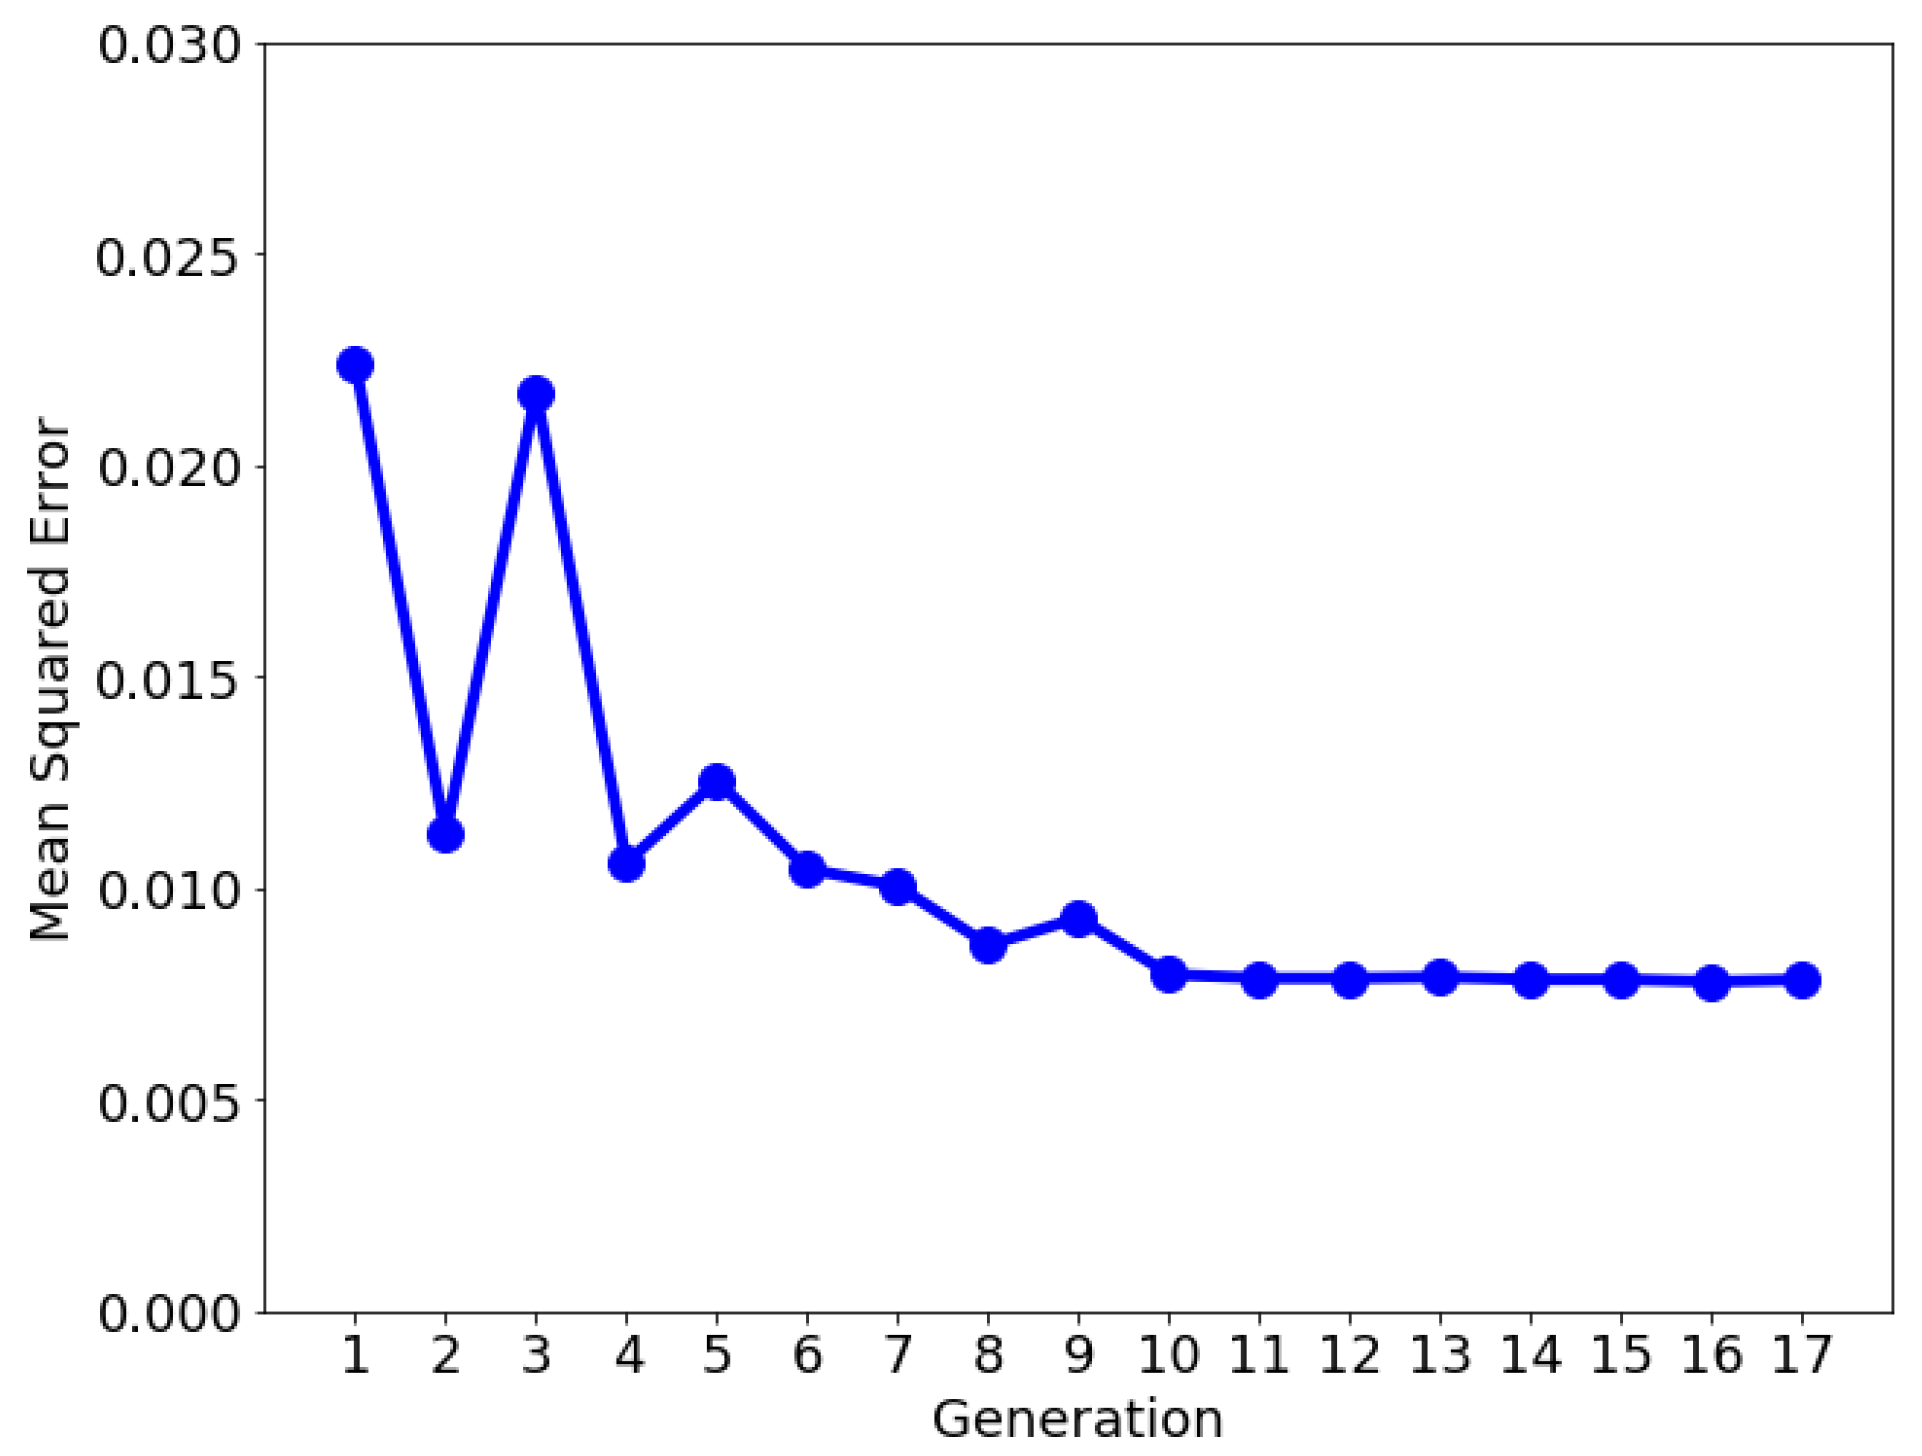
A total number of 408 FE simulations were required to reach convergence within the GA-based calibration procedure. Uncertainty is incorporated by considering 24 FE simulations from the last GA generation with varying input parameters. In comparison, a similar study on progressive damage analyses in FRP composites applied a Markov Chain Monte Carlo (MCMC) method to include uncertainty [23]. The algorithms required the evaluation of 260,000 FE models, and approximately 5000 simulations used after convergence to represent uncertainty. This comparison shows that the GA-based calibration shown in Section 3 requires significantly less FE results. It should be noted that the GA-based uncertainty quantification failed to accurately predict the variability (measured by coefficients of variation in Table 8 in the two OHT tests. To more effectively predict variability, a more rigorous method, such as MCMC, is recommended, although this will result in a significant increase in computational cost.

6.2. Capabilities

The short computation times of around 2 min can enable additional analyses beyond typical deterministic simulations at the coupon-level. The efficient nature of the presented computational method will enable the simulation of large-scale wooden components before costly and time-consuming prototyping, for example in the automotive sector [1]. It also allows for exploring other applications virtually where wooden structures can be introduced for more sustainable material solutions. The efficient incorporation of uncertainty allows the consideration of inherent material variations with large-scale wood veneer structures.
Another positive aspect of the presented progressive damage model is that it is easy to calibrate and to use. As outlined in 
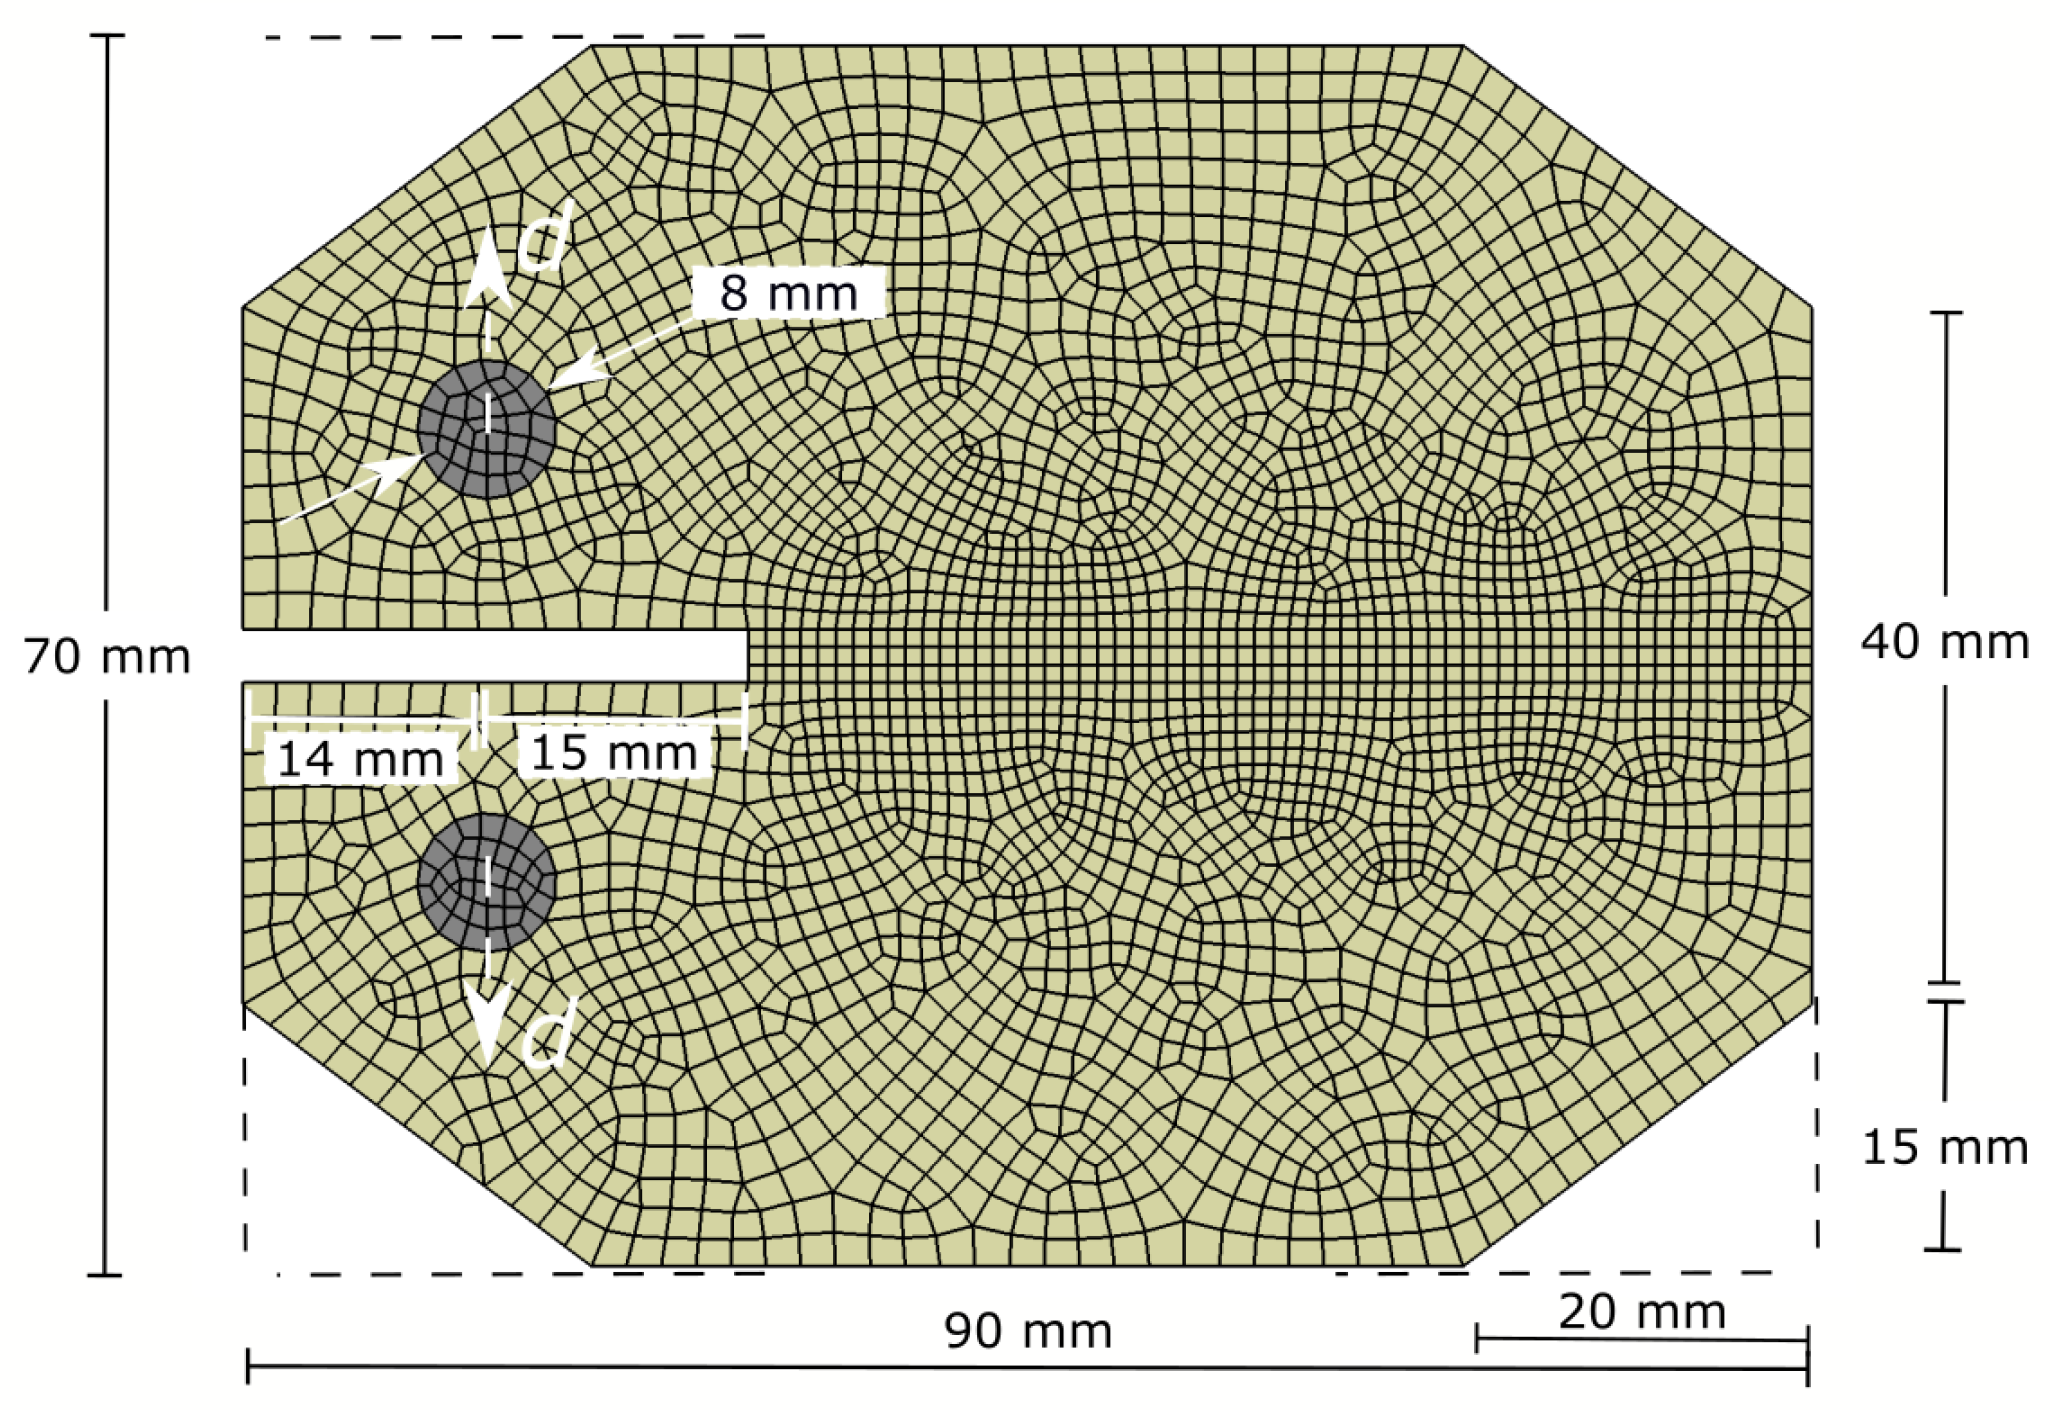
Section 3, only four damage input parameters need to be calibrated through GA-based simulations of CT tests. Thanks to the limited number of input parameters and the proposed objective and automated calibration using GA, this damage model is easy to use which makes it accessible to non-expert users.

6.3. Limitations

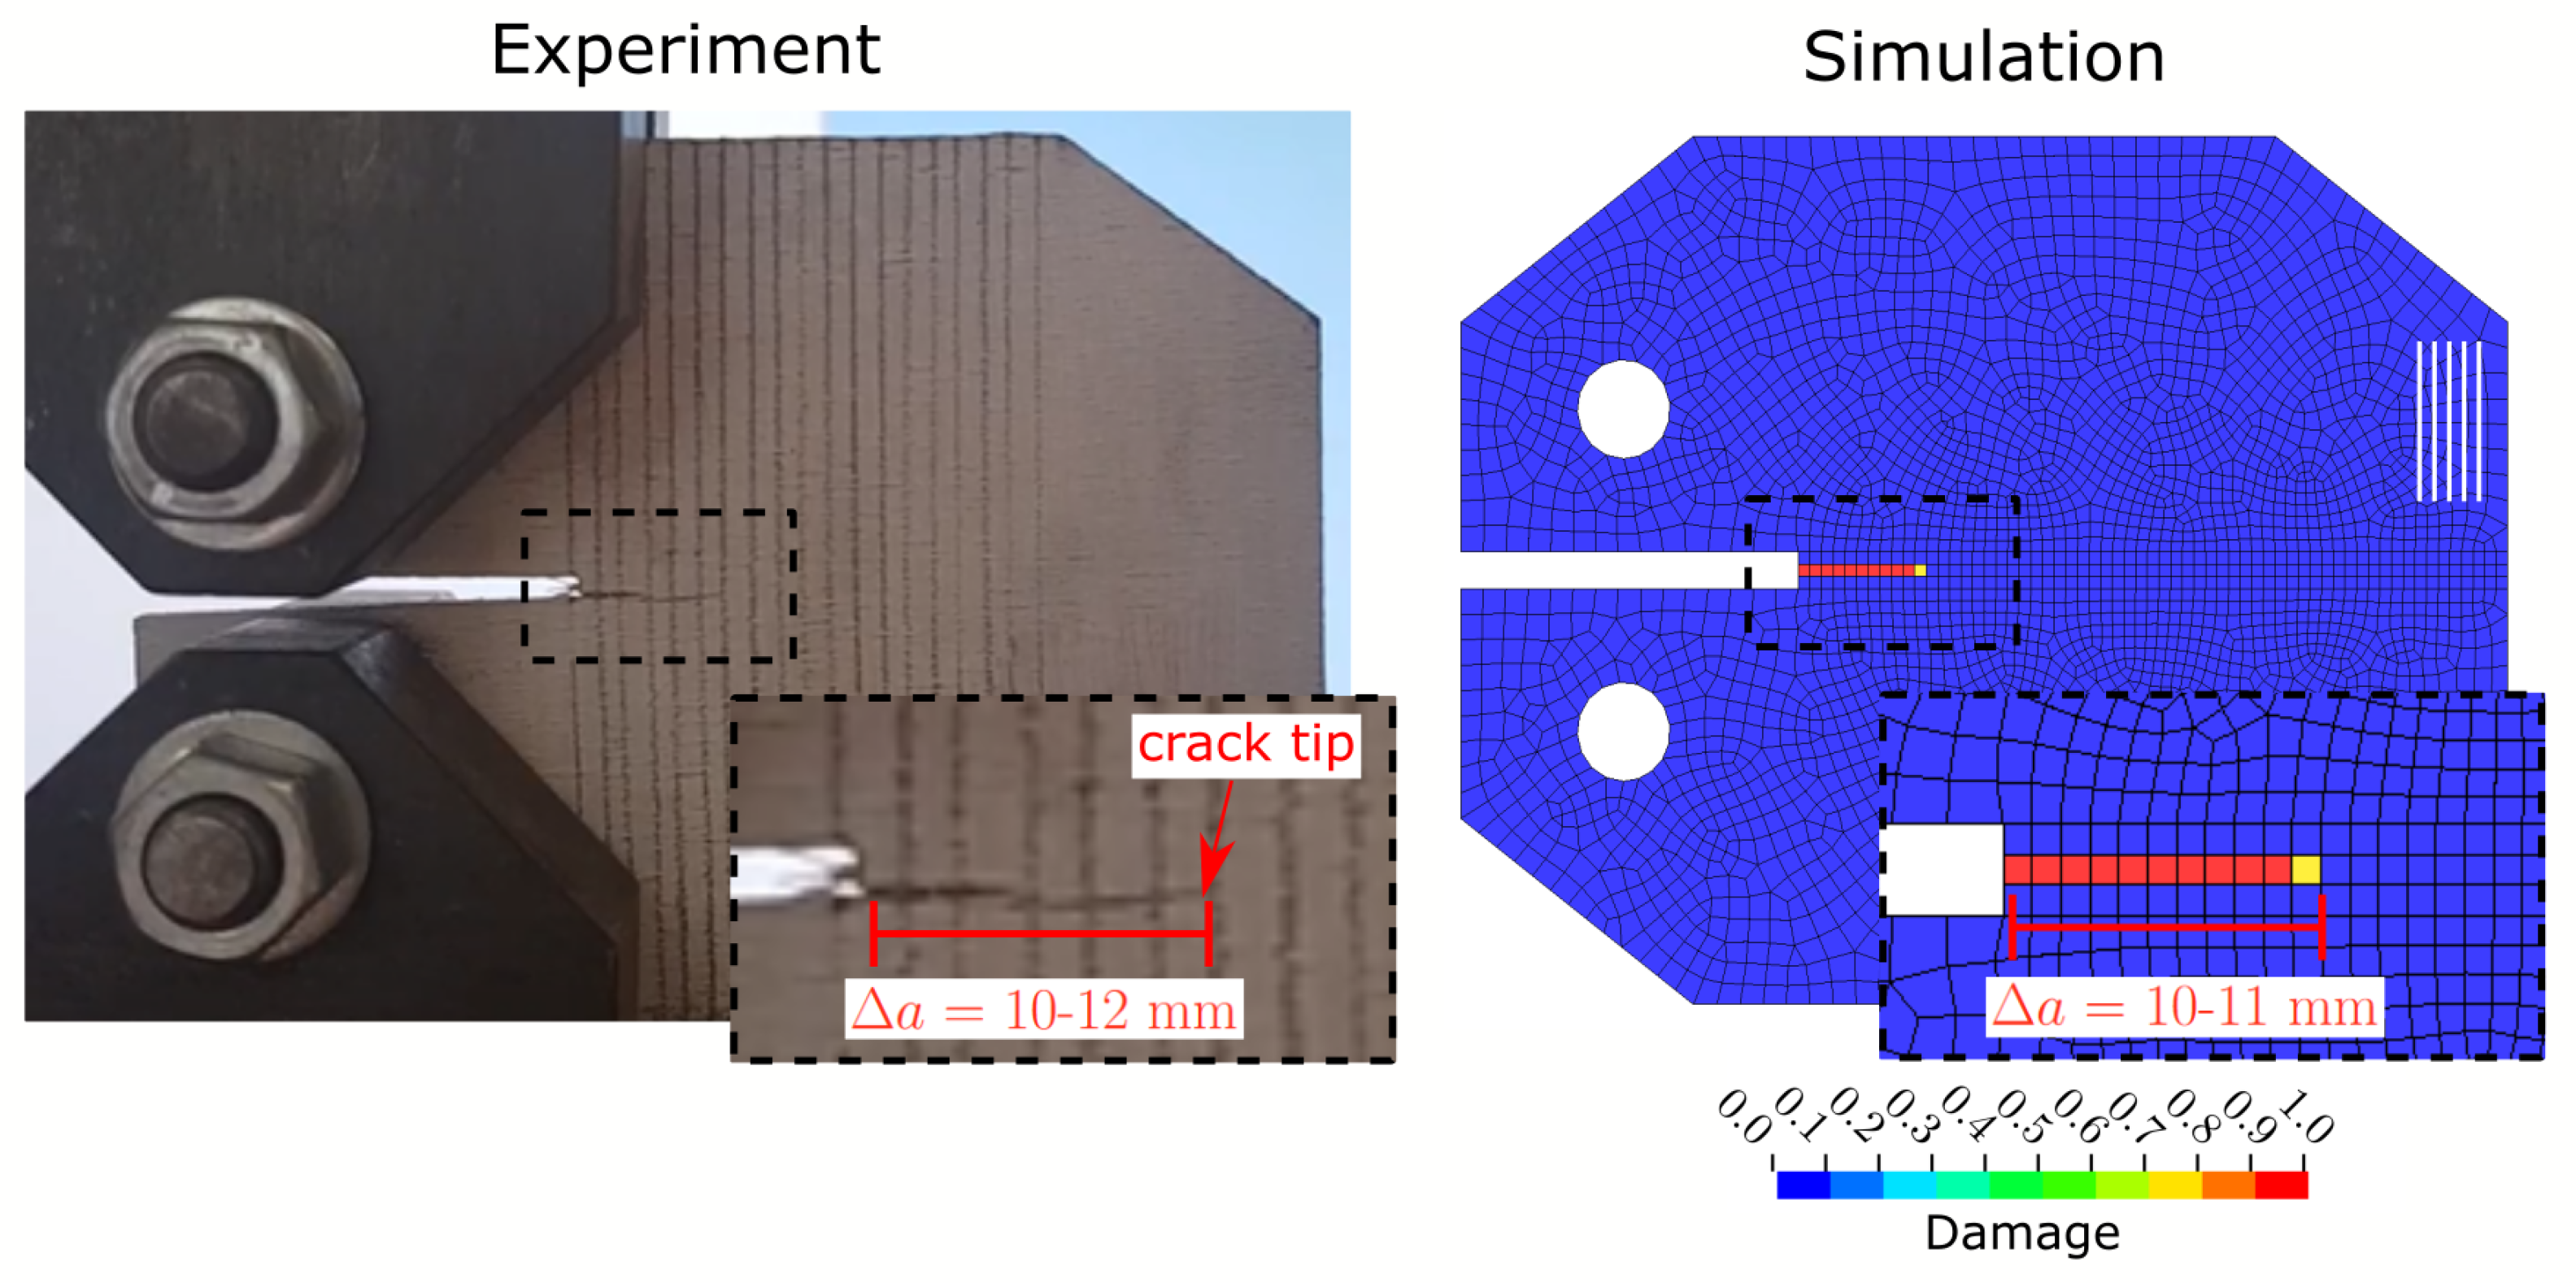
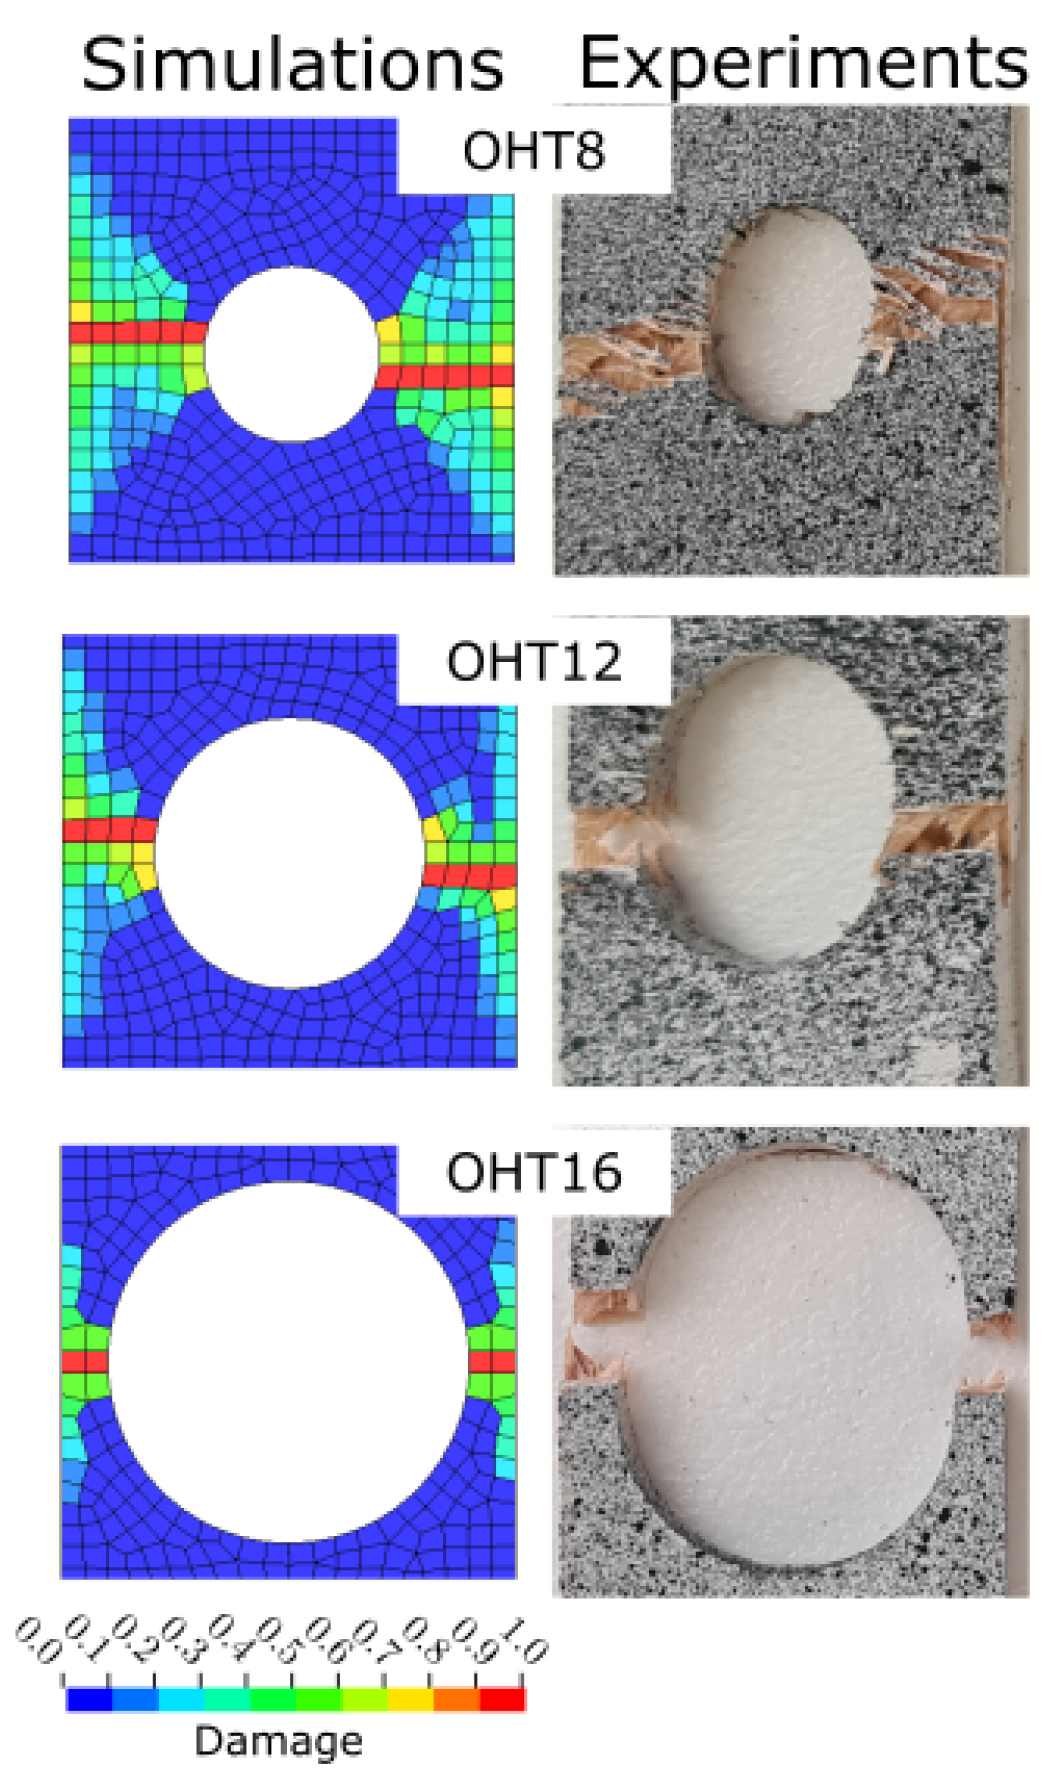
The results in the qualitative damage analyses of CT tests in 
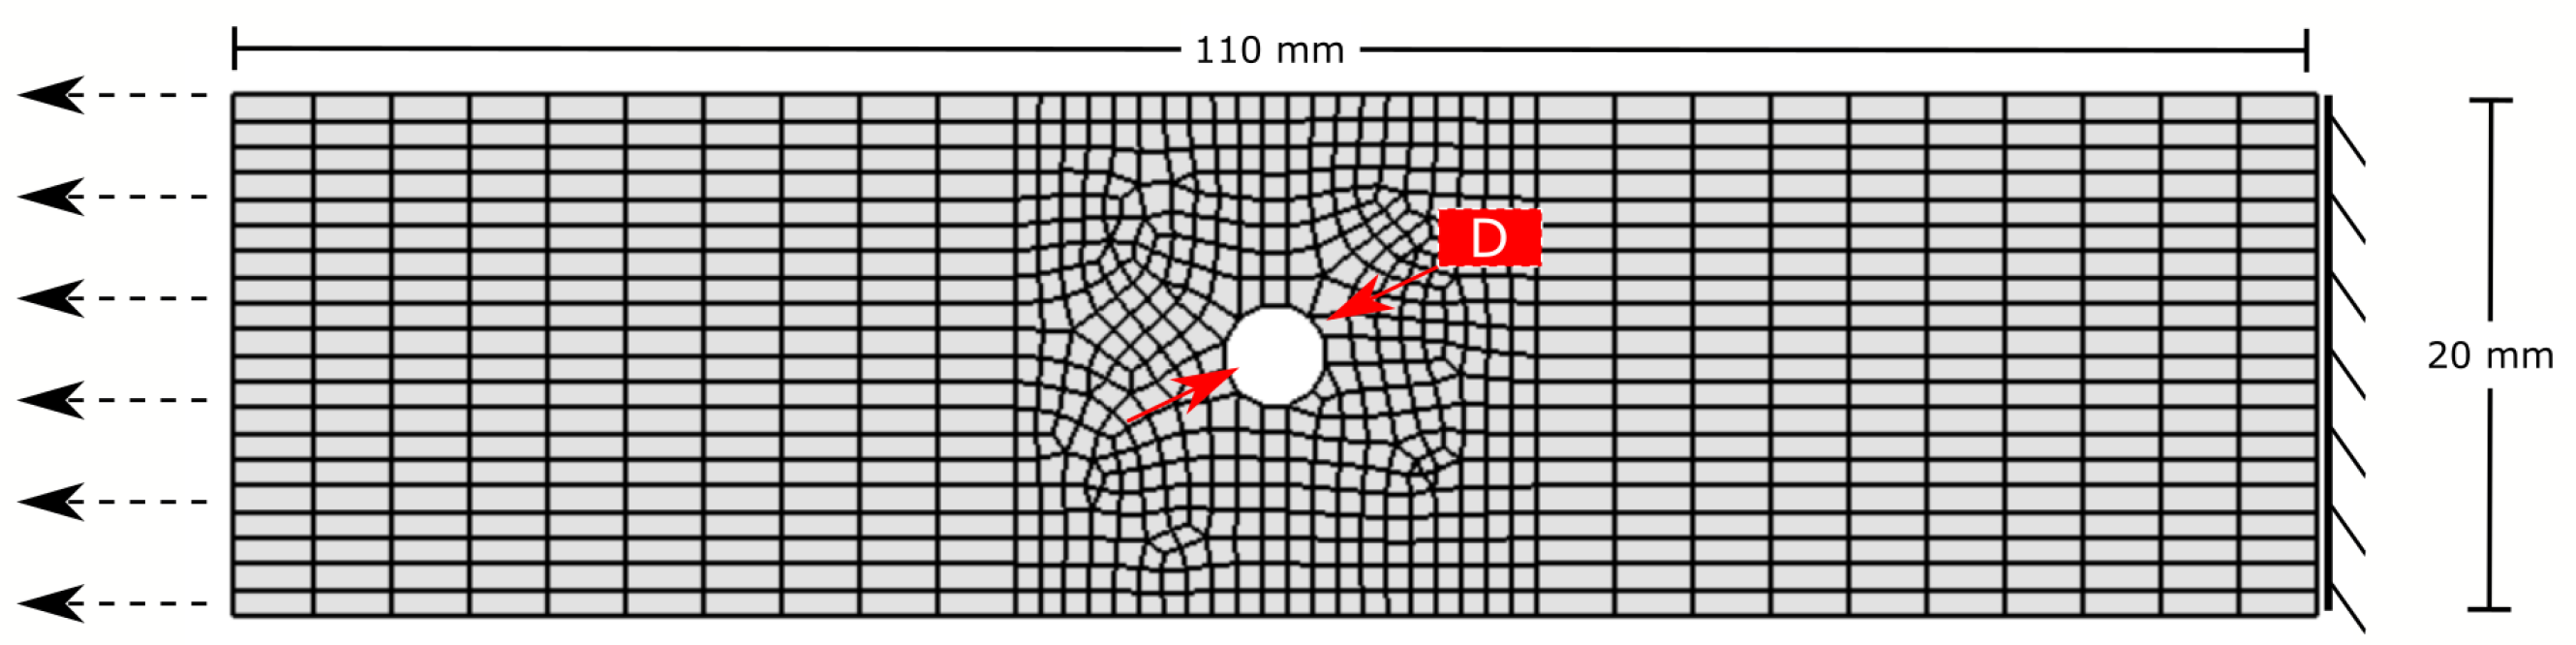
Figure 6 and OHT tests in Figure 10 show that damage localises in one row of elements. This is a typical shortcoming of local CDM-based material models such as the one used here and presented in Section 2.2. Damage is expected to be more distributed irrespective of the element height. The scaling of the damage saturation strains according to Bazant’s crack band scaling in Equation (4) provides a reasonable solution while maintaining computational efficiency. Non-local damage analyses [34] or gradient-based phased field methods [37,38] offer more mesh-independent solutions resulting in more realistic qualitative representations of damage. Note that the calibration of such non-local methods becomes more challenging and the computational cost is increased.
If delamination becomes a dominant failure mode, higher fidelity models are needed to capture progressive damage within the interfaces of the laminates. The individual plies with different fibre/grain orientation can be stacked up with embedded cohesive interfaces between them [12]. Similar to the remark about the incorporation of non-local CDM, the computational cost of such higher fidelity models increases significantly, hence limiting their coupling with data-driven calibration methods. With regards to the investigated mechanical tests here, both CT and OHT analyses revealed that delamination can be considered as negligible [6].
Since the presented study investigates laminates subjected to tensile loads, it remains to be seen whether the simulation of compressive damage in wood veneer laminates can be equally adopted from FRPs. The densification capabilities of wood and its accompanied plastic behaviour in compression may necessitate a more comprehensive calibration process for a compressive damage–plasticity model as opposed to veneers subjected to tensile loads.

6.4. Future Research

The limitations outlined in Section 6.3 motivate the definition of immediate future research. Non-local FE models [34] will be calibrated and applied to wood veneer laminates to enable the simulation of mesh-independent damage growth.
It is important to investigate other relevant load cases such as compression, bending, transverse impact, and crushing of wood veneer laminates. With the help of such experimental studies, the presented FE simulations can be enhanced to incorporate compressive damage evolution. These tests would also expand the validation cases to clearly map out benefits and limitations with respect to real-world applications.
In finding thin-walled sustainable materials, the sole use of wood veneers might not satisfy certain stiffness or strength requirements. This motivates research towards hybrid materials consisting of wood veneers and sustainable fibre-reinforced materials. The findings presented here will help in the virtual design and optimisation of such hybrid materials by combining progressive damage modelling of wood veneers with well-established concepts on fibre-reinforced materials.

7. Conclusions

This study employs a progressive damage model for the efficient finite element simulation of damage resistance and open-hole strength in quasi-isotropic [ 90 / 45 / 0 / 45 ] s beech veneer laminates. All input parameters can be estimated and calibrated using experimental measurements and genetic algorithms in compact tension tests. The analysis of different open-hole test geometries shows that open-hole strength values can be efficiently simulated with errors of less than 4%. The simulation results are further validated qualitatively against full-field strain fields from digital image correlation and post-mortem test samples. Furthermore, the uncertainty in the simulation of progressive damage can be incorporated elegantly based on calibration results obtained from the genetic algorithm. The presented methodology, combining efficient finite element analysis with genetic algorithms, can be directly transferred to other wood materials to determine the in-plane mechanical properties and their uncertainties. With fast computation times of less than two minutes on conventional computers, the presented simulation strategy paves the way towards the analysis of large-scale sustainable wooden structures ensuring their safe and reliable application.

Author Contributions

Conceptualization, J.R.; methodology, J.R. and Y.-F.F.; software, J.R. and Y.-F.F.; formal analysis, J.R.; investigation, J.R. and Y.-F.F.; data curation, J.R. and Y.-F.F.; writing—original draft preparation, J.R.; writing—review and editing, Y.-F.F. and T.F. All authors have read and agreed to the published version of the manuscript.

Funding

The authors would like to thank the German Academic Exchange Service (DAAD) for providing financial assistance to enable the joint work between Deakin University and the German Aerospace Center.

Data Availability Statement

The data presented in this study are available from the corresponding author upon reasonable request.

Acknowledgments

The author would like to thank Connor Anthian for the experimental investigation of open-hole tests.

Conflicts of Interest

The authors declare no conflicts of interest.

References

  1. Große, T.; Fischer, F.; Kohl, D.; Albert, T.; Boese, B.; Enge, J. Verbundprojekt: Strukturbaugruppen auf Basis Nachhaltiger Holzbasierter Materialsysteme zur Reduzierung von Masse und Umweltauswirkungen im Strassen—Und Schienenfahrzeugbau; Technical Report; Volkswagen AG: Wolfsburg, Germany, 2020. [Google Scholar] [CrossRef]
  2. Gilbert, B.P.; Bailleres, H.; Zhang, H.; McGavin, R.L. Strength Modelling of Laminated Veneer Lumber (lvl) Beams. Constr. Build. Mater. 2017, 149, 763–777. [Google Scholar] [CrossRef]
  3. Käse, D.B.; Piazza, G.; Beeh, E.; Friedrich, H.E.; Kohl, D.; Nguyen, H.; Berthold, D.; Burgold, C. Potential for use of veneer-based multi-material systems in vehicle structures. In Key Engineering Materials, Proceedings of the 22nd Symposium on Composites, Kaiserslautern, Germany, 26–28 June 2019; Trans Tech Publications Ltd.: Bäch, Switzerland, 2019; Volume 809, pp. 633–638. [Google Scholar] [CrossRef]
  4. Heyner, D.; Piazza, G.; Beeh, E.; Seidel, G.; Friedrich, H.; Kohl, D.; Nguyen, H.; Burgold, C.; Berthold, D. Innovative concepts for the usage of veneer-based hybrid materials in vehicle structures. Proc. Inst. Mech. Eng. Part L J. Mater. Des. Appl. 2021, 235, 1302–1311. [Google Scholar] [CrossRef]
  5. Reiner, J.; Wood, J.; Subhani, M. Mode ii fracture of wood: Comparison between end-notched flexure and compact shear testing. Eng. Fract. Mech. 2022, 270, 108561. [Google Scholar] [CrossRef]
  6. Reiner, J.; Pizarro, S.O.; Hadi, K.; Narain, D.; Zhang, P.; Jennings, M.; Subhani, M. Damage resistance and open-hole strength of thin veneer laminates: Adopting design and testing principles from fibre-reinforced polymers. Eng. Fail. Anal. 2023, 143, 106880. [Google Scholar] [CrossRef]
  7. Moës, N.; Dolbow, J.; Belytschko, T. A finite element method for crack growth without remeshing. Int. J. Numer. Methods Eng. 1999, 46, 131–150. [Google Scholar] [CrossRef]
  8. Hansbo, A.; Hansbo, P. A finite element method for the simulation of strong and weak discontinuities in solid mechanics. Comput. Methods Appl. Mech. Eng. 2004, 193, 3523–3540. [Google Scholar] [CrossRef]
  9. Ladeveze, P.; LeDantec, E. Damage modelling of the elementary ply for laminated composites. Compos. Sci. Technol. 1992, 43, 257–267. [Google Scholar] [CrossRef]
  10. Matzenmiller, A.; Lubliner, J.; Taylor, R. A constitutive model for anisotropic damage in fiber-composites. Mech. Mater. 1995, 20, 125–152. [Google Scholar] [CrossRef]
  11. McGregor, C.; Zobeiry, N.; Vaziri, R.; Poursartip, A.; Xiao, X. Calibration and validation of a continuum damage mechanics model in aid of axial crush simulation of braided composite tubes. Compos. Part A Appl. Sci. Manuf. 2017, 95, 208–219. [Google Scholar] [CrossRef]
  12. Reiner, J.; Zobeiry, N.; Vaziri, R. A stacked sublaminate-based damage-plasticity model for simulating progressive damage in composite laminates under impact loading. Thin Walled Struct. 2020, 156, 107009. [Google Scholar] [CrossRef]
  13. Reiner, J.; Zobeiry, N.; Vaziri, R. Efficient finite element simulation of compression after impact behaviour in quasi-isotropic composite laminates. Compos. Commun. 2021, 28, 100967. [Google Scholar] [CrossRef]
  14. Gomez, C.; Dunn, M.; Veidt, M.; Reiner, J. Finite element simulation of fiber reinforced composites under bi-axial loading. Int. J. Comput. Methods 2023, 2241004. [Google Scholar] [CrossRef]
  15. Pinho, S.; Iannucci, L.; Robinson, P. Physically based failure models and criteria for laminated fibre-reinforced composites with emphasis on fibre kinking. part ii: Fe implementation. Compos. Part A Appl. Sci. Manuf. 2006, 37, 766–777. [Google Scholar] [CrossRef]
  16. Valipour, H.; Khorsandnia, N.; Crews, K.; Foster, S. A simple strategy for constitutive modelling of timber. Constr. Build. Mater. 2014, 53, 138–148. [Google Scholar] [CrossRef]
  17. Gharib, M.; Hassanieh, A.; Valipour, H.; Bradford, M. Three-dimensional constitutive modelling of arbitrarily orientated timber based on continuum damage mechanics. Finite Elem. Anal. Des. 2017, 135, 79–90. [Google Scholar] [CrossRef]
  18. Sandhaas, C.; Sarnaghi, A.; Kuilen, J.V. Numerical modelling of timber and timber joints: Computational aspects. Wood Sci. Technol. 2020, 54, 31–61. [Google Scholar] [CrossRef]
  19. Tagarielli, V.; Deshpande, V.; Fleck, N.; Chen, C. A constitutive model for transversely isotropic foams, and its application to the indentation of balsa wood. Int. J. Mech. Sci. 2005, 47, 666–686. [Google Scholar] [CrossRef]
  20. Le-Ngoc, L.; McCallion, H. A cellular finite element model for the cutting of softwood across the grain. Int. J. Mech. Sci. 2000, 42, 2283–2301. [Google Scholar] [CrossRef]
  21. Rahman, S.; Ashraf, M.; Subhani, M.; Reiner, J. Comparison of continuum damage models for nonlinear finite element analysis of timber under tension in parallel and perpendicular to grain directions. Eur. J. Wood Prod. 2022, 80, 771–790. [Google Scholar] [CrossRef]
  22. Reiner, J. Finite element analysis combined with machine learning to simulate open-hole strength and impact tests of fibre-reinforced composites. Int. J. Comput. Methods 2023, 2241005. [Google Scholar] [CrossRef]
  23. Reiner, J.; Linden, N.; Vaziri, R.; Zobeiry, N.; Kramer, B. Bayesian parameter estimation for the inclusion of uncertainty in progressive damage simulation of composites. Compos. Struct. 2023, 321, 117257. [Google Scholar] [CrossRef]
  24. Fu, Y.-F.; Reiner, J. Objective and automated calibration of progressive damage models for finite element simulation of fiber reinforced composites. Compos. Struct. 2023, 307, 116618. [Google Scholar] [CrossRef]
  25. Reiner, J.; Fu, Y.-F. Data-driven parameter identification to simulate progressive damage in fiber reinforced laminates under low velocity impact. Int. J. Impact Eng. 2023, 180, 104711. [Google Scholar] [CrossRef]
  26. Livermore Software Technology Corporation. LS-Dyna Keyword User’s Manual–Volume I, version R9.0; Livermore Software Technology Corporation: Livermore, CA, USA, 2016. [Google Scholar]
  27. Williams, K.V.; Vaziri, R.; Poursartip, A. A physically based continuum damage mechanics model for thin laminated composite structures. Int. J. Solids Struct. 2003, 40, 2267–2300. [Google Scholar] [CrossRef]
  28. Forghani, A.; Zobeiry, N.; Poursartip, A.; Vaziri, R. A structural modelling framework for prediction of damage development and failure of composite laminates. J. Compos. Mater. 2013, 47, 2553–2573. [Google Scholar] [CrossRef]
  29. Forghani, A.; Poursartip, A.; Vaziri, R. An orthotropic non-local approach to modeling intra-laminar damage progression in laminated composites. Int. J. Solids Struct. 2019, 180, 160–175. [Google Scholar] [CrossRef]
  30. Bažant, Z.P.; Oh, B.H. Crack band theory for fracture of concrete. Matériaux Constr. 1983, 16, 155–177. [Google Scholar] [CrossRef]
  31. Livermore Software Technology Corporation. LS-OPT Keyword User’s Manual, version 7.0; Livermore Software Technology Corporation: Livermore, CA, USA, 2020. [Google Scholar]
  32. Green, B.; Wisnom, M.; Hallett, S. An experimental investigation into the tensile strength scaling of notched composites. Compos. Part A Appl. Sci. Manuf. 2007, 38, 867–878. [Google Scholar] [CrossRef]
  33. Lee, J.; Soutis, C. Measuring the notched compressive strength of composite laminates: Specimen size effects. Compos. Sci. Technol. 2008, 68, 2359–2366. [Google Scholar] [CrossRef]
  34. Reiner, J. A practical approach for the non-local simulation of progressive damage in quasi-isotropic fibre-reinforced composite laminates. Compos. Struct. 2021, 265, 113761. [Google Scholar] [CrossRef]
  35. Kirsch, G. Die theorie der elastizitat und die bedurfnisse der festigkeitslehre. Zantralblatt Verlin Dtsch. Ingenieure 1898, 42, 797–807. [Google Scholar]
  36. Fu, Y.-F.; Reiner, J. Deviation-based calibration for progressive damage analysis in pultruded glass fiber reinforced composites. Int. J. Damage Mech. 2022, 31, 1115–1138. [Google Scholar] [CrossRef]
  37. Zhang, P.; Hu, X.; Bui, T.Q.; Yao, W. Phase field modeling of fracture in fiber reinforced composite laminate. Int. J. Mech. Sci. 2019, 161, 105008. [Google Scholar] [CrossRef]
  38. Dhas, B.; Rahaman, M.M.; Akella, K.; Roy, D.; Reddy, J.N. A phase-field damage model for orthotropic materials and delamination in composites. J. Appl. Mech. 2018, 85, 011010. [Google Scholar] [CrossRef]
Figure 1. (a) Illustration of considered quasi-isotropic [ 90 / 45 / 0 / 45 ] s laminates and (b) ply-based stress-strain relationship as input into CODAM2 finite element model to simulate progressive damage in wood veneer laminates.
Applsci 14 04511 g001
Figure 2. Dimensions, finite element mesh, and boundary conditions of double-tapered compact tension test sample.
Applsci 14 04511 g002
Figure 3. Dimensions, finite element mesh, and boundary conditions of open-hole tension test sample.
Applsci 14 04511 g003
Figure 4. Evolution of mean squared error during GA optimisation to find suitable FE input parameters to simulate progressive damage in wood veneer laminates.
Applsci 14 04511 g004
Figure 5. Force vs. displacement results from GA-based optimisation of damage input parameters compared to target curves obtained from experiments [6] on quasi-isotropic [ 90 / 45 / 0 / 45 ] s beech veneer laminates subjected to compact tension tests.
Applsci 14 04511 g005
Figure 6. Comparison of crack length measurements at approximate displacement of 1.5 mm in compact tension tests between experimental observations [6] and simulation using optimal input parameters shown in Table 2.
Applsci 14 04511 g006
Figure 7. Comparison of damage in 0° ply after simulated open-hole tension tests of [ 90 / 45 / 0 / 45 ] s beech veneer laminates using different element sizes.
Applsci 14 04511 g007
Figure 8. Simulation results of size effect study in open-hole tension tests compared to experiments and theoretical upper and lower bounds [6].
Applsci 14 04511 g008
Figure 9. Comparison of simulated and experimental strain fields in open-hole tension test (OHT8) at 90% of maximum strength.
Applsci 14 04511 g009
Figure 10. Qualitative comparison of damage between simulations and experiments in open-hole tension tests with varying hole diameter.
Applsci 14 04511 g010
Figure 11. Force vs. displacement results from the last generation within the GA-based optimisation of damage input parameters compared to target curves obtained from experiments [6] on quasi-isotropic [ 90 / 45 / 0 / 45 ] s beech veneer laminates subjected to compact tension tests.
Applsci 14 04511 g011
Figure 12. Comparison of open-hole strength in OHT8 and OHT12 between the 24 FE simulations within the last GA generation and 20 experiments.
Applsci 14 04511 g012
Table 1. Elastic properties of uni-directional beech veneers [1].
Modulus Along the Grain E 1 (MPa)Modulus Perpendicular to the Grain E 2 (MPa)Shear Modulus G 12 (MPa)Poisson’s Ratio ν 12 (-)
14,000228010800.073
Table 2. Optimal damage input parameters found by GA-based calibration to simulate progressive damage in beech veneer laminates.
ε 1 i (-) ε 2 i (-) ε 1 s (-) ε 2 s (-)
0.00590.00650.0840.081
Table 3. Summary of investigated mesh sizes in combination with adjusted damage saturation strains according to Bazant’s crack band scaling in Equation (4).
Mesh SizeCharacteristic Length l * Damage Saturation Strains
ε 1 s (-) ε 2 s (-)
1 mm × 1 mm1.00.0840.081
0.5 mm × 0.5 mm0.50.1680.162
0.25 mm × 0.25 mm0.250.3360.324
Table 4. Simulated open-hole strength in [ 90 / 45 / 0 / 45 ] s beech veneer laminates with 8 mm hole diameter using different element sizes.
1 mm × 1 mm0.5 mm × 0.5 mm0.25 mm × 0.25 mm
26.40 MPa26.42 MPa26.47 MPa
Table 5. Dimensions of open-hole tension (OHT) test specimens [6].
NamingHole Diameter DGauge Width WGauge Length L D / W
OHT88 mm20 mm110 mm0.4
OHT1212 mm20 mm110 mm0.6
OHT1616 mm20 mm110 mm0.8
Table 6. Quantitative comparison of open-hole strength between experiments [6] and simulations with optimal CODAM2 input parameters shown in Table 2.
OHT8 *OHT12 *OHT16 **
Simulation26.4017.698.81
Experiments (CoV [%])25.53 (6.5)17.30 (6.9)9.18 (10.7)
Difference+3.4%+2.2%−4.0%
* based on 20 experiments, ** based on 3 experiments.
Table 7. Range of damage input parameters found by GA within last generation of calibration compared to optimal FE input parameters.
ε 1 i (-) ε 2 i (-) ε 1 s (-) ε 2 s (-)
Optimal results0.00590.00650.0840.081
Last GA generation0.0049–0.00960.0032–0.00820.077–0.1020.075–0.127
Table 8. Statistical comparison of mean values and coefficients of variation from experiments and FE simulations shown in Figure 12.
OHT8OHT12
Simulations (CoV [%])25.30 (12.2)17.00 (12.5)
Experiments (CoV [%])25.53 (6.5)17.30 (6.9)
Disclaimer/Publisher’s Note: The statements, opinions and data contained in all publications are solely those of the individual author(s) and contributor(s) and not of MDPI and/or the editor(s). MDPI and/or the editor(s) disclaim responsibility for any injury to people or property resulting from any ideas, methods, instructions or products referred to in the content.

