Article

A Few-Shot Object Detection Method for Endangered Species

by
Hongmei Yan
,
Xiaoman Ruan
*,
Daixian Zhu
,
Haoran Kong
and
Peixuan Liu
College of Communication and Information Engineering, Xi’an University of Science and Technology, Xi’an 710054, China
*
Author to whom correspondence should be addressed.
Appl. Sci. 2024, 14(11), 4443; https://doi.org/10.3390/app14114443
Submission received: 1 April 2024 / Revised: 18 May 2024 / Accepted: 21 May 2024 / Published: 23 May 2024
(This article belongs to the Topic Artificial Intelligence Models, Tools and Applications)

Abstract

:
Endangered species detection plays an important role in biodiversity conservation and is significant in maintaining ecological balance. Existing deep learning-based object detection methods are overly dependent on a large number of supervised samples, and building such endangered species datasets is usually costly. Aiming at the problems faced by endangered species detection, such as low accuracy and easy loss of location information, an efficient endangered species detection method with fewer samples is proposed to extend the few-shot object detection technique to the field of endangered species detection, which requires only a small number of training samples to obtain excellent detection results. First, SE-Res2Net is proposed to optimize the feature extraction capability. Secondly, an RPN network with multiple attention mechanism is proposed. Finally, for the classification confusion problem, a weighted prototype-based comparison branch is introduced to construct weighted category prototype vectors, which effectively improves the performance of the original classifier. Under the setting of 30 samples in the endangered species dataset, the average detection accuracy value of the method, mAP50, reaches 76.54%, which is 7.98% higher than that of the pre-improved FSCE method. This paper also compares the algorithm on the PASCOL VOC dataset, which is optimal and has good generalization ability compared to the other five algorithms.

1. Introduction

The crisis in biodiversity and the destruction of ecosystems continues to accelerate, leading to the extinction of many species and the collapse of ecosystems on a global scale [1]. Endangered species play an important role in maintaining ecological balance and are key in many scientific research fields, such as bionics, medicine, and pharmacology [2], so the detection and research of endangered animals are of great significance. Deep learning models have made significant progress, from the initial convolutional neural networks to today’s hierarchical and complex network structures, such as SSD [3], YOLO [4], RCNN [5], etc. Thangarasu [6] utilized AlexNet [7] and Inception v3 [8] to assess the KTH dataset, revealing the superior performance of deep learning algorithms over machine learning ones in animal species recognition. Pillai [9] introduced a transfer deep learning approach employing super-resolution Mask RCNN [10] for bird recognition, enhancing input image resolution using super-resolution technology. Borana [11] proposed a transfer learning strategy for training neural models, leveraging pre-trained Mask RCNN to extract bird ROIs from photos, followed by fine-tuning through transfer learning methods using datasets. WilDect-YOLO [12] significantly enhances endangered species detection accuracy by incorporating a residual block into YOLOv4’s [13] CSP-Darknet53 [14] backbone, alongside implementing spatial pyramid pooling and an improved path aggregation network. However, a common feature of these networks is their more significant reliance on large-scale data. Considering the limited number of endangered animals and the relative difficulty in obtaining their image data, while traditional object detection networks require large-scale data support, applications in endangered animal scenarios face multifaceted challenges.
In contrast, few-shot object detection (FSOD) [15,16,17] provides a solution designed to be able to quickly detect new objects from a very small number of annotated samples of new classes. FSOD is generally divided into two phases. Firstly, training on a base class dataset with rich annotation information is performed to build a base class detection model. Subsequently, the task of detecting new classes is accomplished with the minimally annotated new class dataset and the prior knowledge provided by the base class model. FSRW [18] is a lightweight meta-model based on YOLOv2 [19] that applies a reweighting module to emphasize the importance of the class prototype vectors and uses meta-features to facilitate the detection of new classes of objects. Fan [20] enhances information interaction by introducing attention to the Region Proposal Network (RPN), and multi-relationship modules are designed to facilitate the detection of new classes of objects by introducing the Attention-Region Proposal Network and multi-relational modules to enhance information interaction. Recent studies have shown that some fine-tuning-based few-shot object detection methods outperform meta-learning-based methods. TFA [21] proposes a simple transfer learning-based method to fine-tune only the last two fully connected layers of the detector to detect new objects. FSCE [22] proposes a few-shot object detection based on TFA by contrast proposal coding, which enhances the main region of interest (RoI) header by using a contrast branch. FSOD has demonstrated good detection performance and generalization ability on generalized datasets, such as Pascal VOC [23] and MS COCO [24]. However, in the case of endangered species with diverse and complex species, the highly similar feature details among some categories lead to misclassification problems in FSOD.
In endangered species object detection, deep learning models mainly face the following problems: firstly, the problem of inadequate feature extraction due to small sample data; secondly, the problem of easy loss of location information due to the low quality of region candidate frames generated by the RPN network; and lastly, the problem of classification confusion due to the high degree of similarity between endangered species classes. In this paper, we propose a few-shot object detection method AR-FSOD (few-shot object detection with attentional RPN and weighted prototype branching) to address the above problems, As shown in Figure 1, the training architecture is divided into two phases, starting with training on a sample of the base class that is sufficiently exemplary, and then learning to detect new objects from a small number of annotated samples of endangered species. and the main contributions of this study are as follows:
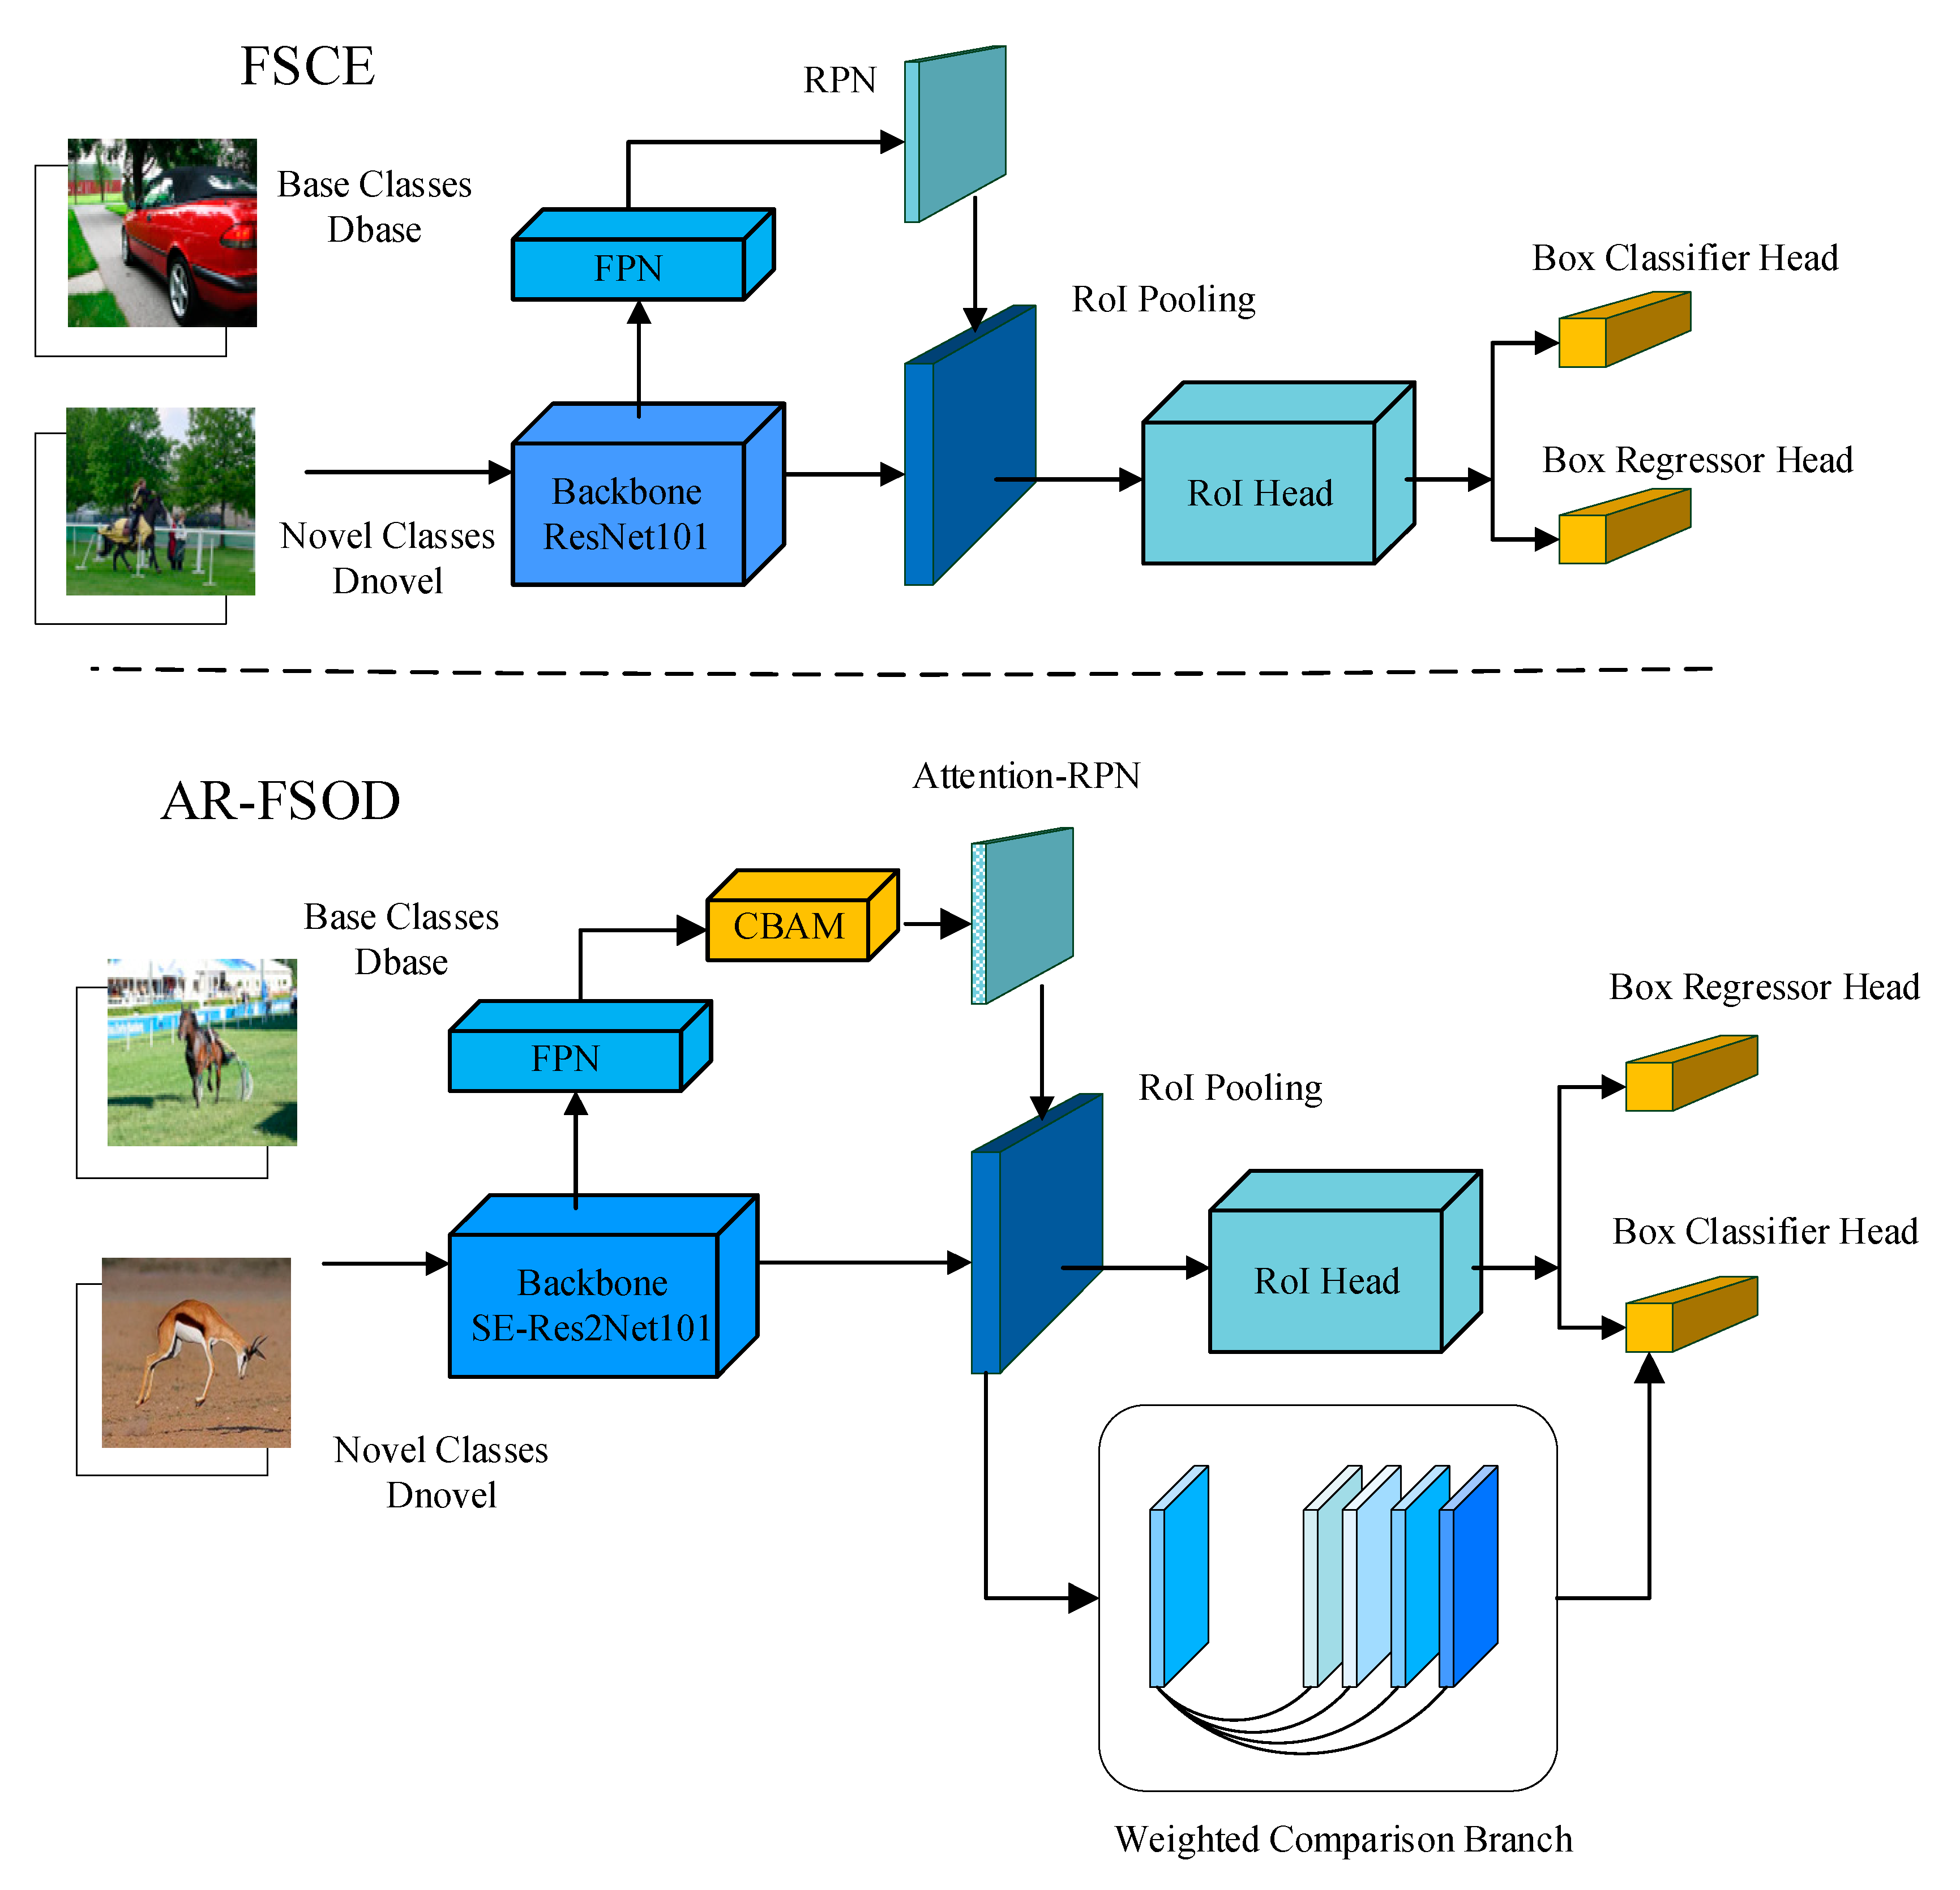
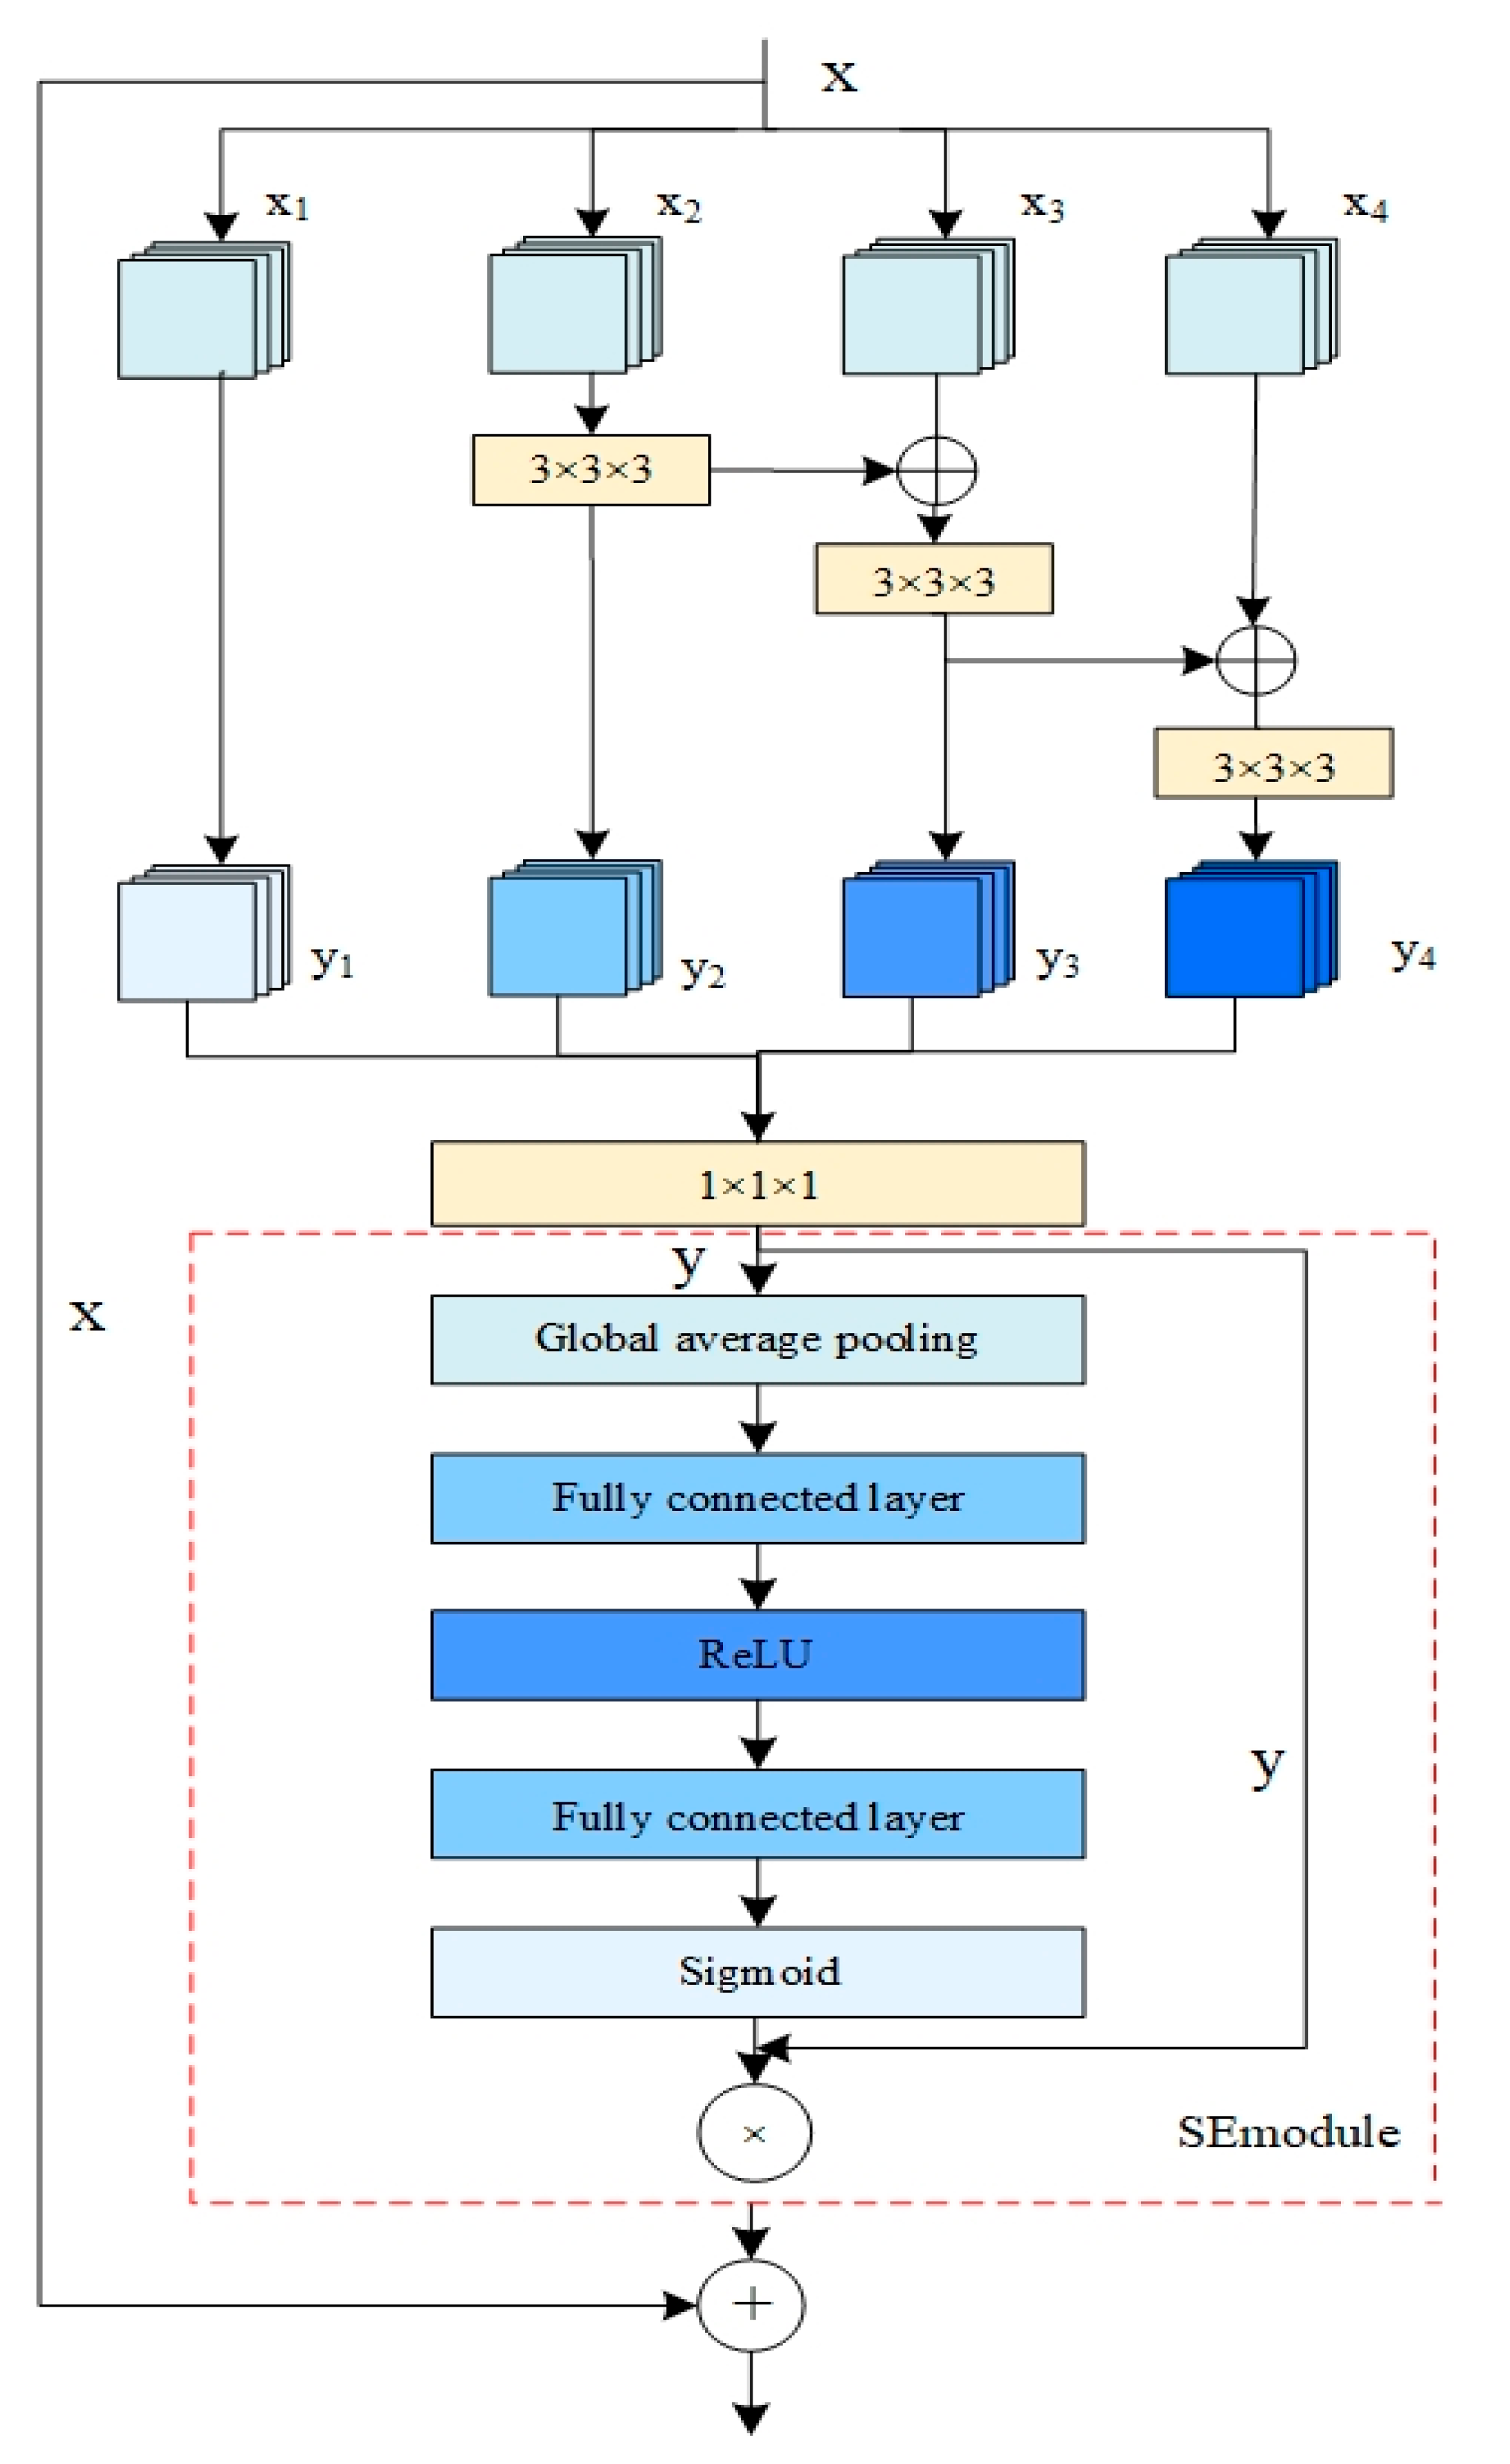
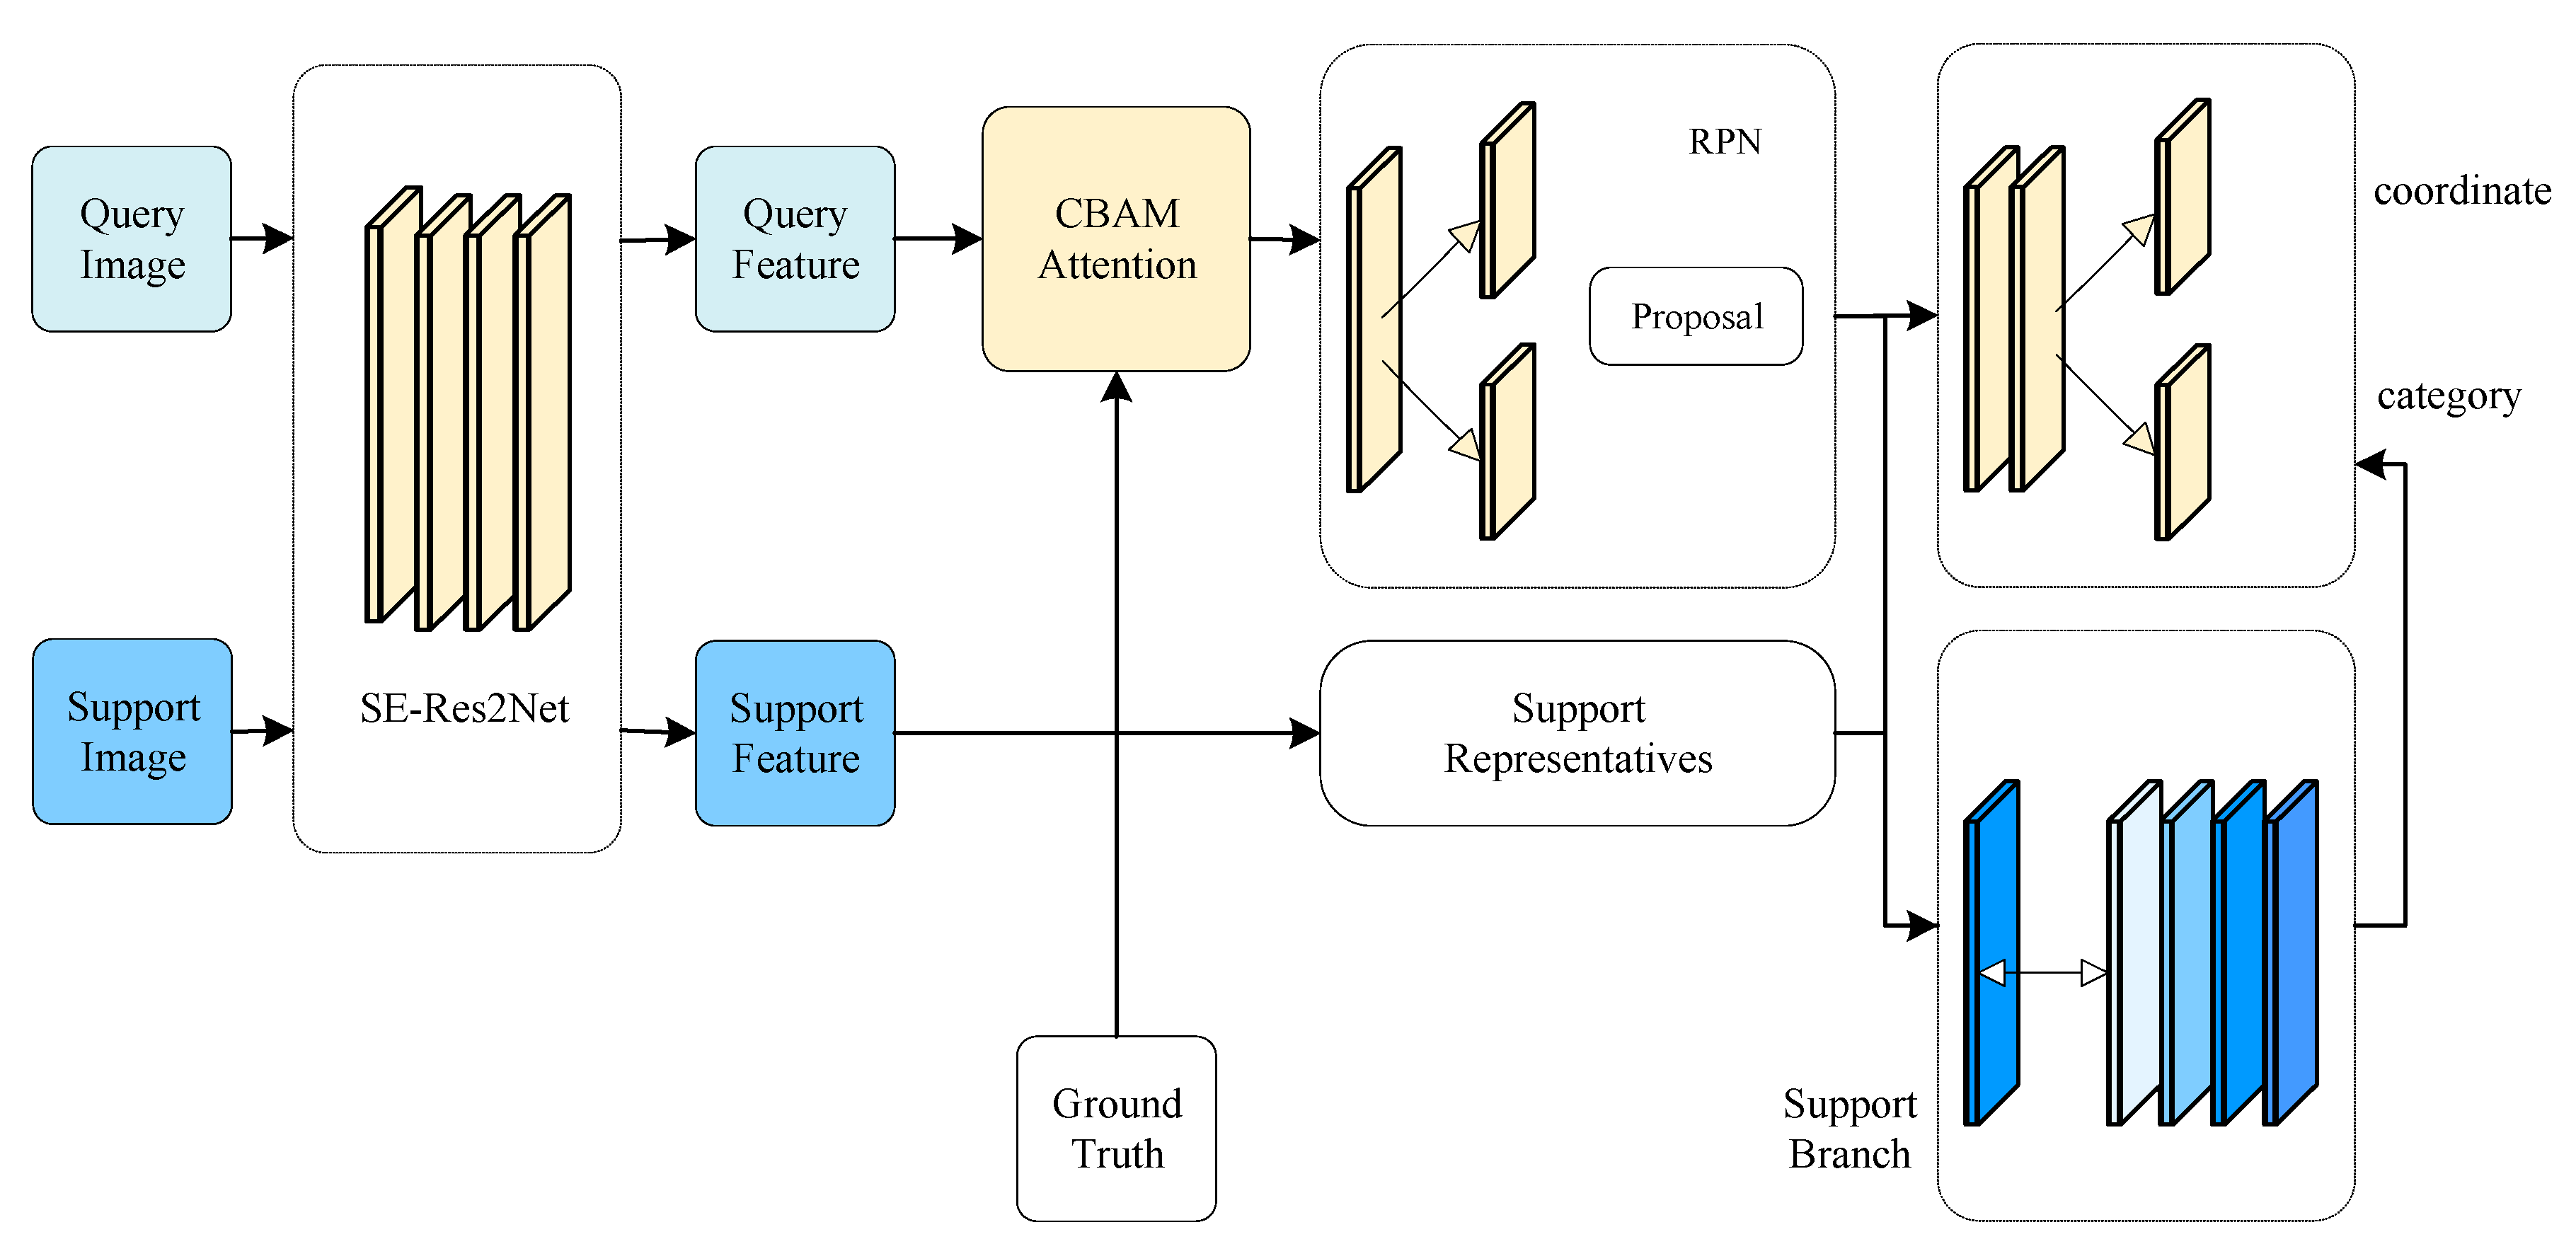
  • Improve the feature extraction network by adopting Res2Net, which has stronger fine-grained expression ability, and introduce Squeeze-and-Excitation Network (SENet) to solve the problem of inter-channel correlation reduction caused by channel grouping;
  • Introducing Convolutional Block Attention Module (CBAM) between the feature extraction network and the RPN, which assigns different weights to different features to optimize the feature expression. The attention feature maps obtained through deep inter-correlation are input into the RPN network to generate more accurate object suggestion frames;
  • Introducing a few-shot object detection scheme based on weighted prototype comparison branching and constructing weighted category prototype vectors using category prototype metric idea. By calculating the cosine similarity between the category prototypes and the query image, the performance of the original classifier is effectively improved;
  • We demonstrate the effectiveness of this method from different perspectives and achieve good detection accuracy on the Pascal VOC and endangered species datasets.
Figure 1. The training architecture consists of two phases: base training and a small amount of fine-tuning. Base training is performed using the Pascal VOC, while a small amount of fine-tuning is performed using a limited number of samples (K-shots) trained on the endangered species dataset.
Applsci 14 04443 g001

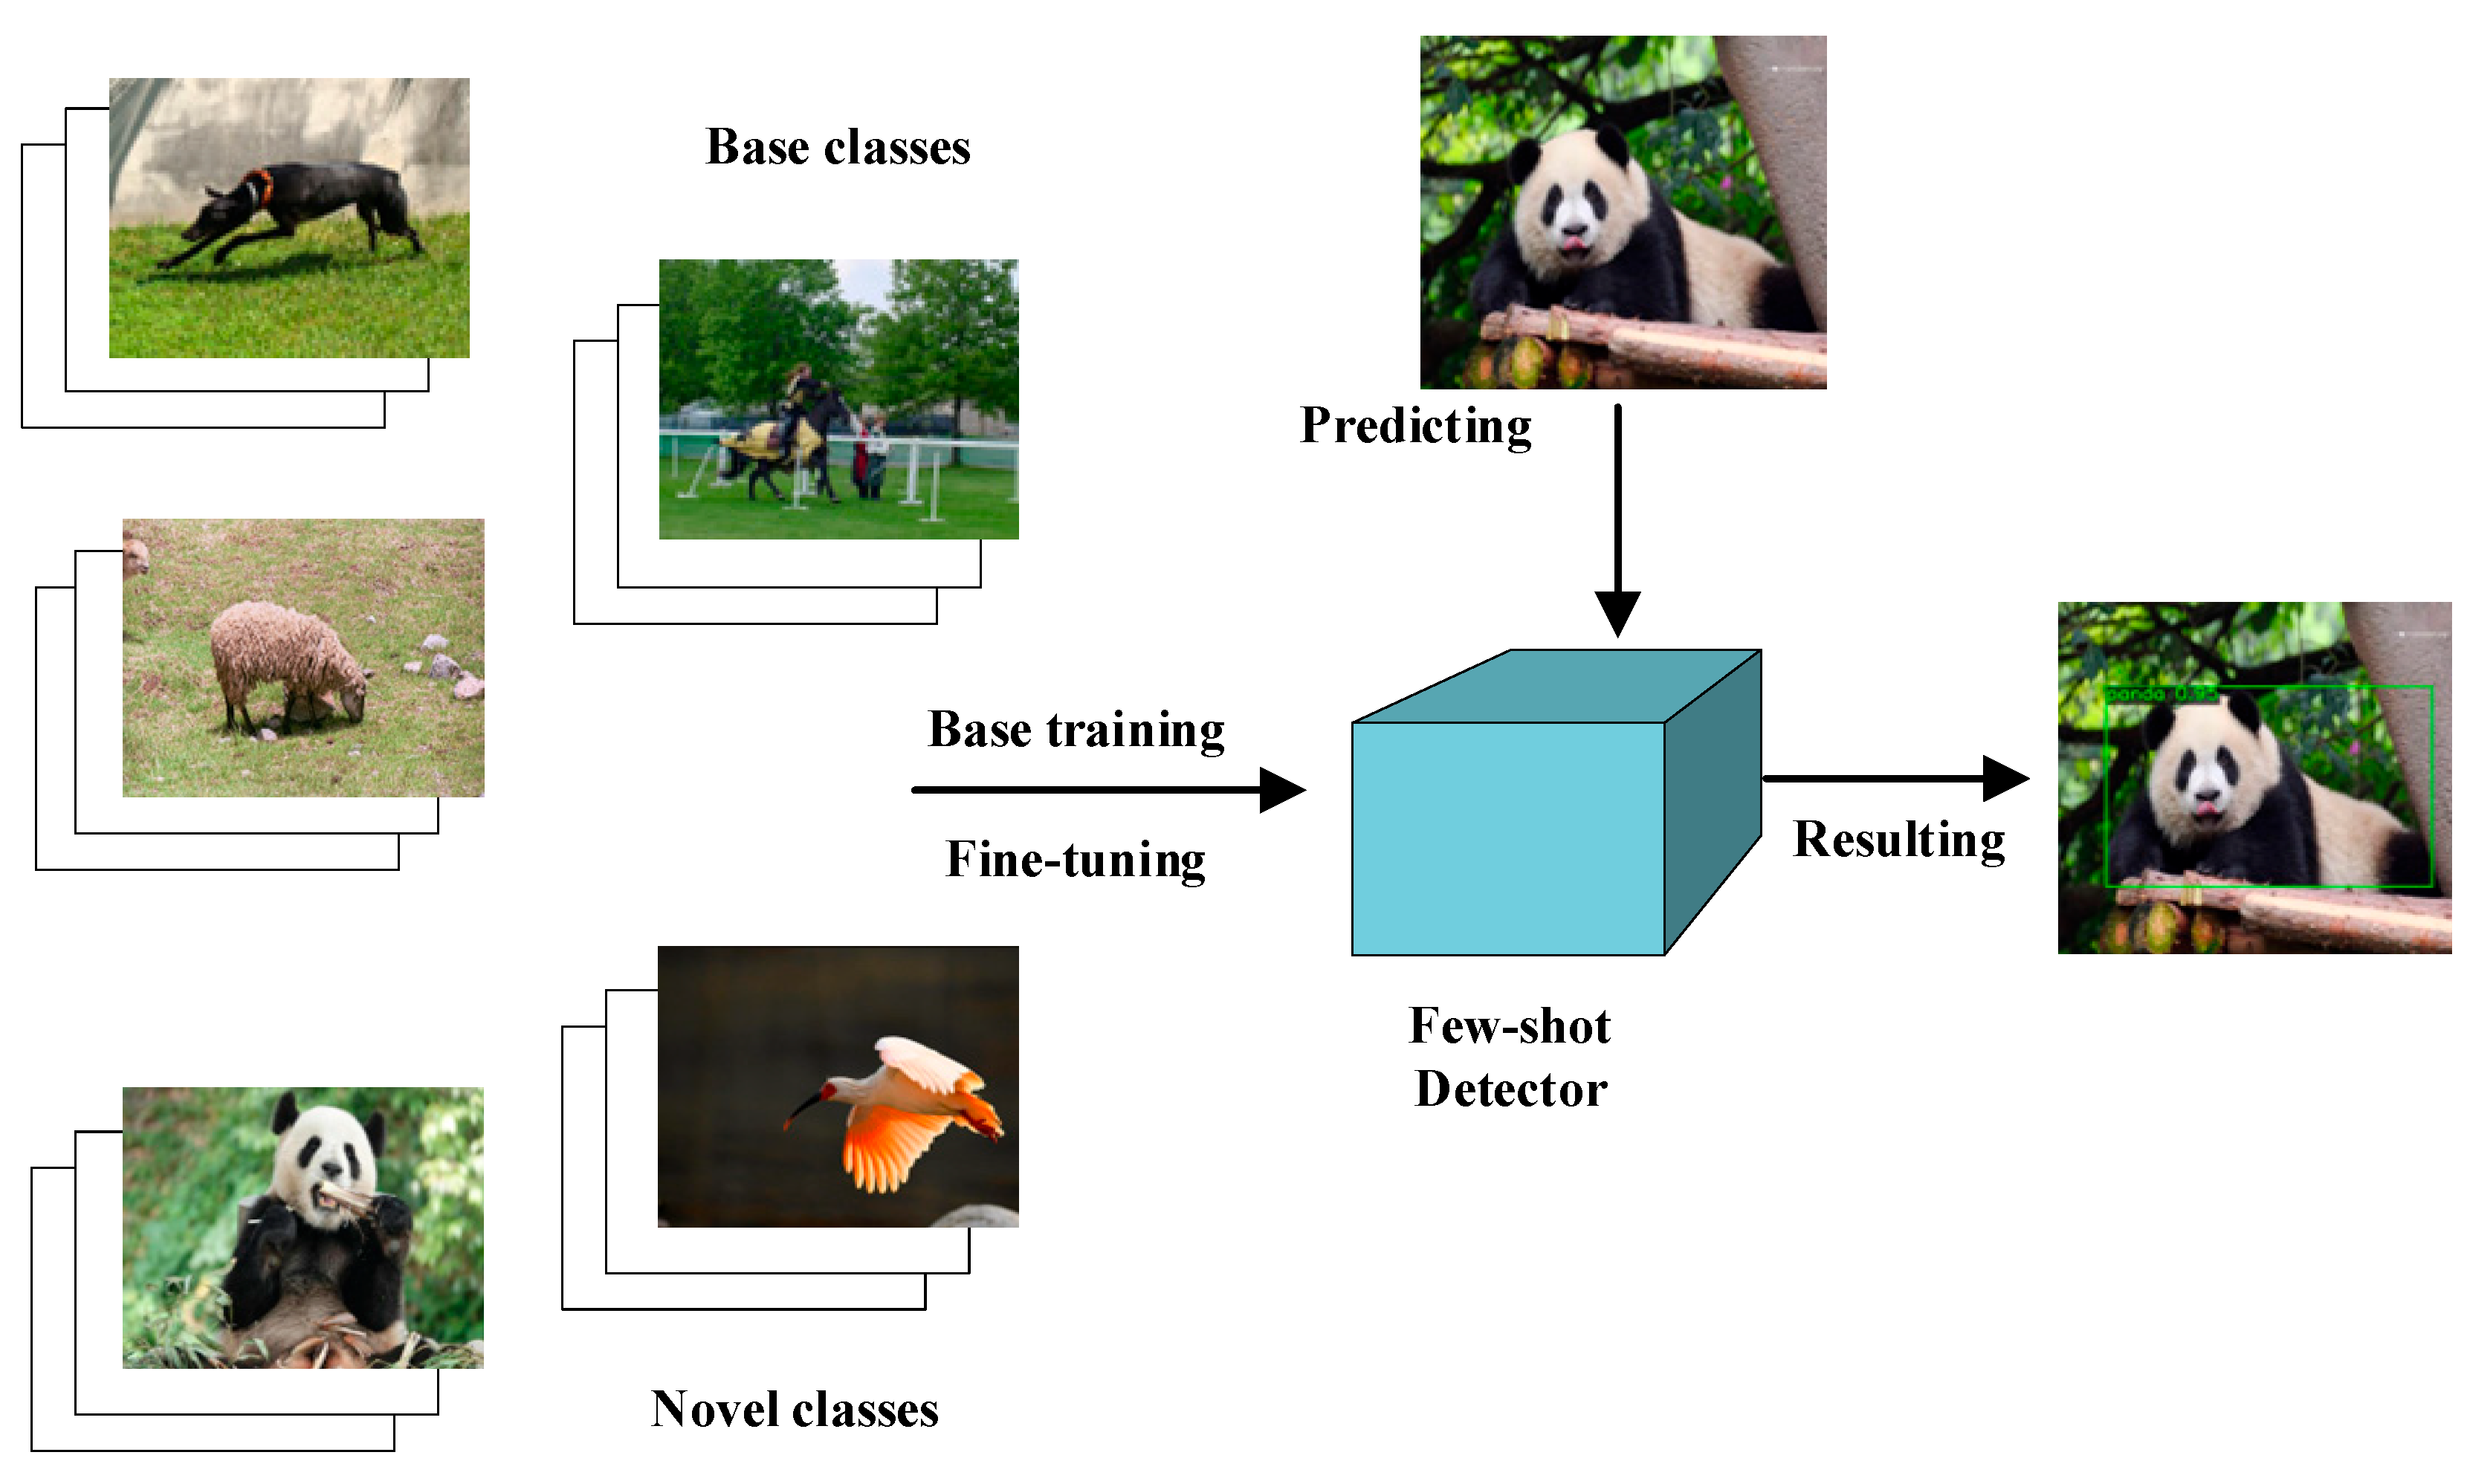
2. Fine-Tuning-Based Few-Shot Object Detection Algorithm

The goal of FSOD is to rapidly detect new objects from a novel small number of samples. The FSOD method in this paper follows a two-stage process shown in Figure 2, where the classes of the training dataset can be categorized into the base class ( C b a s e ) and the new class ( C n o v e l ). The whole process can be divided into two phases: first, learning transferable knowledge on the dataset D b a s e with abundant samples; then, fast adaptation on the new class dataset D n o v e l with only a small number of samples, usually only K-shot ( K s h o t ,   K 30 ). Note that the base class C b a s e and the new class C n o v e l are non-overlapping, C b a s e C n o v e l = ϕ , so that the generalization ability of the few-shot detector can be effectively evaluated. In this paper, we make improvements on the basis of the fine-tuning-based few-shot object detection method (FSCE), which not only has strong generalization ability but also outperforms the meta-learning-based and metric-learning-based few-shot object detection methods in terms of detection accuracy.
The FSCE method uses Faster R-CNN [25] as the base detection model. The Faster R-CNN network consists of a backbone ResNet, a Feature Pyramid Network (FPN), RPN, and a two-layer fully connected sub-network as the feature extractor. First, the Faster R CNN is trained using rich base class samples ( D t r a i n = D b a s e ). Then, the base detector is transferred to new instances of the balanced dataset and randomly sampled base instances ( D t r a i n = D b a s e D n o v e l ) by fine-tuning the base detector to the new samples. The backbone feature extractor is frozen during fine-tuning, randomly initialized weights are assigned to the box prediction network for the new classes, and only the classification and regression network, the last layer of the detection model, is fine-tuned.
Fine-tuning-based few-shot object detection methods have shown remarkable results in coping with few-shot object detection problems. However, when dealing with endangered species, which are full of diversity and complexity, the feature details between some classes are highly similar, which makes the detection often misclassified, and the detection accuracy is not high. This paper addresses the above problems by firstly improving the feature extraction network backbone, secondly proposing the Attention-RPN, and finally introducing a weighted prototype comparison branch at the head of RoI to increase the inter-class differences so that the detection of endangered species can still show a high detection accuracy with only a small number of samples. The improved detection network is shown in Figure 2.
Figure 2. Overall architecture of our proposed AR-FSOD.
Applsci 14 04443 g002

3. Improved Algorithms

3.1. Feature Extraction Network
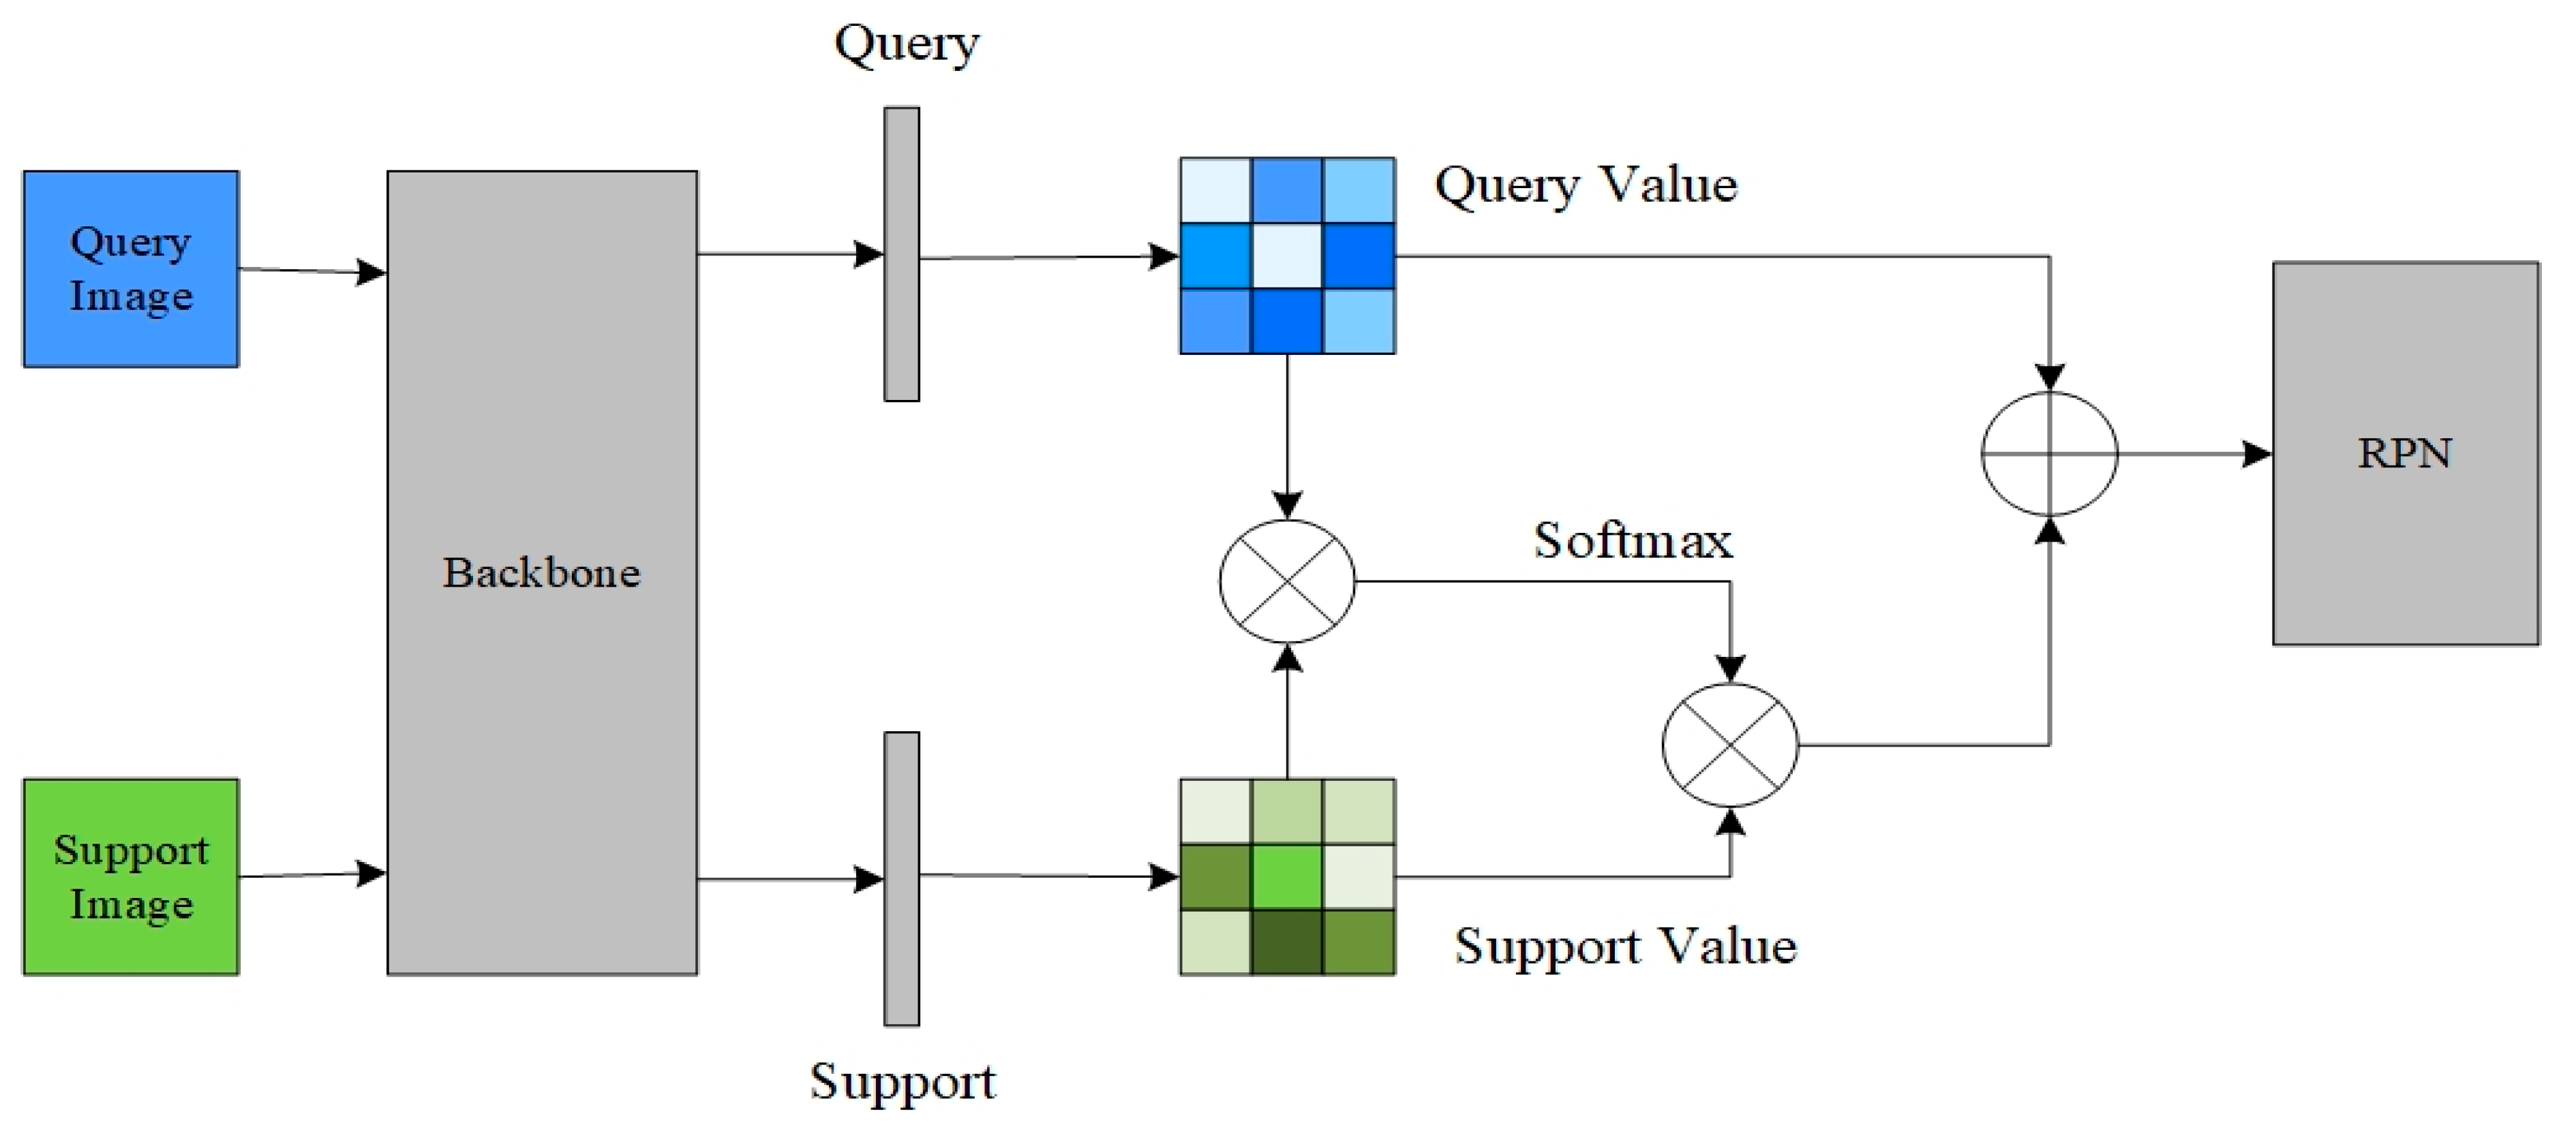
To address the problem of insufficient feature extraction in the detection framework due to the sparse number of new class samples, SE-Res2Net is proposed, which consists of the Res2Net [26] and SENet [27] modules. Res2Net is chosen as the backbone network for feature extraction improvement. The Res2Net module groups the feature channels and connects them hierarchically in the form of a set of filters, resulting in multiple, more detailed sensory fields. This architecture not only helps to capture fine-grained multiscale features but also increases the receptive fields of each network layer. However, the channel grouping of Res2Net modules will lead to the loss of inter-channel correlation, and to address this issue in this paper, we embed a Squeeze-and-Excitation block (SE block) into the residual connections. The SE block enables the feature network to recalibrate the feature responses between channels in an adaptive manner, thus enhancing the performance of the Res2Net module.
The architecture of the SENet model consists of a convolutional layer, a compression layer, and an excitation layer. The convolutional layer converts the input image into a hidden layer feature map, and the relationship between the channels is implied in the output feature map through fusion. The compression layer explicitly represents each channel with the help of neurons through a global pooling operation. The excitation layer adaptively learns the relationships between channels through two fully connected layers.
The network structure of SE-Res2Net is shown in Figure 3, where the output of the Res2Net module is passed into the SE module to reduce the effect of the loss of inter-channel correlation caused by channel grouping. In this module, the features after channel grouping are first compressed by global average pooling. Subsequently, the correlation between channels is fitted using a fully connected layer and finally normalized using a sigmoid activation function. The weight vector of the channels is denoted as f c = σ ( F C ( δ ( F C ( y ) ) ) , where F C denotes the fully connected layer, and ReLU and sigmoid denote the activation functions, respectively. The output of the SE module is realized by rescaling the original features on the channel dimension. Subsequently, the inputs of the residual module are output as weighted features through jump connections. The SE-Res2Net module proposed in this paper emphasizes on residual mapping and reduces the invalid features by redistributing the weights of the channel features, which helps the network to converge and improves the stability of the model.

3.2. Attention-RPN

RPN generates anchors while generating a region proposal. The softmax classifier determines whether the anchors are foreground or background and then adjusts the anchors through border regression to obtain an accurate region proposal. Since the RPN network obtained based on a large number of base training classes may generate many region proposals that are not related to the object when detecting new categories, the classification network is required to have a strong discriminative ability. At the same time, the RPN network needs to filter out not only the background but also the region proposals that are not part of the support set in order to reduce the number of region proposals and generate category-specific region proposals, thus improving the accuracy of the subsequent network.
In this paper, we propose a novel CBAM-Attention-RPN network that integrates the multiple attention mechanism with the RPN network. By using operations such as mean pooling, deep convolution, and cross-correlation operations, the support set and query set features are interrelated, and then these features are passed to the regression and classification layers of the RPN network for further processing. The support set image and the query image to be detected are regarded as the support image branch and the query image branch, respectively, and they are subsequently input into the backbone network with shared weights to obtain the corresponding support feature map and query feature map. Specifically, if the support set contains N categories, there exist N support image branches. The CBAM-Attention-RPN network utilizes a feature extraction network to extract features from the support set images and query set images in order to efficiently generate proposals for the target categories. First, the support feature map and the query feature map are input via a CBAM module [28], and the features are enhanced and suppressed via channel and spatial attention maps. Specific operations include a channel attention module, in which channel information is compressed through global maximum pooling and average pooling, channel weight coefficients are generated through neural networks, and finally, these coefficients are used to generate the channel attention feature maps. In the spatial attention module, global maximum pooling and average pooling of channel dimensions are performed on the features obtained through the channel attention module, and then the results are downscaled to one channel by convolution operation, the spatial weight coefficients are obtained by using the Sigmoid activation function, and the CBAM attention feature maps are generated through the channels and the spatial weight coefficients.
After the CBAM module generates the corresponding attention feature maps for supporting feature maps and query feature maps, the idea of attention mechanism is incorporated to further process the feature maps to construct Attention-RPN. The specific steps of Attention-RPN are shown in Figure 4. First, the generated query set attention feature Y is subjected to depth operation; then, the generated support set attention feature X is subjected to mean pooling and depth operation to form a 1 × 1 × C vector; then, this vector is used as a convolution kernel to perform deep inter-correlation operation with the query set feature to generate an attention feature graph reflecting the support set feature and query set feature correlation of the support set features and query set features G. Finally, the obtained attention feature map is input into the RPN network for generating region proposals.
The deep mutual correlation formula is as follows: for both input tensors, the support set features are denoted as S , and the query set features are denoted as Q . The output of deep cross-correlation Y is computed at each position ( i , j ) as follows:
Y i , j = m = 0 H q 1 n = 0 W q 1 c = 0 C 1 S i + m , j + n , c Q m , n , c
where ( i , j ) is the result of depth correlation at location ( i , j ) . S i + m , j + n , c is an element of the support set feature at location ( i + m , j + n ) on channel c . Q m , n , c is the element of the query set feature at location ( m , n ) on channel c . H q and W q are the height and width of the query set. C is the number of channels.
The results of deep mutual correlation are obtained by performing element-by-element product of the local regions of the support set and the query set and summing them up. Then, the softmax function is applied to the deep inter-correlation result to obtain a probability distribution indicating the weights at each position. The formula for applying softmax to the depth inter-correlation result Y is given below:
softmax ( Y ) i , j = e Y k , l k , l e Y k , l
where softmax ( Y ) i , j denotes the value after applying softmax at position ( i , j ) , which represents the weight at that position. e Y k , l denotes the exponent of Y i , j and the denominator part k , l e Y k , l denotes the sum of the exponents of all positions when applying softmax to the whole depth correlation result.

3.3. Weighted Prototype Comparison Branch

The FSCE method introduces contrast learning to improve the classification performance based on the fine-tuning-based TFA. Positive samples for contrast learning methods are often obtained from the samples themselves, while negative samples are randomly selected samples from the batch. However, this construction may face two problems. Firstly, in order to strengthen the discriminative ability of the model, it is often necessary to include enough negative samples in a batch, which has a high computational complexity. Secondly, the way of randomly selecting negative samples may take some actual similar samples as negative samples, which may affect the performance of the model.
Based on the above problems, this paper proposes a branch of comparative learning based on weighted category prototypes, which extracts the embedded features of an image by embedding the prototype network learning as shown in Figure 5. In this process, for each category in the support set image, its feature vector is computed as the prototype of that category by a weighted prototype network. The distance between the query image features and each prototype is determined for classification by using cosine similarity. This method utilizes weighted prototypes to represent the category features and distance metric for effective image classification. By obtaining the category prototypes through the post-weighted prototype network and then comparing them for learning, not only can the amount of computation be greatly reduced and the computational complexity be lowered, but similar samples will also not be used as negative samples to affect the effectiveness of the model.
The embedded prototype network [29] is designed to learn the category prototype features of an image, where the category prototypes are obtained by calculating the mean vector of features for each category of the support set image. However, this approach suffers from the problem that the computed mean vectors may not effectively represent the categories when the distribution of the support set samples varies widely or when there are low-quality samples. Specifically, the mean is computed in such a way that each sample feature contributes the same amount to the representation vector when, in fact, different sample features should have different contributions. The best sample features should be more consistent with the feature distribution of the query image and, thus, they should have a greater contribution. To solve this problem, a weighted method of computing class prototypes is introduced in the training phase. This method uses a one-dimensional Gaussian kernel function to compute the weighting coefficients of the sample features of each support set to ensure better clustering of the extracted sample features of the same class. The implementation is detailed in Equation (3):
γ i j = exp x q x i j 2 2 σ i 2 j = 1 K exp x q x i j 2 2 σ i 2 , j = 1 , , K , i = 1 , , M
where, x i j denotes the j -th support sample for the i -th category, x q denotes the query sample for the category i , and σ i denotes the Gaussian function width and takes the value 0.1.
After obtaining the weighting coefficients of each support set feature, this paper calculates the prototype of the class by a kind of weighting. c ^ i is the prototype of the first i class calculated by weighting, and the specific implementation is shown in Equation (4):
c ^ i = j = 1 K γ i j x i j j = 1 K γ i j , i = 1 , , M
Then, the cosine similarity s i m i cos between the query branch z i and the weighted category prototype c ^ i is calculated, as shown in Equation (5):
s i m i cos = z i c ^ i z i c ^ i
After calculating the cosine similarity between the input query image and the prototype vectors of each category, the s i m i obtained from this auxiliary branch is summed up with the prediction result of the main branch classifier s i with certain weights, and w is the pre-set hyperparameters.
S c ^ i = w s i + ( 1 w ) s i m i cos
In order to guide the model optimization to improve the classification performance, this chapter designs the loss function applicable to the algorithm, and the total loss function includes several components in the fine-tuning stage. Firstly, the regression loss of RPN L r p n , the cross-entropy loss of bounding box classifier L c l s , as well as the smooth-L1 loss of bounding box regression L r e g and the improved contrast loss L c s , by combining the above losses together, end-to-end training is achieved. The specific form is shown in Equation (7):
L = L r p n + L c l s + L r e g + λ L c s
where L c s is the cross-entropy loss added by the weighted prototype comparison branching module, the expression of which is shown in Equation (8). With this loss, the scale of classification probability can be made to expand the inter-class gap between prototypes, making the distance between the same class more compact and obtaining a farther cosine distance between different classes. The λ in the formula is used to adjust the weighting between the losses, which was set to 0.2 in the experiments.
L c s = m = 1 M N f x m a f c m p 2 2 f x m a f c m n 2 2 + α
where x m a represents the query sample, c m p and c m n represent the positive and negative class-weighted prototypes, respectively, and α is the margin.

4. Experimental Results and Analysis

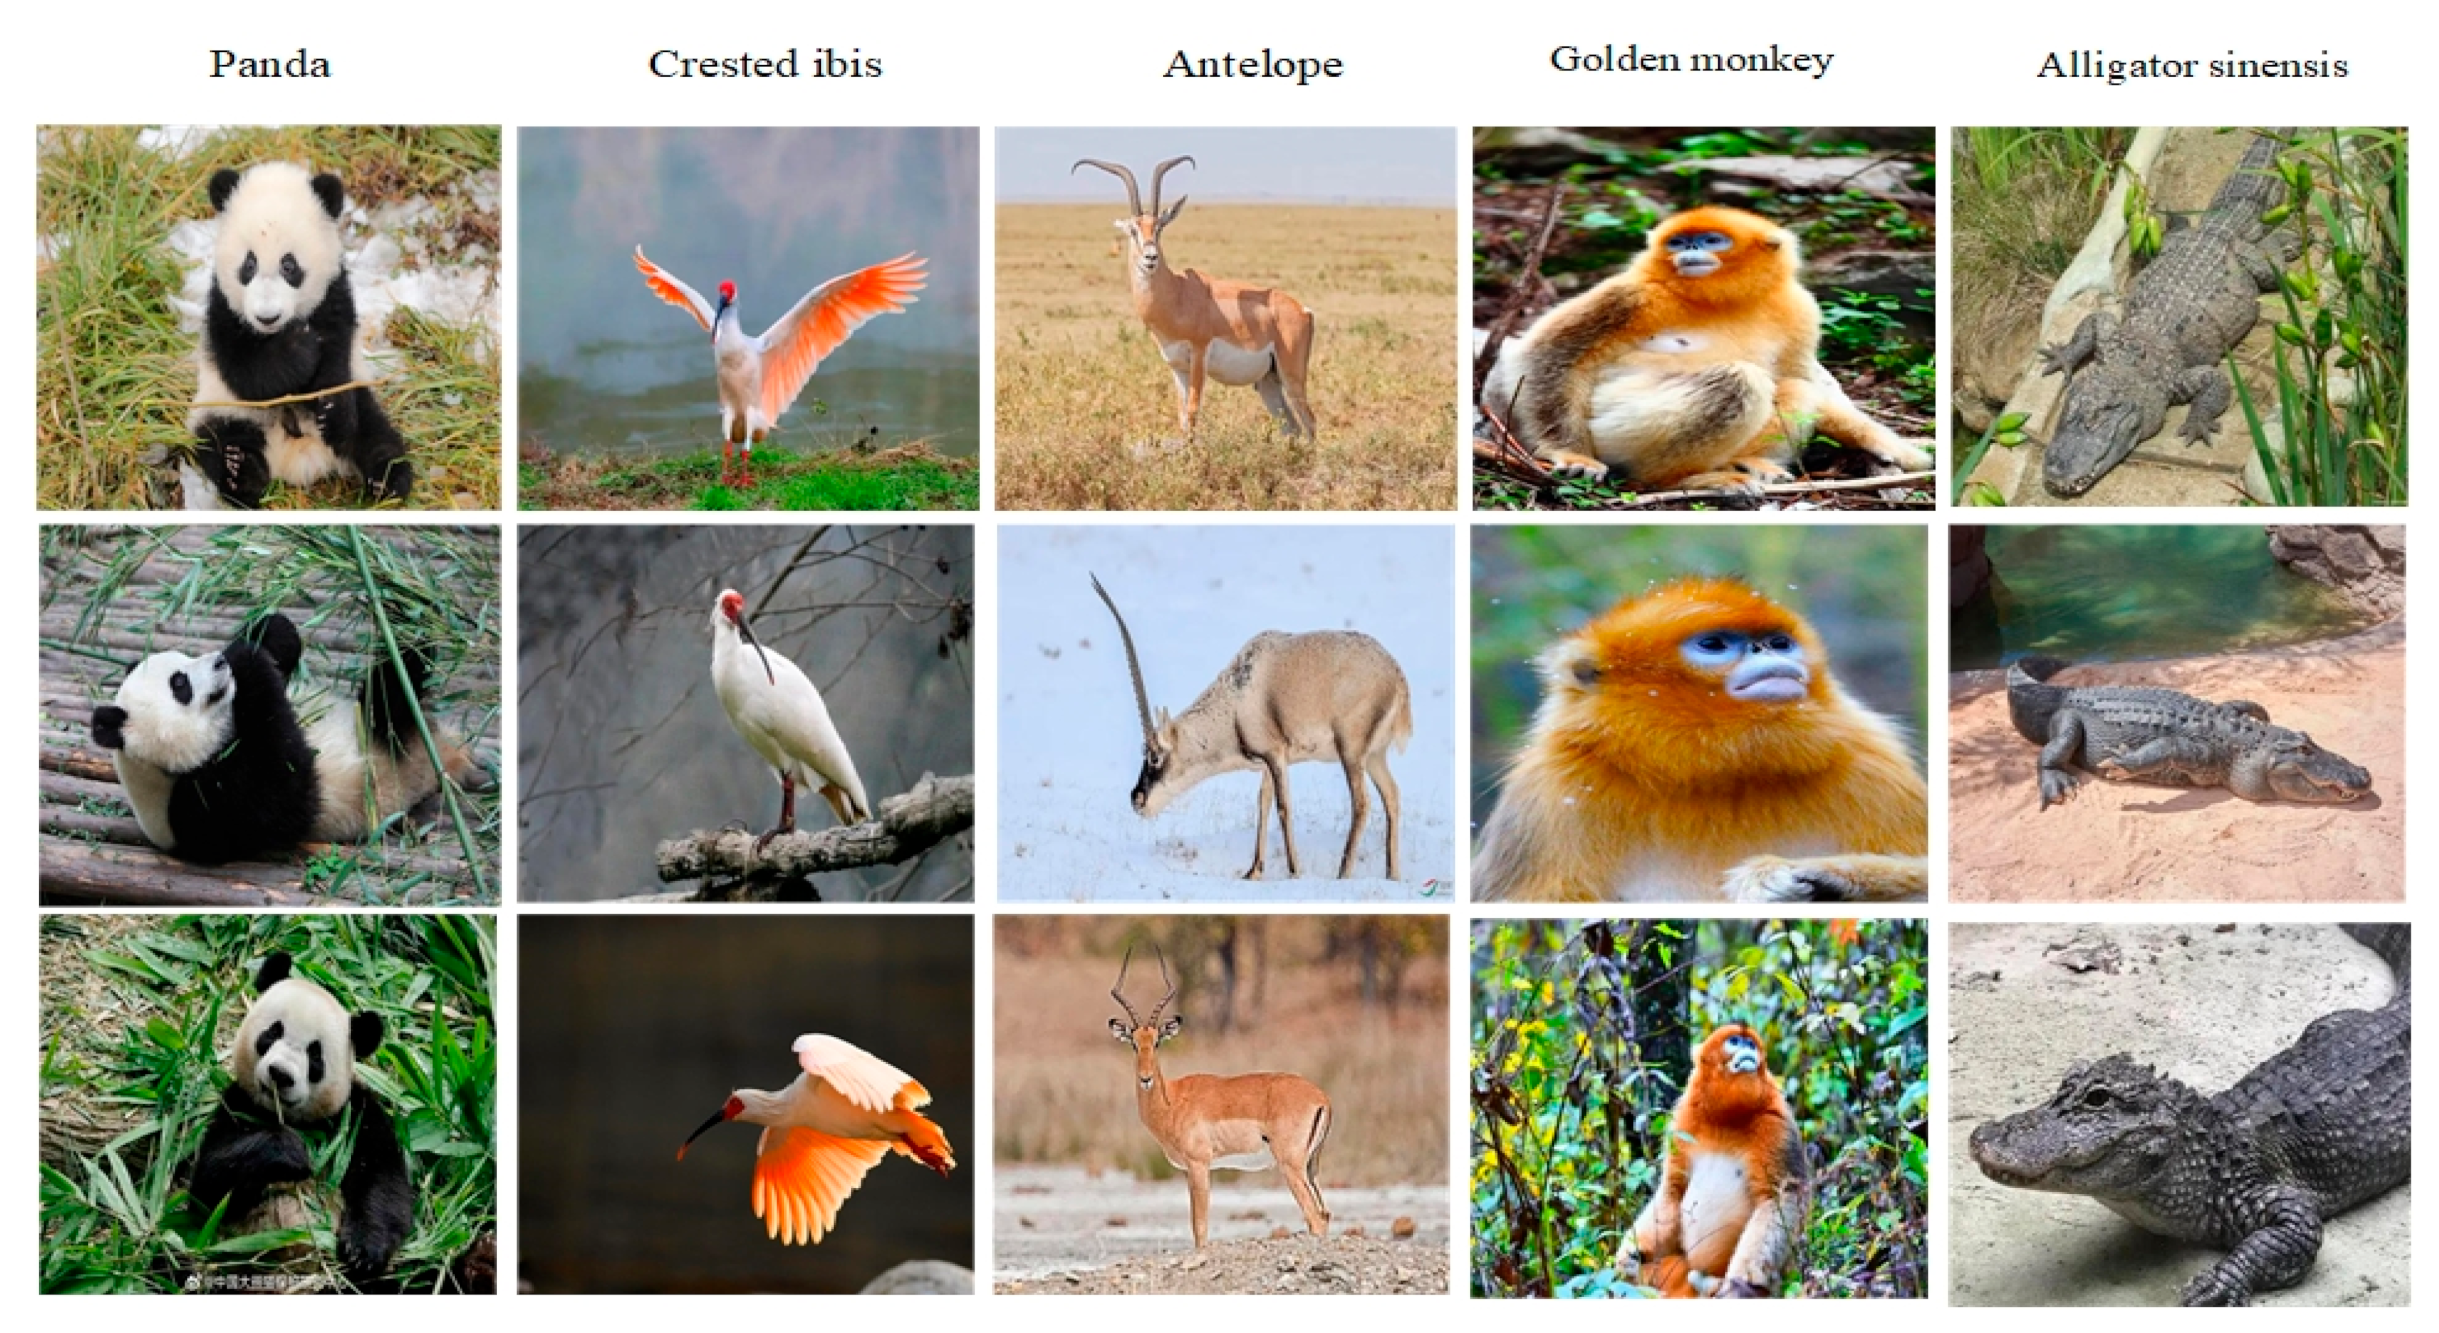
4.1. Experimental Datasets

In this paper, experimental validation is carried out on the self-constructed dataset ESD (endangered species datasets) and the public dataset Pascol VOC to evaluate the network performance. ESD covers five endangered animals, including giant panda, crested ibis, antelope, golden monkey, and alligator sinensis. A part of the image of ESD is shown in Figure 6.
The Pascol VOC dataset has a total of 20 classes, and the Pascol VOC dataset is divided into base class data and new class data according to the division in FSCE, and the division scheme is shown in Table 1. We selected fifteen categories from Pascal VOC split1 as base categories, plus five endangered animal categories, for a total of twenty categories. The two sets of categories were divided according to a 15:5 ratio, and it was ensured that the base and endangered animal categories were independent of each other and that there was no overlap of categories. In order to test and validate the effect of different shot divisions on the detection task, five divisions of 1-shot, 3-shot, 5-shot, 10-shot, and 30-shot were performed on the images of each category.
Figure 6. Examples of endangered species datasets.
Applsci 14 04443 g006

4.2. Evaluation Indicators

All of our experiments were implemented using PyTorch on 8 NVIDIA 2080Ti workstations. Where CUDA version is 10.2, CUDNN version is 8.1, Python version is 3.8, and PyTorch version is 1.10. A two-stage training method is used for training; the first stage trains Backbone without freezing the parameters of the network modules and uses all the images of the base class, with the Batch-Size set to 16. The second stage is fine-tuning, which freezes all the parameters of Backbone while keeping the parameters of the RPN module based on the attentional mechanism, the Box Classifier, and the parameters of the Box Regressor module. The training time was 3 h and 12 min, and the testing time was 8 min, in which the average time per image was 0.31 s. The specific parameters of the model are shown in Table 2.
IOU (intersection-over-union) is a metric used in target detection that refers to the overlap rate of the generated candidate frames with the true labeled frames. The mathematical formula is shown in Equation (9):
I O U = a r e a ( C ) a r e a ( G ) a r e a ( C ) a r e a ( G )
where a r e a ( C ) denotes the generated candidate frame area; a r e a ( G ) denotes the original labeled frame area.
In target detection, the classification targets are divided into two categories: positive and negative cases. TPs (true positives) are true positive cases, which indicate the number of samples that are actually positive and correctly categorized as positive cases by the classifier; FPs (false positives) are false positive cases, which indicate the number of samples that are actually negative but incorrectly categorized as positive by the classifier; and FNs (false negatives) are the number of samples that are actually negative but incorrectly categorized as positive cases by the classifier. Recall, also known as the check rate, is the ratio of the number of true cases to the number of true positive cases, and the mathematical formula is shown in Equation (10):
R e c a l l = T P T P + F N
Precision, also known as the check rate, is the ratio of the number of true instances to the number of instances classified as positive instances by the classifier and is mathematically formulated as Equation (11):
P r e c i s i o n = T P T P + F P
AP (average precision) is also known as the average precision rate, and the mathematical formula is shown in Equation (12). In general, the higher AP is, the better the classifier is in general, where AP50 denotes the value of AP when the IOU threshold is 0.5.
A P = 0 1 p ( r ) d r
In order to evaluate the generalization ability of the AR-FSOD, experimental validation on the Pascal VOC dataset is also conducted. In this paper, Q a is designed as an evaluation metric to measure the quality of the region proposals generated by the RPN network, which is mainly based on the confidence level and the size of the overlap between these proposals and the actual labeled anchors. The specific calculation formula is as follows:
Q a = 1 N i N B B o x i d e c B B o x G T B B o x i d e c B B o x G T × p r o b i
where i is the subscript index of the anchor, N is the number of anchors, B B o x i d e c is the predicted anchor, B B o x G T is the labeled anchor with its maximum overlapping region, and p r o b i is the confidence level of the anchor. Q a is the average of the product of confidence level and IoU.

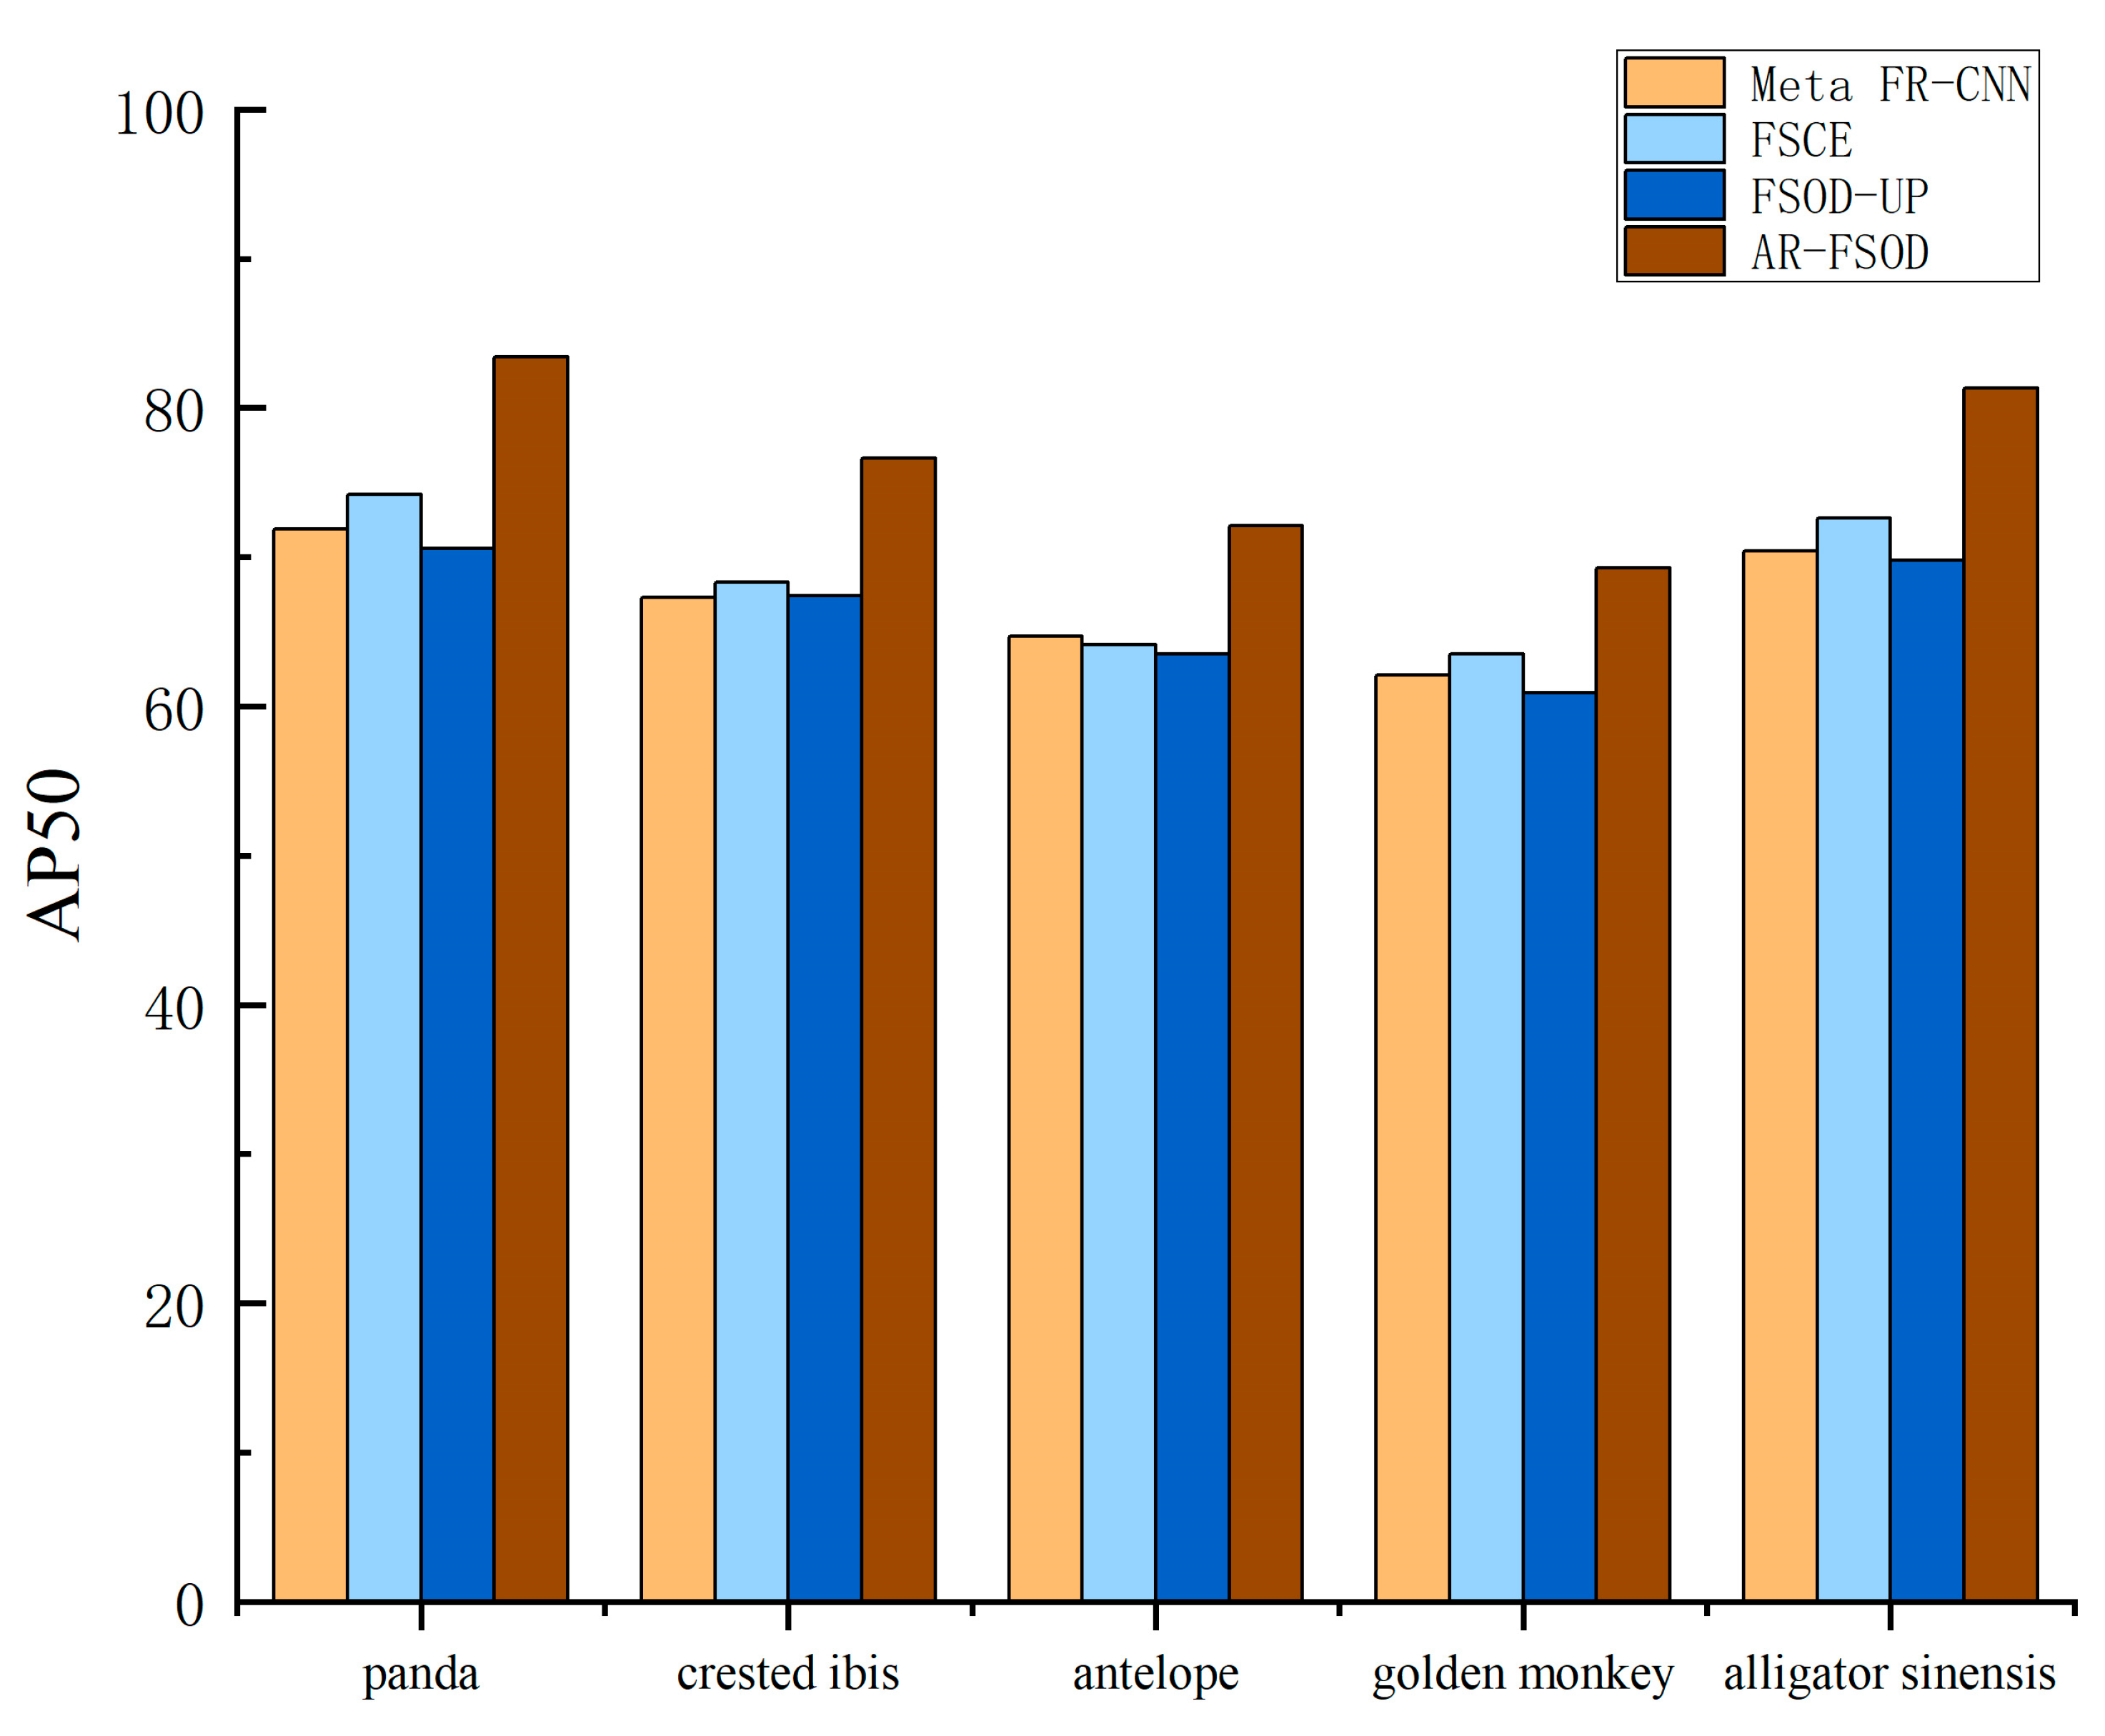
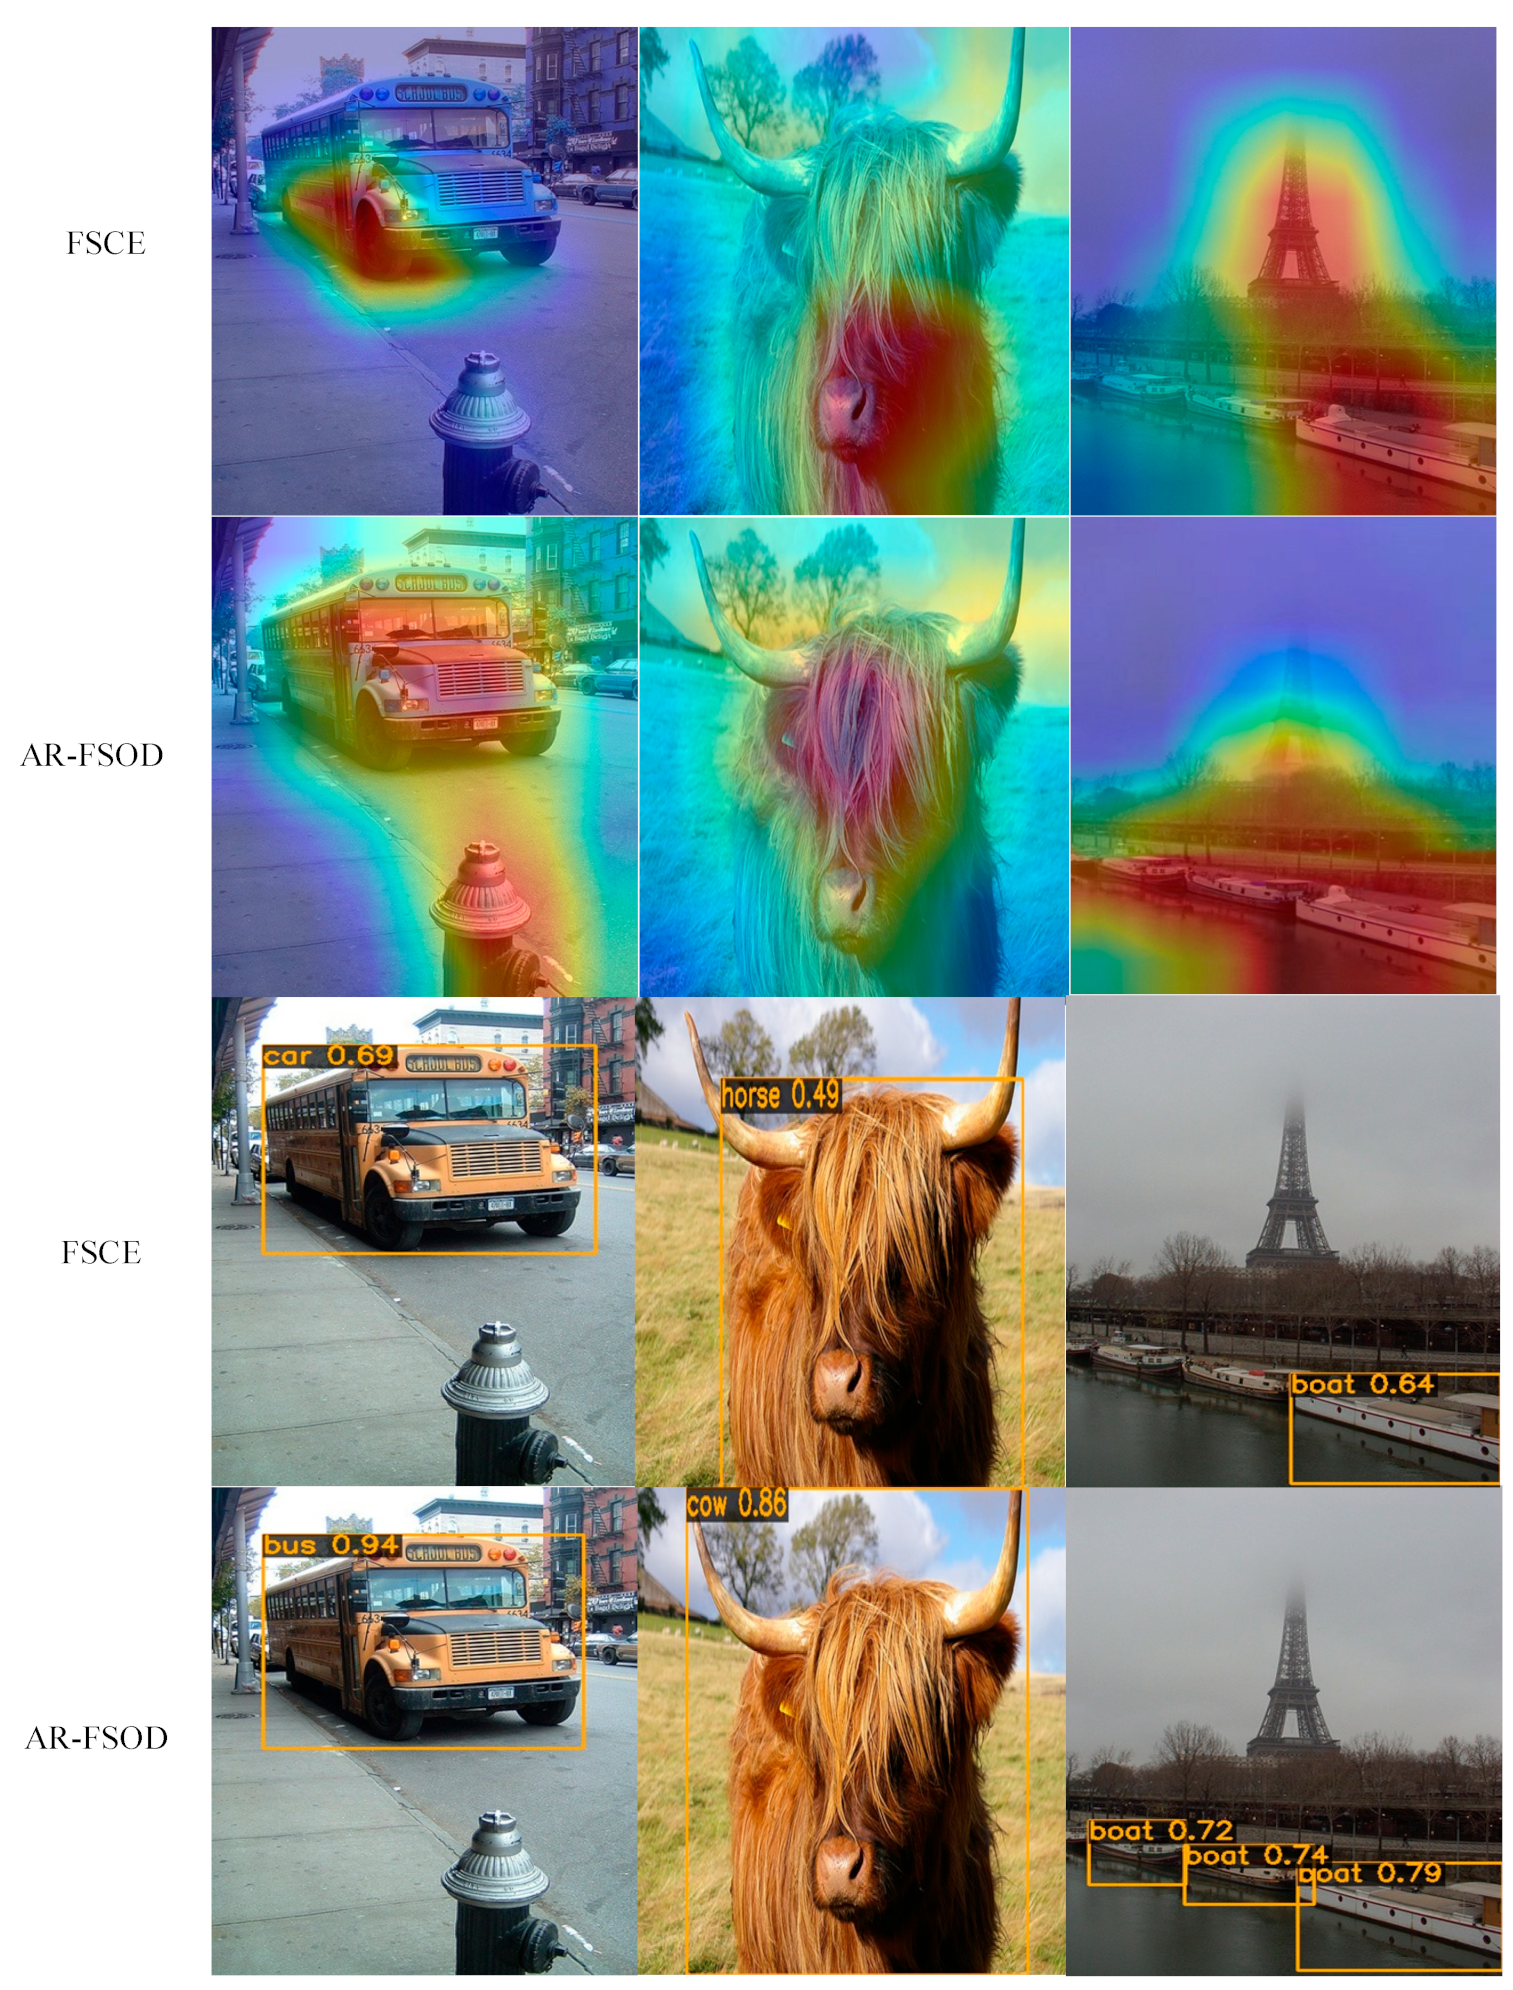
4.3. Results of the Experiment

The experimental results are shown in Table 3. AR-FSOD performs well in the high-shot task, especially in 10-shot and 30-shot, with accuracy up to 60–80%.
The results of AR-FSOD and meta-learning-based and fine-tuning-based few-shot object detection methods for each new category of endangered animal detection in the 30-shot scenario are shown in Figure 7. AR-FSOD achieves significant improvement in detection effectiveness in each category relative to the other three algorithms. This indicates that the method in this paper enables the detector to better utilize the existing information and improve the detection performance for endangered species.
In order to evaluate the detection performance of the model on endangered animals more comprehensively, this paper carries out a visual analysis of the model network features, and the results are shown in Figure 8. The first row shows the original image of the endangered animal, the second row shows the thermogram obtained by FSCE, and the lower row shows the thermogram obtained by AR-FSOD. In the first column for the “panda”, the fine-tuning training only shows scattered activation areas with lighter highlights, while the feature map after the attention mechanism is more focused on the center of the object, with darker highlights, showing stronger activation. The “created_ibis” in the second column also shows dispersed activation areas, most of which are focused on the background area, while the activation positions are more clustered and concentrated on the target area after the attention mechanism module. Comparing the two previous figures, the highlighted areas of “antelope” in the third column and “alligator sinensis” in the fifth column in the fine-tuning stage of the heat map are skewed to one side, which cannot be fully represented, whereas, through the adjustment of the attention mechanism, we can obtain more complete coverage of the entire heat map. By adjusting the attention mechanism, a more complete heat map of the highlighted area covering the whole object can be obtained. In the fourth column, the highlighted area of “golden monkey” in the fine-tuned heat map is more scattered, and even part of it is outside of the object, while the activated area in the heat map improved by this paper is closer to the center of the object, and the coverage is closer to the ideal state. In summary, compared with the feature maps before the improvement, the improved feature thermograms of AR-FSOD are more expressive of the foreground object, which helps the RPN to generate region proposals with higher quality.
We visualize the detection results of the model and compare them with the FSCE model, which is shown in Figure 9. As shown in the figure, the first line on the left side shows that the final object detection frame, although focused on the center of the object, has low confidence as the coordinates cover only part of the actual object’s position due to the object being partially occluded. In the experimental output of AR-FSOD, the right-hand side shows a substantially correct detection frame with improved confidence in the detection. For the second row on the left, “created_ibis”, and the third row on the left, “antelope”, the FSCE model suffers from misclassification and low confidence due to the similarity of the base classes “bird” and “cow” in a large amount of data, and the similarity between the object and the sample-rich base class, which causes the network to prefer judging the object as the base class. The “alligator sinensis” in the second row on the right is extremely similar to the background, and the labeling box of the FSCE model cannot accurately label the object; however, AR-FSOD improves the classification confidence by adjusting the regression coordinates to make it closer to the actual labeling. In the third row of “antelope” on the right, the FSCE model not only misclassifies it as the base class “cow” but also misses it when the object is occluded by the FSCE model, while the AR-FSOD can correctly detect it. The attention mechanism module in this paper’s model can generate more expressive feature maps to a certain extent, which effectively improves the quality of the output results of the upstream network and, at the same time, the weighted prototype comparison branch proposed in this paper effectively reduces the problem of classification confusion, which demonstrates that AR-FSOD has certain advantages in the performance of endangered species object detection.
Several experiments are conducted on the Pascal VOC dataset, and the quality of the region proposal anchor is calculated separately by using the dataset division method of the literature [22], and the experimental results are averaged, which are shown in Table 4. It can be seen that the quality of the prediction anchors generated by the RPN based on the multiple-attention mechanism proposed in this paper is all improved. The quality of the prediction anchors of both FSCE and the AR-FSOD are higher in division scheme I because in this division scheme, the similarity between the new class and the base class is higher, and the RPN has already possessed the corresponding learning ability for the targets of the new class and is thus able to generate higher quality region proposal anchors. The improvement of the multiple attention mechanism module proposed in this paper is not very obvious. In the second segmentation scheme, the low similarity between the new class and the base class causes RPN to have difficulty in obtaining useful information in new class detection, which produces a large number of prediction anchors that are not related to the new class object, resulting in a low quality of region proposal anchors. In contrast, AR-FSOD substantially improves the quality of prediction frames by introducing the RPN with multiple attention mechanism. In the third segmentation scheme, the new class is more similar to the base class, and the method in this paper has some improvement, but not as obvious as the improvement of the second segmentation scheme. By quantifying the quality of the anchors generated in the RPN network, it can be seen that the IoU and confidence level of the anchors based on the multiple attention mechanism with the actual labeling of the object have been improved, which provides higher-quality region proposal anchors for the follow-up.
In Table 5, we report the results of the AR-FSOD on novel classes of the Pascal VOC dataset. According to Table 3, AR-FSOD achieves the highest in nine out of a total of fifteen comparisons. There is only a slight gap relative to SRR-FSD for the very few-shot conditions of 1-shot and 2-shot for split1 and split2. This proves that AR-FSOD has significantly improved the detection accuracy of new classes. In addition, it can be observed from Table 3 that AP50 does not increase linearly with the number of new class images provided. Taking Pascal VOC Split1 as an example, when the number of new class support images increases from one to five, the AP50 improves by 17.5%; however, when the number of support images increases from five to ten, the AP50 only improves from 63.7 to 67.5%, which shows a non-linear growth. This phenomenon mainly stems from the limited number of samples at the fine-tuning stage, and the model fails to effectively utilize the support set information. However, with the gradual increase in the number of samples, the advantages of the attention mechanism and the weighted prototype comparison branch gradually appear, and the recognition rate of the new category increases significantly.
In addition, a visual comparison between AR-FSOD and FSCE models is carried out in this paper, and the results are shown in Figure 10. For “bus”, which is a small sample category, it is more difficult to detect because of its high similarity with the base class object “car”. In the first row of results on the left, although the final object detection frame is located in the center of the object, the coordinates only cover part of the actual object, and there are classification errors and low confidence. In the experimental output of AR-FSOD, the detection frame is basically correct, and the correct classification is achieved. For the second row of “cow”, there is an obvious classification confusion problem, in which the object in the image has similar features to the base class “horse”, causing the network to prefer to judge it as the base class. After adjusting the final visualization threshold, the detection frame of the corresponding object can be obtained, but its confidence level is only 0.49, which is not up to the standard of correct recognition. In contrast, in the experimental results in this chapter, by adjusting the regression coordinates, the model is closer to the actual labeling and improves the classification confidence. The feature heat map of FSCE in the third column shows that the model activates more background regions, which causes the model to have missed detection. The feature heat map of AR-FSOD, on the other hand, focuses on the object, which can effectively avoid the situation of missed detection. The improved feature extraction network in this model effectively enhances the ability of multi-scale feature extraction. Meanwhile, the attention mechanism module is able to generate more expressive feature maps to a certain extent, which reduces the case of missed detection. In addition, the weighted prototype comparison branch effectively solves the problem of classification confusion. AR-FSOD exhibits better generalization performance and robustness.

5. Conclusions

In this paper, an efficient few-shot endangered species detection method is proposed to solve the problems of low accuracy and easy loss of location information. Firstly, the feature representation is optimized by the proposed improved feature extraction network SE-Res2Net; secondly, a hybrid attention module is introduced to generate more accurate region proposals; and finally, a weighted prototype comparison-based branch is introduced to solve the problem of classification confusion. The proposed method still shows good detection performance and strong generalization ability with only a small number of endangered species samples.

Author Contributions

Conceptualization, H.Y.; methodology, H.Y. and X.R.; software, X.R. and H.K.; validation, H.Y., X.R. and D.Z.; writing—original draft preparation, X.R. and H.K.; writing—review and editing, H.Y. and D.Z.; visualization, P.L. and X.R.; supervision, D.Z. and H.K.; funding acquisition, H.Y. and D.Z. All authors have read and agreed to the published version of the manuscript.

Funding

This work was supported in part by the National Natural Science Foundation of China (51774235), the Shaanxi Provincial Key R&D General Industrial Project (2021GY-338), and the Xi’an Beilin District Science and Technology Plan Project (GX2333).

Institutional Review Board Statement

Not applicable.

Informed Consent Statement

Not applicable.

Data Availability Statement

The Pascol VOC dataset can be accessed at: http://host.robots.ox.ac.uk/pascal/VOC/ (accessed on 17 May 2024), The ESD dataset can be accessed at: https://github.com/RRRRxxxx/ESD (accessed on 17 May 2024).

Conflicts of Interest

The authors declare no conflicts of interest.

References

  1. Andrews, D.Q.; Stoiber, T.; Temkin, A.M.; Naidenko, O.V. Discussion. Has the Human Population Become a Sentinel for the Adverse Effects of PFAS Contamination on Wildlife Health and Endangered Species? Sci. Total Environ. 2023, 901, 165939. [Google Scholar] [CrossRef] [PubMed]
  2. Sadanandan, K.R.; Low, G.W.; Sridharan, S.; Gwee, C.Y.; Ng, E.Y.X.; Yuda, P.; Prawiradilaga, D.M.; Lee, J.G.H.; Tritto, A.; Rheindt, F.E. The Conservation Value of Admixed Phenotypes in a Critically Endangered Species Complex. Sci. Rep. 2020, 10, 15549. [Google Scholar] [CrossRef] [PubMed]
  3. Liu, W.; Anguelov, D.; Erhan, D.; Szegedy, C.; Reed, S.; Fu, C.-Y.; Berg, A.C. SSD: Single Shot MultiBox Detector. In Computer Vision—ECCV 2016; Leibe, B., Matas, J., Sebe, N., Welling, M., Eds.; Lecture Notes in Computer Science; Springer International Publishing: Cham, Switzerland, 2016; Volume 9905, pp. 21–23. [Google Scholar]
  4. Redmon, J.; Divvala, S.; Girshick, R.; Farhadi, A. You Only Look Once: Unified, Real-Time Object Detection. In Proceedings of the IEEE Conference on Computer Vision and Pattern Recognition (CVPR), Las Vegas, NV, USA, 27–30 June 2016. [Google Scholar]
  5. Girshick, R. Fast R-CNN. In Proceedings of the IEEE International Conference on Computer Vision (ICCV), Santiago, Chile, 7–13 December 2015. [Google Scholar]
  6. Thangarasu, R.; Kaliappan, V.K.; Surendran, R.; Sellamuthu, K.; Palanisamy, J. Recognition of Animal Species on Camera Trap Images Using Machine Learning and Deep Learning Models. Int. J. Sci. Technol. Res. 2019, 10, 2–11. [Google Scholar]
  7. Iandola, F.N.; Han, S.; Moskewicz, M.W.; Ashraf, K.; Dally, W.J.; Keutzer, K. SqueezeNet: AlexNet-Level Accuracy with 50× Fewer Parameters and <0.5 MB Model Size. arXiv 2016, arXiv:1602.07360. [Google Scholar]
  8. Szegedy, C.; Ioffe, S.; Vanhoucke, V.; Alemi, A. Inception-v4, Inception-Resnet and the Impact of Residual Connections on Learning. In Proceedings of the AAAI Conference on Artificial Intelligence, San Francisco, CA, USA, 4–9 February 2017; Volume 31. [Google Scholar]
  9. Pillai, S.K.; Raghuwanshi, M.; Borkar, P. Super Resolution Mask RCNN Based Transfer Deep Learning Approach for Identification of Bird Species. Int. J. Adv. Res. Eng. Technol. 2021, 11, 2020. [Google Scholar]
  10. He, K.; Gkioxari, G.; Dollár, P.; Girshick, R. Mask R-Cnn. In Proceedings of the IEEE International Conference on Computer Vision, Venice, Italy, 22–29 October 2017; pp. 2961–2969. [Google Scholar]
  11. Borana, K.; More, U.; Sodha, R.; Shirsath, V. Bird Species Identifier Using Convolutional Neural Network. Int. J. Res. Appl. Sci. Eng. Technol. 2022, 9, 340–344. [Google Scholar]
  12. Roy, A.M.; Bhaduri, J.; Kumar, T.; Raj, K. WilDect-YOLO: An Efficient and Robust Computer Vision-Based Accurate Object Localization Model for Automated Endangered Wildlife Detection. Ecol. Inform. 2023, 75, 101919. [Google Scholar] [CrossRef]
  13. Bochkovskiy, A.; Wang, C.-Y.; Liao, H.-Y.M. Yolov4: Optimal Speed and Accuracy of Object Detection. arXiv 2020, arXiv:2004.10934. [Google Scholar]
  14. Misra, D. Mish: A Self Regularized Non-Monotonic Activation Function. arXiv 2019, arXiv:1908.08681. [Google Scholar]
  15. Köhler, M.; Eisenbach, M.; Gross, H.-M. Few-Shot Object Detection: A Comprehensive Survey. IEEE Trans. Neural Netw. Learn. Syst. 2023. early access. [Google Scholar] [CrossRef] [PubMed]
  16. Xin, Z.; Chen, S.; Wu, T.; Shao, Y.; Ding, W.; You, X. Few-Shot Object Detection: Research Advances and Challenges. Inf. Fusion 2024, 54, 102307. [Google Scholar] [CrossRef]
  17. Huang, Q.; Zhang, H.; Xue, M.; Song, J.; Song, M. A Survey of Deep Learning for Low-Shot Object Detection. ACM Comput. Surv. 2023, 56, 1–37. [Google Scholar] [CrossRef]
  18. Kang, B.; Liu, Z.; Wang, X.; Yu, F.; Feng, J.; Darrell, T. Few-Shot Object Detection via Feature Reweighting. In Proceedings of the IEEE/CVF International Conference on Computer Vision, Seoul, Republic of Korea, 27 October–2 November 2019; pp. 8420–8429. [Google Scholar]
  19. Redmon, J.; Farhadi, A. YOLO9000: Better, Faster, Stronger. In Proceedings of the IEEE Conference on Computer Vision and Pattern Recognition, Hawaii, NA, USA, 21–26 July 2017; pp. 7263–7271. [Google Scholar]
  20. Fan, Q.; Zhuo, W.; Tang, C.-K.; Tai, Y.-W. Few-Shot Object Detection with Attention-RPN and Multi-Relation Detector. In Proceedings of the IEEE/CVF Conference on Computer Vision and Pattern Recognition, Seattle, WA, USA, 14–19 June 2020; pp. 4013–4022. [Google Scholar]
  21. Wang, X.; Huang, T.E.; Darrell, T.; Gonzalez, J.E.; Yu, F. Frustratingly Simple Few-Shot Object Detection. arXiv 2020, arXiv:2003.06957. [Google Scholar]
  22. Sun, B.; Li, B.; Cai, S.; Yuan, Y.; Zhang, C. Fsce: Few-Shot Object Detection via Contrastive Proposal Encoding. In Proceedings of the IEEE/CVF Conference on Computer Vision and Pattern Recognition, Nashville, TN, USA, 20–25 June 2021; pp. 7352–7362. [Google Scholar]
  23. Everingham, M.; Van Gool, L.; Williams, C.K.; Winn, J.; Zisserman, A. The Pascal Visual Object Classes (Voc) Challenge. Int. J. Comput. Vis. 2010, 88, 303–338. [Google Scholar] [CrossRef]
  24. Lin, T.-Y.; Maire, M.; Belongie, S.; Hays, J.; Perona, P.; Ramanan, D.; Dollár, P.; Zitnick, C.L. Microsoft Coco: Common Objects in Context. In Proceedings of the Computer Vision–ECCV 2014: 13th European Conference, Zurich, Switzerland, 6–12 September 2014; Proceedings, Part V 13. Springer: Berlin/Heidelberg, Germany, 2014; pp. 740–755. [Google Scholar]
  25. Ren, S.; He, K.; Girshick, R.; Sun, J. Faster R-Cnn: Towards Real-Time Object Detection with Region Proposal Networks. In Proceedings of the Advances in Neural Information Processing Systems 28: Annual Conference on Neural Information Processing Systems 2015, Montreal, QC, Canada, 7–12 December 2015; Volume 28. [Google Scholar]
  26. Gao, S.-H.; Cheng, M.-M.; Zhao, K.; Zhang, X.-Y.; Yang, M.-H.; Torr, P. Res2net: A New Multi-Scale Backbone Architecture. IEEE Trans. Pattern Anal. Mach. Intell. 2019, 43, 652–662. [Google Scholar] [CrossRef] [PubMed]
  27. Hu, J.; Shen, L.; Sun, G. Squeeze-and-Excitation Networks. In Proceedings of the IEEE Conference on Computer Vision and Pattern Recognition, Salt Lake City, UT, USA, 18–22 June 2018; pp. 7132–7141. [Google Scholar]
  28. Woo, S.; Park, J.; Lee, J.-Y.; Kweon, I.S. Cbam: Convolutional Block Attention Module. In Proceedings of the European Conference on Computer Vision (ECCV), Munich, Germany, 8–14 September 2018; pp. 3–19. [Google Scholar]
  29. Snell, J.; Swersky, K.; Zemel, R. Prototypical Networks for Few-Shot Learning. In Proceedings of the Advances in Neural Information Processing Systems 30: Annual Conference on Neural Information Processing Systems 2017, Long Beach, CA, USA, 4–9 December 2017; Volume 30. [Google Scholar]
  30. Han, G.; Huang, S.; Ma, J.; He, Y.; Chang, S.-F. Meta Faster R-Cnn: Towards Accurate Few-Shot Object Detection with Attentive Feature Alignment. In Proceedings of the AAAI Conference on Artificial Intelligence, Online, 22 February–1 March 2022; Volume 36, pp. 780–789. [Google Scholar]
  31. Zhu, C.; Chen, F.; Ahmed, U.; Shen, Z.; Savvides, M. Semantic Relation Reasoning for Shot-Stable Few-Shot Object Detection. In Proceedings of the IEEE/CVF Conference on Computer Vision and Pattern Recognition, Nashville, TN, USA, 20–25 June 2021; pp. 8782–8791. [Google Scholar]
  32. Wu, J.; Liu, S.; Huang, D.; Wang, Y. Multi-Scale Positive Sample Refinement for Few-Shot Object Detection. In Proceedings of the Computer Vision–ECCV 2020: 16th European Conference, Glasgow, UK, 23–28 August 2020; Proceedings, Part XVI 16. Springer: Berlin/Heidelberg, Germany, 2020; pp. 456–472. [Google Scholar]
Figure 3. Architecture of SE-Res2Net.
Applsci 14 04443 g003
Figure 4. Attention-RPN Module.
Applsci 14 04443 g004
Figure 5. Weighted prototype comparison branching module.
Applsci 14 04443 g005
Figure 7. Comparison of AP50 for different methods.
Applsci 14 04443 g007
Figure 8. Comparison of characteristic heat maps.
Applsci 14 04443 g008
Figure 9. Comparison of visualization results for 30-shot settings.
Applsci 14 04443 g009
Figure 10. Comparison of characteristic thermograms and test results.
Applsci 14 04443 g010
Table 1. Segmentation scheme for the datasets.
DatasetsNovel SplitShot
EDApanda crested ibis antelopegolden
monkey
alligator sinensis1351030
Pascol VOCbirdbusmotorbikecowsofa123510
aeroplanebottlecowhorsesofa123510
boatcatmotorbikesheepsofa123510
Table 2. Model-specific parameters.
Parameter NameValueDescription
weightR-101.pklBase class training initial weights
max-items18,000Maximum number of iterations for base class training
lr0.02Base class training learning rate
weight (ft)model_surgery.pthFine-tuning the training initial weights
lr (ft)0.001Fine-tuning training learning rates
momentum0.9Momentum of gradient descent
weight decay0.0001Weight decay factor
Table 3. Few-shot detection performance on ESD.
Panda Crested Ibis AntelopeGolden Monkey Alligator Sinensis
1-shot15.410.39.48.614.6
3-shot32.728.523.621.931.2
5-shot57.644.438.736.256.8
10-shot74.865.063.259.872.5
30-shot83.476.672.169.381.3
Table 4. Comparison of the quality of regional candidate frames.
MethodNovel Set 1Novel Set 2Novel Set 3
FSCE [22]0.4360.1860.355
AR-FSOD0.4690.2730.396
Table 5. Fine-tuning results of the new Pascol VOC.
Novel Split1Novel Split2Novel Split3
Method123510123510123510
Meta FR-CNN [30]41.846.752.759.662.326.133.643.847.850.135.642.145.853.452.3
SRR-FSD [31]47.850.551.355.256.832.535.539.140.843.840.141.544.346.946.4
MPSR [32]36.541.748.954.560.725.427.239.541.146.235.342.244.549.650.4
FSCE [22]44.243.851.461.963.427.329.543.544.250.237.241.947.554.658.5
FSRW [18]14.815.526.733.947.215.715.322.730.140.521.325.628.442.845.9
AR-FSOD45.645.353.963.767.527.830.944.346.853.538.143.349.658.161.2
Disclaimer/Publisher’s Note: The statements, opinions and data contained in all publications are solely those of the individual author(s) and contributor(s) and not of MDPI and/or the editor(s). MDPI and/or the editor(s) disclaim responsibility for any injury to people or property resulting from any ideas, methods, instructions or products referred to in the content.

