Article

Application Cluster Analysis as a Support form Modelling and Digitalizing the Logistics Processes in Warehousing

Faculty of Mechanical Engineering, Department of Industrial and Digital Engineering, Technical University of Košice, Park Komenského 9, 042 00 Košice, Slovakia
*
Author to whom correspondence should be addressed.
Appl. Sci. 2024, 14(11), 4343; https://doi.org/10.3390/app14114343
Submission received: 15 April 2024 / Revised: 10 May 2024 / Accepted: 18 May 2024 / Published: 21 May 2024
(This article belongs to the Special Issue Automation and Digitization in Industry: Advances and Applications)

Abstract

:
The article deals with the application of cluster analysis in modeling in-house processes, specifically supply processes. An algorithm is designed on the theoretical basis of cluster analysis and according to the analysis of the supply processes in selected industrial companies. Specifically, the algorithm is based on the hierarchical methods of cluster analysis, and the selected hierarchical clustering method is applicable in modeling storage systems under various production conditions in industrial companies. The methodology of clustering regarding the supply processes is subsequently experimentally verified. Based on the results of the cluster analysis, a system of organization was proposed for the analyzed warehouse in the form of 2D and 3D layout models of the warehouse.

1. Introduction

Warehousing is one of the most important areas of a logistics system. It creates a connecting link between the production and customers. The primary goal of storage is to ensure the requirements directly for consumption, i.e., to satisfy the current needs of the customers. Storage can be understood as a deliberate interruption of the flow of material at a certain place and for a certain time in the so-called point of disconnection of the logistics chain. In this sense, materials and products are recorded as stocks in the warehouse. In this context, information on the condition, movement, transport, location of stocks, etc., is processed. An important part of storage is the protection against the external influences with which the stock comes into contact during the storage process [1,2,3].
Warehousing, in conjunction with other logistics activities, provides the necessary level of customer service to the company’s customers at the lowest possible total cost. Storage serves as an important link between the manufacturer and the customer.
We can define warehousing as a component of the corporate logistics system that ensures the storage of products—including raw materials, parts, goods in production, semi-finished products, and finished products—at their places of origin and between the place of origin and the place of consumption. It provides management with information on the condition, circumstances, and locations of stock products.
In addressing the study presented, it was essential to utilize the knowledge focused on the field of the modeling and digitization of the processes and systems related to storage, logistics, and material flows. In this context, the works of the authors focused on the design creation [4], modeling and simulation of logistic processes [2,3,5,6], and optimization of warehouse items using a genetic algorithm [7,8], which proved to be useful.
According to [9], the authors state that, in line with the global trends in material handling and storage, the design process should not only incorporate the use of equipment with the fastest drives but also take into account the energy and environmental aspects of the installed equipment. The authors dedicated their efforts to designing an energy efficiency model for mini-load automated storage and retrieval systems. This model positively impacts both the economic and environmental aspects by reducing the energy consumption and, consequently, CO2 emissions.
When dealing with warehouses, it is also necessary to consider other environmental aspects. This approach is discussed in Ref. [1], which focuses on the importance of a quality working environment, and Ref. [10], which deals with a comprehensive approach aimed at reducing the noise emissions from industrial operations and their subsequent impacts on the environment and human health.
In another paper, the authors [11] performed an optimal warehouse location planning analysis to decide on the optimal storage location for each component. They implemented the optimization using hierarchical clustering and k-means clustering to formulate an optimal consolidated picking strategy. They developed a consolidated planning-based selection methodology to support the intelligent manufacturing of wireless modules. Executing a cluster analysis for picking lists was included in the third part of the proposed methodology: the analysis of the picking-list consolidation strategies, where the first part of the methodology is the analysis of the storage space demands and the second part is the analysis of the optimal storage location planning.
In [12], the authors mainly dealt with the optimization of the order-picking activities in warehouses, with a focus on parts-to-picker using cluster-based analysis. Among other things, they included an extensive overview of the papers using a cluster-based storage allocation policy, which was also beneficial in the context of the processed article.
Cluster analysis is also of great importance in wider research. For example, when examining the connection of the applications and technologies in the context of Industry 4.0. it was used by the authors in [13,14,15], which is interesting in terms of potential further research in the subject area.
In [16], the authors proposed and tested a DECIPACO model for optimizing the operations related to last-mile delivery. This model can also be considered when solving a wider range of problems since the advantage is that it proposes a set of customer requirements and warehouse locations and calculates the optimal solution for the mathematical formulation. This seems interesting when finding complex solutions in the field of logistics in connection with cluster analysis. Of interest is the new Interdependent Ant Colony Pareto Optimization (IPACO), which has been integrated with the Deep Embedded Clustering Algorithm (DEC) to create a DEC-based IPACO (DECIPACO) model to solve the proposed formulation.
A novel approach based on the demand correlation to reduce the network complexity in inventory and transshipment problems is elaborated on in [17]. It deals with the grouping of retail stores for the transshipment of stock in the context of cross-docking. The authors addressed two transshipment problems that are combined with clustering approaches based on distance and demand correlations.

Inefficiency in Storage

Efficient product movement, storage, and information transfer within the warehouse are crucial for enhancing company competitiveness. In warehousing, it is necessary to determine the optimal combination of manual and automated handling systems. The most common mistakes that companies make in terms of storage are the following:
  • the excessive handling and underutilization of the storage space;
  • the low utilization of the storage area and space;
  • excessive maintenance costs and outages due to outdated equipment;
  • outdated methods of receipt and dispatch of goods;
  • outdated methods of computerized processing of routine transactions.
From an economic point of view, the optimization of warehouse processes is not considered a strategic priority as it does not have a fundamental impact on the value of the given product. This is because these processes produce only a minimum of activities that add value to the product. The main problem is the lack of a standard in the storage processes that businesses can rely on. Therefore, before starting the optimization, it is necessary to analyze the warehouse processes in regard to the following:
  • Analyzing the efficiency and productivity of the work in warehouses, with a focus on cost reduction and optimization. Implementing automation in warehouse operations emerges as the optimal solution.
  • Analyzing the performance of the supplier-to-customer link in the supply chain to select an appropriate storage system and integrate it seamlessly into the material flow.

2. Materials and Methods

Cluster analysis (CA) is a statistical method used to differentiate individual objects (observations) by creating specific and distinct clusters, each containing observations assigned based on their degree of similarity or dissimilarity. The goal of cluster analysis is to uncover patterns and structures within a dataset, providing insights into underlying relationships and associations [10].
Cluster analysis was initially defined in 1939 by RC Tryon as follows [8]: “Cluster analysis is a general logical procedure, formulated as a procedure by which we group objects into groups based on their similarities and differences”.
We have a data matrix X of type n × p, where n is the number of objects and p is the number of variables (characters and properties). Next, we have the decomposition S(k) of a set of n objects into k certain groups (clusters), i.e., S ( k ) = C 1 , C 2 , C 3 , , C k , while applying [18]
C i , i = 1 , k ,
and i = 1 k C i covers the whole space.
If the given set of objects o = A 1 , A 2 , , A n and arbitrary coefficient of dissimilarity of objects is D, then a subset p of the set of objects o is called a cluster for which [8] holds:
max i , j D A i ; A j < min k , l D A k ; A l
where A i , A j , A l o a A k p .
This implies that the maximum distance between objects within a cluster must always be smaller than the minimum distance of any object from the cluster to an object outside of it [18].
Cluster analysis is a valuable tool for production segmentation, classified among design methods used to organize unstructured data based on similarities. At its core, clustering categorizes objects into groups or clusters, maximizing intra-group similarity and minimizing inter-group similarity. It is an unsupervised machine-learning algorithm that operates on unlabeled data [19].
Basic assumptions of using cluster analysis include characteristics of the data. The first assumption is that there should not be outlier observations or missing values in the selected dataset. To prevent data distortion due to measurement units, the data are scaled using methods such as min–max normalization or standardization using z-score. The size of the dataset, the number of observations, and the type of variables (ordinal or interval) influence the choice of the clustering method. Another assumption of cluster analysis is the degree of similarity. Various types of distances exist, including Euclidean distance, squared Euclidean distance, standardized Euclidean distance, Bray–Curtis distance, Manhattan distance, Chebyshev distance, Canberra distance, Hamming distance, Kulsinski distance, correlation distance, and many others [8].
There are many different algorithms used for cluster analysis, such as k-means, hierarchical clustering, and density-based clustering. The choice of algorithm will depend on the specific requirements of the analysis and the nature of the data being analyzed.
Two basic types (algorithmic principles) are distinguished in clustering from a theoretical point of view (Figure 1) [20]:
  • hierarchical algorithms—the assignment of subjects to individual groups is stable and does not change during the algorithm;
  • non-hierarchical (partitioning) algorithms—assignment of subjects to individual groups can change during the algorithm.
Hierarchical agglomerative clustering operates on the ‘bottom-up’ principle. It begins by creating small clusters, initially consisting of single elements at the start of the algorithm. These small clusters are then gradually merged into larger clusters in a sequence of steps until a single cluster containing all observations is formed. The merging process in each step relies on the principle of mutual similarity, defined based on the distance metric used, whether it is between individual observations, between observations and clusters, or between clusters themselves [21].
Hierarchical divisive (decomposing and dividing) algorithms operate on the ‘top-down’ principle. Initially, a single complex cluster is created containing all observations. Then, in individual steps, existing clusters are divided based on the principle of mutual dissimilarity between clusters or between clusters and observations [21].
In non-hierarchical clustering methods, objects are classified into disjoint clusters, the number of which is predefined. Non-hierarchical methods focus on discovering the groupings present in the data by optimizing the objective function and iteratively improving the quality of assigning objects to individual clusters. These clustering methods can be divided into [18,22] the following:
  • hard clustering methods—each object belongs to a cluster or not;
  • fuzzy clustering—each object belongs to each cluster to a certain degree.
There are several procedures used when applying cluster analysis. The choice of using a suitable procedure depends mainly on the given task. Individual procedures differ from each other in the association coefficients used (Sokalov–Michenerov, Russelov–Raov, Jaccardov, etc.) and in the method based on which the segmentation process is performed. Among the most used algorithmic methods are [22] Rank Order Clustering Algorithm, Direct Clustering Algorithm, Single Linkage Clustering Algorithm, Average Linkage Clustering Algorithm, and Production Flow Analysis.
The agglomerative methods are used in the article. The result of using hierarchical clustering methods is a dendrogram that represents the nested grouping of objects and the similarity measures where the groupings change.
Dendrogram is a special type of tree that represents the agglomerative clustering method. Clustered objects are represented by the leaf nodes of the tree. Connecting the two nearest objects on the respective clustering level creates intermediate nodes. The result of the clustering algorithm is influenced by the specific choice of the distance (proximity measure) and the specific choice of the clustering algorithm. The output of the algorithm is the assignment of individual observations to a certain number of disjoint clusters [8].
The procedure of agglomerative hierarchical clustering is implemented in these steps [22]:
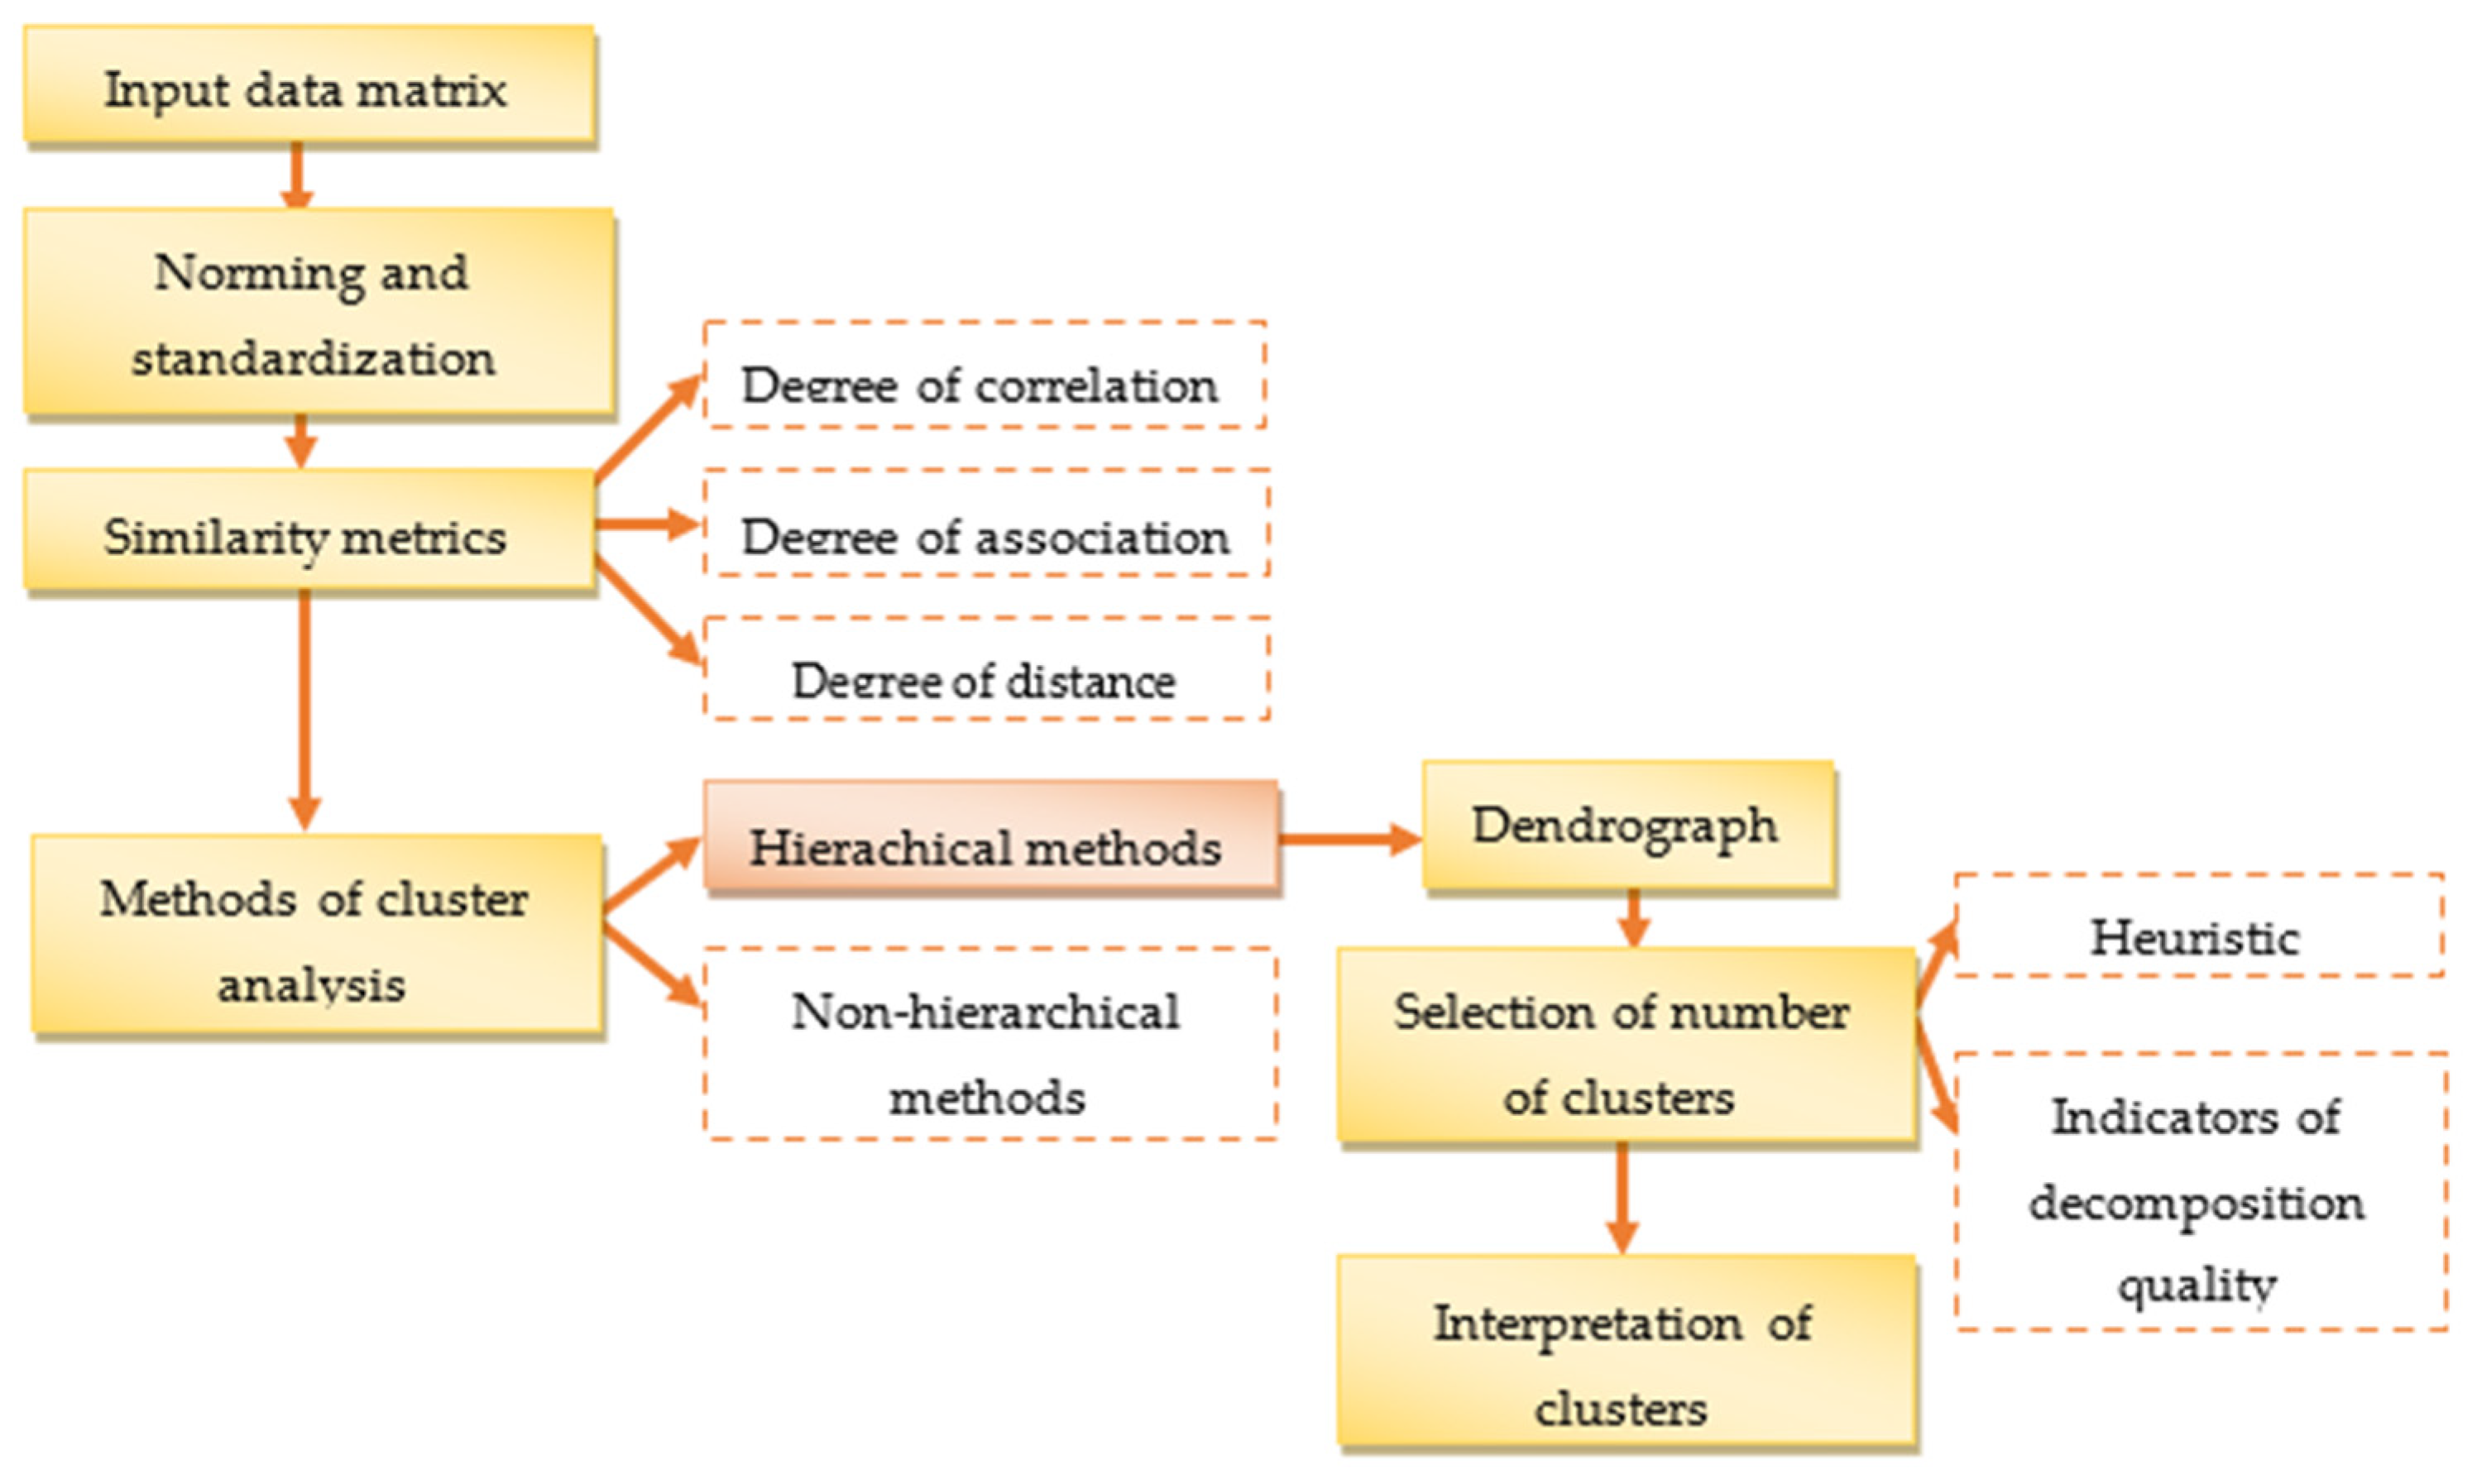
  • The distance matrix E1 is compiled from the input data matrix E0 according to the squared Euclidean distance dES.
  • The smallest distance is searched in the distance matrix E1, which generates the first cluster.
  • All remaining objects are then connected to the first cluster, and a new distance matrix E2 is recalculated. This distance matrix is calculated using individual cluster analysis methods. Any missing values in matrix E2 are filled from the input distance matrix E1.
  • The smallest distance is once again selected from matrix E2, generating the second cluster. The remaining objects or clusters are then connected to it, and a new distance matrix E3 is recalculated.
  • Once again, the smallest distance is selected from distance matrix E3, representing another cluster.
  • This procedure is repeated until all objects or clusters have been assigned.
  • The output of hierarchical cluster analysis method is a dendrogram.
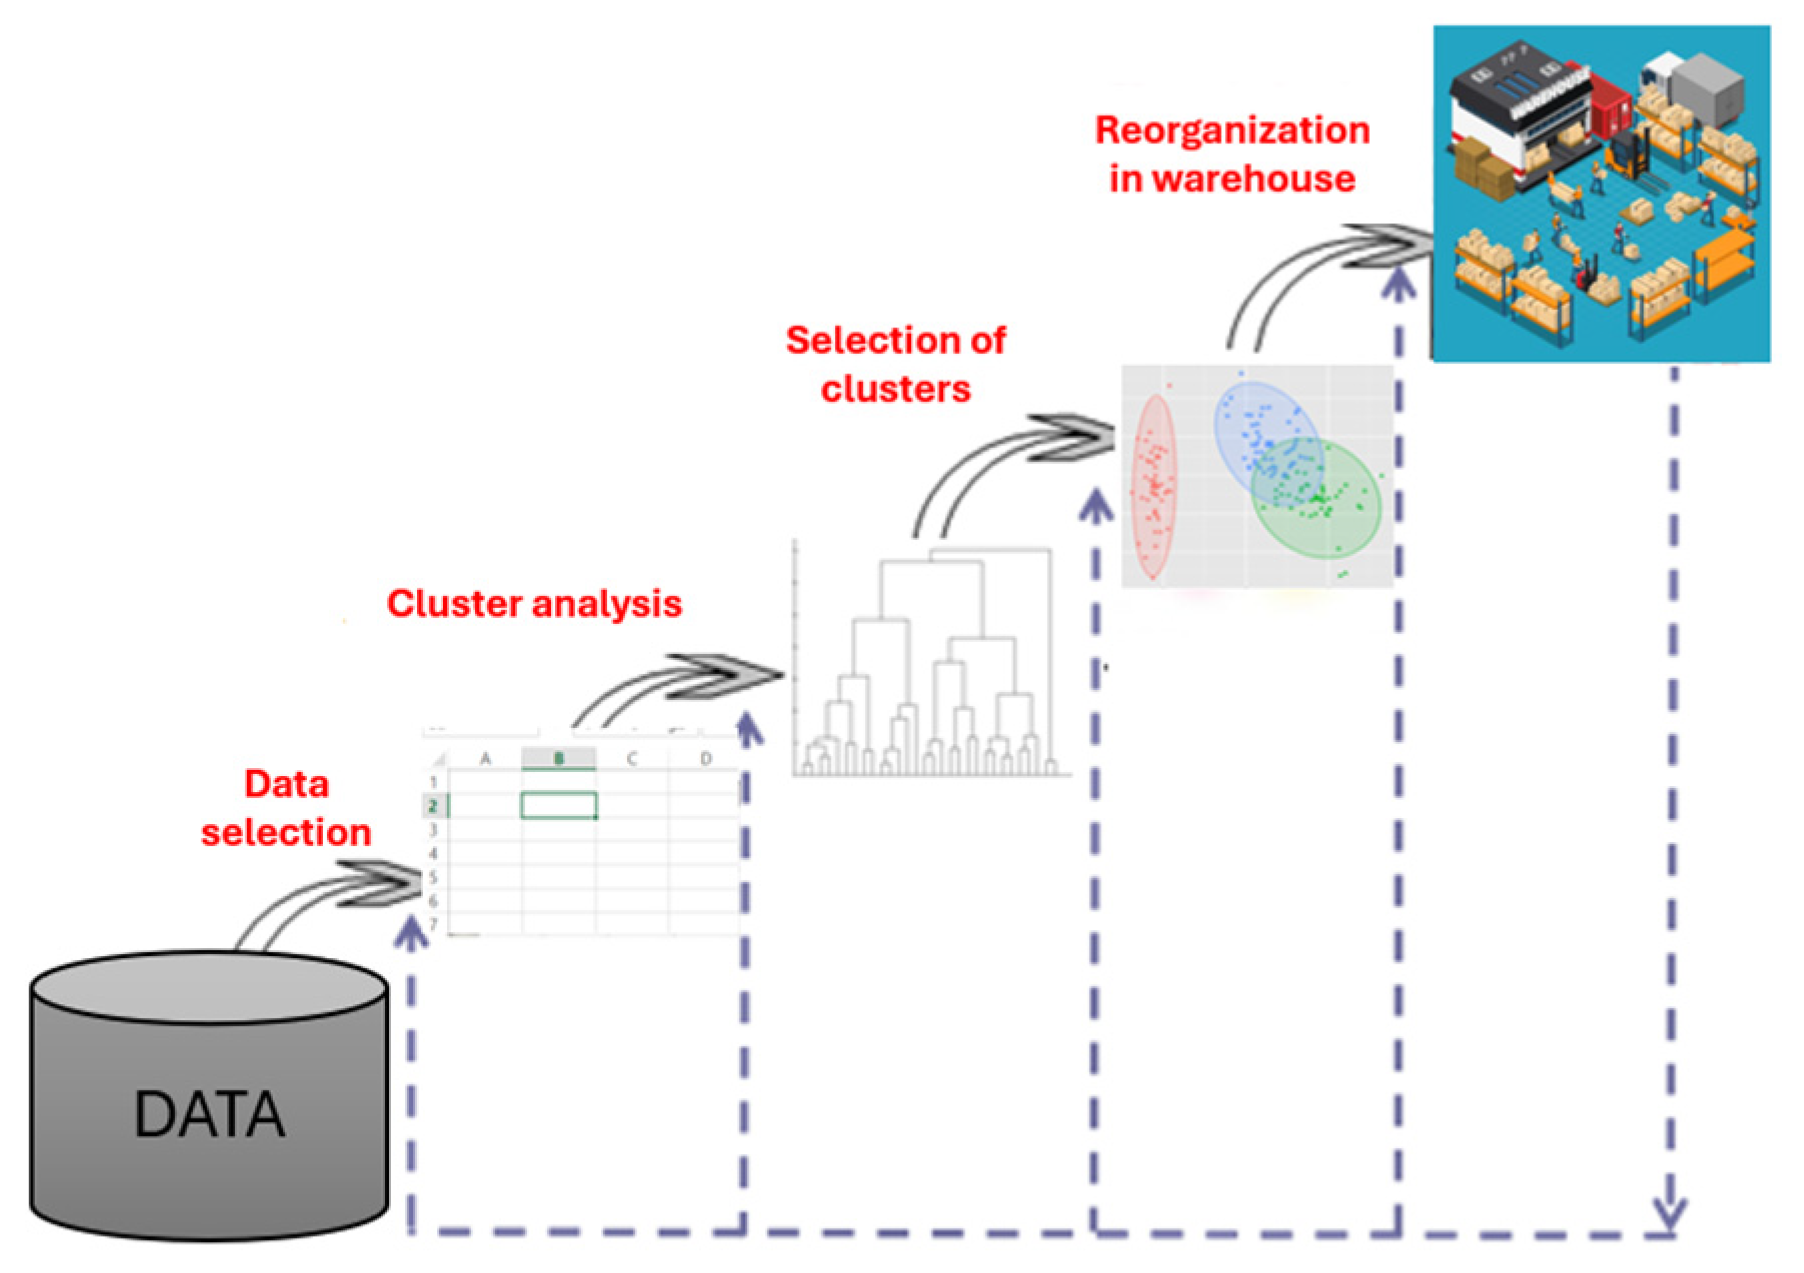
The model of the cluster analysis procedure is depicted in Figure 2.
The scheme of the application process of cluster analysis in the modeling of in-house production processes is shown in a simplified form in Figure 3. The compiled design of the methodology for the application of hierarchical methods of cluster analysis in the supply process in the form of an algorithm can be implemented for inventory management regardless of the warehouse type (input, output, or intermediate warehouses) and the type of production activity of the company.
The schematic description of method is shown in Figure 4. This is the basis for the implementation of the methodology for the application of hierarchical methods of cluster analysis within the supply process in manufacturing enterprises.
The procedure for using cluster analysis in the modeling of in-house production processes is divided into three consecutive stages:
  • Stage—preparation;
  • Stage—implementation and cluster analysis;
  • Stage—evaluation and proposal.
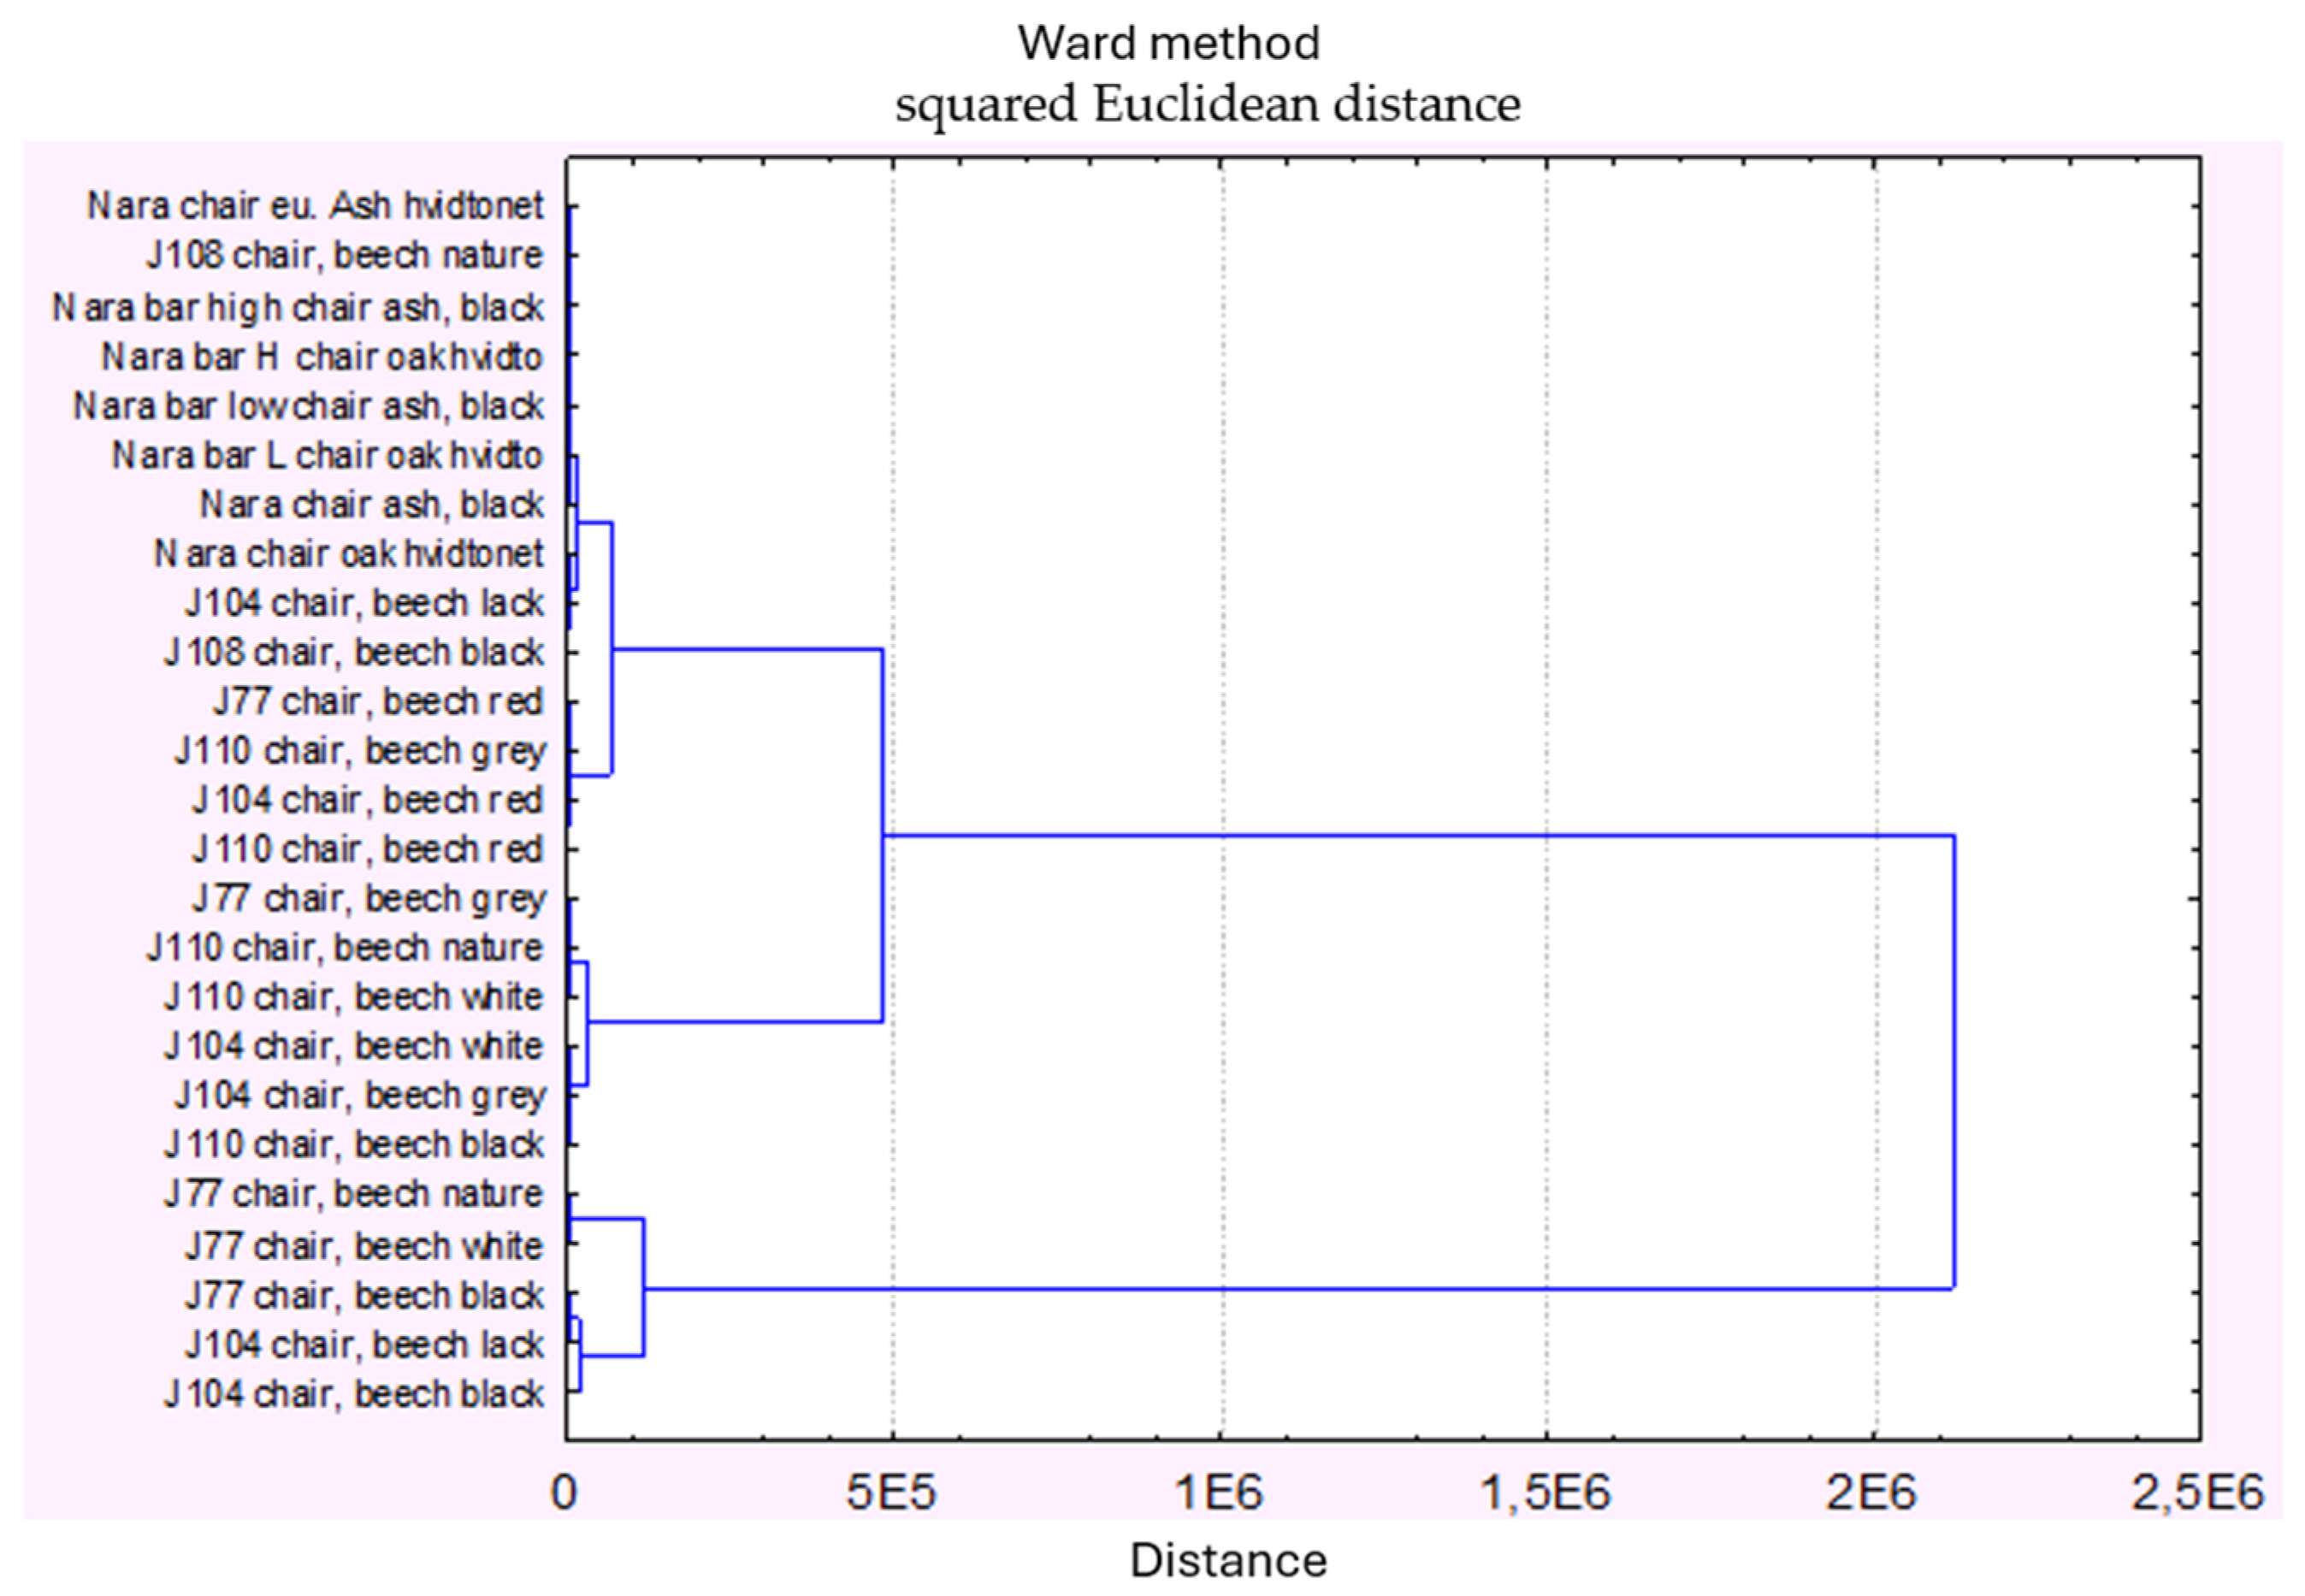
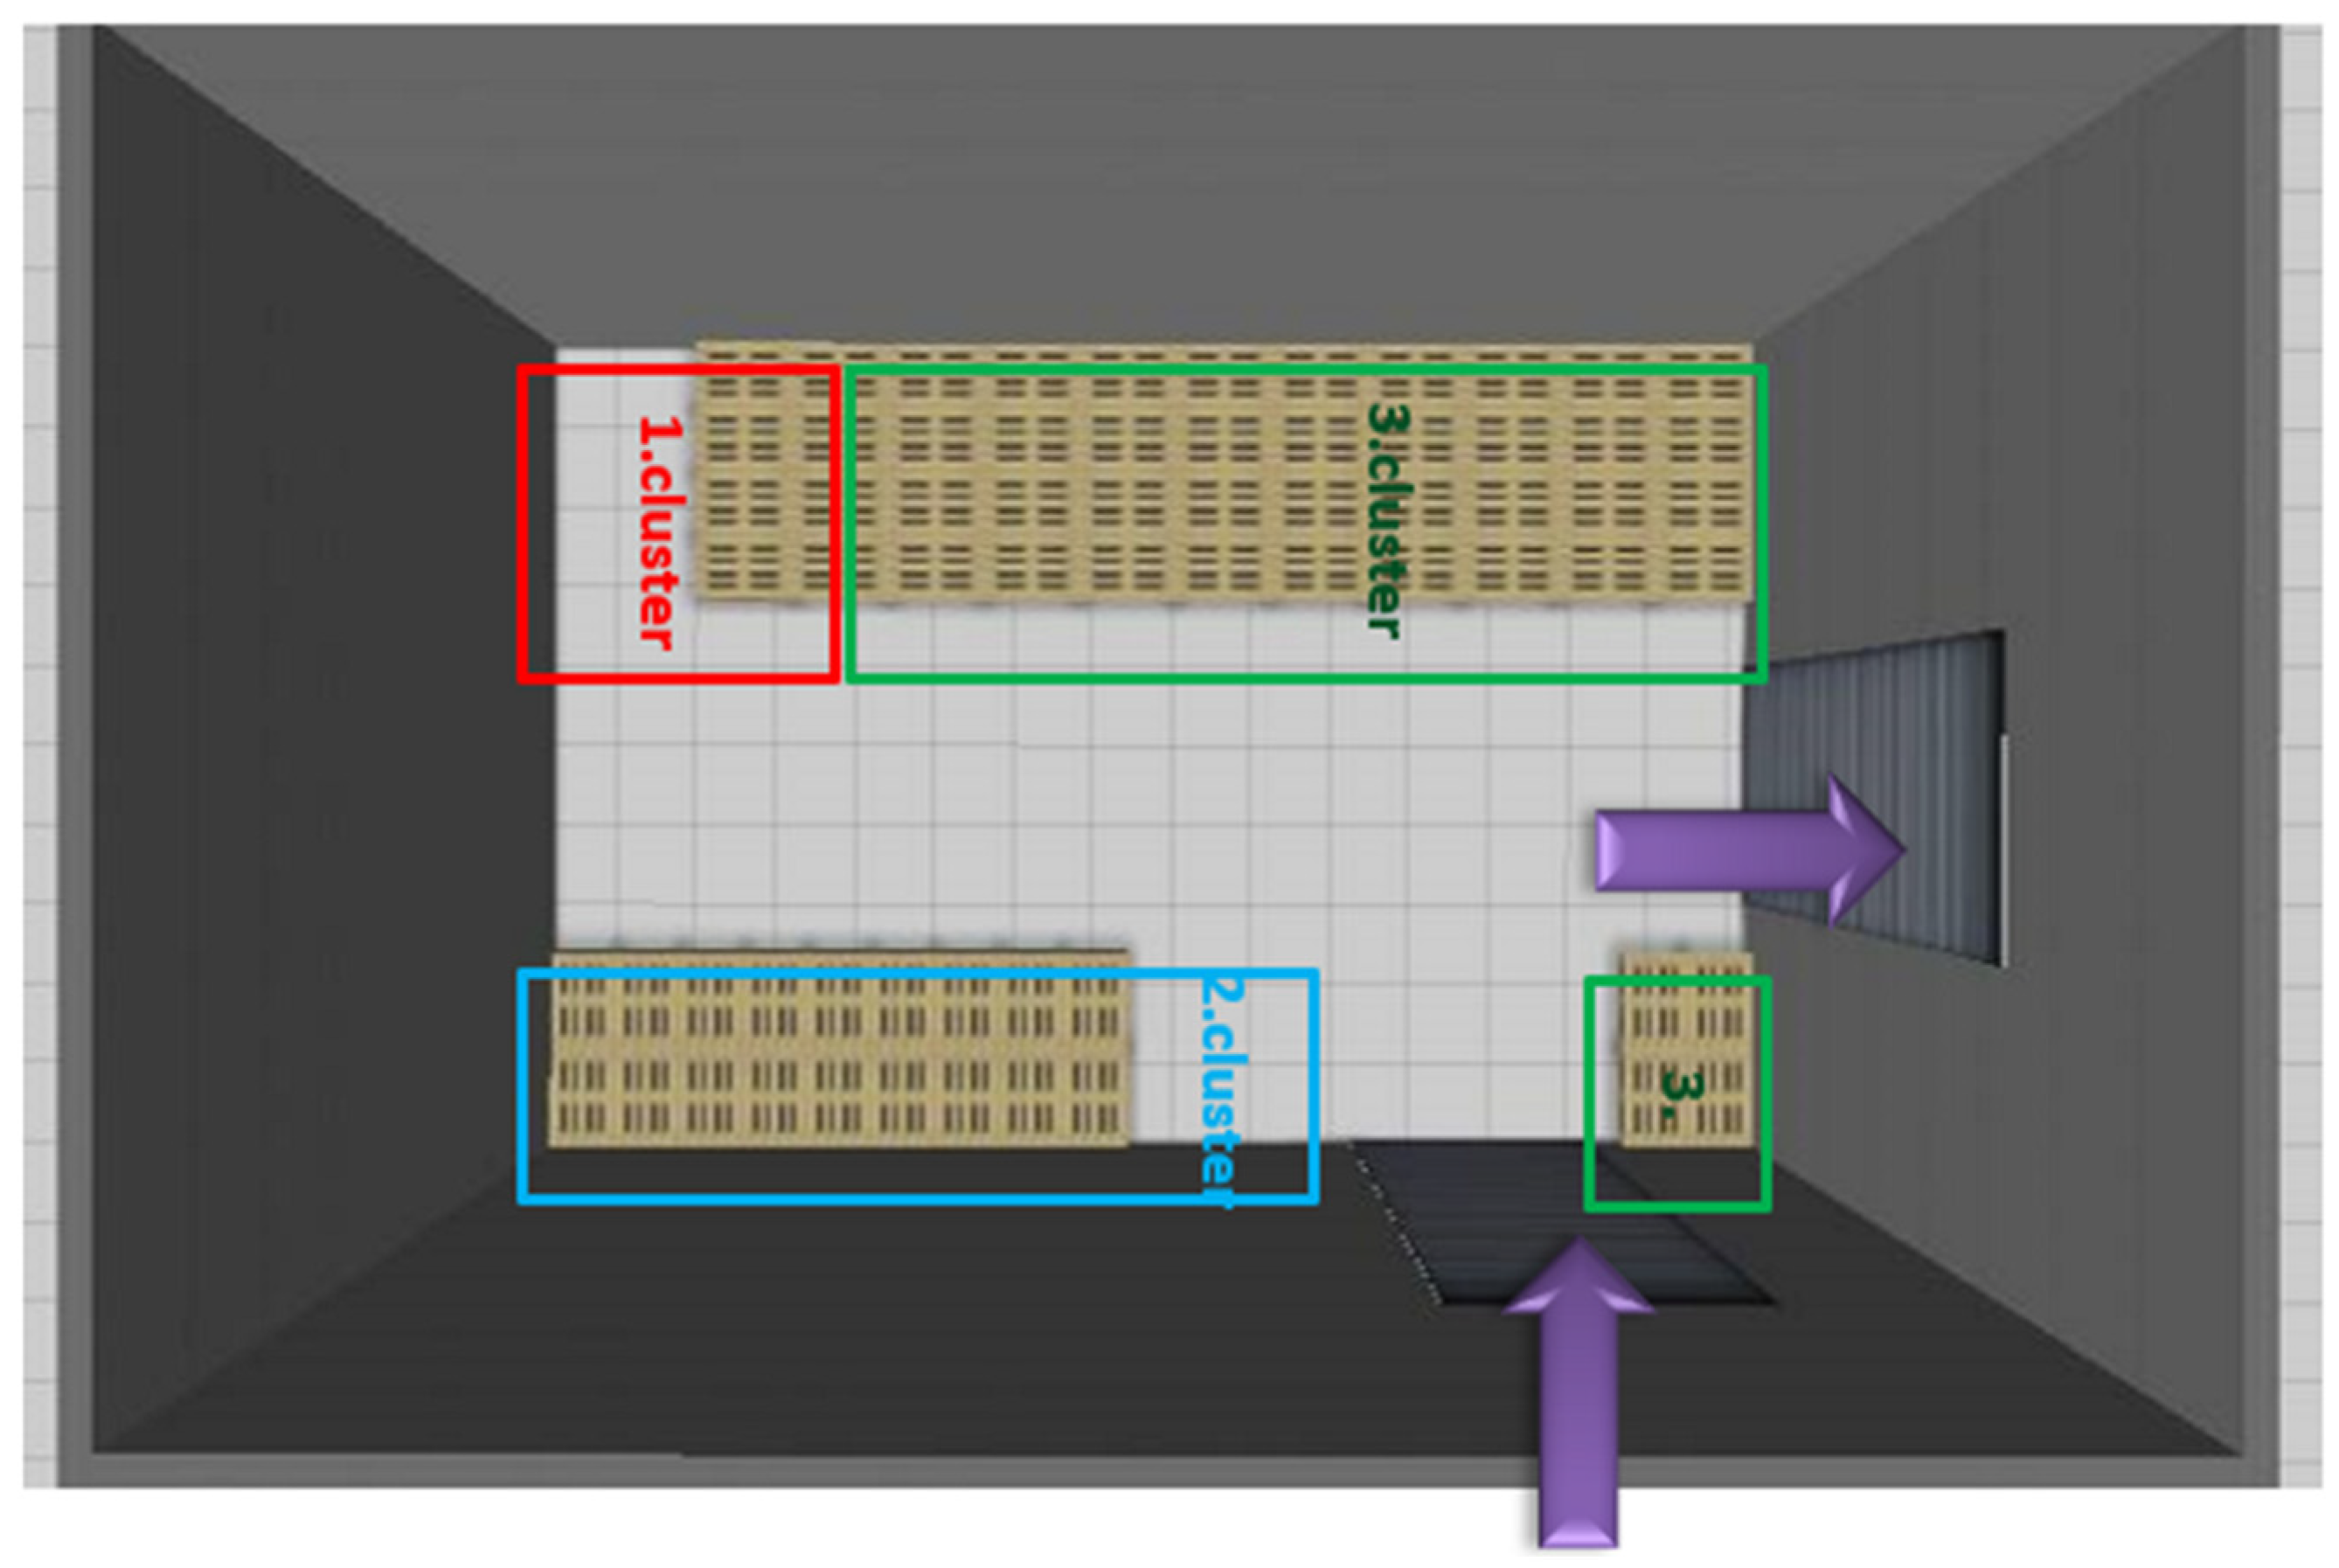
The first stage of applying cluster analysis in supply is the preparatory stage, during which it is necessary to create a list of stock items that will be the subject of the analysis. In the case of analyzing outbound warehouse items, the input data include information from the dispatch plan. For inbound warehouses, the input data comprise the production plan. Therefore, the input for cluster analysis is information from the next business process activity. The selected data will be analyzed from the perspective of their development over the monitored period. Subsequently, an input data matrix will be created in tabular form in the format of stock item/monitored period.
The second stage follows, the cluster analysis itself. The result of cluster analysis is the creation of groups (clusters) of stock items.
Clusters of warehouse items in the form of the matrix ‘warehouse items—clusters’ are analyzed in the third stage to determine if they correspond to the conditions of the warehouse. If the selection of clusters can be considered optimal, the clustering process is completed, and the ‘stock items—clusters’ matrix can serve as the basis for proposing a reorganization of the arrangement of warehouse items. If the output matrix is not optimal from the perspective of warehouse conditions, the clustering process is repeated starting from the point of choosing the optimal number of clusters.

3. Results

The proposed methodology was applied to the stocks of finished products in the selected company. The input data on the monthly shipment of products to the direct customer of XY were analyzed, serving as the basis for performing a cluster analysis. The descriptive statistics of the input data regarding the company’s product shipments are presented in Table 1.
The result is a dendrogram displaying distinct clusters based on varying connection distances (Figure 5).
The clusters of products described in Table 2 are determined based on a heuristic approach used to select the optimal number of clusters.
The proposed methodology for applying the cluster analysis in the supply process is appropriate, and the utilization of cluster analysis in forming groups (clusters) of supplies is justified. Clusters are formed based on similarity, in this case, the similarity of the shipments to customers, which serves as the primary criterion for grouping the products for customers. Accordingly, the most frequently shipped products should be positioned closest to the exit.
The result of the cluster analysis of the stocks of the finished products of company XY is the determination of three clusters of products that can be considered when solving the arrangement of the individual warehouse items in the company.
The graphic displayed in Figure 6 shows that the products of the third cluster have the largest share in the expedition, followed by the second cluster, while the first cluster has the smallest share. Therefore, it is advisable to position the products of the third cluster closer to the loading area for finished products within the warehouse. The third cluster comprises the products from the main groups, J77 and J104.
The results of the cluster analysis revealed three clusters of finished products in company XY, as indicated in the 2D (Figure 7) and 3D sketches (Figure 8) of the layout of the company’s finished products warehouse.

4. Discussion

The article presents and describes a proposed algorithm for the application of the hierarchical methods of cluster analysis in modeling the storage systems of enterprises. It is assumed that the mentioned algorithm can be applied in industrial enterprises regardless of the area of production, regional operation, sales market, number of employees, or other characteristics. The algorithm for the application of cluster analysis methods in storage was verified under real conditions in a selected company, and the results of the experimental verification are the content of the article.
Managing the material management in the company is a complex issue, requiring coordination, cooperation, and collaboration among multiple links in the company’s value chain (see Figure 9) [4].
The periodicity and unevenness in consumption have a significant impact on the size of the stock. If the effort is to capture the nature of the consumption of individual material items, it is necessary to monitor the consumption of the material even during its movement in the production process and not focus only on the issue of the material item from the warehouse. The basic directions of optimizing the company’s inventory [23,24,25] are as follows:
  • the optimization of the company’s inventory in terms of structure and quantity;
  • the selection of rational methods of material supply and their technical and economic justification;
  • limiting the creation of over-standard and unnecessary stocks, identifying methods for their most effective use since excess stocks lead to significant losses of funds tied up in these stocks, and also increasing the costs associated with storage and care as there is a risk of loss, damage, obsolescence of stocks, and their gradual depreciation;
  • a method for the control and regulation of production stocks.
The role of the production stocks in a company is to ensure the continuity and faultlessness of the production process. The scope and structure of production stocks are directly dependent on the scale of production, specialization of production, and the other specifications of the production process.
Specifically, three basic factors affect the amount of production stocks in the company, namely regularity, speed, and certainty, in the sense that there are no production interruptions. This is an indirect dependence since, the smaller the fulfillment of these conditions, the greater the risk in connection with the non-fulfillment of production orders, and thus it is necessary to amass higher stocks in warehouses [26].

5. Conclusions

Cluster analysis can significantly increase the efficiency of the process of finding optimal solutions in various areas. In inventory management, it is also of great importance from a logistical point of view, which was proven in the processed case study. The warehouse was optimized using the application of cluster analysis. The proposed algorithm was successfully applied and creates possibilities for its use in industrial practice. Since the solution was focused on the optimization of stocks, it is also necessary to mention the basic factors that must be considered when solving similar problems:
  • the regularity of deliveries, determined by the frequency and size of deliveries;
  • the delivery speed, depending on the type of transport, the distance of the transport method, and the degree of mechanization of the loading and unloading processes;
  • the degree of certainty that the supplier delivers according to the required quality, quantity, price, and time.
The absolute level of inventory depends on the following:
  • the size of the consumption, which should be under the production program (production consumption);
  • the production consumption, which is determined by the conditions of the production process;
  • the consumption standards, which are converted to specific final products in connection with the production technology used.
The amount of inventory can also be significantly affected by fluctuations in the delivery period since the supplier can dispatch the delivery on any day within the period specified in the delivery contract. The amount of stock of individual assortment items depends primarily on their movement, i.e., the extent and nature of the consumption for the monitored period (day, month, year, consumption date, uniformity of consumption in the planned period, etc.) and the size of the production batch that is consumed regarding the production at one time. The nature of consumption can be expressed by the continuity of consumption, which essentially means the continuity in the need and subsequent consumption of the given items.
Further research could explore the following topics:
  • the incorporation of the proposed algorithm of the application of cluster analysis methods in storage into software designed for modeling and simulating the processes of manufacturing enterprises (e.g., Siemens Tecnomatix);
  • the creation of integrated statistical software for performing cluster analysis and simulation software;
  • the expansion of the algorithm by the detailed elements and restrictions resulting from real production conditions in the search for an optimal solution for the arrangement of warehouse stocks.

Author Contributions

Conceptualization, P.T., J.K., G.I., M.P. and M.F.; methodology, P.T., J.K., G.I., M.P. and M.F.; software, J.K. and G.I.; validation, J.K., G.I., P.T. and M.P.; formal analysis, J.K. and G.I.; investigation, P.T., J.K., M.P. and M.F.; resources, M.P., P.T., J.K. and M.F.; formal analysis, J.K. and G.I.; writing—original draft preparation, P.T., J.K., G.I., M.P. and M.F.; writing—review and editing, J.K. and M.P.; supervision, P.T. and M.P.; project administration, P.T. and M.P. All authors have read and agreed to the published version of the manuscript.

Funding

This research received no external funding.

Institutional Review Board Statement

Not applicable.

Informed Consent Statement

Not applicable.

Data Availability Statement

The original contributions presented in the study are included in the article, further inquiries can be directed to the corresponding author.

Acknowledgments

This article was created by the implementation of the grant projects APVV-17-0258 Digital engineering elements application in innovation and optimization of production flows, APVV-19-0418 Intelligent solutions to enhance business innovation capability in the process of transforming them into smart businesses, KEGA 020TUKE-4/2023 Systematic development of the competence profile of students of industrial and digital engineering in the process of higher education, and VEGA 1/0508/22 Innovative and digital technologies in manufacturing and logistics processes and system. We also express our gratitude to Laura Lachvajderová for her contribution to improving the quality of the article.

Conflicts of Interest

The authors declare no conflicts of interest.

References

  1. Hnilica, R.; Jankovsky, M.; Dado, M.; Messingerova, V.; Schwarz, M.; Veverkova, D. Use of the analytic hierarchy process for complex assessment of the work environment. Qual. Quant. 2017, 51, 93–101. [Google Scholar] [CrossRef]
  2. Knapcikova, L.; Behunova, A.; Behun, M. Using a discrete event simulation as an effective method applied in the production of recycled material. Adv. Prod. Eng. Manag. 2020, 15, 431–440. [Google Scholar] [CrossRef]
  3. Rosová, A.; Malindžaková, M. Material flow—Starting point for recovery of inputs in the production: Company. In Proceedings of the 14th International Multidisciplinary Scientific GeoConference Surveying Geology and Mining Ecology Management, SGEM, Albena, Bulgaria, 16–26 June 2014. [Google Scholar]
  4. Gregor, M.; Hodon, R.; Grznar, P.; Mozol, Š. Design of a System for Verification of Automatic Guided Vehicle Routes Using Computer Emulation. Appl. Sci. 2022, 12, 3397. [Google Scholar] [CrossRef]
  5. Straka, M.; Sofranko, M.; Glova, J.; Vegsoová, O.; Kovalcik, J. Simulation of homogeneous production processes. Int. J. Simul. Model. 2022, 21, 214–225. [Google Scholar] [CrossRef]
  6. Fedorko, G.; Molnár, V.; Honus, S.; Neradilova, H.; Kampf, R. The application of simulation model of a milk run to identify the occurrence of failures. Int. J. Simul. Model. 2018, 17, 444–457. [Google Scholar] [CrossRef] [PubMed]
  7. Grznár, P.; Krajčovič, M.; Gola, A.; Dulina, Ľ.; Furmannová, B.; Mozol, Š.; Plinta, D.; Burganová, N.; Danilczuk, W.; Svitek, R. The Use of a Genetic Algorithm for Sorting Warehouse Optimisation. Processes 2021, 9, 1197. [Google Scholar] [CrossRef]
  8. Meloun, M.; Militký, J. [Statistická Analýza Experimentálních Dat] Statistical Analysis of Experimental Data, 2nd ed.; Academia: Praha, Czech Republic, 2004; p. 953. [Google Scholar]
  9. Edl, M.; Lehrer, T.; Rosi, B. Energy efficiency model for the mini-load automated storage and retrieval systems. Int. J. Adv. Manuf. Technol. 2014, 70, 97–115. [Google Scholar]
  10. Moravec, M.; Badida, M.; Mikusova, N.; Sobotova, L.; Svajlenka, J.; Dzuro, T. Proposed Options for Noise Reduction from a Wastewater Treatment Plant: Case Study. Sustainability 2021, 13, 2409. [Google Scholar] [CrossRef]
  11. Chiang, T.-A.; Che, Z.-H.; Lee, C.-H.; Liang, W.-C. Applying Clustering Methods to Develop an Optimal Storage Location Planning-Based Consolidated Picking Methodology for Driving the Smart Manufacturing of Wireless Modules. Appl. Sci. 2021, 11, 9895. [Google Scholar] [CrossRef]
  12. Mirzaei, M.; Zaerpour, N.; de Koster, R. The impact of integrated cluster-based storage allocation on parts-to-picker warehouse performance. Transp. Res. Part E Logist. Transp. Rev. 2021, 146, 102207. [Google Scholar] [CrossRef]
  13. Anuşlu, M.D.; Fırat, S.Ü. Clustering analysis application on Industry 4.0-driven global indexes. Procedia Comput. Sci. 2019, 158, 145–152. [Google Scholar] [CrossRef]
  14. Tschuchnig, P.; Müller, J.M. Clustering and Classification of Manufacturing Enterprises Regarding Their Industry 4.0 Reshoring Incentives. Procedia Comput. Sci. 2021, 180, 696–705. [Google Scholar]
  15. Das, J.N.; Tiwari, M.K.; Sinha, A.K.; Khanzode, V. Integrated warehouse assignment and carton configuration optimization using deep clustering-based evolutionary algorithms. Expert Syst. Appl. 2023, 212, 118680. [Google Scholar] [CrossRef]
  16. Griffin, E.C.; Burcu, B.; Keskin, B.B.; Allaway, A.W. Clustering retail stores for inventory transshipment. Eur. J. Oper. Res. 2023, 311, 690–707. [Google Scholar] [CrossRef]
  17. Rezankova, H.; Husek, D.; Snasel, V. Shluková Analyza Dat. Cluster Analysis of Data, 2nd ed.; Professional Publishing: Praha, Czech Republic, 2009; p. 218. [Google Scholar]
  18. Abonay, J.; Feil, B. Cluster Analysis for Data Mining and System Identification, 1st ed.; Springer Science & Business Media: Berlin, Germany, 2007; p. 319. [Google Scholar]
  19. Backhaus, K.; Erichson, B.; Plinke, W.; Weiber, R. Multivariate Analyse Methoden; Springer: Munich, Germany, 2006; p. 831. [Google Scholar]
  20. Everitt, B.S.; Landau, S.; Leese, M.; Stahl, D. Cluster Analysis, 5th ed.; Wiley: London, UK, 2011; p. 348. [Google Scholar]
  21. Hebak, P. [Vicerozmerne Statisticke Metody s Aplikacemi] Multivariate Statistical Methods with Applications; SNTL/ALFA: Praha, Czech Republic, 1987; p. 456. [Google Scholar]
  22. Pekarcikova, M.; Trebuna, P.; Kral, S.; Duda, R. [Logistika pre Priemyselne Inzinierstvo] Logistics for Industrial Engineering, 1st ed.; TUKE: Košice, Slovakia, 2021; p. 333. [Google Scholar]
  23. Glova, J.; Mrazkova, S.; Dancakova, D. Measurement of intangibles and knowledge: Empirical evidence. AD Alta-J. Interdiscip. Res. 2018, 8, 76–80. [Google Scholar]
  24. Buckova, M.; Krajčovič, M.; Edl, M.; Bujnak, J.; Guagliano, M. Computer simulation and optimization of transport distances of order picking processes. In Proceedings of the 12th International Scientific Conference of Young Scientists on Sustainable, Modern and Safe Transport, High Tatras, Slovakia, 31 May–2 June 2017; Volume 192, pp. 69–74. [Google Scholar]
  25. Straka, M.; Saderová, J.; Bindzar, P.; Malkus, T.; Lis, M. Computer simulation as a means of efficiency of transport processes of raw materials in relation to a cargo rail terminal: A case study. Acta Montan. Slovaca 2020, 24, 307–317. [Google Scholar]
  26. Soo Jin, C.; Shah Amirul, A.; Md Taib, F. Tracking Hidden Quality Costs in a Manufacturing Company: An Action Research. Int. J. Qual. Reliab. Manag. 2011, 28, 405–442. [Google Scholar]
Figure 1. Method of cluster analysis.
Applsci 14 04343 g001
Figure 2. Model of cluster analysis.
Applsci 14 04343 g002
Figure 3. A simplified diagram of the application of cluster analysis in stocks.
Applsci 14 04343 g003
Figure 4. Schematic description of application of cluster analysis in stocks.
Applsci 14 04343 g004
Figure 5. Dendrogram of products.
Applsci 14 04343 g005
Figure 6. The proportion of clusters regarding the order.
Applsci 14 04343 g006
Figure 7. 2D layout of warehouse according to cluster analysis.
Applsci 14 04343 g007
Figure 8. 3D layout of warehouse according to cluster analysis.
Applsci 14 04343 g008
Figure 9. Structure of material economy management [22].
Applsci 14 04343 g009
Table 1. Basic mathematical statistics of values.
StatisticsMonths
123456789101112
Mean67.0066.8467.1666.7266.4865.2865.8066.0466.5667.0066.8467.16
Standard deviation68.5068.6968.6668.9669.1070.2269.4169.5068.5068.6968.6668.96
Sum167516711679166816621632164516751671167916681662
Table 2. Clusters of products.
ProductsMonths
123456789101112Σ
1. clusterNara chair eu. Ash hvidtonet000121200000002657
J108 chair, beech nature0000000012000
Nara bar high chair ash, black0170000000000
Nara bar H chair oak hvidto1800000000000
Nara bar low chair ash, black00000000001517
Nara bar L chair oak hvidto0023000000000
Nara chair ash, black0000002223232200
Nara chair oak hvidtonet34292830230000000
J104 chair, beech lack191919201920191920192019
J108 chair, beech black212121212121212121212121
J77 chair, beech red484748474747484748474847
J110 chair, beech grey404040393939393939393940
J104 chair, beech red313132313333323133313431
J110 chair, beech red323233323233323432333232
2. clusterJ77 chair, beech grey7778777778777778777778776111
J110 chair, beech nature717271727172717271727172
J110 chair, beech white636361636363626363626363
J104 chair, beech white112112112112112112112112112112112112
J104 chair, beech grey989898989899989899989898
J110 chair, beech black878789878790878789878787
3. clusterJ77 chair, beech nature13813913913813913813913913813813913911,109
J77 chair, beech white155155155156155155155156155155155155
J77 chair, beech black229229229229229230229229229229229229
J104 chair, beech lack215215215215215215215215215215215215
J104 chair, beech black187187189189189188187188188188187188
Disclaimer/Publisher’s Note: The statements, opinions and data contained in all publications are solely those of the individual author(s) and contributor(s) and not of MDPI and/or the editor(s). MDPI and/or the editor(s) disclaim responsibility for any injury to people or property resulting from any ideas, methods, instructions or products referred to in the content.

