Abstract
To investigate the damage characteristics of the lower critical damage coal samples under different perimeter pressure unloading spans, a 13-group plus unloading perimeter pressure and then uniaxial loading test scheme was designed. Firstly, the coal samples were subjected to triaxial lowering and raising of the circumferential pressure to determine the critical damage range of the coal samples. Finally, acoustic emission signal, fractal theory, and energy theory were used to study the mechanical characteristics of the coal samples during damage. The results show that the surface cracks of the critically damaged coal samples develop from tension cracks to coexistence of tension and shear cracks to shear cracks as the unloading span of the surrounding pressure of the critically damaged coal samples decreases; through the triaxial unloading–uniaxial reloading experimental scheme, the critical damage range of the coal samples is determined as 60–70% of the triaxial compressive strength during axial pressure loading in the process of surrounding rock stress adjustment. The smaller the unloading span of the critically damaged coal sample, the smaller the peak strength of the sample, the more severe the damage, the weaker the energy storage capacity, the weaker the ability to deform elastically, the easier it is for the specimen to crack and deform plastically, and the larger the weak surface formed in the specimen, resulting in the larger the size of the fragment produced by the damage, the smaller the fractal dimension.
1. Introduction
The intrinsic mechanical mechanism of the continuous deformation of the roadway surrounding rock after excavation is the process of stress adjustment of the perimeter rock from a higher triaxial stress state until it reaches equilibrium [1,2,3]. This process causes the weakening of the surrounding rock, causing power disasters such as rock bursts, seriously affecting the construction of the project and the personal safety of workers. Therefore, it is of great significance to study the mechanical properties of the unloaded rock body to analyze the stability of the surrounding rock and to determine a reasonable support method for the surrounding rock.
After the roadway is excavated, the surrounding rock stresses are adjusted again, forming crushed zones, fissure zones, and original rock stress zones. Many scholars have carried out a series of studies on the phenomenon of decreasing confining pressure and increasing axial pressure within the rift zone, focusing on different loading and unloading paths [4,5,6,7], fractal characteristics [8], acoustic emission signals [9,10,11,12], and energy evolution [13]. For example, Qiu, S.-L [5] designed an incremental cyclic loading and unloading pressure test (ICLUP text) and proposed a new model to characterize the evolution of pre-peak unloading damage; Hong, L. [8] found an exponential relationship between the energy consumption density and the average size of rock chips through impact tests and analyzed the impacted fragments. In engineering, acoustic emission (AE) monitoring systems are commonly used to monitor the signals generated by the internal rupture of the material during the whole process from loading to damage and are used to analyze the damage and destruction characteristics of the material [14,15,16,17,18]. For example, Sagasta, F. [19] proposed a correction method for the b-value of acoustic emission and used it to analyze local damage in reinforced concrete structures subjected to dynamic loading; Abdul Kudus, S. [20] quantified the extent of damage to concrete structures under fatigue loading by analyzing the acoustic emission signals generated from three-point bending tests with four different concrete volumes in terms of b-value, improved b-value (Ib-value), severity, and strength. However, during the stress adjustment process, the stress on the radial direction of the roadway is distributed in a gradient, which causes structural level damage to the surrounding rock, so the consideration of gradient stress more accurately presents the surrounding roadway rock stress situation. In this regard, Guo, X. [21] analyzed the stress distribution pattern around the roadway and provided an analytical solution for the stress distribution in the plastic zone of the circular roadway; Zuo, J. [22] proposed the theory of gradient damage, which suggests that the stress gradient at depth is an important factor in the occurrence of damage in the surrounding rock.
After the roadway is excavated, under the action of gradient stress, the surrounding pressure forms different unloading spans, causing different degrees of damage to the surrounding rock. Numerous scholars have focused on the study of the mechanical properties of the rock body after stress redistribution and different damages to the surrounding rock, but the study of what kind of bearing capacity the critically damaged surrounding rock still has is still relatively weak. Therefore, this paper designs 13 groups of plus and minus circumferential pressure schemes to explore the critical damage range of coal samples. Secondly, a uniaxial loading test was carried out on the critically damaged coal samples, and finally, AE acoustic emission signal, fractal theory, and energy theory were utilized to investigate the characteristics of the critical damage of coal samples under the action of different radial gradient stresses, so as to provide theoretical guidance for the analysis of the stability of surrounding rock and the support of the roadway.
2. Coal Sample Preparation and Experiments
2.1. Coal Sample Preparation
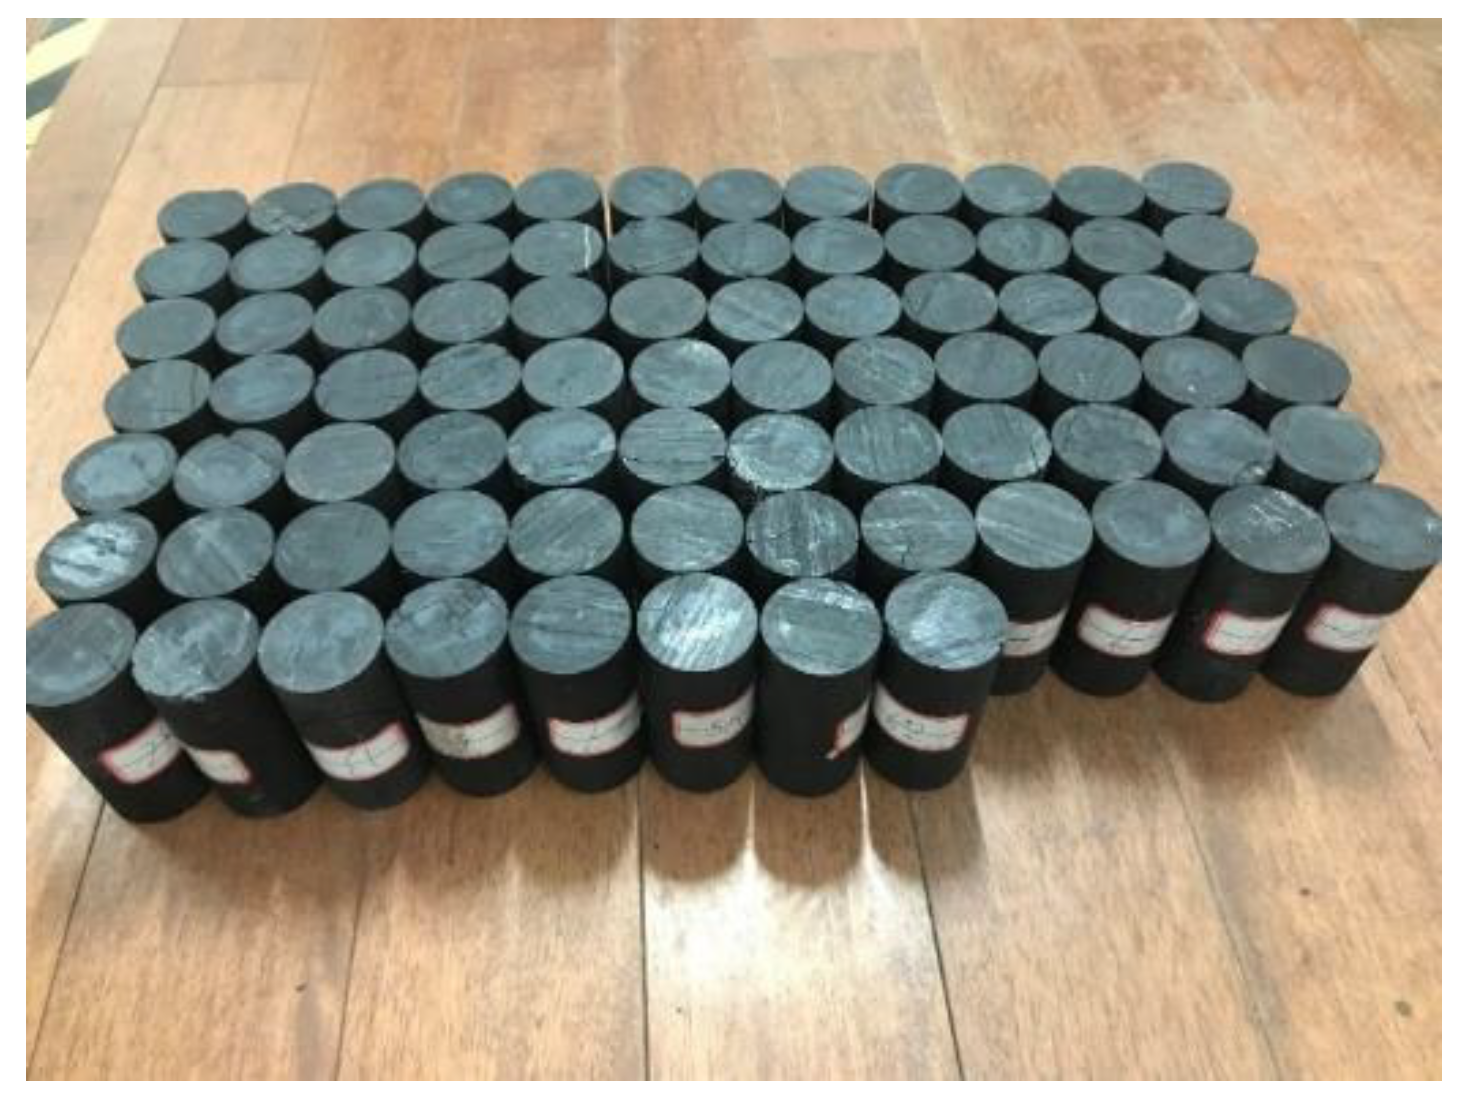
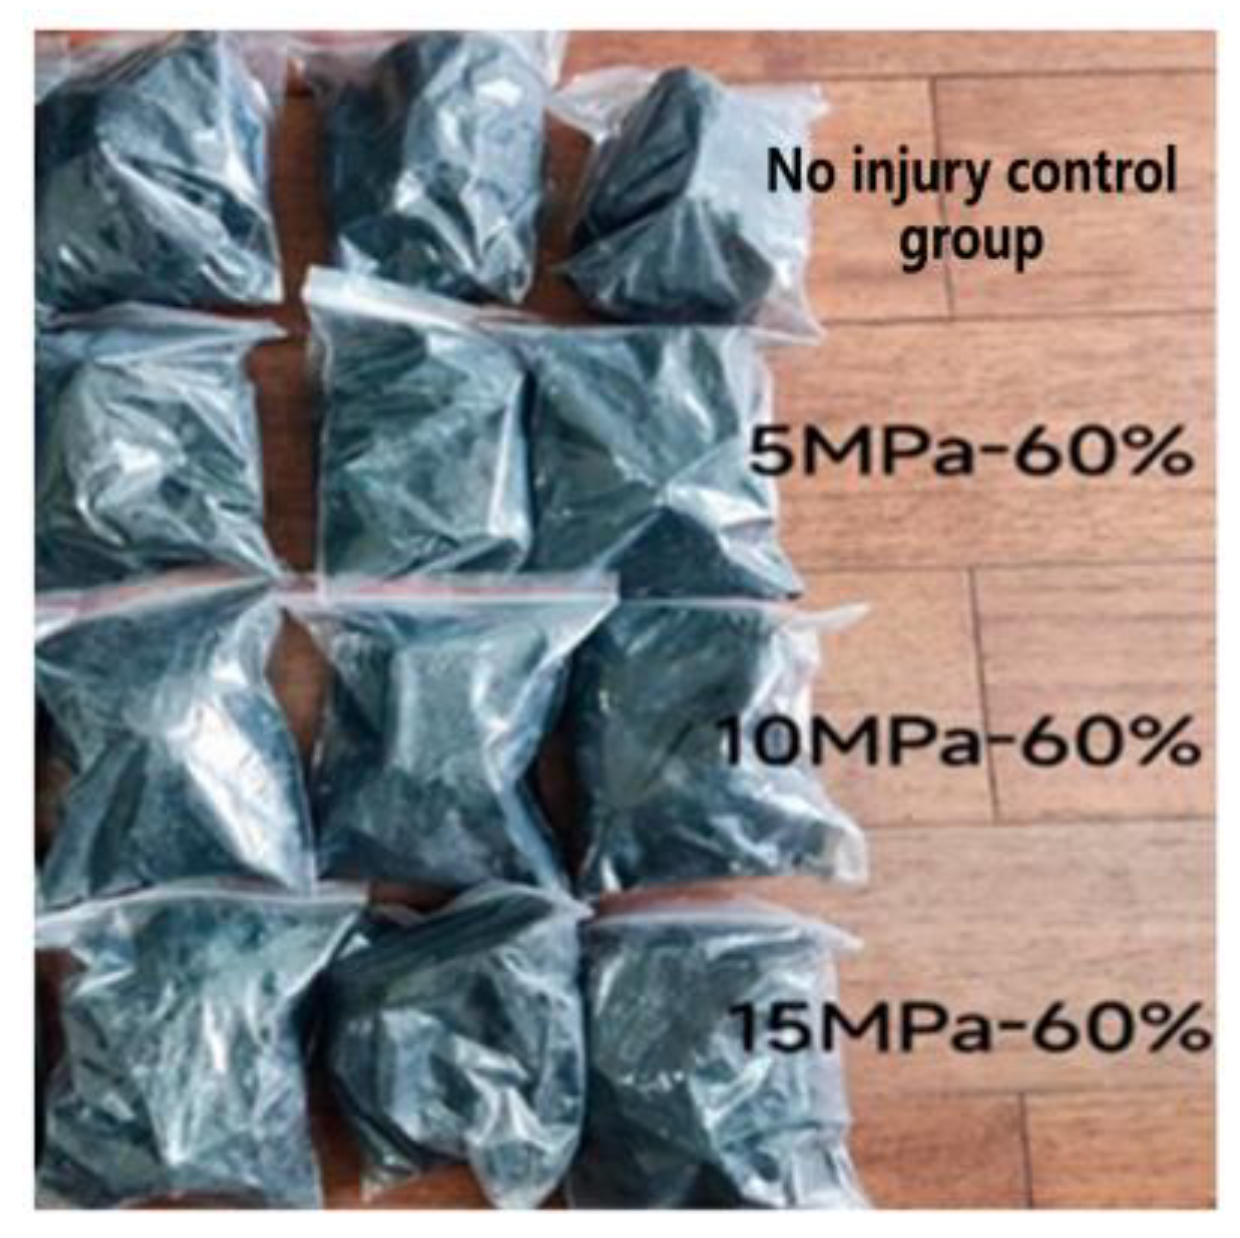
To study the deformation and damage characteristics of the critical coal rock under different confining pressure unloading spans, firstly, the triaxial compressive strength of the confining pressure at 5 MPa, 10 MPa, and 15 MPa was determined, which required a total of 9 specimens, and then 12 groups of unloading–re-uniaxial loading experiments and 1 group of no-damage control experiments were designed, with 39 specimens for each group of 3, which required a total of 48 specimens (A total of 80 coal samples were prepared to account for possible test failure, as shown in Figure 1). In this study, the uniaxial compression test was carried out on self-coal samples, which were machined into standard cylindrical specimens of 50 mm × 100 mm (diameter × height), and the perpendicularity and flatness of the end surfaces of the specimens were complied with the ISRM standard [23].

Figure 1.
Coal samples.
2.2. Determination of Initial Damage to Coal Samples
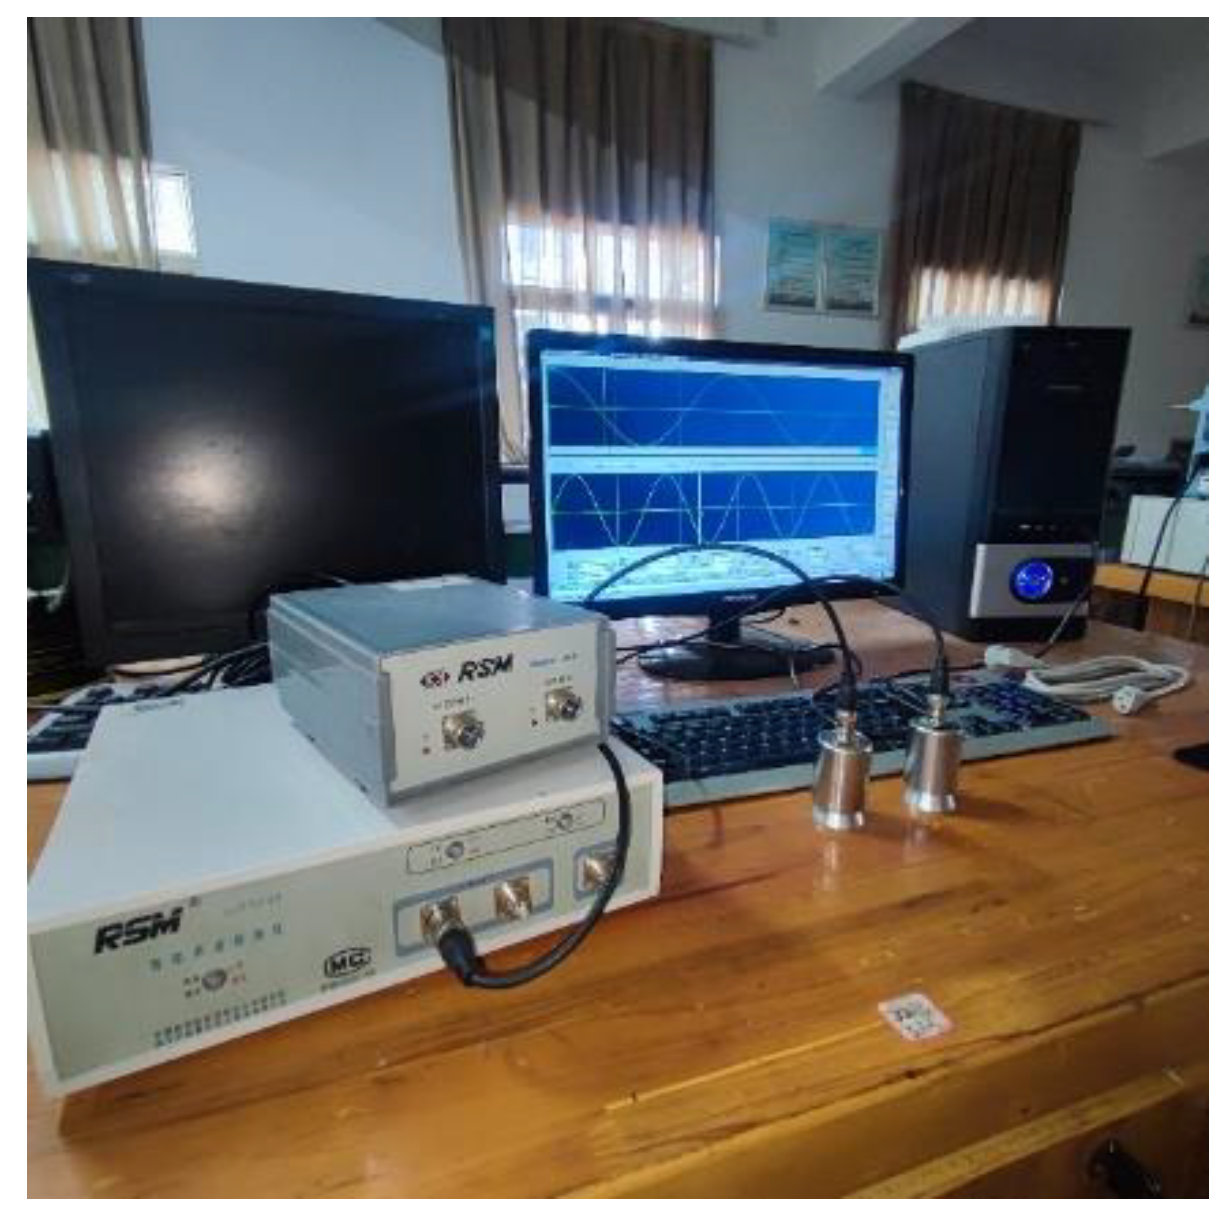
The RSM-SY5 sonic velocimeter was used to test the propagation velocity of sound waves in the coal sample pieces at the same acoustic emission frequency to determine the initial damage to the coal samples, from which 48 specimens were selected as experimental samples to avoid large dispersion of data due to different initial damage. The wave velocity values of the 48 selected coal samples are shown in Table 1. The RSM-SY5 sonic velocimeter equipment is shown in Figure 2.

Table 1.
Wave velocity of specimen.

Figure 2.
RSM-SY5 acoustic velocimeter.
As can be seen from Table 1, the wave velocities of the 48 coal samples were all between 1500 and 1700 m/s, with a small difference in wave velocity, and the initial damage level of the 48 specimens can be regarded as consistent. In this paper, the initial damage is regarded as a no-damage state.
2.3. Triaxial Compressive Strength Determination
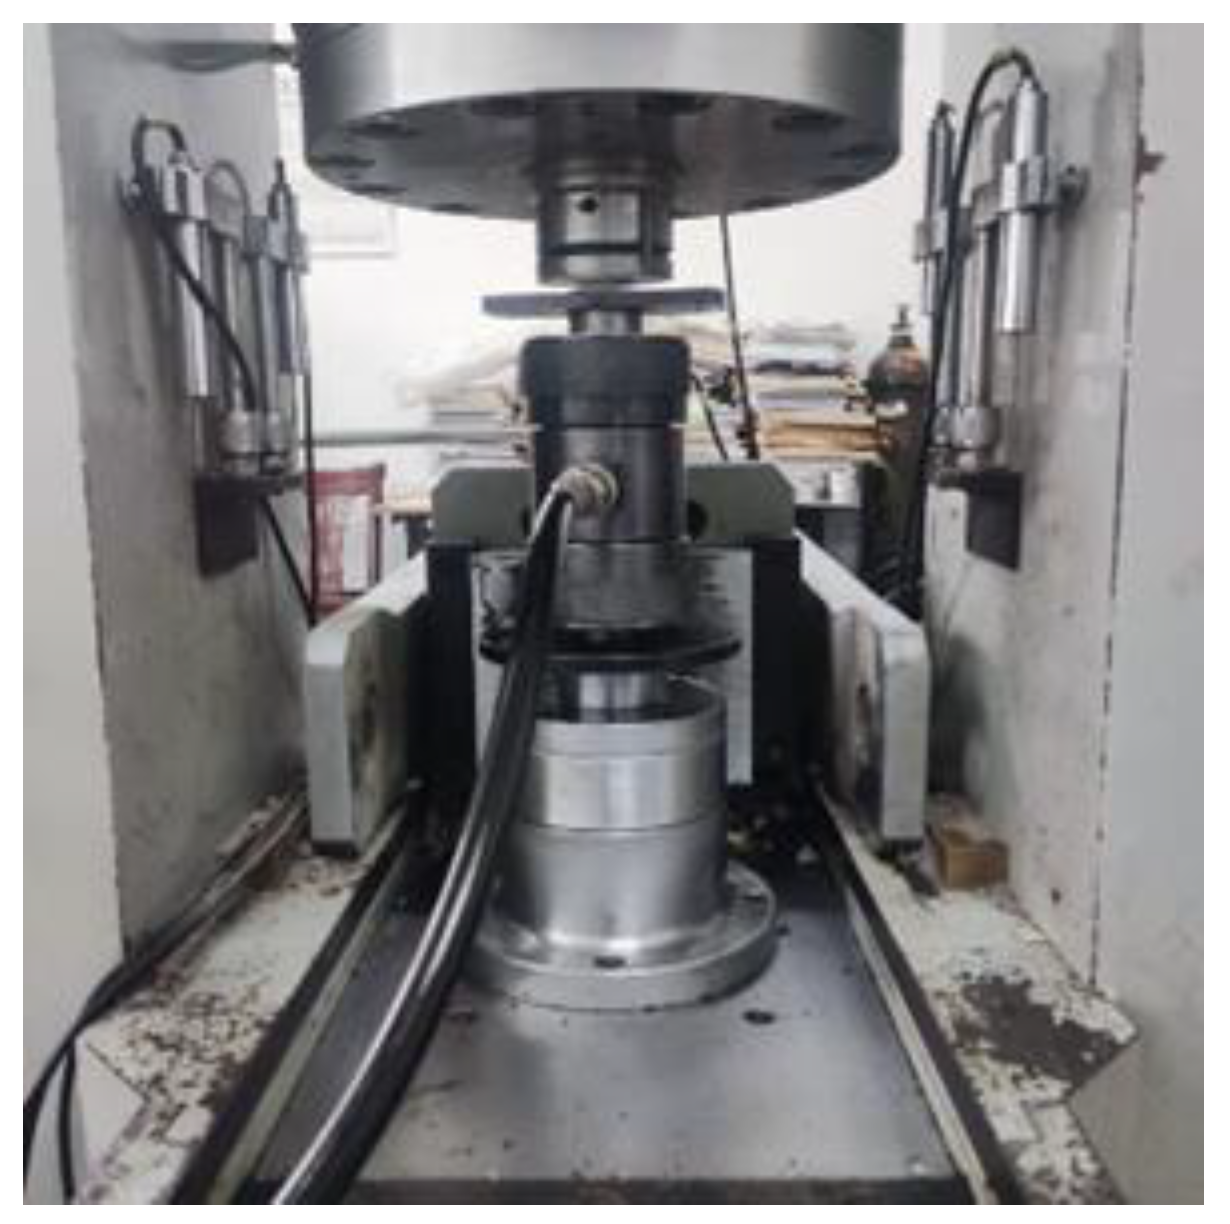
In order to determine the triaxial compressive strength of the coal samples when the enclosing pressure is 5 Mpa, 10 Mpa, 15 Mpa, the coal samples were loaded into the RMT-150 C rock mechanics testing machine (Wuhan Institute of Rock Mechanics, CAS–China, False triaxial test is shown in Figure 3). The axial pressure rate was set at 0.1 KN/s, and the confining pressure rate was 0.05 Mpa/s. After the confining pressure reached the predefined target value, the axial pressure continued to increase until the coal samples were destroyed. In order to ensure the accuracy of the test results, three tests were performed for each enclosing pressure and the arithmetic mean of the results of the three tests was calculated, as shown in Table 2.
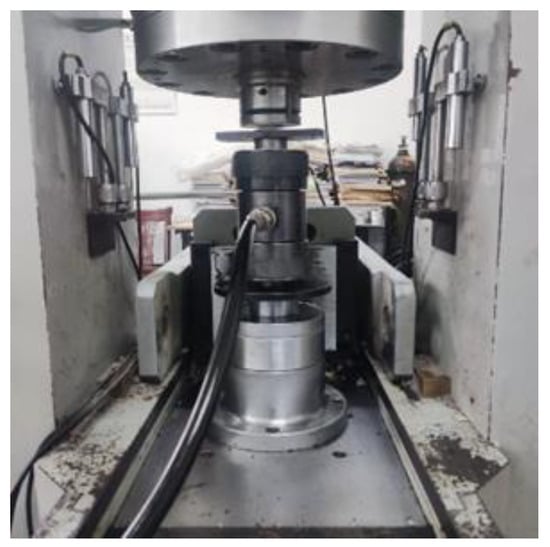
Figure 3.
False triaxial test.
Table 2.
Triaxial compressive strength under different confining pressures.
2.4. Preparation of Damaged Coal Samples
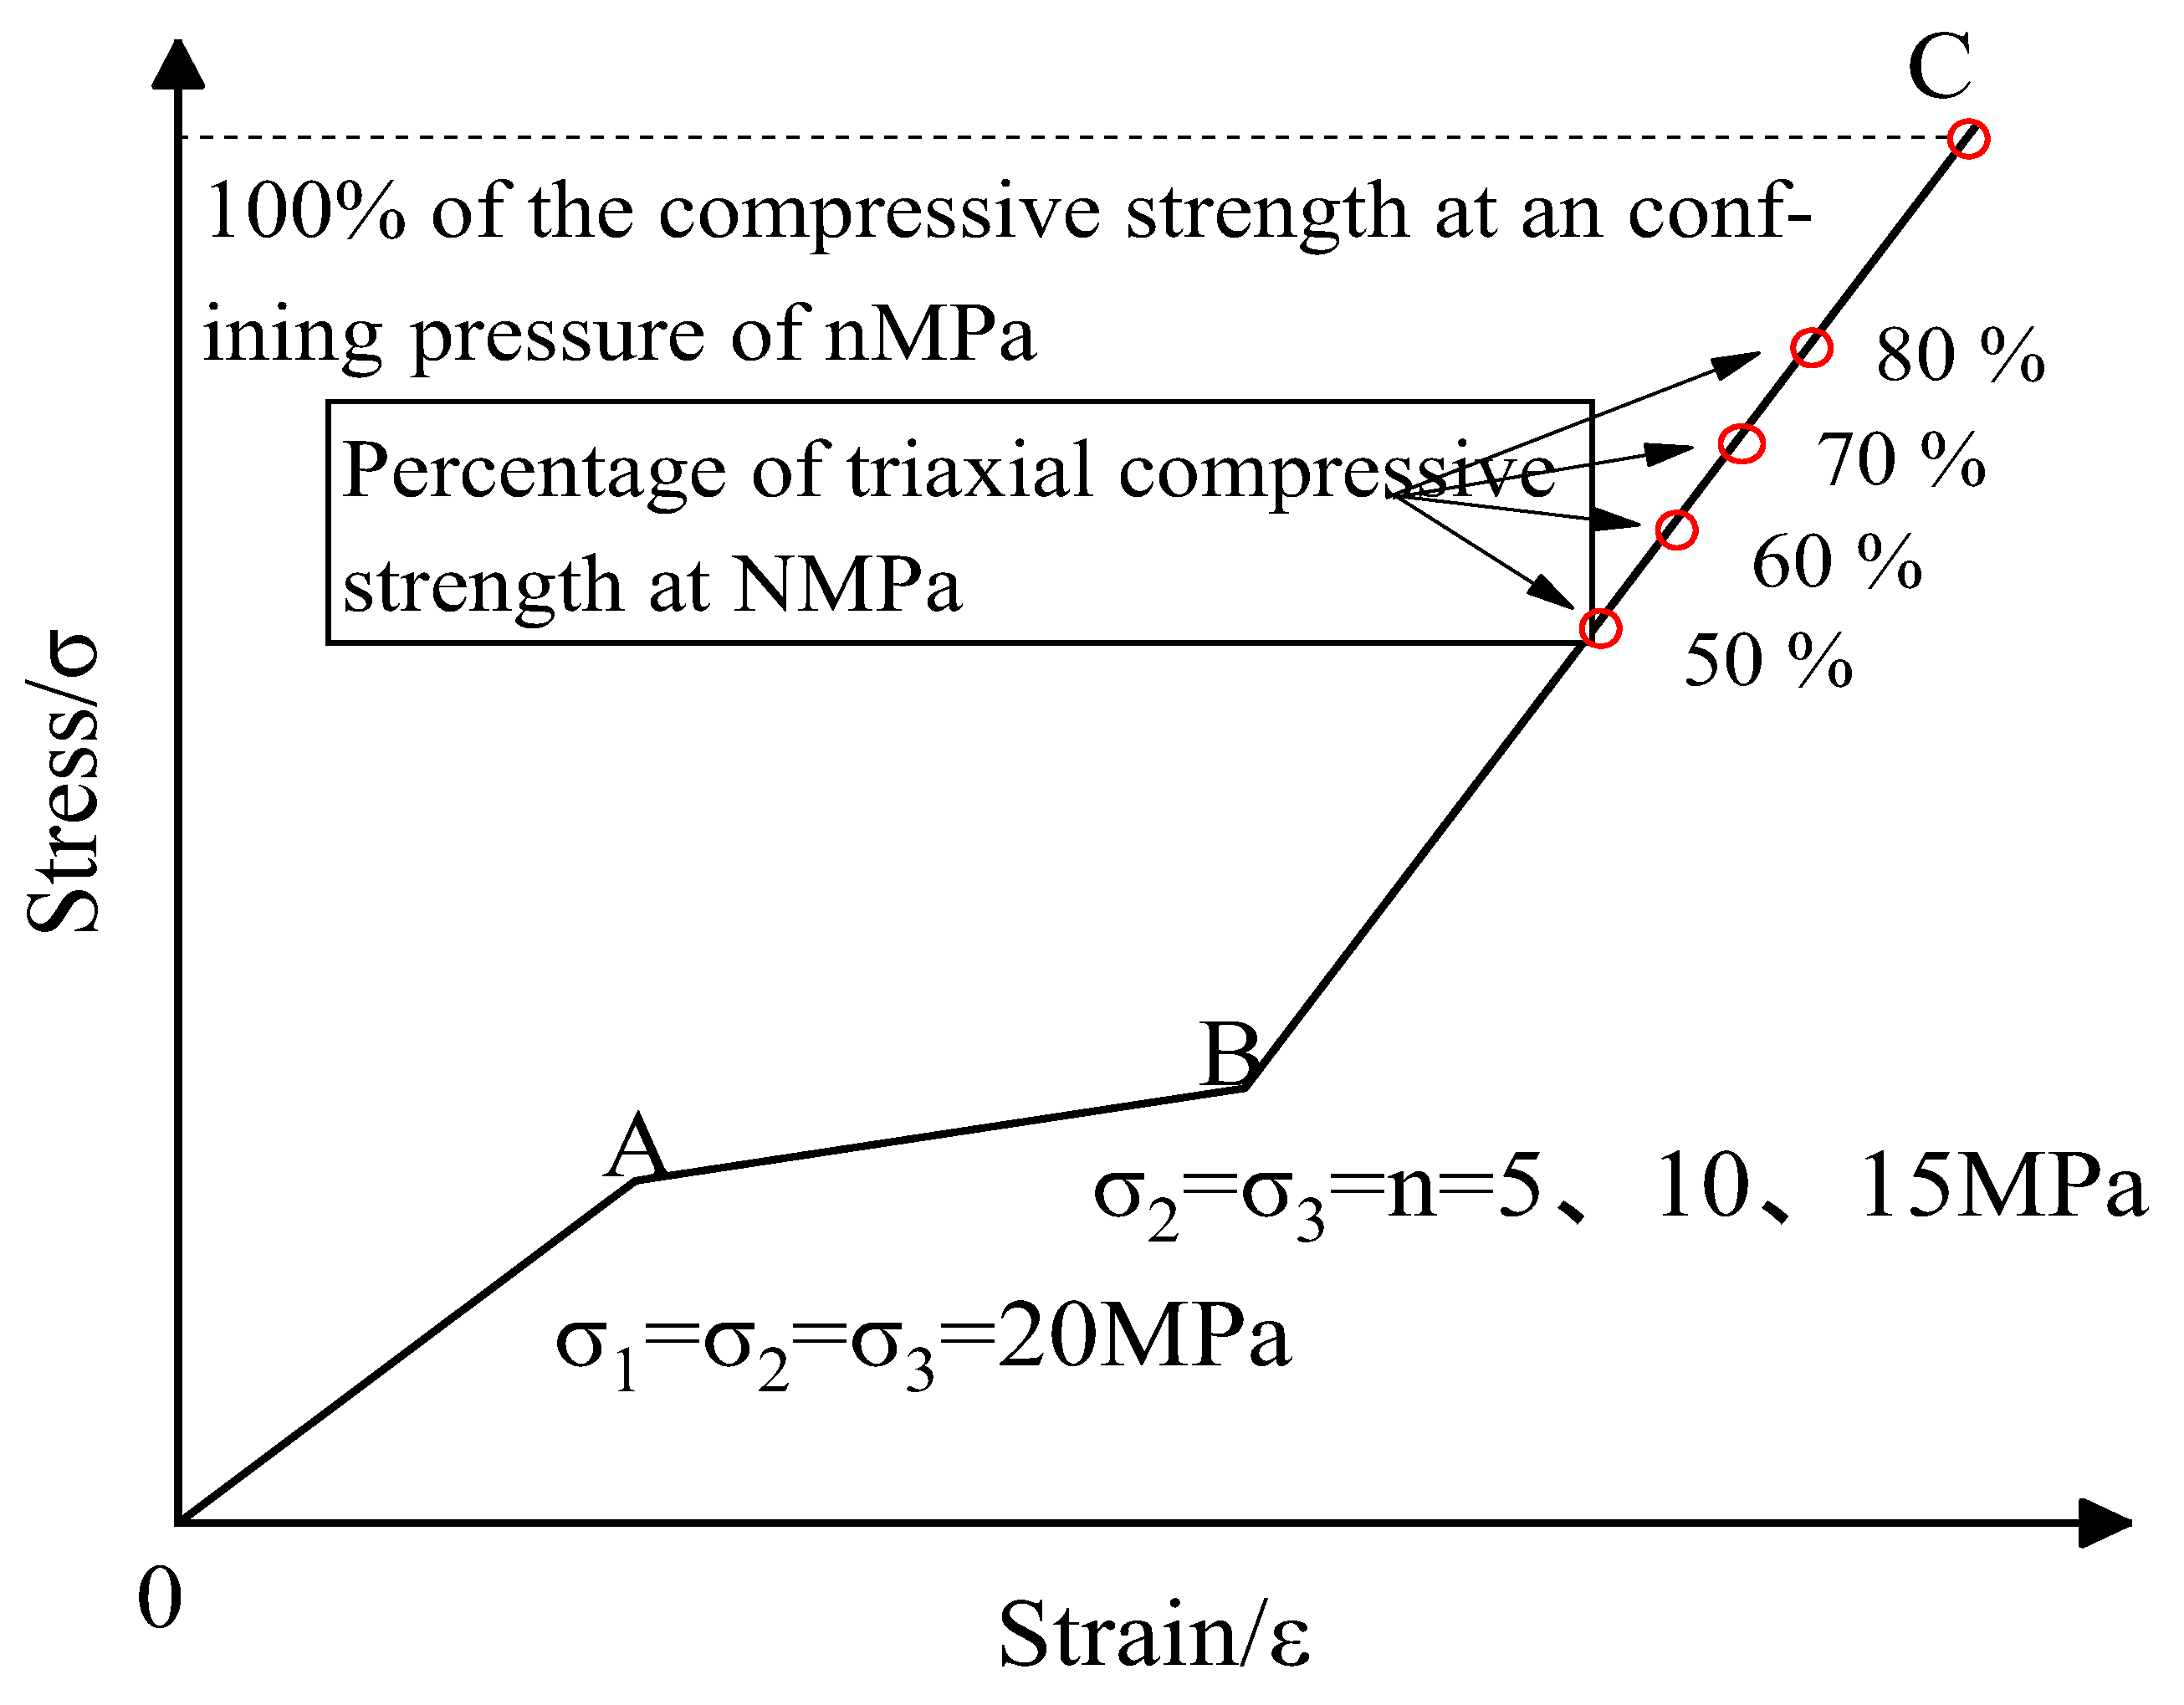
Martini, C. [24] believed that rock damage occurs after rock loads are loaded to 40% of their peak strength. Tao, M. [25] found that when rocks under 3D stress state experience unloading, the process is dominated by the strain energy density (SED) rate. The effects of different unloading paths and different confining stresses can be characterized by the SED rate. Given this, a pseudo three-axis test was first carried out using the RMT-150C servo pressure machine, using a load control scheme where the confining pressure and axial pressure were loaded to 20 MPa at a rate of 0.05 MPa/s and the axial pressure at a rate of 0.1 kN/s, simulating hydrostatic pressure at a burial depth of 800–1000 m (as shown in paragraph OA of Figure 4, where denotes the axial or maximum principal stress; and denote the transverse or intermediate and minimum principal stresses, respectively). Then, a load control scheme was used to lower the circumferential pressure and raise the axial pressure at a rate of 0.1 kN/s and 0.05 MPa/s to reduce the circumferential pressure to nMPa (n = 5, 10, 15), with the span of 15 MPa, 10 MPa, and 5 MPa (Figure 4, paragraph AB). The redistribution of stresses in the surrounding rock after excavation was simulated. Finally, the axial stresses were loaded to 50%, 60%, 70%, and 80% of the compressive strength at the envelope pressure of nMPa, while maintaining the envelope pressure of nMPa (Figure 4, paragraph BC). The different damage conditions of the radial stress gradient distribution on the critical damage of the rock after the excavation of the roadway were simulated to explore the critical damage range of the coal samples.
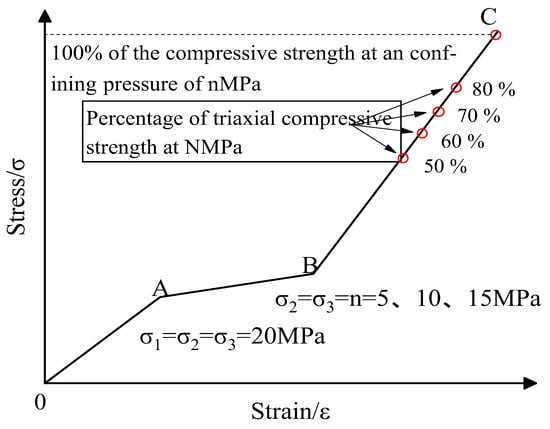
Figure 4.
Loading path.
3. Critical Damage Coal Sample Determination
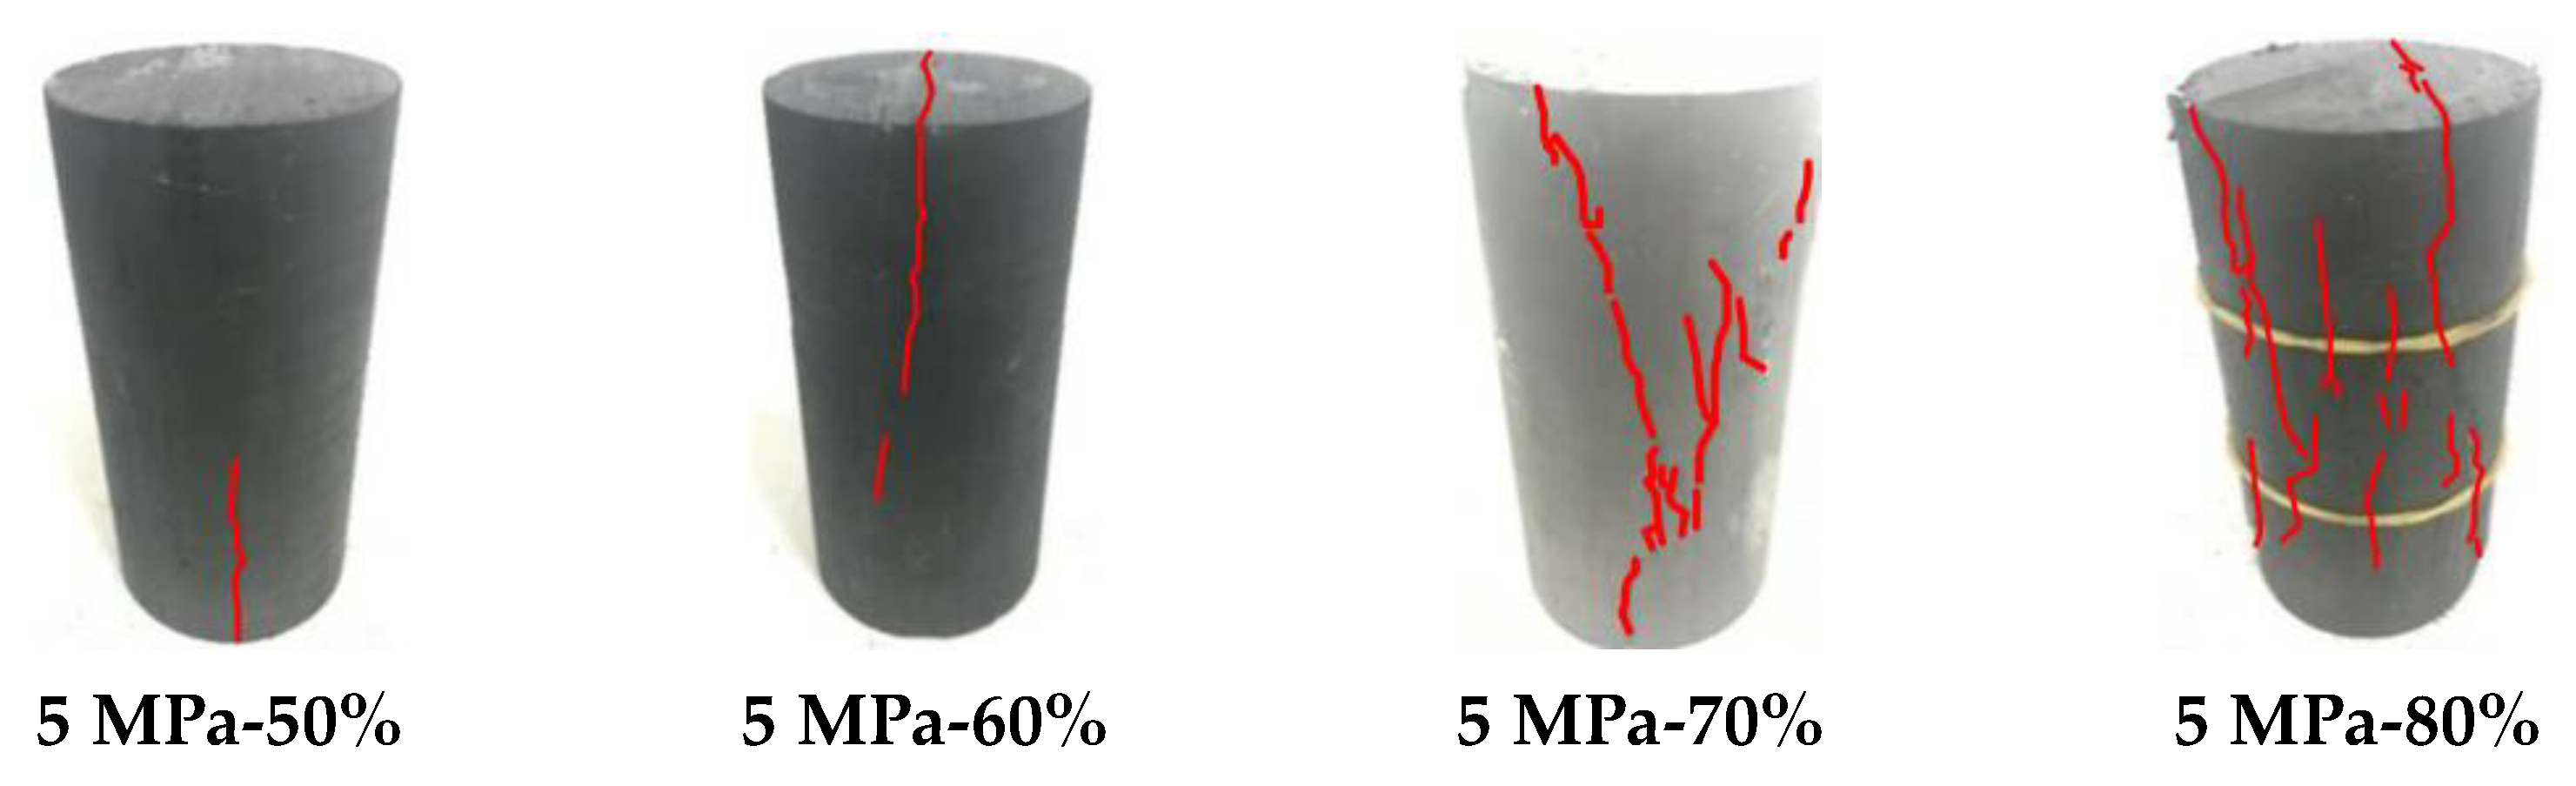
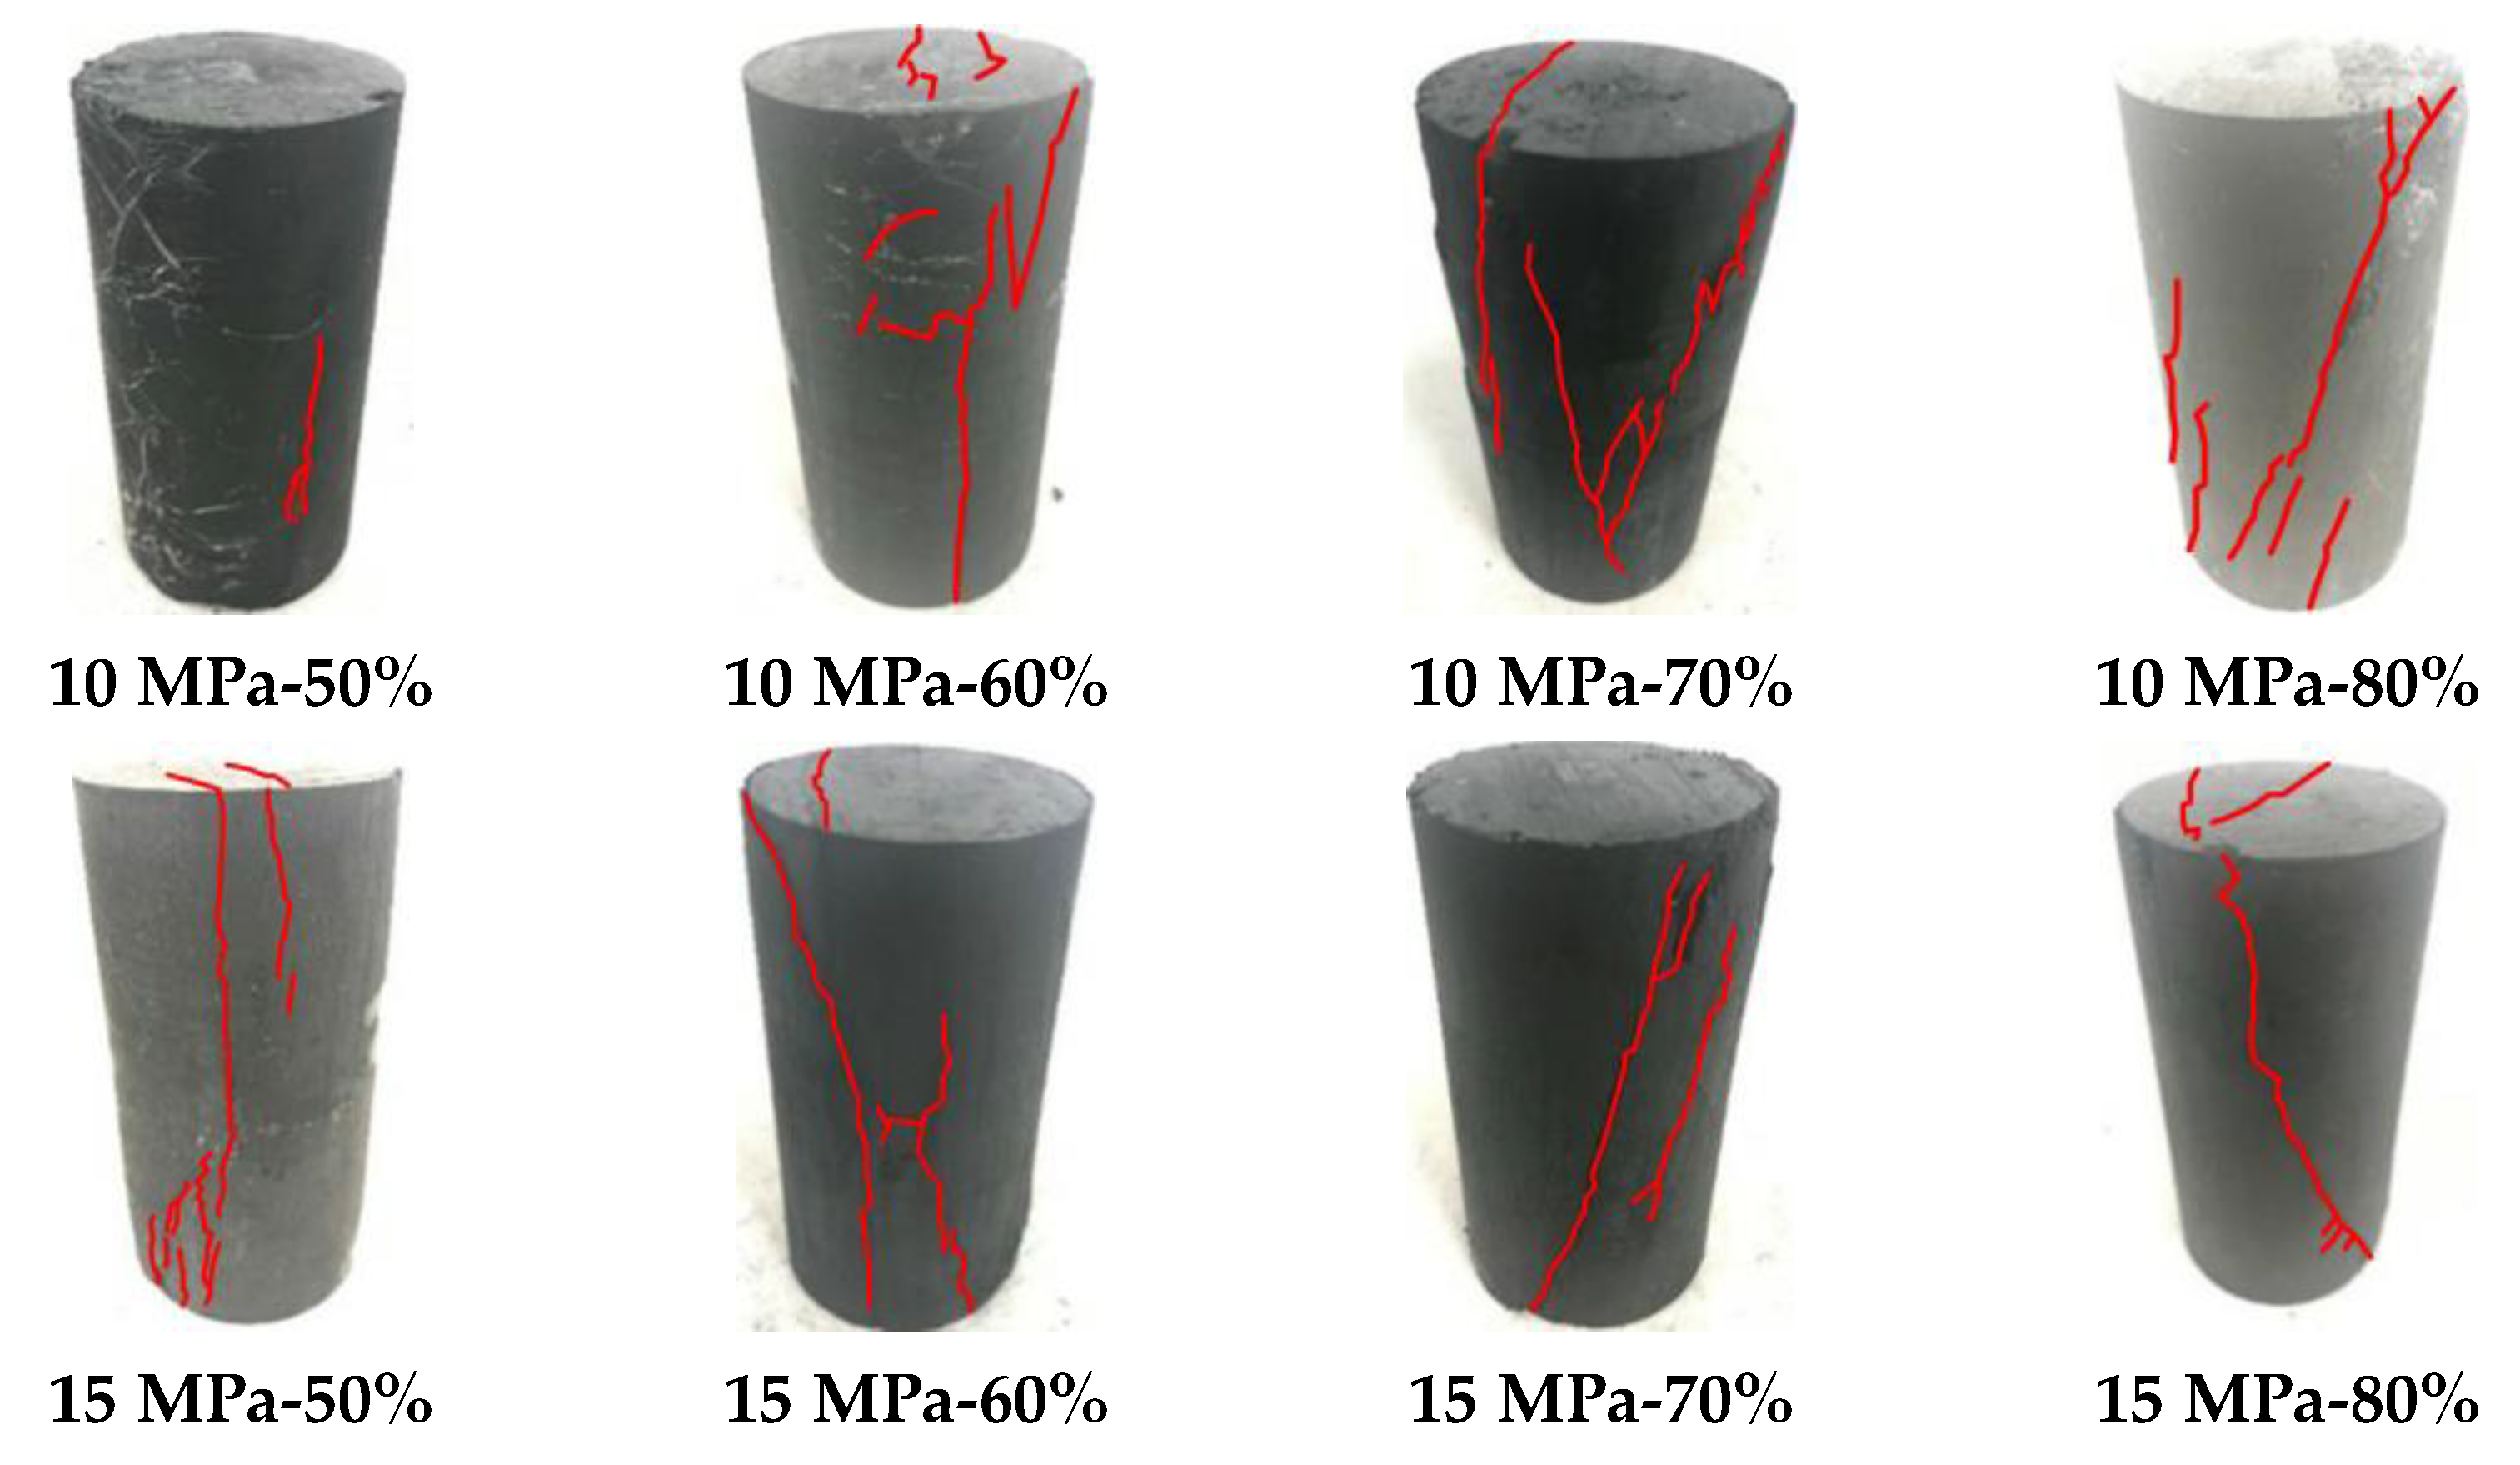
The RMT-150C triaxial loading and unloading test was used to simulate the damage to the surrounding rock under different stress gradients in the radial direction after excavation of the roadway according to the triaxial damage coal sample diagram shown in Figure 5 (where 5 MPa-50% indicates that the confining pressure decreases from 20 MPa to 5 MPa, and the axial pressure is loaded to 50% of the triaxial compressive strength at 5 MPa). According to the damage patterns of coal samples under different unloading gradients shown in Figure 5, in the mechanical damage test of coal samples, axial stress loading to the triaxial compressive strength of 70% and above, for the relief of the confining pressure prepared damage coal samples, damage and failure is extremely serious, cracked completely through; this time, the coal samples no longer have bearing capacity, cannot be regarded as damaged coal samples. The integrity of the damaged coal rock prepared by unloading the perimeter pressure after axial stress loading to 50% of its triaxial compressive strength is better, and the same cannot be defined as the critical damage coal sample. Therefore, according to different unloading gradients, it is not difficult to judge that the axial stress loaded to 60% of the triaxial compressive strength is the critical damage value of the coal samples, and the subsequent uniaxial reloading test is carried out on this basis.

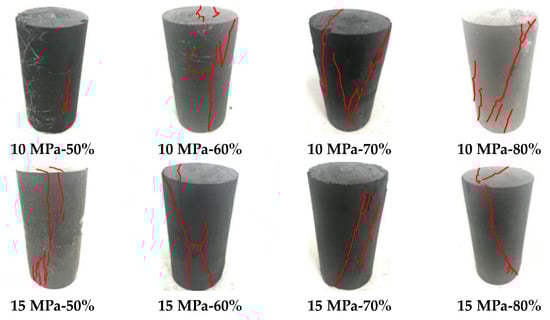
Figure 5.
Coal sample diagram with different damage.
4. Uniaxial Loading of Critically Damaged Coal Samples
4.1. Uniaxial Reloading Experiments on Critically Damaged Coal Samples
The selected critical damage coal samples were loaded using the RMT-150C testing machine with controlled displacement at a loading rate of 0.001 mm/s. The whole-day monitoring system SH-II produced by an American physical acoustic company was used for AE collection. The collecting frequency was 1 MHz; preamplifier gain was 40 dB; threshold value was 45 dB. Two Nano30 sensors (with 125–750 kHz frequency band) were used. The acoustic emission probe was set in the center of the coal sample before and after. At the beginning of the test, two wireless mice were used for the rock loading system and the acoustic emission detection system to work simultaneously(The uniaxial compression experiment is shown in Figure 6).
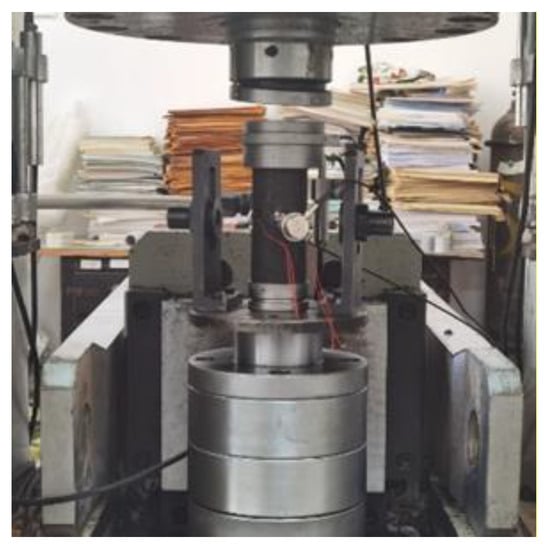
Figure 6.
Uniaxial compression experiment.
4.2. Stress Analysis of Critically Damaged Coal Samples
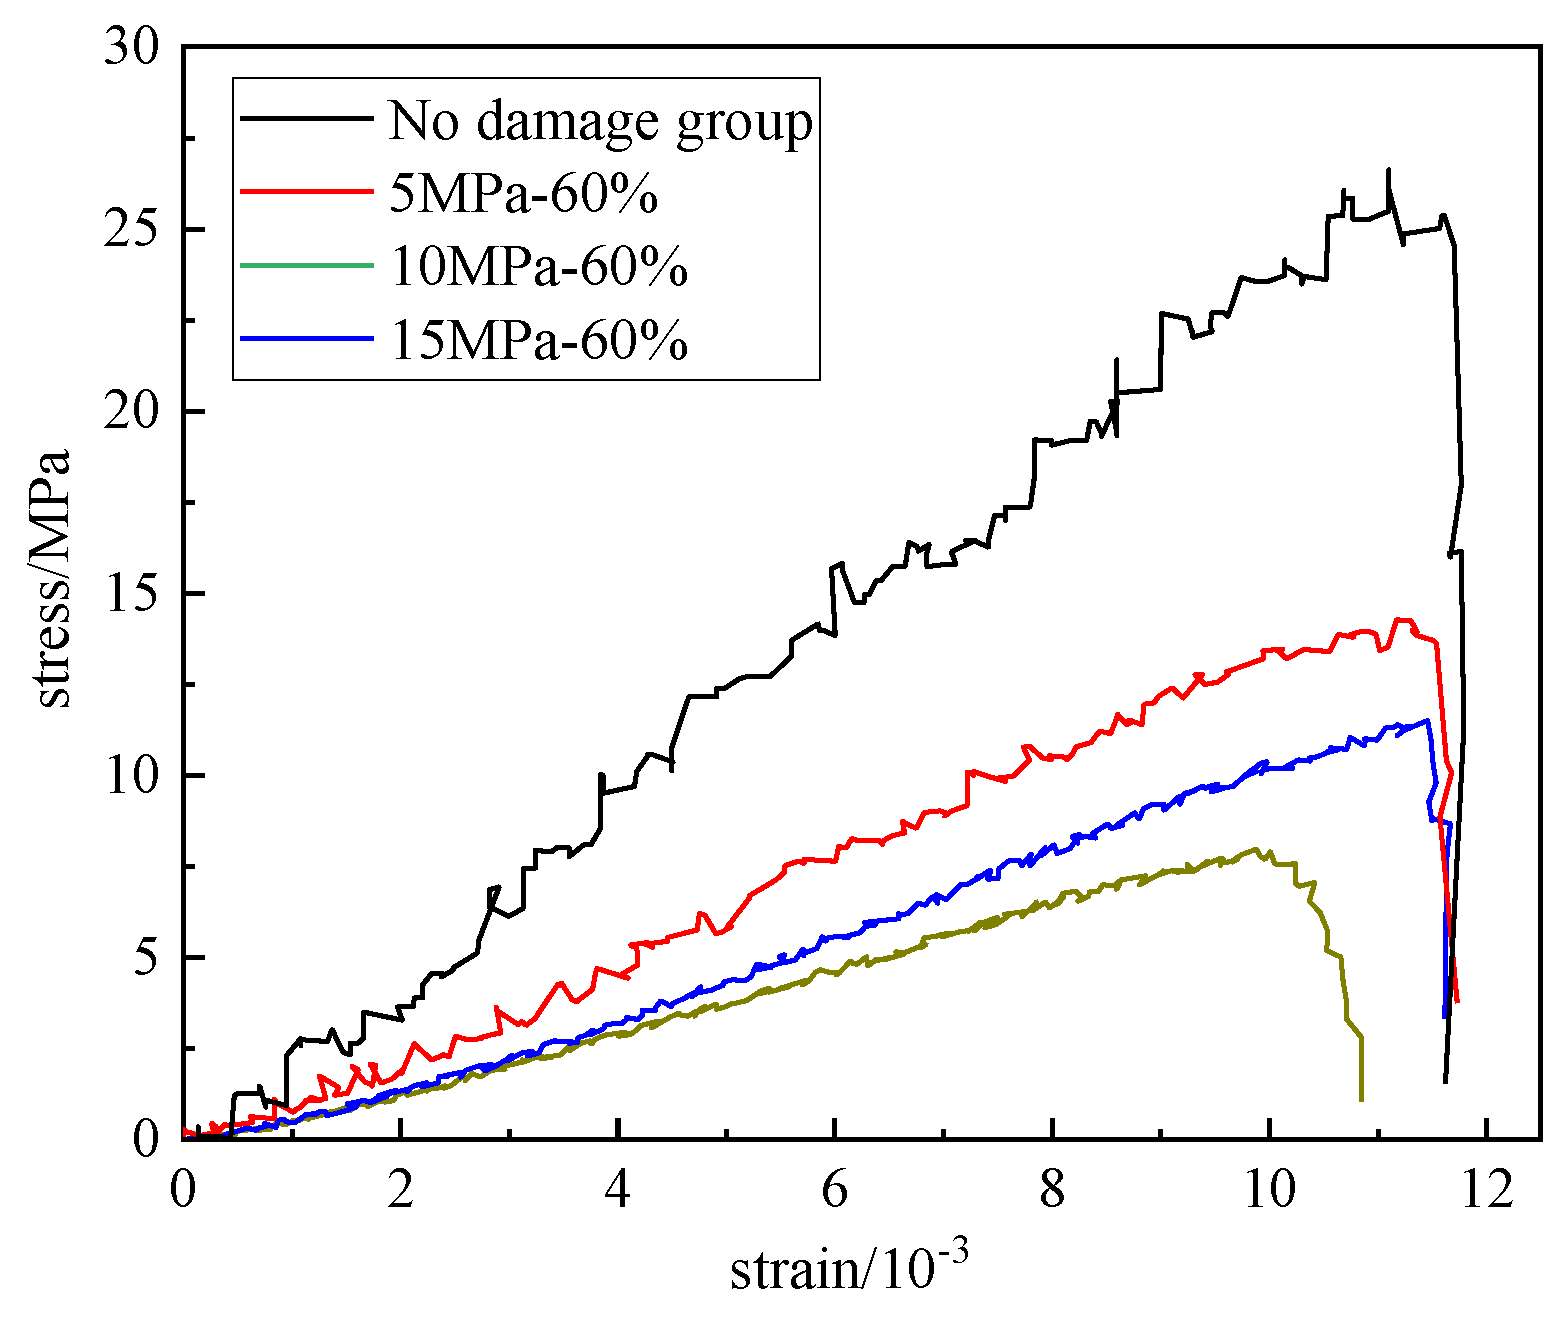
By performing one uniaxial compression experiment on coal samples with critical damage strength at different stress gradients and undamaged coal samples, the average peak intensity was derived from the three stress–strain curves for each group, and the curve closest to the peak point was picked out in each group and considered as the characteristic curve for that group, which is plotted in Figure 7 below, and the curves in this figure and their corresponding acoustic signals are used directly later.
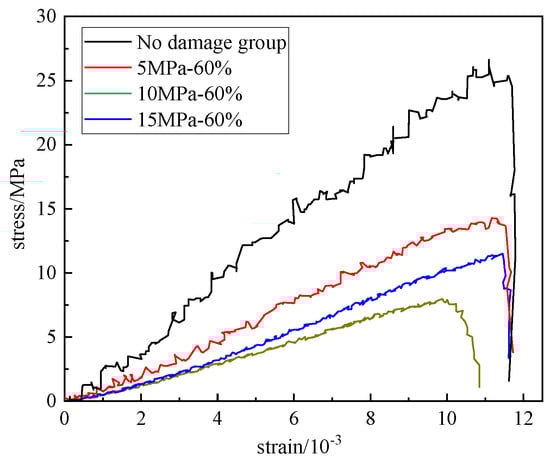
Figure 7.
Characteristic stress–strain curve.
Looking at Figure 7, from the peak strength, the peak strength of the undamaged coal sample was 26.62 MPa, and when the envelope pressure was reduced from 20 MPa to nMPa (n = 5, 10, and 15) and the axial pressure was loaded to 60% of the compressive strength at the envelope pressure of nMPa, the peak strengths of the coal samples were 14.27 MPa, 11.39 MPa, and 7.62 MPa, respectively. The peak strength decreased in the 10 and 15 MPa groups compared to the undamaged control group. In addition, the three groups of specimens without damage, 5 MPa and 10 MPa, showed obvious brittle damage, and the strength of the damaged coal samples fell rapidly after the stress reached the peak point, whereas the coal samples in the 15 MPa group no longer fell rapidly after the stress reached the peak strength, showing certain ductile damage characteristics. Confining pressures and unloading cause macroscopic mechanical deterioration of the coal sample, so peak strength was introduced as a parameter of damage to the sample, where D = 0 means no damage and D = 1 means damage to the sample. , where is the damage factor; is the uniaxial compressive strength of coal samples after damage; is the uniaxial compressive strength of undamaged coal samples.
According to Equation (1), the critical damage specimen strength damage was 0.46, 0.57, and 0.70. As the confining pressure unloading span decreases, the degree of damage to the coal sample increases in turn.
4.3. Acoustic Emission Signal Analysis
The uniaxial compression of a coal sample is accompanied by the emission of an acoustic signal. The relevant data measured using AE acoustic emission is used to more accurately describe the internal crack expansion during the damage of the coal sample. In this paper, the acoustic emission impact number and b-value are used to analyze the internal damage characteristics of coal samples during the loading process. The number of acoustic emission hits refers to any acoustic emission signal that passes the threshold and results in accumulated data for one system channel.
Variations in b-values determine the different scale variations of micro-ruptures within the coal rock body. A decrease in b-values implies an increase in the proportion of large events within the coal rock body and an increase in large-scale micro-ruptures.
Acoustic emission b-values (hereafter referred to as b-values) have previously been widely used in seismology and are commonly used to study the relationship between magnitude and frequency [26,27]. Commonly used ways to calculate the acoustic emission b-value are linear least squares, exponential least squares, and maximum likelihood estimation. One of the least squares G-R expressions is as follows [19,28]:
where N is the total number of earthquakes of magnitude higher than M. M is the amplitude of the earthquake on the Richter scale (which is a logarithmic scale) and b is the b-value.
When calculating the b-value during rock damage, since there is no concept of seismic magnitude, the value obtained by dividing the acoustic emission amplitude by 20 is usually equivalent to the seismic magnitude, making the distribution of the acoustic emission amplitude catalog and the seismic magnitude catalog roughly similar. The equation for calculating the acoustic emission b-value of rock damage using the least squares method is modified as follows [29,30]:
where A is the acoustic emission amplitude in db; is the cumulative number of acoustic emission events of amplitude; a is the empirical constant; b is the acoustic emission b value.
According to Equation (3), the equation that can be used to calculate the rock damage acoustic emission b-value using the minimum likelihood method is modified as:
where is the mean magnitude; is the minimum magnitude.
According to the statistics of the number of events of acoustic emission, the total number of acoustic emission events detected in the uniaxial reloading process of coal samples with different degrees of damage varied greatly, so when selecting the number of events of the samples, the samples were selected according to the total number of events of the specimen itself, and the sample window was selected between 1/10 and 1/14 of the total number of samples, and the window of the no-damage, 5 Mpa-60%, 10 Mpa-60%, and 15 Mpa-60% coal samples was 70, 150, 100, and 70, respectively. In addition, based on Equations (5) and (6), the b-value calculation formula was obtained as:
where is the average amplitude; is the minimum amplitude.
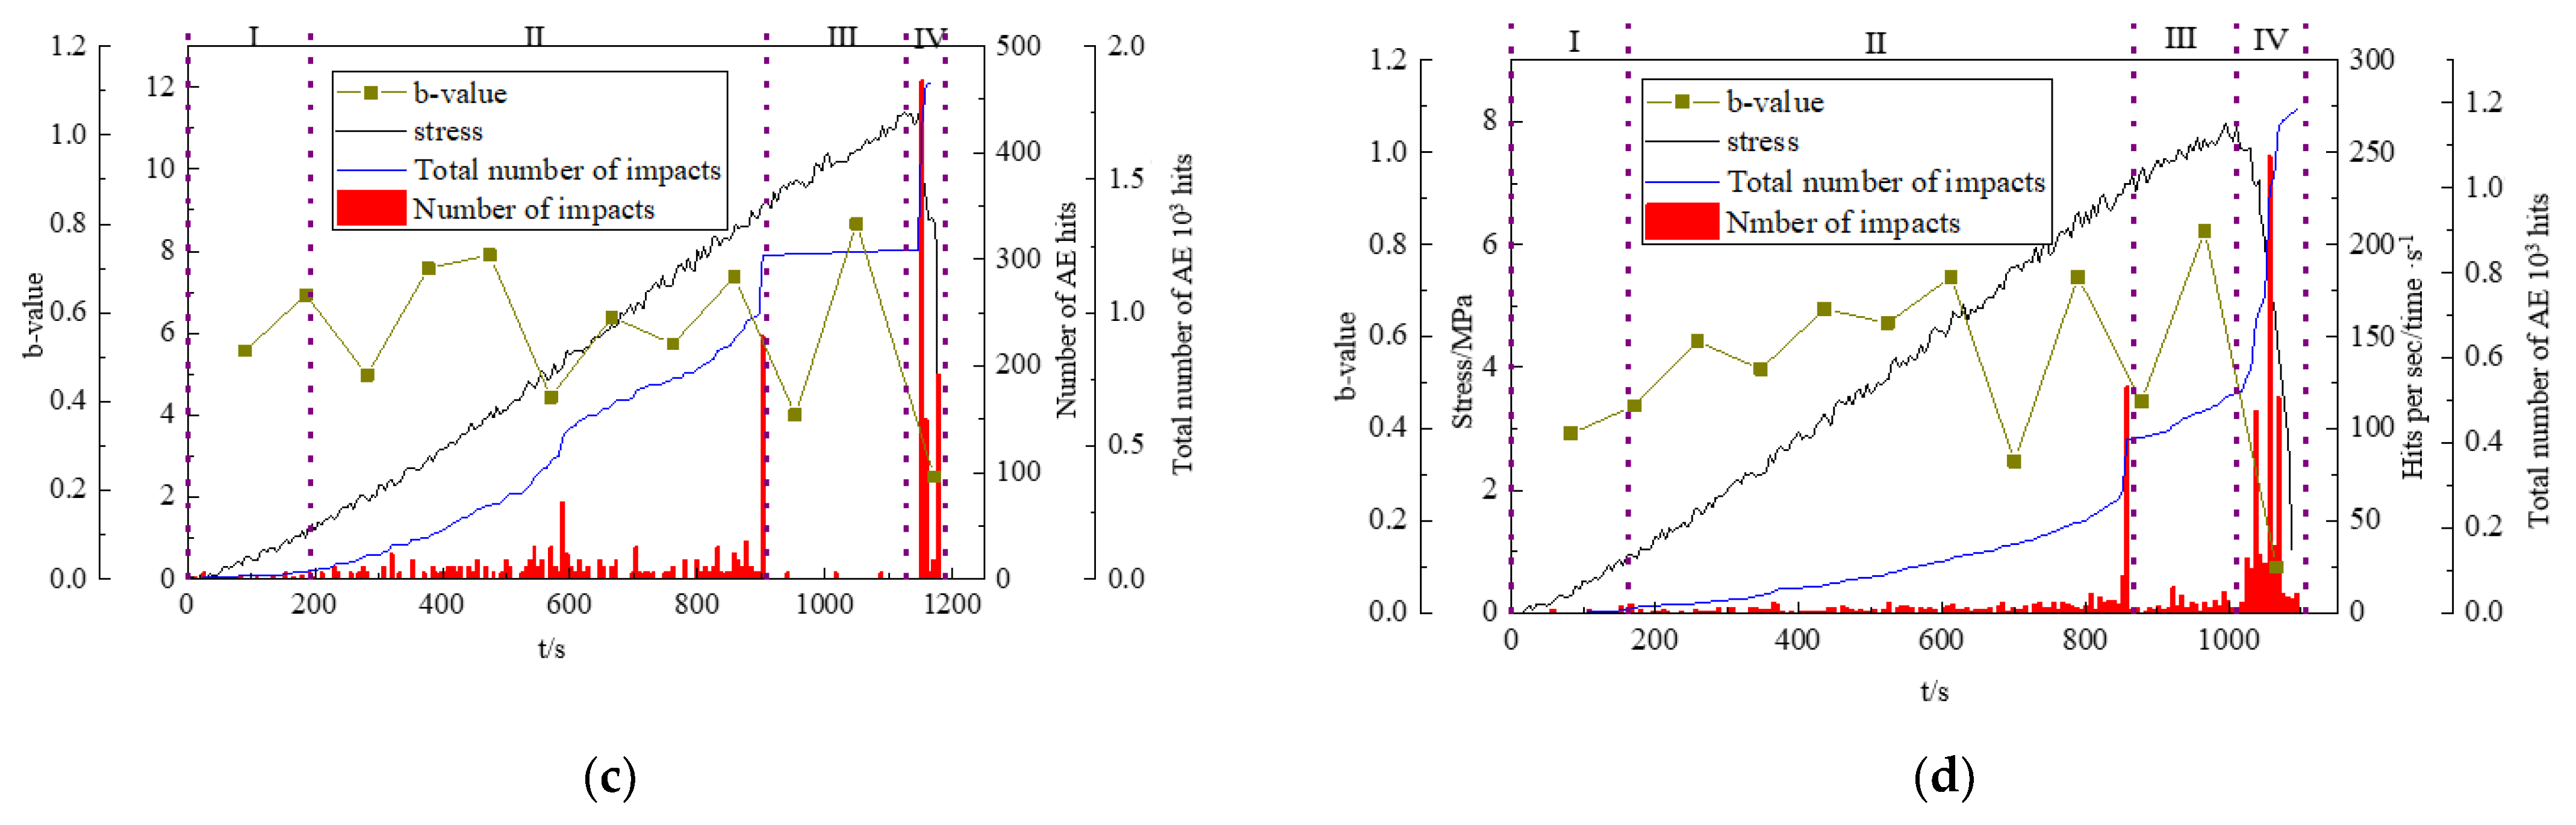
The b-value, number of impacts, and cumulative number of impacts of the coal sample were calculated from the acoustic emission signals corresponding to the characteristic curves and the above equations, and the curves of stress, b-value, number of impacts, and cumulative number of impacts versus time for different paths were plotted; see Figure 8.
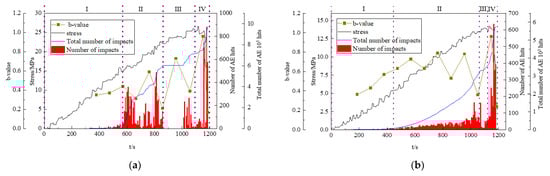
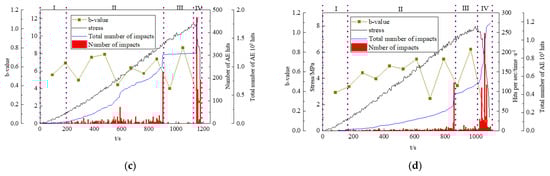
Figure 8.
Acoustic emission signals of different groups. (a) No-damage group. (b) 5 MPa-60% group. (c) 10 MPa-60% group. (d) 15 MPa-60% group.
The figure shows that the acoustic emission signal of the critically damaged coal sample has a strong regularity, which is divided into four stages: I for the stability zone, II for the growth zone, III for the secondary stability zone, and IV for the steep growth zone.
In the stable zone, the acoustic emission impact number and cumulative impact number curves remain at low levels and there are no sudden values. b values do not increase or decrease steeply in zone I but show an overall slow upward trend and a smooth acoustic emission signal. This indicates that the coal sample is in the small crack compression and eruption stage.
In the growth zone, as the axial pressure increases, the number of acoustic emission impacts increases rapidly and the b-value increases as a whole, but the number of decreasing segments of the b-value curve increases, indicating further development of cracks within the sample, as well as the appearance of cracks penetrating each other. The degree of deterioration of the coal sample is further aggravated in the growth zone.
In the secondary stability zone, the impact number does not fluctuate significantly over a short period on the eve of the loss of load-bearing capacity of the coal sample. The reason for this is that the coal sample has largely completed its deterioration before destruction and needs to accumulate enough energy to break through the maximum friction between the particles, hence no large fluctuations in the acoustic emission signal. However, the b-value rises at this point, indicating that as the energy builds up to impact the final barrier between the fissures, the less frictional parts of the particles misshape and create small cracks. This time can be used to predict whether damage to the rock will occur.
In the steep increase zone, the number of impacts and the cumulative number of impacts increase steeply, and the b-value drops abruptly. This indicates that the energy gathered in the secondary stabilization zone exceeds the maximum friction between the particles before the sample is damaged, resulting in large plastic deformation of the specimen and an immediate loss of load-bearing capacity and destruction of the sample.
Throughout Figure 8, there is a clear difference in the effect of different confining pressure unloading spans on critically damaged coal samples, and the effect of different confining pressure unloading spans on the damage of critically damaged coal rocks in terms of time and cumulative impact is analyzed below.
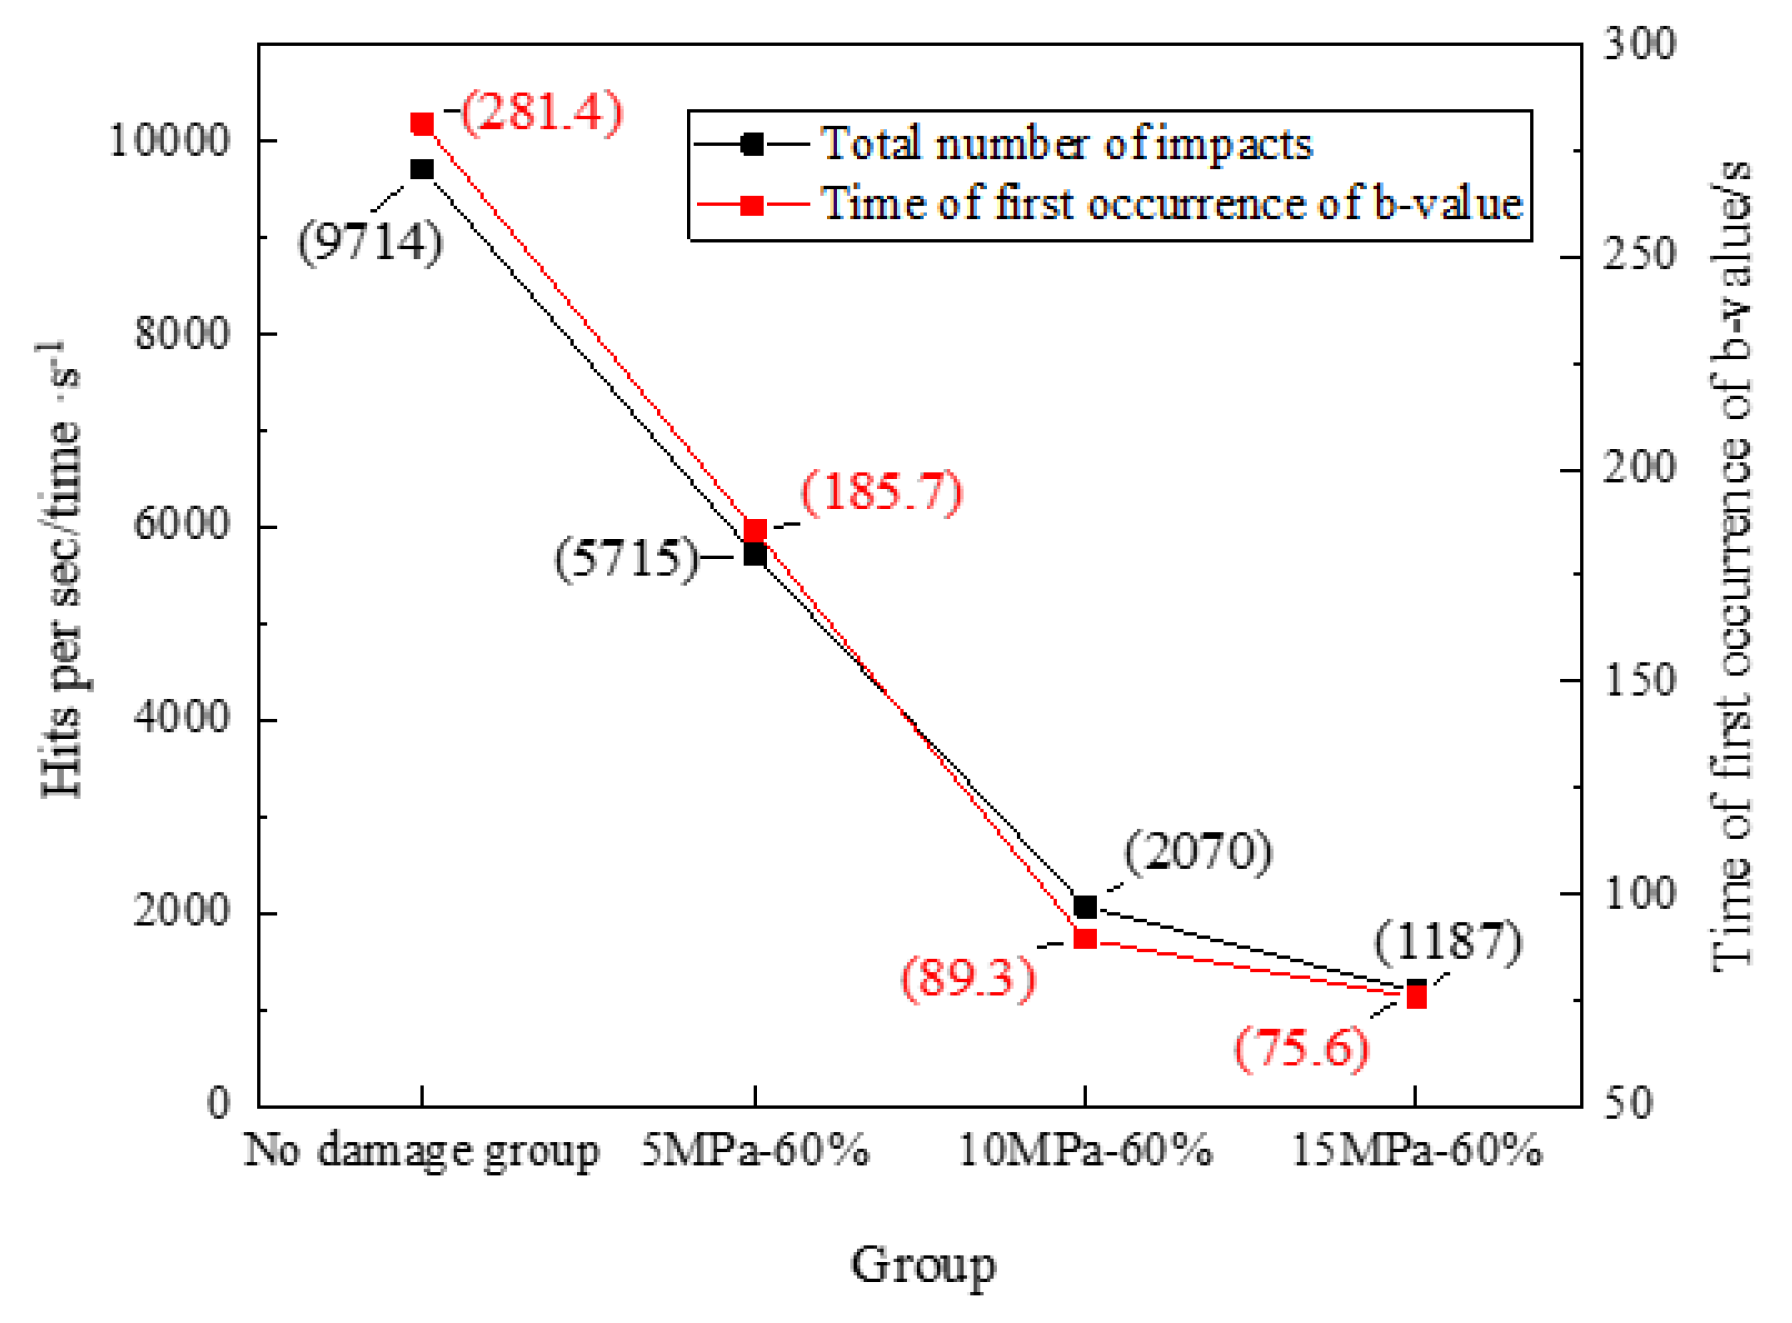
As can be seen from Figure 9, as the degree of damage increases, the time of the first occurrence of the b-value shifts forward, in the order of 281.6 s, 185.6 s, 89.6 s, and 75.6 s. The total number of impacts also gradually decreases, in the order of 9714, 5715, 2070, and 1187. The internal cracks in the coal samples undergo a series of processes from compression density, sprouting, development, and joining to penetration when making critical damage coal samples with different confining pressure unloading spans. Small fractures within the sample decrease as the unloading span decreases and new cracks are created. Therefore, the smaller the confining pressure discharge span, the fewer the number of primary cracks in the specimen and the greater the number macroscopic cracks. Therefore, when the uniaxial reloading of the critically damaged coal sample caused not only a gradual advance in b-value during loading, but also a reduction in the overall number of impacts on the specimen.
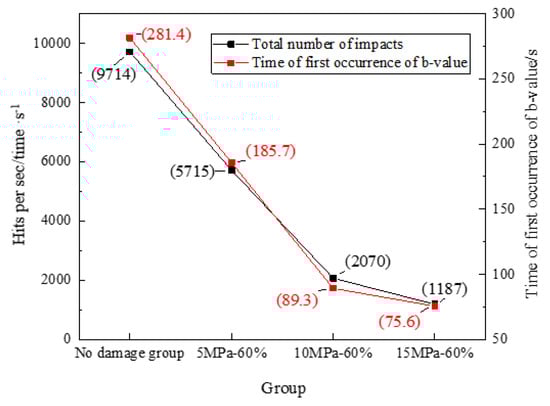
Figure 9.
Cumulative number of impacts and the first occurrence time of b-value in different groups.
4.4. Fractal Characteristics
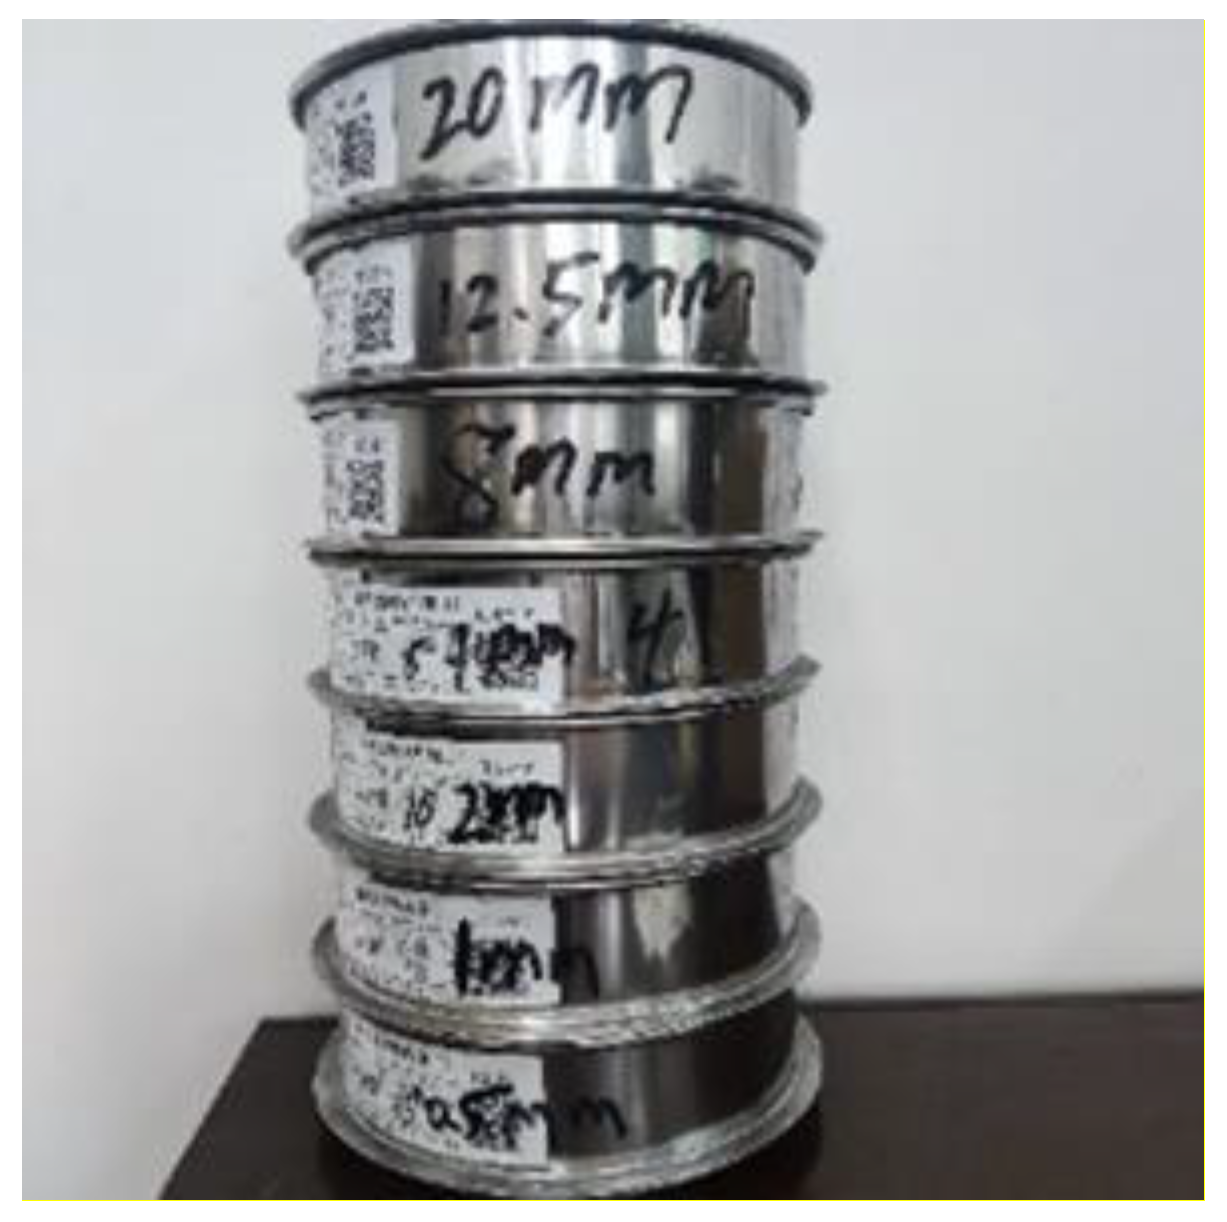
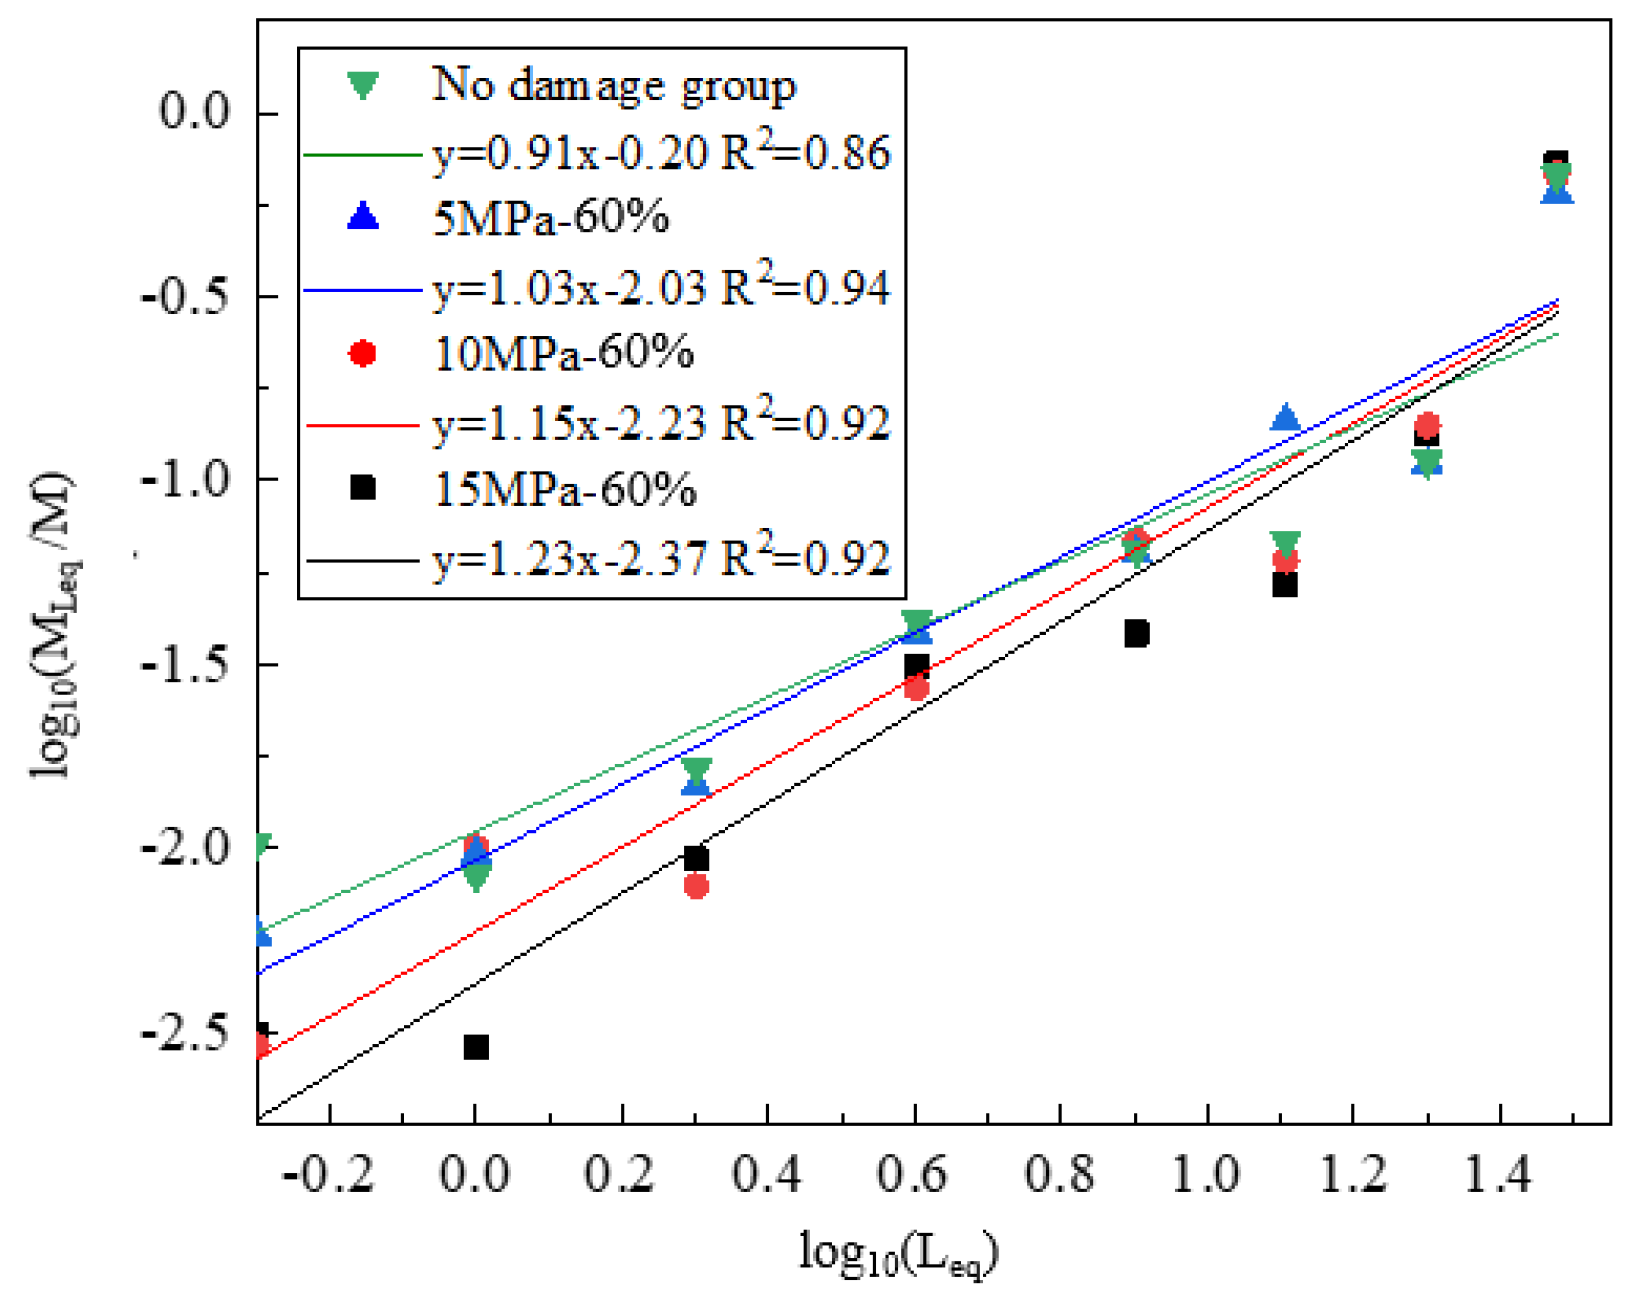
The fragments of critically damaged coal samples were collected under uniaxial compression at different confining pressure unloading spans, and the damage effects and damage patterns of critically damaged coal samples at different confining pressures were analyzed using the mass fractal principle. To visually analyze the degree of fragmentation of the coal samples, standard sieves with apertures of 40, 20, 12.5, 8, 6, 4, 2, 1, and 0.5 mm were selected to sort the fragmented coal samples one by one according to their fragmentation characteristics, as shown in Figure 10 and Figure 11. lg (MLeq/M) and LG (Leq) fitting curves and calculation of the fractal dimension were employed to further analyze the fragmentation trend of the coal samples.
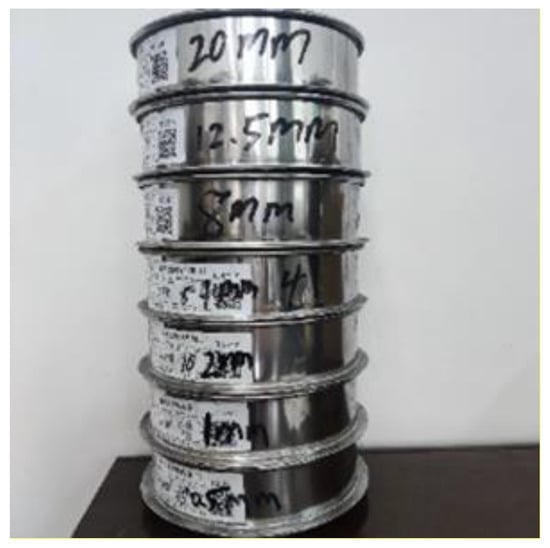
Figure 10.
Screen.

Figure 11.
Uniaxial damage debris.
To calculate the fractal dimension D of the coal sample using the fragment mass-equivalent edge length relationship, quantitatively characterize the distribution of clastic rock as:
where D is the fractal dimension of the fragment; is the cumulative proportion of fragments with an equivalent edge length less than Leq; is the fragment mass at an equivalent edge length of Leq; M is the fragment mass within the calculated particle size.
According to Equations (5) and (6), the fractal dimension D was calculated for each group of experiments as shown in Figure 5; and fitting curves were plotted by using Origin software (https://www.originlab.com/), and the fitting effects all reached more than 85%, which indicated that there was a strong correlation between the two. Based on D in Table 3 and Figure 12, it can be seen that there are large differences in the fractal characteristics of coal samples under different groups. The larger the fractal dimension, the more complex the fragmentation and the more fragments produced, and the more regular the distribution of fragments of different sizes. Firstly, the figures in the table visually show that the overall trend in each particle size range from the control group to the 5 MPa-60% group to the 10 MPa-60% group and finally to the 15 MPa-60% group exhibits a decreasing trend and a corresponding decrease in fragmentation. For example, in the particle size range of 0–0.5 mm, 1.03%, 0.58%, 0.32%, and 0.30% of the total weight were accounted for in that order. Secondly, in terms of fractal dimension, the values also decreased from 2.08, 1.97, 1.85 to 1.77, one by one, from undamaged coal samples to peritectic pressure of 5 MPa to 10 MPa and finally to 15 MPa. After a single uniaxial compression, the distribution of fragments was mainly concentrated above 8 mm, and the mass of fragments above 8 mm accounted for 85.28%, 85.93%, 87.09%, and 91.25% of all fragments in the four groups, respectively, with 78.25%, 71.43%, 81.02%, and 86.06% of fragments above 12.5 mm in size.
Table 3.
Average mass distribution of each coal sample in different screening zones.
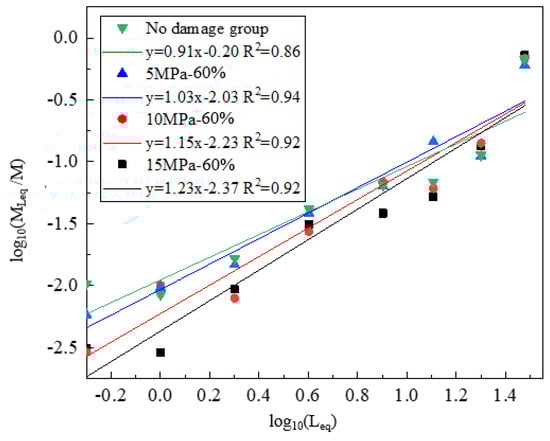
Figure 12.
Fitting curves of and .
The analysis of the peak intensity and acoustic emission signals above shows that as the unloading span of the peritectic compression decreases, the degree of damage to the critically damaged coal sample increases in turn, with the primary small cracks within the coal sample gradually decreasing and gradually being replaced by cracks after the sprouting cracks are interconnected or even penetrated, forming macroscopic cracks on the surface of the specimen. Under subsequent uniaxial compression, the presence of macroscopic cracks leads to the existence of a large weak surface on the specimen, and the damage to the sample follows the large weak surface, resulting in increasingly larger fragments of the sample and a reduction in the fractal dimension.
5. The Law of Energy Evolution
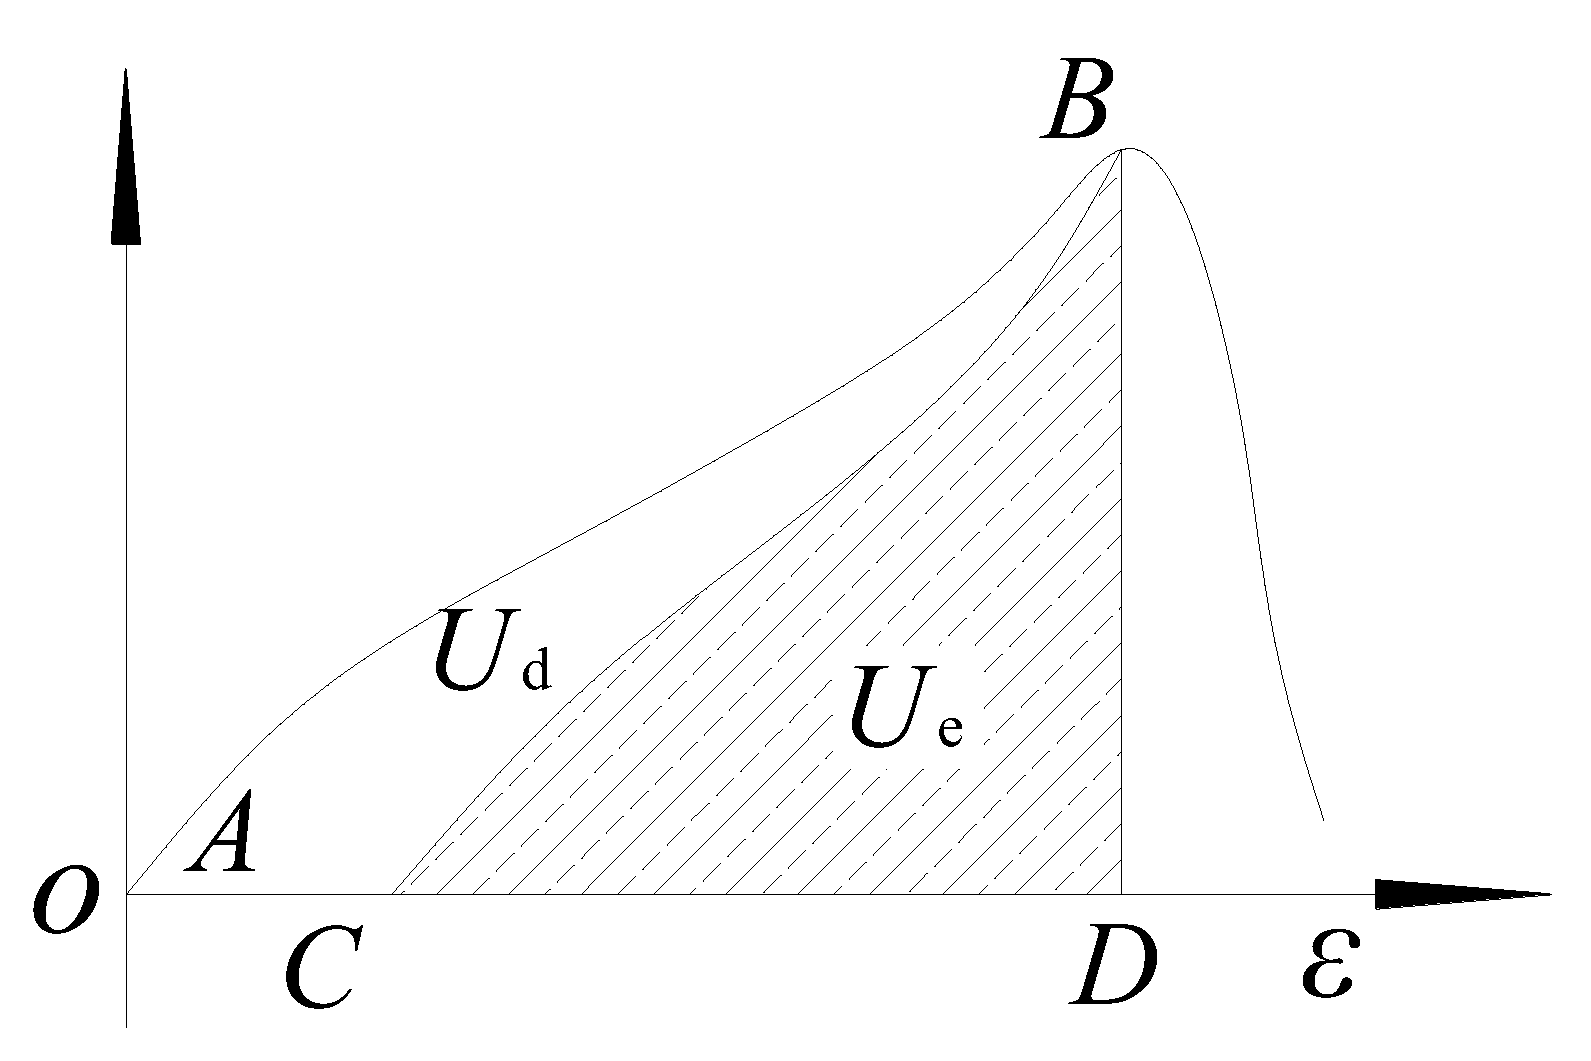
During loading of the specimen, as shown in Figure 13, energy is transferred from the RMT-150C test machine into the specimen (assuming no energy exchange between the specimen and the environment), which is called the input energy U (area enclosed by ABD in the figure). After the energy is injected into the specimen, part of the energy is used for plastic deformation, crack extension, and crack gestation (area enclosed by ABC in the diagram) and part is used for elastic deformation (area enclosed by BCD in the diagram); the former is called dissipative energy, Ud, and the latter is called Ue.
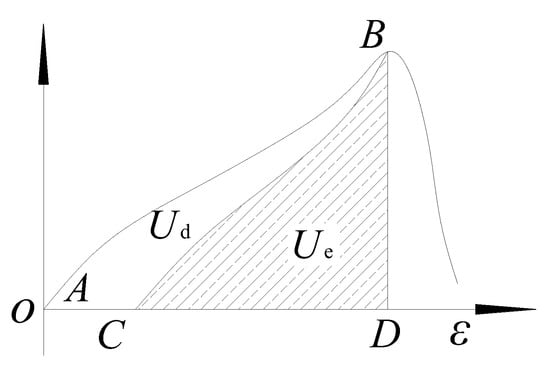
Figure 13.
Energy relation diagram of coal rock mass during the loading process.
The experiment is a uniaxial compression test, without considering the surrounding pressure, so the energy expression for each unit during the loading of the coal rock assemblage is:
where σ is the axial stress and ε is the strain corresponding to the axial stress. is the modulus of elasticity.
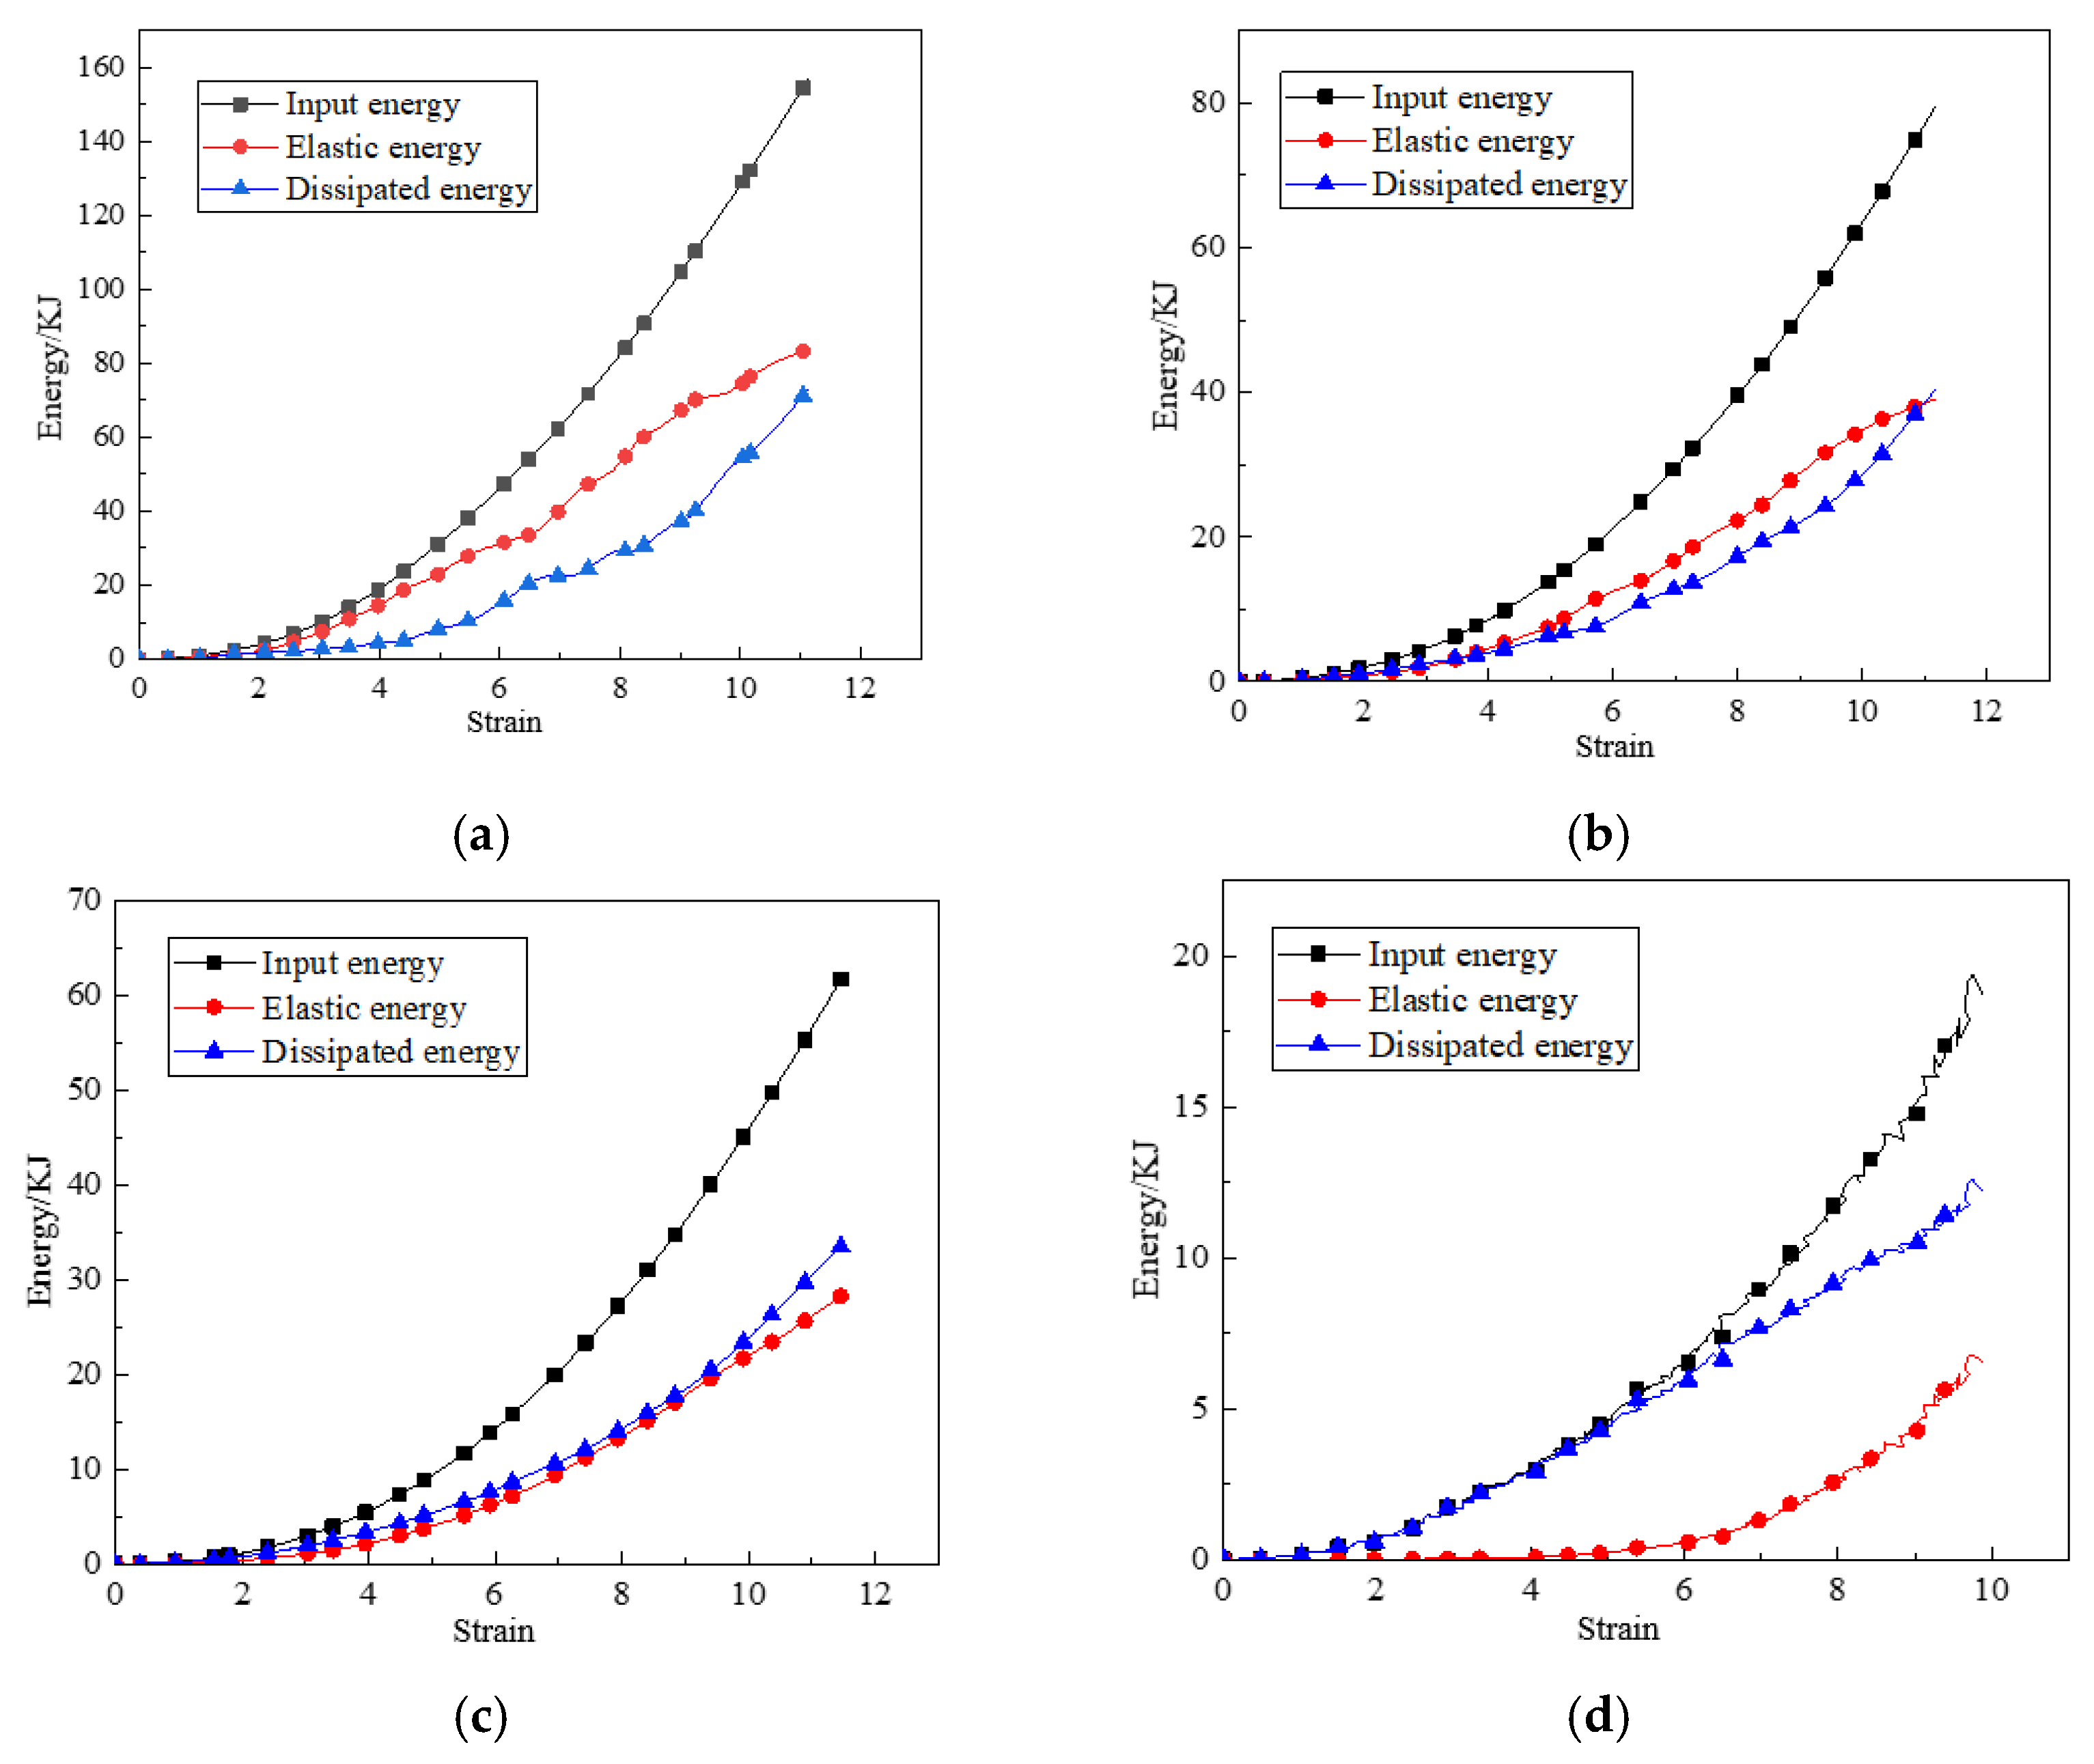
Based on the stress–strain curve in Figure 8, the pre-peak energy curve of the coal sample was plotted using Origin with Equations (7)–(9) to analyze the energy evolution of the critically damaged coal sample under different spans of unloading of the surrounding pressure. This is shown in Figure 14.
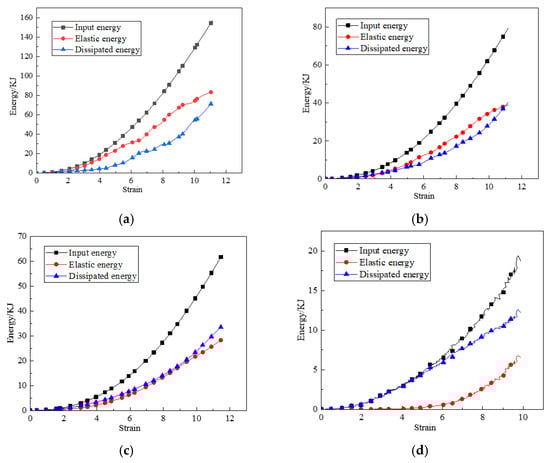
Figure 14.
Energy curves under different paths. (a) No-damage control group. (b) 5 MPa-60% group. (c) 10 MPa-60% group. (d) 15 MPa-60% group.
The input energy, elastic energy, and dissipation energy curves of the critically damaged coal samples at different peritectic pressure unloading spans can be seen (Figure 14). The overall regularity of all the curves is strong, and they can be divided into two stages based on the variation in the curves: the stabilization stage and the growth stage. When looking at the elastic and dissipative energy curves in the four plots; the elastic energy curve increases in duration as the unloading span decreases, while the dissipative energy curve is the opposite, with the stability zone decreasing in duration. This indicates that plastic damage occurs earlier within the coal sample from the undamaged control group to the time when the circumferential pressure is unloaded from 20 MPa to 60% of the 15 MPa triaxial compressive strength at 15 MPa axial pressure loading.
In the no-damage control group, the elastic energy curve was above the dissipative energy curve from the beginning to the end, and the elastic energy was dominant during the loading process. At 15 MPa-60%, the dissipative energy curve is completely above the elastic energy curve. Coal samples unloaded at higher stress states have a greater degree of damage, and the resulting damaged coal samples have more fully developed internal fissures. Therefore, the threshold value required for crack expansion is lower during uniaxial reloading of damaged coal samples, so the energy is more easily used for crack expansion, resulting in the phenomenon that the dissipated energy increases with the increase of the unloading span of the confining pressure.
In Figure 15, the dissipation energy ratio is calculated by converting each group of axial strains into a standardized axial strain and plotting the dissipation energy ratio. This section of the curve can be divided into the compression phase, the elastic phase, and the damage phase. In the compression phase, the dissipation energy is higher when the axial strain is at a low level because the natural fractures in the rock or the damage fractures caused by unloading are reduced by compression and plastic deformation of the rock sample occurs, and the dissipation energy percentage starts to decrease as the loading progresses. In the elastic phase, the sample begins to deform elastically, and the majority of the energy is elastic, so the dissipated energy ratio decreases further. In the damage phase, the percentage of dissipated energy changes from decreasing to increasing due to the development and expansion of new cracks, and the value increases further as the cracks expand and the sample breaks. The percentage of dissipated energy is higher in the first part of the curve as the rock is damaged to a greater extent at the same point of discharge as the surrounding pressure increases, and plastic deformation occurs in the specimen as soon as the rock starts to be loaded.
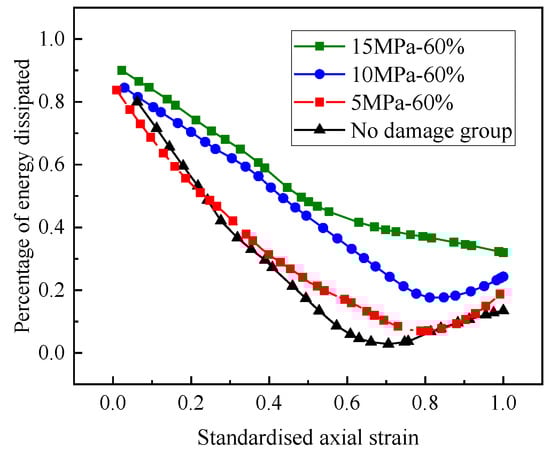
Figure 15.
Proportion of dissipated energy under standardized axial strain.
The reason for this is that as the unloading span decreases, the damage to the specimen increases when the axial pressure is loaded to 60% of the triaxial compressive strength under the corresponding circumferential pressure, resulting in a reduction in the energy storage capacity of the critically damaged specimen and a weakening in the ability to withstand elastic deformation during uniaxial reloading, resulting in a reduction in the elastic energy ratio and an increase in the dissipated energy ratio.
6. Conclusions
In this paper, damage tests under different unloading spans of coal rock and uniaxial reloading tests of critically damaged coal rock were carried out. The critical span of unloading damage of coal samples under different unloading spans, the load-bearing characteristics, and reloading performance of the critically damaged coal body were analyzed; the damage evolution characteristics of the critically damaged coal samples were analyzed using the acoustic emission signals collected during the loading process when the samples were reloaded. The main conclusions are as follows:
Coal samples were damaged using a triaxial unloading test, and by analyzing the damage morphology of the damaged coal samples, it can be seen that with the decrease in unloading gradient, surface cracks on the coal samples developed from tensile cracks to the coexistence of tensile and shear cracks and then to shear cracks, and it was determined that the critical unloading damage of the coal samples was 60% of their triaxial compressive strength.
Through the uniaxial reloading test on the critically damaged (nMpa-60%) coal samples, it was found that the larger the unloading span, the worse the mechanical properties of the damaged coal samples. The uniaxial compressive strength before and after the damage was used as an index to redefine the damage factor to characterize the damage degree of the mechanical properties of the coal samples, and it was found that the larger the confining pressure unloading span was, the worse the damage degree of the coal samples was.
By analyzing the acoustic emission signals and b-value of acoustic emission during the uniaxial reloading process of critically damaged (nMpa-60%) coal samples, the uniaxial reloading process of critically damaged (nMpa-60%) coal samples was divided into four stages, namely, “stabilization zone-growth zone-secondary stabilization zone-steep growth zone”, and it was found that the smaller the pressure unloading span, the smaller the primary cracks in the specimen, and the more the macroscopic cracks were.
By analyzing the fractal dimension and energy of the broken debris after uniaxial reloading of the critically damaged (nMpa-60%) coal samples, it was found that with the reduction in peripheral pressure unloading span, the space for elastic deformation of the damaged coal samples gradually decreases, the ability to store energy is weakened, the specimen cracks and produces plastic deformation more easily, the large-size rock mass produced at the time of destruction increases, and the fractal dimension decreases.
Author Contributions
Conceptualization, P.W. and Y.Z.; methodology, P.W.; validation, P.W., Y.Z. and C.M.; formal analysis, C.M.; investigation, P.W.; resources, P.W. and Y.Z.; data curation, C.M.; writing—original draft preparation, C.M.; writing—review and editing, P.W.; visualization, C.M.; supervision, P.W.; project administration, P.W.; funding acquisition, P.W. All authors have read and agreed to the published version of the manuscript.
Funding
This study received funding from the National Natural Science Foundation of China (NSFC) (No. 52174110) and the Provincial and Ministerial Key Laboratory of the Ministry of Education of China for Safe and Efficient Mining in Coal Mines. This research was supported by JYBSYS2021203, the Key Project of Scientific Research of the Department of Education of Hunan Province (No. 21A0313), the Hunan Province Scientific and Technological Talent Support Project (Project No. 2022TJ-N06), and the Scientific Research and Innovation Program of the Department of Education of Hunan Province (No. CX20221048).
Institutional Review Board Statement
Not applicable.
Informed Consent Statement
Not applicable.
Data Availability Statement
The data presented in this study are available in this article.
Conflicts of Interest
The authors declare no conflict of interest.
References
- Huang, D.; Li, Y. Conversion of strain energy in Triaxial Unloading Tests on Marble. Int. J. Rock Mech. Min. Sci. 2014, 66, 160–168. [Google Scholar] [CrossRef]
- D’amato, M.; Braga, F.; Gigliotti, R.; Kunnath, S.; Laterza, M. A numerical general-purpose confinement model for non-linear analysis of R/C members. Comput. Struct. 2012, 102, 64–75. [Google Scholar] [CrossRef]
- Baduge, S.K.; Mendis, P.; Ngo, T. Stress-strain relationship for very-high strength concrete (>100 MPa) confined by lateral reinforcement. Eng. Struct. 2018, 177, 795–808. [Google Scholar] [CrossRef]
- Dai, B.; Zhao, G.; Konietzky, H.; Wasantha, P.L.P. Experimental and Numerical Study on the Damage Evolution Behaviour of Granitic Rock during Loading and Unloading. KSCE J. Civ. Eng. 2018, 22, 3278–3291. [Google Scholar] [CrossRef]
- Qiu, S.-L.; Feng, X.-T.; Xiao, J.-Q.; Zhang, C.-Q. An Experimental Study on the Pre-Peak Unloading Damage Evolution of Marble. Rock Mech. Rock Eng. 2013, 47, 401–419. [Google Scholar] [CrossRef]
- Huang, X.; Liu, Q.; Liu, B.; Liu, X.; Pan, Y.; Liu, J. Experimental Study on the Dilatancy and Fracturing Behavior of Soft Rock Under Unloading Conditions. Int. J. Civ. Eng. 2017, 15, 921–948. [Google Scholar] [CrossRef]
- Li, G.; Wang, Y.; Wang, D.; Yang, X.; Wang, L.; Li, Y.; Zhang, S. Creep damage model of rock with varying-parameter under the step loading and unloading conditions. Sci. Rep. 2021, 11, 24057. [Google Scholar] [CrossRef] [PubMed]
- Hong, L.; Zhou, Z.-L.; Yin, T.-B.; Liao, G.-Y.; Ye, Z.-Y. Energy consumption in rock fragmentation at intermediate strain rate. J. Central South Univ. Technol. 2009, 16, 677–682. [Google Scholar] [CrossRef]
- Friedrich, L.F.; Tanzi, B.N.R.; Colpo, A.B.; Sobczyk, M.; Lacidogna, G.; Niccolini, G.; Iturrioz, I. Analysis of Acoustic Emission Activity during Progressive Failure in Heterogeneous Materials: Experimental and Numerical Investigation. Appl. Sci. 2022, 12, 3918. [Google Scholar] [CrossRef]
- Rodríguez, P.; Celestino, T.B. Application of acoustic emission monitoring and signal analysis to the qualitative and quantitative characterization of the fracturing process in rocks. Eng. Fract. Mech. 2019, 210, 54–69. [Google Scholar] [CrossRef]
- Liu, X.; Liu, Z.; Li, X.; Gong, F.; Du, K. Experimental study on the effect of strain rate on rock acoustic emission characteristics. Int. J. Rock Mech. Min. Sci. 2020, 133, 104420. [Google Scholar] [CrossRef]
- Moradian, Z.; Einstein, H.H.; Ballivy, G. Detection of Cracking Levels in Brittle Rocks by Parametric Analysis of the Acoustic Emission Signals. Rock Mech. Rock Eng. 2016, 49, 785–800. [Google Scholar] [CrossRef]
- Meng, Q.; Zhang, M.; Han, L.; Pu, H.; Nie, T. Effects of Acoustic Emission and Energy Evolution of Rock Specimens Under the Uniaxial Cyclic Loading and Unloading Compression. Rock Mech. Rock Eng. 2016, 49, 3873–3886. [Google Scholar] [CrossRef]
- Zong, Y.; Han, L.; Wei, J.; Wen, S. Mechanical and damage evolution properties of sandstone under triaxial compression. Int. J. Min. Sci. Technol. 2016, 26, 601–607. [Google Scholar] [CrossRef]
- Chen, X.; Feng, L.; Wang, X.; Chen, C.; Diao, H. Acoustic emission characteristics of fatigue failure process of self-compacting rubberized concrete pavement slabs. Int. J. Pavement Eng. 2022, 23, 4149–4159. [Google Scholar] [CrossRef]
- Niccolini, G.; Potirakis, S.M.; Lacidogna, G.; Borla, O. Criticality Hidden in Acoustic Emissions and in Changing Electrical Resistance during Fracture of Rocks and Cement-Based Materials. Materials 2020, 13, 5608. [Google Scholar] [CrossRef]
- Nazaripoor, H.; Ashrafizadeh, H.; Schultz, R.; Runka, J.; Mertiny, P. Acoustic Emission Damage Detection during Three-Point Bend Testing of Short Glass Fiber Reinforced Composite Panels: Integrity Assessment. J. Compos. Sci. 2022, 6, 48. [Google Scholar] [CrossRef]
- Kong, X.; Zhan, M.; Cai, Y.; Ji, P.; He, D.; Zhao, T.; Hu, J.; Lin, X. Precursor Signal Identification and Acoustic Emission Characteristics of Coal Fracture Process Subjected to Uniaxial Loading. Sustainability 2023, 15, 11581. [Google Scholar] [CrossRef]
- Sagasta, F.; Zitto, M.E.; Piotrkowski, R.; Benavent-Climent, A.; Suarez, E.; Gallego, A. Acoustic emission energy b-value for local damage evaluation in reinforced concrete structures subjected to seismic loadings. Mech. Syst. Signal Process. 2018, 102, 262–277. [Google Scholar] [CrossRef]
- Kudus, S.A.; Bunnori, N.M.; Mustaffa, N.K.; Jamadin, A. Investigation on Acoustic Emission Parameters due to Fatigue Damage of Concrete Beams with Variable Notched Depth. Int. J. Concr. Struct. Mater. 2022, 16, 29. [Google Scholar] [CrossRef]
- Guo, X.; Zhao, Z.; Gao, X.; Wu, X.; Ma, N. Analytical solutions for characteristic radii of circular roadway surrounding rock plastic zone and their application. Int. J. Min. Sci. Technol. 2019, 29, 263–272. [Google Scholar] [CrossRef]
- Zuo, J.; Wang, J.; Jiang, Y. Macro/meso failure behavior of surrounding rock in deep roadway and its control technology. Int. J. Coal Sci. Technol. 2019, 6, 301–319. [Google Scholar] [CrossRef]
- Aydin, A. The ISRM Suggested Methods for Rock Characterization, Testing and Monitoring: 2007–2014; Springer: Cham, Switzerland, 2015; pp. 2007–2014. [Google Scholar]
- Martini, C.D.; Read, R.S.; Martino, J.B. Observations of brittle failure around a circular test tunnel. Int. J. Rock Mech. Min. Sci. 1997, 34, 1065–1073. [Google Scholar] [CrossRef]
- Tao, M.; Li, X.; Li, D. Rock failure induced by dynamic unloading under 3D stress state. Theor. Appl. Fract. Mech. 2013, 65, 47–54. [Google Scholar] [CrossRef]
- Zhang, K.; Zhang, S.; Ren, J.; Wang, M.; Jing, S.; Zhang, W. Study on Characteristics of Acoustic Emission b Value of Coal Rock with Outburst-Proneness under Coupled Static and Dynamic Loads. Shock. Vib. 2023, 2023, 2400632. [Google Scholar] [CrossRef]
- Colombo, I.S.; Main, I.; Forde, M. Assessing damage of reinforced concrete beam using “b-value” analysis of acoustic emission signals. J. Mater. Civ. Eng. 2003, 15, 280–286. [Google Scholar] [CrossRef]
- Sagar, R.V.; Prasad, B.R.; Kumar, S. An experimental study on cracking evolution in concrete and cement mortar by the b-value analysis of acoustic emission technique. Cem. Concr. Res. 2012, 42, 1094–1104. [Google Scholar] [CrossRef]
- Rao, M.; Lakshmi, K. Analysis of b-value and improved b-value of acoustic emissions accompanying rock fracture. Curr. Sci. 2005, 89, 1577–1582. [Google Scholar]
- Shi, Y.; Bolt, B.A. The standard error of the magnitude-frequency b value. Bull. Seismol. Soc. Am. 1982, 72, 1677–1687. [Google Scholar] [CrossRef]


Disclaimer/Publisher’s Note: The statements, opinions and data contained in all publications are solely those of the individual author(s) and contributor(s) and not of MDPI and/or the editor(s). MDPI and/or the editor(s) disclaim responsibility for any injury to people or property resulting from any ideas, methods, instructions or products referred to in the content. |
© 2023 by the authors. Licensee MDPI, Basel, Switzerland. This article is an open access article distributed under the terms and conditions of the Creative Commons Attribution (CC BY) license (https://creativecommons.org/licenses/by/4.0/).