Article

Have Pesticides and Fertilizers Improved Agricultural Development? The Threshold Effect Based on China’s Agricultural Film Usage

1
School of Science, Hebei University of Technology, Tianjin 300401, China
2
School of Economics, Natural Resource Asset Capital Research Center of Hebei GEO University, Shijiazhuang 050031, China
*
Author to whom correspondence should be addressed.
Appl. Sci. 2024, 14(1), 6; https://doi.org/10.3390/app14010006
Submission received: 22 September 2023 / Revised: 27 November 2023 / Accepted: 30 November 2023 / Published: 19 December 2023

Abstract

:
The use of agricultural films, pesticides, and fertilizers has increased in China, leading to the degradation of the agricultural ecological environment. Based on the panel data of 30 provinces in China from 2010 to 2021, this paper takes agricultural film usage as the threshold variable to study the impact of pesticide and fertilizer usage on agricultural development. The research results show that a single threshold effect of agricultural film usage is significant. When agricultural film usage is both a core and threshold variable, that is lower than the threshold value, every 1% increase in agricultural film usage will reduce agricultural output value by 0.9862%, and the impact is significant. When agricultural film usage crosses the threshold value, every 1% increase in agricultural film usage will increase agricultural output value by 1.1843%, and the impact is significant. When pesticide usage is the core variable, regardless of whether agricultural film usage is below or above the threshold, pesticide usage promotes agricultural development. Its impact is significant. When fertilizer input is a core variable, regardless of whether agricultural film usage is below or above the threshold, the use of fertilizers hinders agricultural development. The impact of fertilizer input on agricultural development is significant. Through empirical testing, this paper explores the deep relationship between agricultural film usage, pesticide usage and fertilizer input on agricultural development. These can effectively allocate agricultural production factors, transform the mode of agricultural economic growth, achieve the coordinated development of the ecological environment and agricultural economy and provide data support for the formulation of agricultural green development policies.

1. Introduction

The 19th National Congress of the Communist Party in China pointed out that the construction of an ecological civilization is a millennium plan for the sustainable development of the Chinese nation, and we should treat the ecological environment as life [1]. According to the 2020 census, 500 million people in China are in rural areas. The issue of agricultural and rural farmers is a fundamental issue related to both the national economy and people’s livelihoods. China always adheres to a strategy of rural revitalization and has made some achievements in the construction of modern agricultural industrial systems, production systems and management systems [2]. However, to increase the production and income of farmers, the use of agricultural film, pesticides and chemical fertilizers is increasing annually, which leads to an increase in agricultural carbon emissions [3,4]. From 1993 to 2008, the use of agricultural film, pesticides and chemical fertilizers led to an increase in agricultural carbon emissions from 366.23, 416.93 and 2822.84 million tons to 1039.63, 824.98 and 4692.04 million tons, respectively, with average annual growth rates of 7.20%, 4.65% and 3.45%, respectively [5]. Subsequently, some scholars have used agricultural film, pesticides and chemical fertilizers as agricultural materials to measure the overall impact on agricultural carbon emissions from 2005 to 2019 [6]. The problem of agricultural pollution cannot be ignored. Agricultural development should not only pursue the economic benefits brought by agricultural film, pesticides and fertilizers but also consider the environmental problems they bring.
Agricultural film is an important means of agricultural production. The advantages of the use of agricultural film in agricultural development are mainly reflected in the fact that it can increase crop yields, improve product quality and enrich the supply structure of agricultural products [7]. Agricultural film is mainly trellis film and ground film, in addition to shade net, insect net, forage film and agricultural non-woven fabric, etc. In 2019, China’s agricultural film usage is still dominated by ground film, with ground film use accounting for 57.27% of agricultural plastic usage. The use of trellis film and other agricultural films for fruits and vegetables, etc. accounted for the remaining 42.73% [8]. The use of agricultural film has a great impact on the agricultural ecological environment, causing the soil environment to be seriously polluted by microplastics [9,10]. The microplastics not only destroy soil structure, which is not conducive to the movement of water in the soil and the exchange of soil gas [11,12], but also affect the microorganisms in the soil [13]. According to the Bulletin of the Second National Census of Pollution Sources, the use of plastic film reached 1,419,300 tons in 2017, and the accumulated residual amount for many years was 1,184,800 tons, causing serious nonpoint source pollution such as that of water and soil. The problem of residual pollution of agricultural film in China is becoming increasingly serious [14] and restricts the green development of agriculture.
Agricultural economic benefits are the livelihood of rural residents. Increasing the production and income of farmers has always been a topic of concern for governments at all levels [15]. We need to fully understand the impact of agricultural film on agricultural development so that we can accurately grasp the evolution law of agricultural film pollution in agricultural development and formulate suitable agricultural nonpoint source pollution control policies. Promoting the green development of agriculture is the only way to achieve rural revitalization [16]. The innovation of this paper is to use the panel threshold regression model and take the agricultural film as the threshold variable to study the nonlinear impact of agricultural film, pesticide and fertilizer on agricultural development under different threshold values. The use of the panel threshold model expands the understanding and validation of the research methods of agricultural film use effectiveness in the existing literature. Empirical analysis of the evolution of agricultural nonpoint source pollution pressure in the current stage of agricultural development in China provides data support for the subsequent comprehensive management of agricultural environmental pollution.

2. Literature Review

Through a summary of the domestic and foreign literature, it can be seen that the impact of agricultural film usage, pesticide usage and fertilizer input on agricultural development is mainly concentrated in three aspects.
First, the use of agricultural film has promoted agricultural development. The large-scale use of white plastic film in agriculture has significantly increased productivity and brought about a double increase in agricultural output and benefits. This is referred to as the white revolution in the process of agricultural development [17]. Later, different scholars proved through experiments that agricultural film mulching increased crop yields [18,19,20] and has been successfully used in the majority of cash crops such as corn, cotton, rice, vegetables and fruits [21,22,23]. Changing the color of agricultural film from white to dark can cause plants to develop earlier and increase their yield [24,25,26]. The fogging of the agricultural film reduces the yield of crops; therefore, researchers have designed a variety of methods to produce anti-fog films [27] to ensure an increase in agricultural product output.
Second, the use of agricultural film causes a series of harmful effects, and experts have adopted different solutions. Using a moderate amount of residual film (90–180 kg·hm−2) can promote the growth of seedling roots [28] but using a large amount of residual agricultural film will damage the agricultural environment and reduce crop yields [29,30]. One solution is to replace the traditional cover film with a biodegradable mulch film [11,31,32,33,34]. Participating in agricultural technology training, social networks and information acquisition [35,36] may increase farmers’ willingness to participate in the treatment of residual film [37] and reduce the use of agricultural film. In addition, technological innovation [38,39], environmental regulations [40] and industrial upgrading [41] can also reduce environmental pollution and promote green and sustainable development of agriculture.
Third is the impact of fertilizer input and pesticide usage on agricultural development. Lin and Ma [42] used the principle of cost minimization to make an empirical analysis of the amount of fertilizer application during wheat production in Hebei, Henan and Shandong and found that increasing the output by increasing fertilizer input no longer achieves good results. However, different levels of phosphorus and potassium fertilizers are still overused [43]. Although the input of various fertilizers can increase wheat yield [22,44,45], it will also stimulate the emission of carbon dioxide in the soil [46] and cause environmental pollution. Wheat production in northern China is mostly dominated by insecticides, fungicides and herbicides, and the phenomenon of irrational use of drugs is common [47]. The safety and high yield of wheat can be achieved by popularizing the application of green drug reduction technology in the control of wheat diseases, insect pests and weeds [48].
In summary, the effects of agricultural film usage, pesticide usage and fertilizer input are a double-edged sword; they not only increase agricultural output but also pollute the soil environment and reduce agricultural output. Most of the abovementioned scholars studied the influence of agricultural film usage, pesticide usage and fertilizer input through experiments, which means that their research objects and scopes are a piece of land or a region of land [49,50,51]. The impact of agricultural film usage, pesticides usage and fertilizer input on regional agricultural development is rarely involved in the relevant literature. This paper has been supplemented and improved by two aspects. First, there are 31 provinces in mainland China. Due to missing data from Hainan, this study included almost every province data except for Hainan, which overcome the deviation in results that are caused by only using some regions to derive the national data and thus make the analysis results more robust. Second, from the perspective of research methods, the panel threshold model is helpful to study the nonlinear effects of agricultural film use on agricultural development. This paper uses the panel threshold regression model to analyze the impact of agricultural film, pesticides and fertilizers on agricultural development both when the agricultural film has not crossed and has crossed the threshold and to explore the dynamic evolution of agricultural development.

3. Variables Description and Research Method

3.1. Variables Description

The explained variable is agricultural development (Age). There are two main methods for different Chinese scholars to measure agricultural development. One method is to establish an index system to comprehensively measure agricultural development. Although this method can cover all aspects of agricultural development more comprehensively, the results are too subjective because of the different indicators and calculation methods involved. The other method is a single indicator, the data of which are provided by the government. These kind of data are objective and true which makes them easy to operate and widely used [52]. Therefore, this paper uses the total output value of agricultural production (100 million yuan) to measure the agricultural development of various regions.
The threshold variable is agricultural film usage (Afu). Kader et al. [53] reviewed 189 published papers and pointed out that agricultural film can save soil water, inhibit weed growth, control soil structure and temperature and is an effective way to increase crop yield on limited cultivated land. However, the polyethylene (PE) in agricultural film can cause serious pollution to the soil environment [54], and plastic fragments threaten environmental safety and health [55]. This paper uses agricultural film usage as the threshold variable to study its impact on agricultural development.
The core explanatory variables are agricultural film usage (Afu), pesticide usage (Peu) and fertilizer input (Fei). To increase the output of crops, the use of chemical fertilizers, pesticides, agricultural films and other chemical products has increased annually, which has led to a deterioration of the rural ecological environment and has severely restricted the sustainable development of agriculture and rural economic society [56]. Agricultural film usage (tons), pesticide usage (10,000 tons) and chemical fertilizer input (10,000 tons) can not only support the development of the agricultural economy but can also cause agricultural nonpoint source pollution, resulting in the three-dimensional cross pollution of groundwater, soil and air environments. Therefore, this paper uses these three variables as core explanatory variables.
The control variables are land input (Lai), effective water input (Wri) and total power of agricultural machinery (Tpm). Referring to the literature of Wang and Li [57], the land input is measured by the sown area of wheat (thousand hectares). The greater the land input is, the greater the agricultural output value is. Using a method from the literature of Ye [58] and Xu et al. [59], the effective water resource input is measured by the effective irrigation area (one thousand hectares). The production of crops requires water. The larger the effective irrigated area is, the less reliance there will be on natural rainfall, and the better the growth of crops will be. On one hand, the total power of agricultural machinery (10,000 kilowatts) has made a significant direct contribution to food production through the continuous advancement of large-scale agricultural operations in China. On the other hand, the relationship between agricultural machinery and labor has undergone a transition from complementary to substitutive due to the development of urbanization and the transfer of rural labor to cities [60].

3.2. Research Method

The use of agricultural film varies across regions and times, and artificial grouping would introduce bias. The threshold value of agricultural film usage was determined by automatic identification of the data, and then the nonlinear relationship between agricultural film and agricultural development was analyzed. This paper, which drew on the fixed-effect panel threshold model of Hansen [61], determined the threshold value of agricultural film by automatically identifying the data and then analyzing the impact of agricultural film usage, pesticide usage and fertilizer input on agricultural development. To avoid missing important explanatory variables, control variables such as land input, water input, agricultural machinery total power and agricultural financial input were added during the research process. The single threshold model was
y i t = α i + β 1 x i t + u i t ,     q i t γ y i t = α i + β 2 x i t + u i t ,     q i t > γ
where i represented the region ( 1 i n ), t represented the time ( 1 t T ), y i t was the explained variable,   x i t was the explanatory variable, β 1 & β 2 were the parameters to be estimated, q i t was the threshold variable, γ was the threshold value to be estimated, α i t was the individual effect and u i t was the random error term. Using the indicative function 1 ( ) , Formula (1) could be more concisely expressed as
y i t = α i + β 1 x i t 1 ( q i t γ ) + β 2 x i t 1 ( q i t > γ ) + u i t
Two tests were needed for the threshold variable q i t . The first was to test for the presence of a threshold effect. The second was to test whether or not the threshold estimate is equal to its true value.
To test for the presence of a threshold effect, the null hypothesis was H 0 : β 1 = β 2 . The unconstrained sum of squared residuals was S S R ( γ ^ ) . The sum of squared residuals using H 0 : β 1 = β 2 as the constraint is S S R . The larger S S R SSR ( γ ^ ) was, the more inclined it was to reject H 0 : β 1 = β 2 . This indicates that there was a threshold effect. According to the likelihood ratio proposed by Hansen, it could be judged that
L R [ S S R S S R ( γ ^ ) ] / σ ^ 2
where σ ^ 2   S S R ( γ ^ ) n ( T     1 ) was the consistent estimator of the variance of the random error term.
To test whether the threshold estimate was equal to the true value, the null hypothesis was H 0 : γ = γ 0 . The likelihood ratio test statistic was
L R ( γ ) [ S S R ( γ ) S S R ( γ ^ ) ] / σ ^ 2
Although the distribution of L R ( γ ) was nonstandard, its cumulative distribution function was ( 1 e x 2 ) 2 and its critical value could be calculated on this basis. If L R ( γ 0 ) exceeded the critical value, then the null hypothesis H 0 : γ = γ 0 was rejected, and the threshold estimate was not equal to its true value.
Similarly, according to Model (2), a panel threshold regression model of “multiple threshold values” could be established as shown below
y i t = α i + β 1 x i t 1 ( q i t γ 1 ) + β 2 x i t 1 ( γ 1 < q i t γ 2 ) β n x i t 1 ( q i t > γ n ) + u i t
Because the values of all variables in the model were relatively large, the variables were processed by taking the logarithm. The advantage of taking the logarithm was that the nature and correlation of the data would not be changed after the logarithm was taken, but the scale of the variables would be compressed. The data were more stable, and the collinearity and heteroscedasticity of the model were weakened. According to the variable description and Model (2), a single threshold regression model using China’s agricultural film usage as the threshold variable was constructed
L n A g e i t = α i + β 1 L n ( A f u i t ) 1 ( L n ( A f u i t ) γ ) + β 2 L n ( A f u i t ) 1 ( L n ( A f u i t ) > γ ) + β 3 L n ( P e u i t ) 1 ( L n ( A f u i t ) γ ) + β 4 L n ( P e u i t ) 1 ( L n ( A f u i t ) > γ ) + β 5 L n ( F e i i t ) 1 ( L n ( A f u i t ) γ ) + β 6 L n ( F e i i t ) 1 ( L n ( A f u i t ) > γ ) + β 7 L n ( L a i i t ) + β 8 L n ( W r i i t ) + β 9 L n ( T p m i t ) + u i t

3.3. Data Sources

This paper uses panel data from 30 provinces in mainland China from 2010 to 2021, and the sample size is 360. The original data of all variables are compiled from the 2011–2022 China Rural Statistical Yearbook, China Agricultural Statistical Yearbook and China Statistical Yearbook [62]. The software used for data analysis is Stata 16.0.

4. Empirical Analysis of the Threshold Effect of China’s Agricultural Film Usage on Agricultural Development

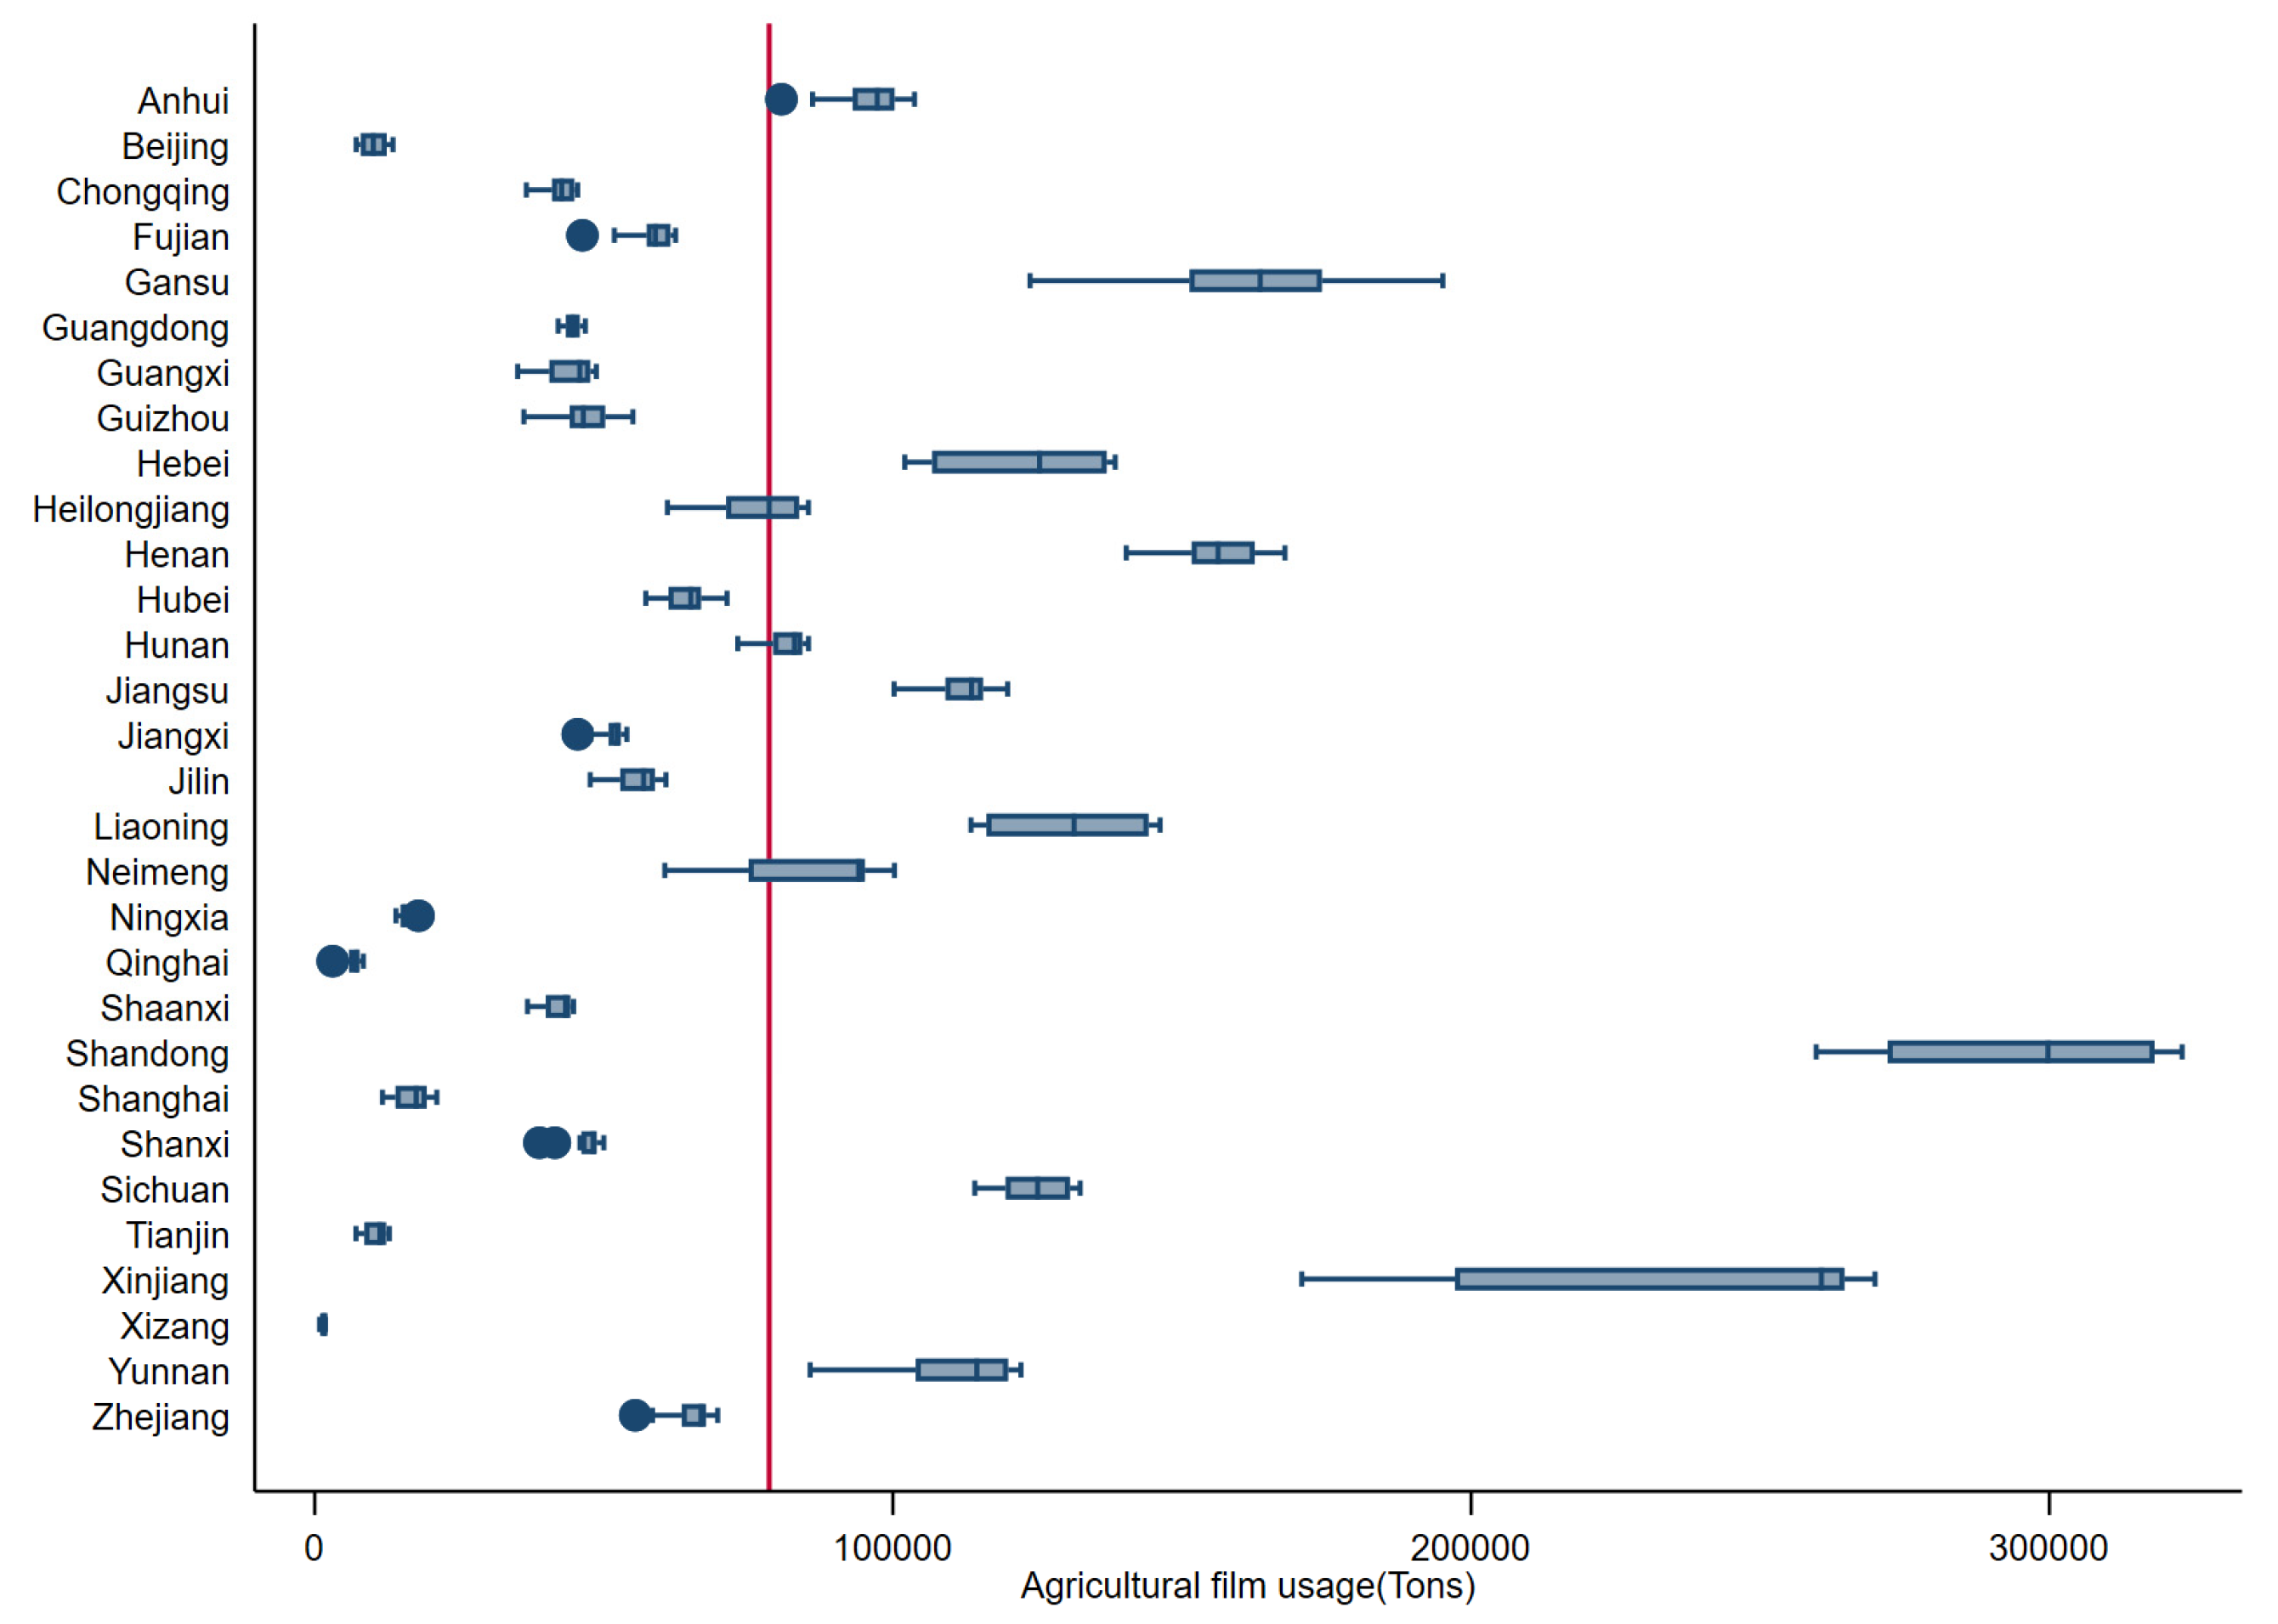
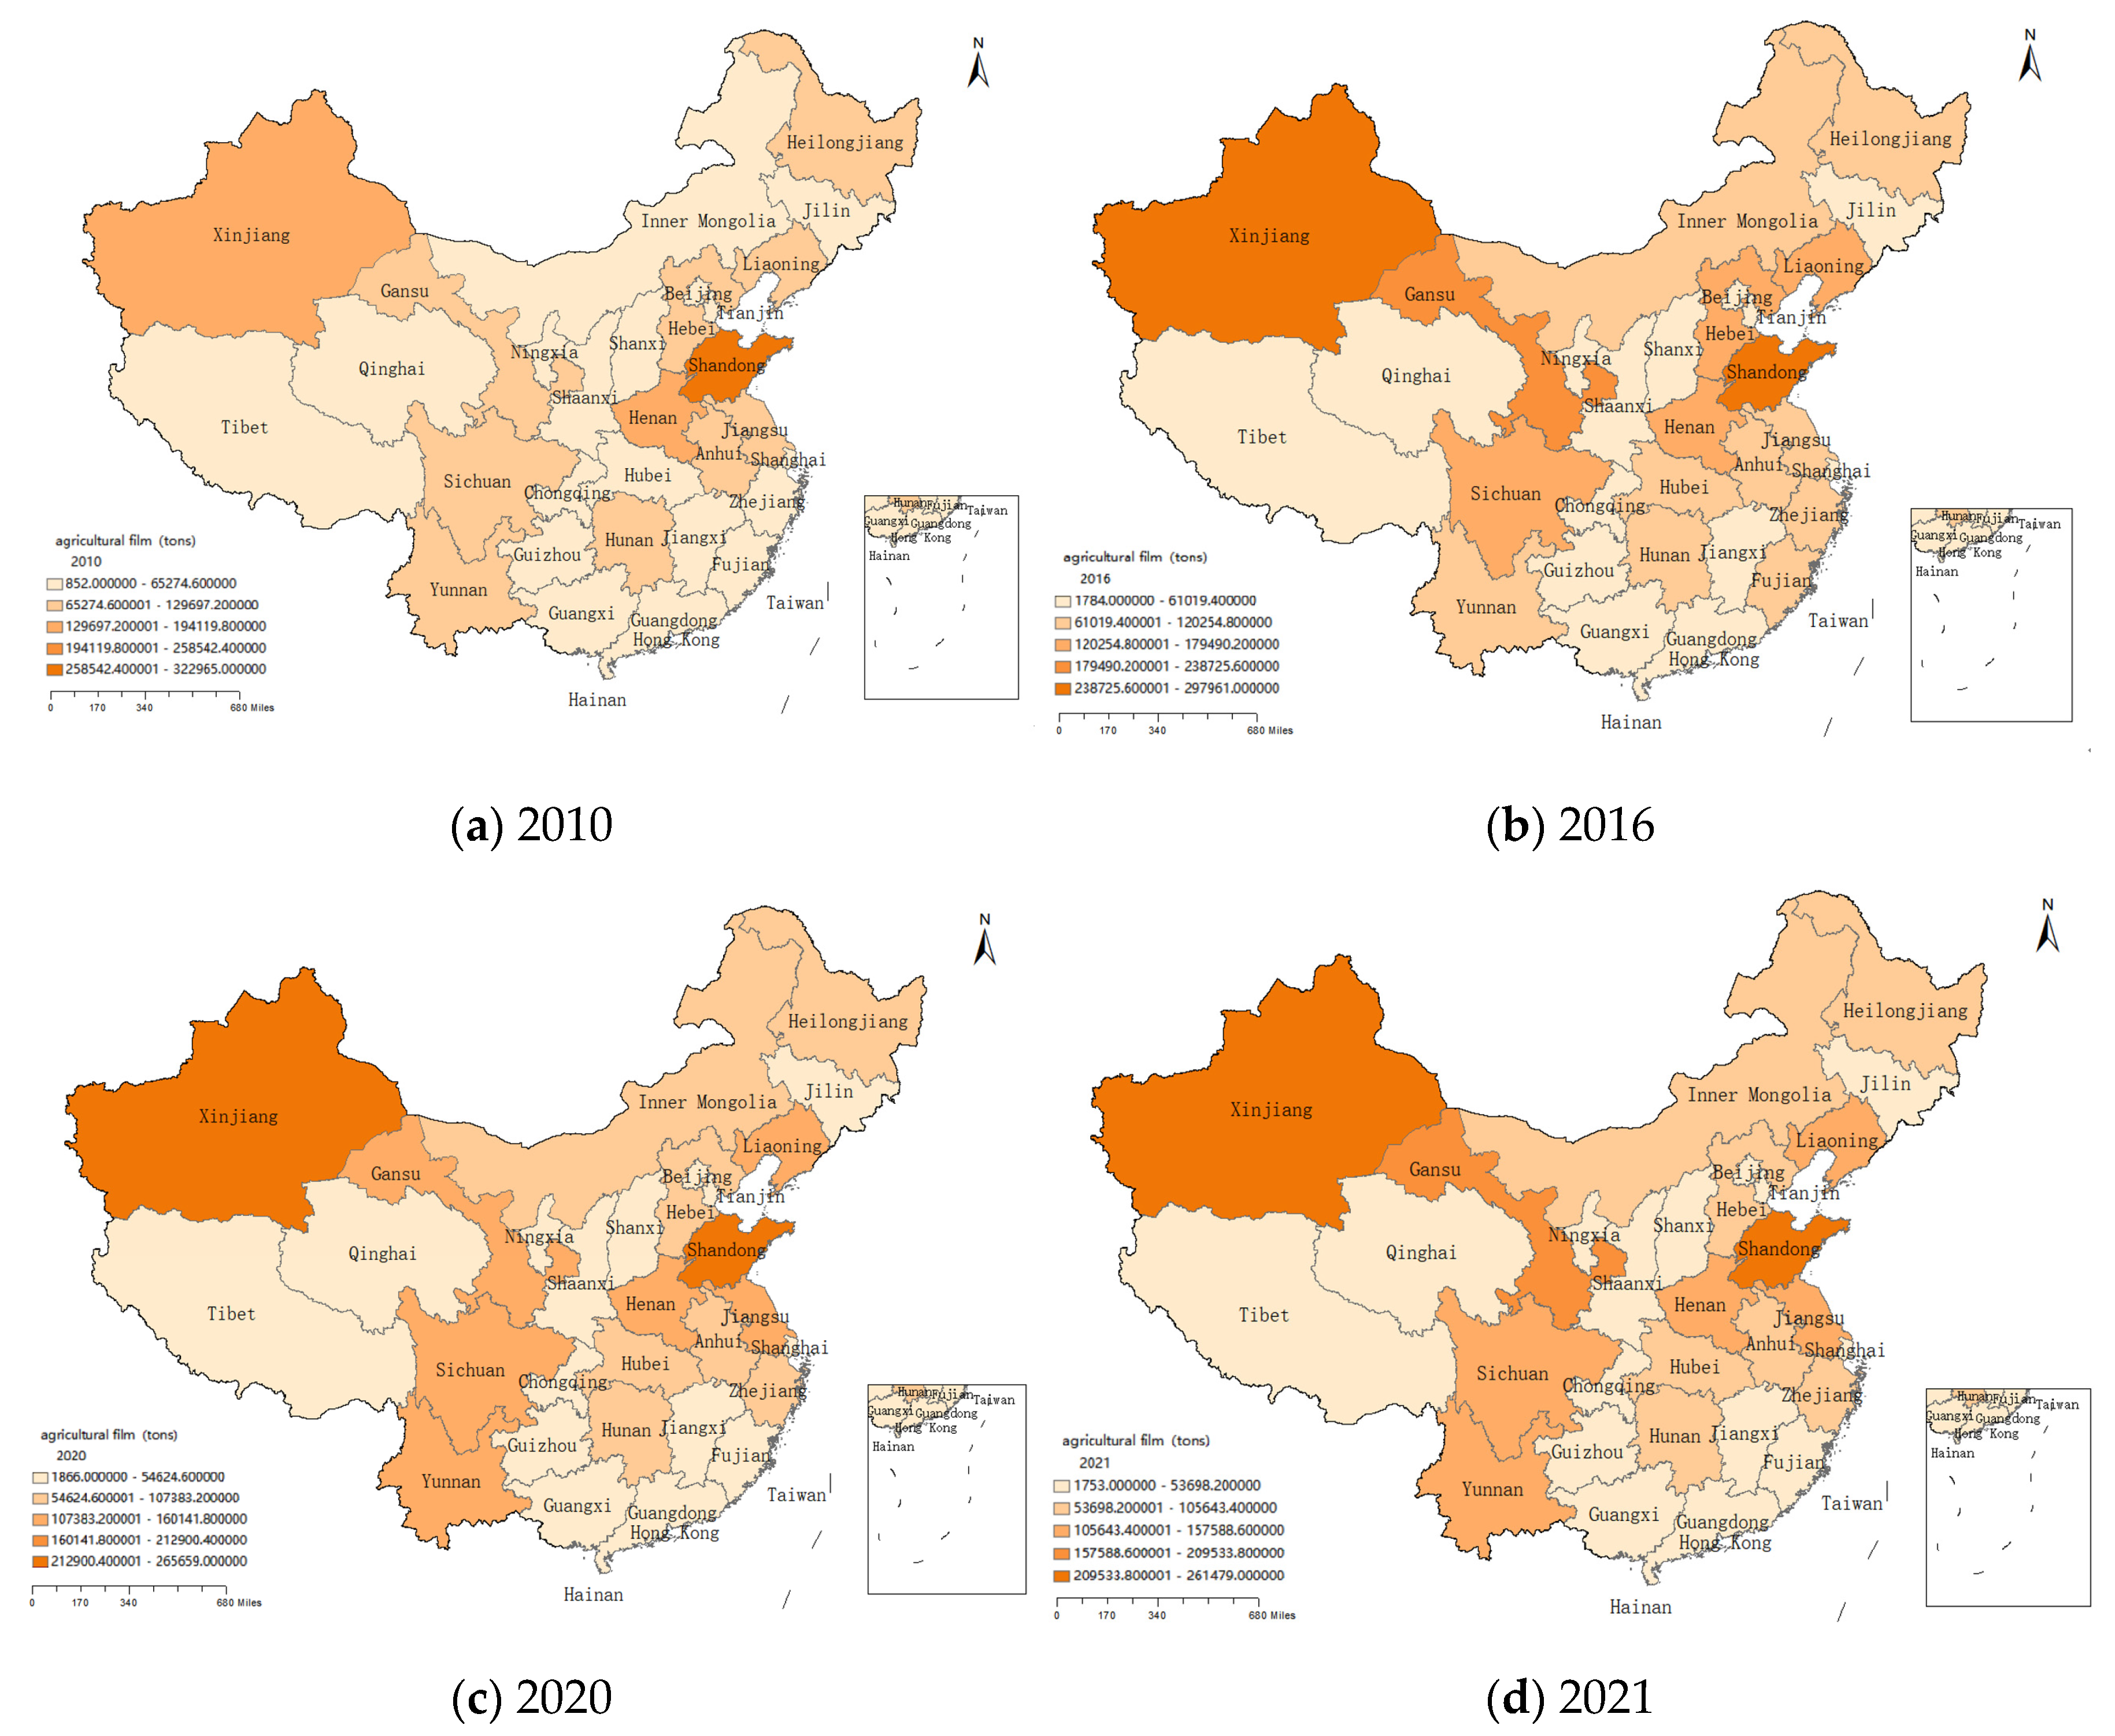
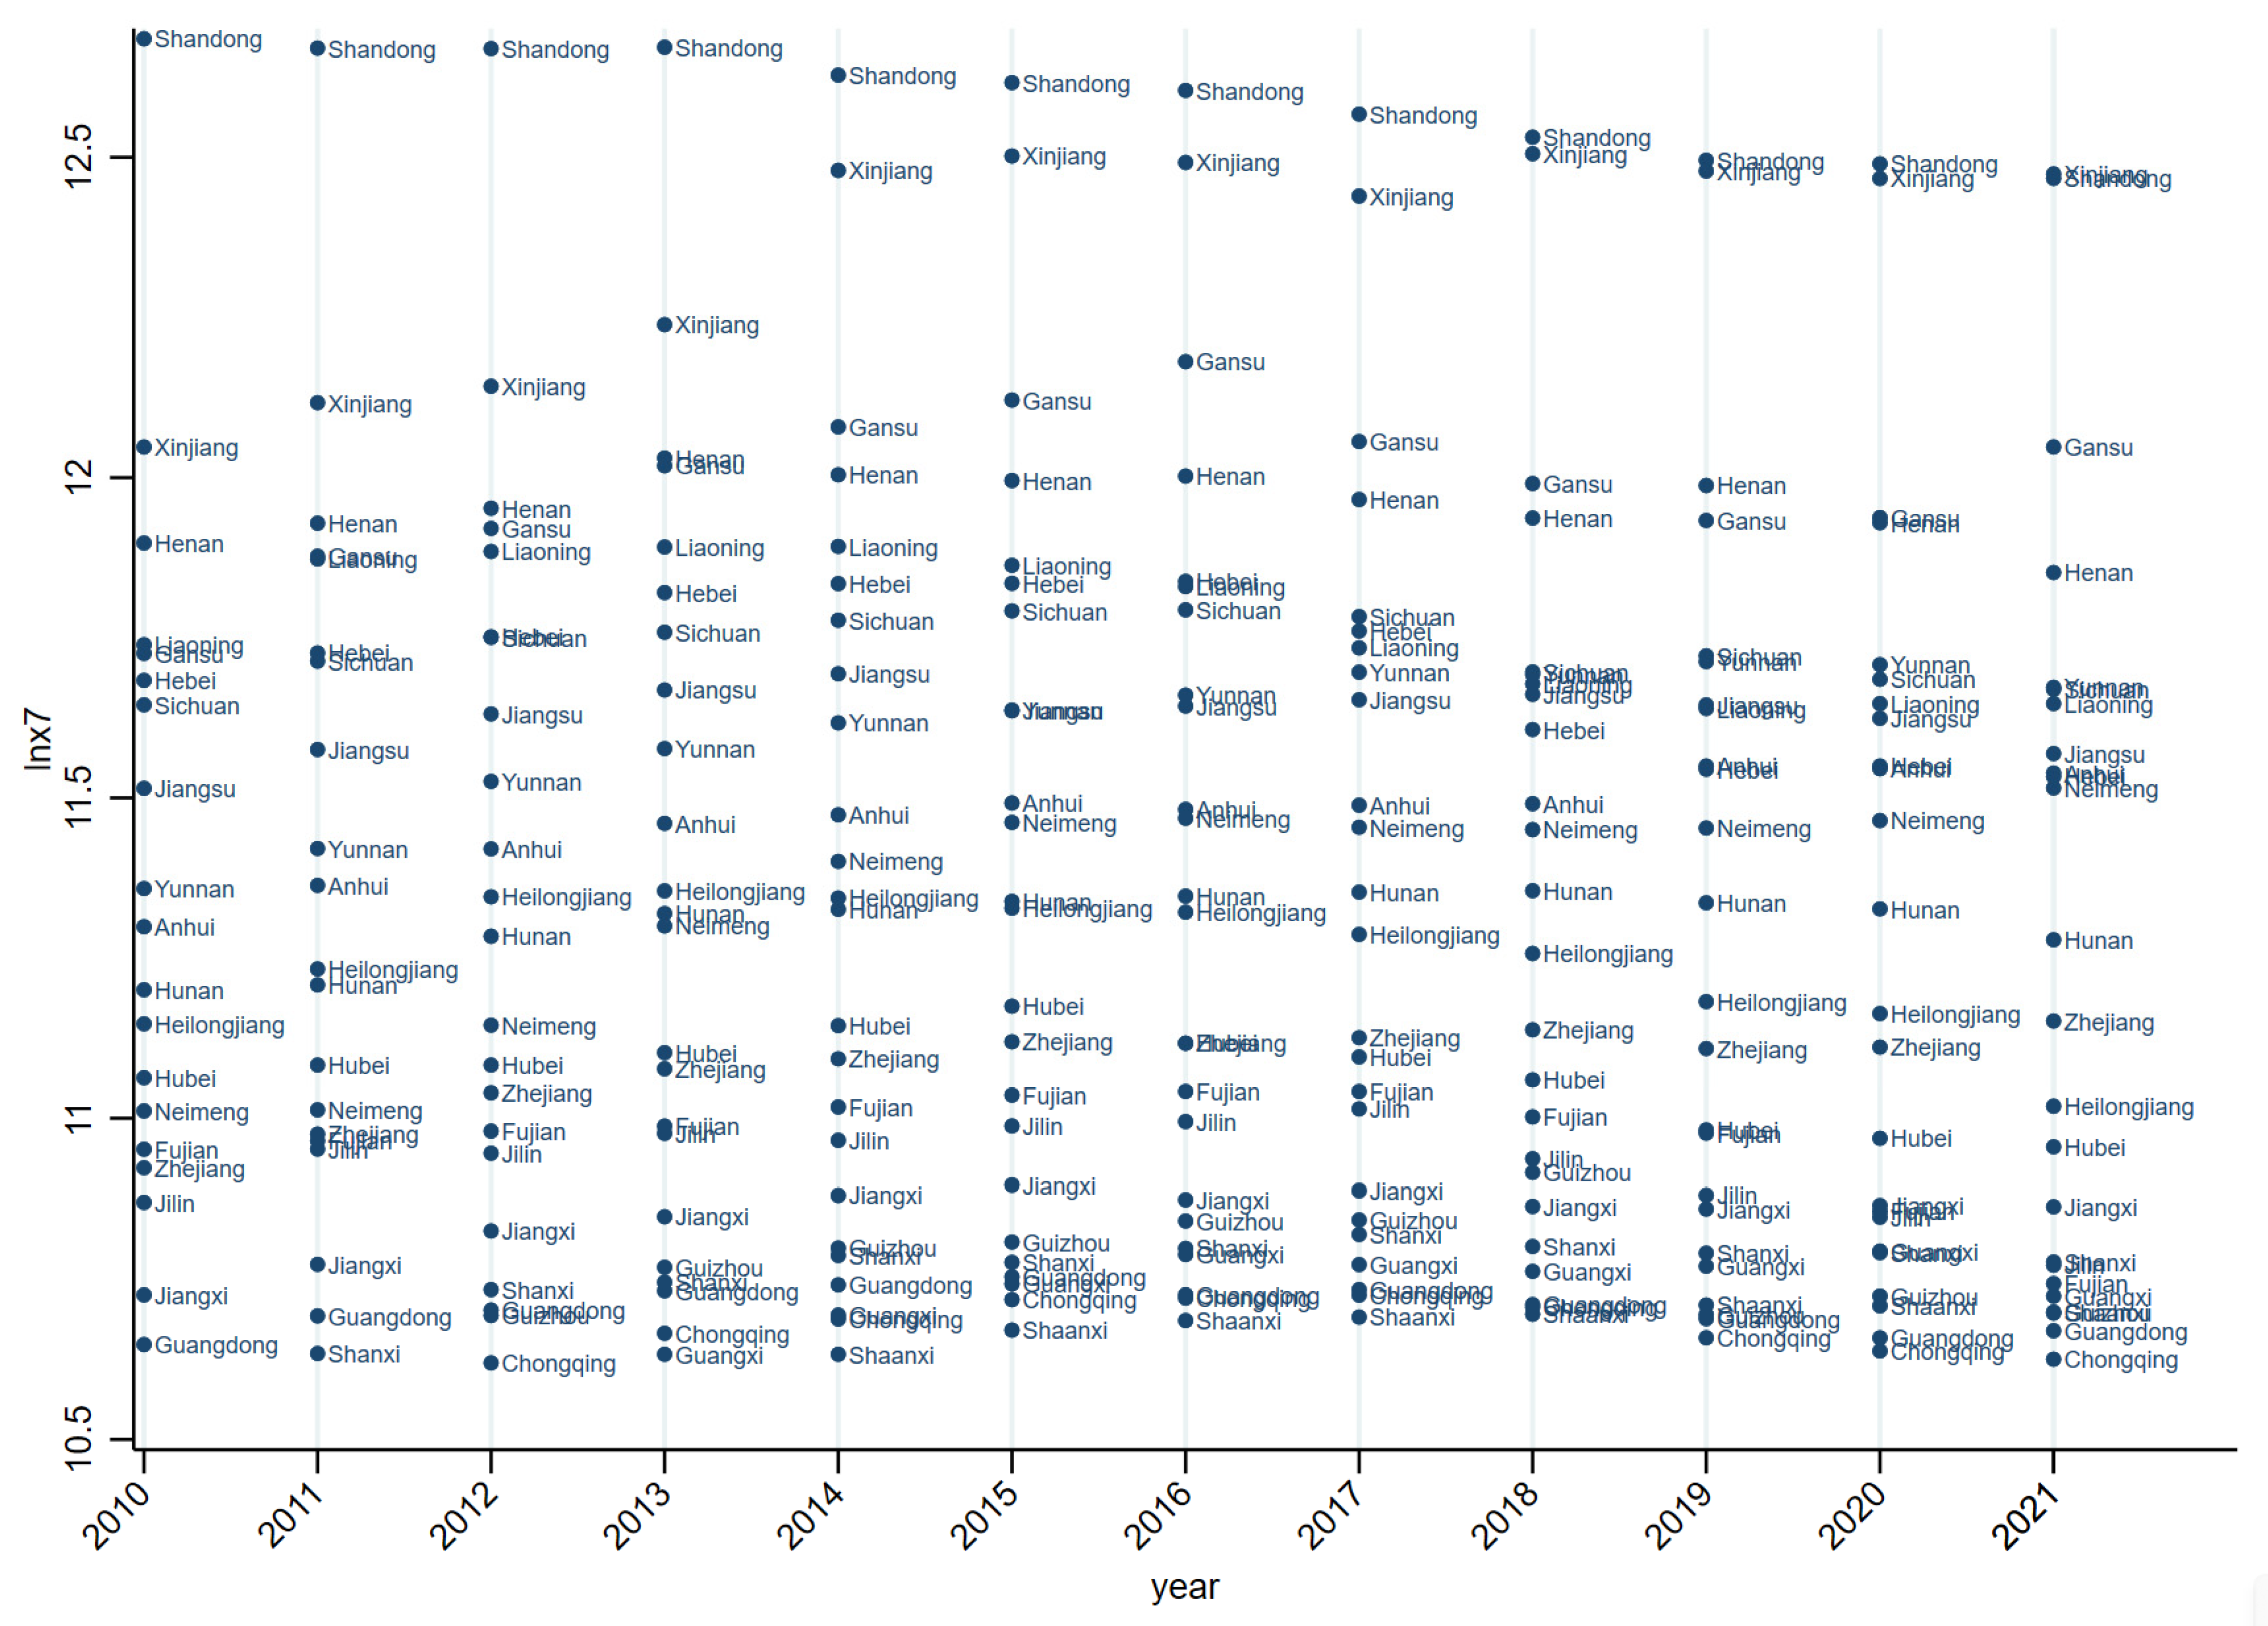
4.1. Analysis of the Current Situation of Agricultural Film Usage in China

Figure 1 illustrates the spatial characteristics of agricultural film usage in China. The year 2020 is the beginning year of the “14th Five-Year Plan”. The red line represents 78,602.3 tons, which is the average amount of agricultural film usage in China’s 30 provinces in 2020. As shown in Figure 1, the provinces where the use of agricultural film exceeded 78,602.3 tons included Anhui, Gansu, Hebei, Henan, Jiangsu, Liaoning, Shandong, Sichuan, Xinjiang and Yunnan between 2010 and 2021. There are mainly three provinces where the use of agricultural film fluctuated around the average value, namely, Heilongjiang, Hunan and Neimeng (Inner Mongoler). The other 17 provinces did not exceed the average in all years. In general, the provinces that showed large differences in the amount of agricultural film usage between 2010 and 2021 are Gansu and Xinjiang. The maximum usage of agricultural film is 269,839 tons and the minimum usage is 123,712 tons. The difference reached 2.18 times. They are located in the northwestern region of China. The temperature there varies greatly throughout the year, which is consistent with the conclusion of Jiang et al. [63] and Leng et al. [64]. The export value of the agricultural products of Shandong Province reached a record high in 2021. The export of agricultural products of Shandong Province has led the entire country for 23 consecutive years. Shandong Province is the largest agricultural product export province in China. Shandong Province ranked first among the 30 provinces of China in terms of agricultural film usage from 2010 to 2021.
Figure 2 shows the spatial distribution of agricultural film usage in China in 2010, 2016, 2020 and 2021. From Figure 2, it can be seen that in 2010, the use of agricultural film showed a trend of high-low-high-low from east to west, but the use of agricultural film in Xinjiang reached 170,713 tons, ranking second in the country. Compared to 2010, the use of agricultural film in other provinces except Beijing, Tianjin, Shanghai and Shandong has been on the rise in 2016. Compared with 2016, the use of agricultural film in the five range of 2020 has significantly decreased, and the overall use of agricultural film in China is on a downward trend. Compared with 2020, the use of agricultural film in the five grades range in 2021 is still declining, but the decline value has become smaller. The use of agricultural film in Neimong, Zhejiang, Guangdong, Gansu, Ningxia and Xinjiang in 2021 was higher than that in 2020, while the use of agricultural film in other provinces was lower in 2021 than in 2020.

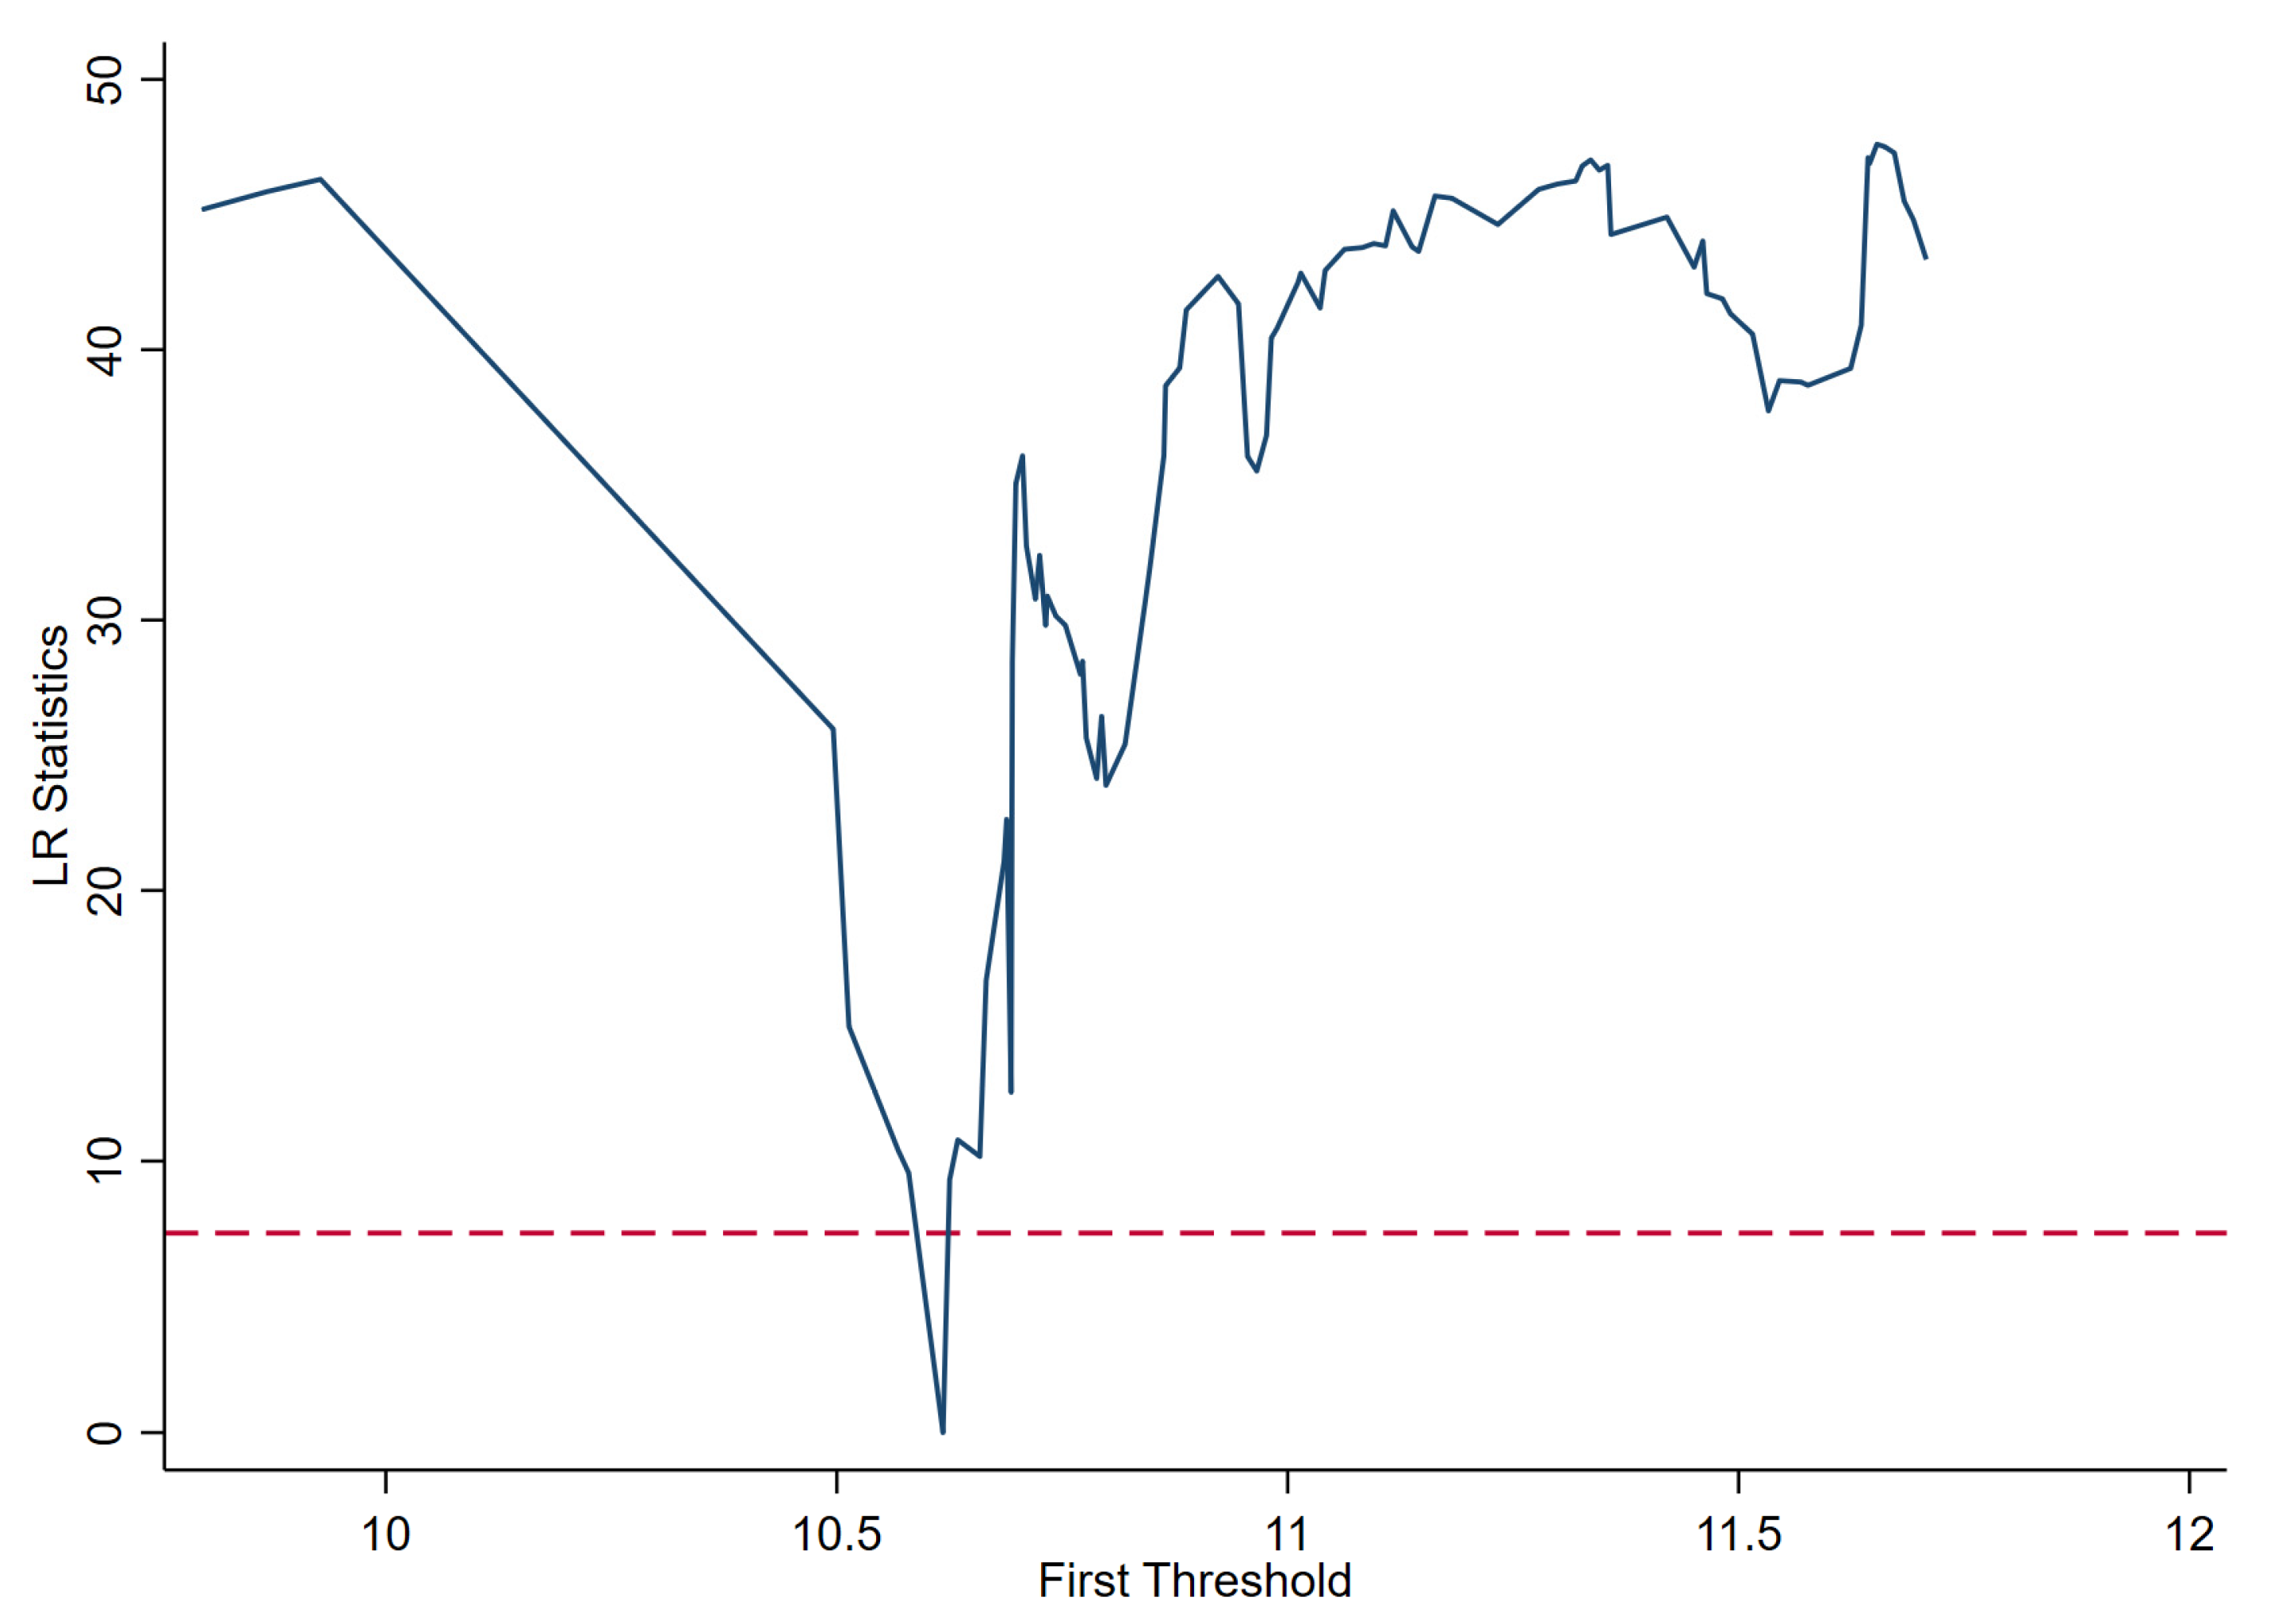
4.2. The Threshold Effect Test of China’s Agricultural Film Usage on Agricultural Development

This article uses the bootstrap self-service method to repeatedly sample 500 times and determines the threshold number and threshold value according to Formulas (3) and (4). From Table 1, we can find that when the use of agricultural film is used as the threshold variable and the use of agricultural film, pesticide use and fertilizer input are used as the core explanatory variables, the single threshold value of agricultural film usage is 10.618, which is 40,857 tons converted into the original data. The F statistic is 58.35 and the p value is 0.006. The single threshold is significant at the 0.01 level. The double threshold value of agricultural film usage failed the test, so a single threshold model was used.
The likelihood ratio function in Figure 3 further clearly describes the construction process of the threshold estimation and confidence interval when the use of agricultural film, pesticide and chemical fertilizer are used as the core explanatory variables and the use of agricultural film is used as the threshold variable. The threshold value is the value of agricultural film usage when the likelihood ratio is LR = 0. The critical value of agricultural film usage at a significance level of 95% is 10.618, which is represented by the dotted line in Figure 2. The confidence interval of the first threshold estimate at the 95% level is [10.9580, 10.625], and the estimated threshold is basically accurate.

4.3. Threshold Effect of China’s Agricultural Film Usage and Analysis of Pesticide Usage and Fertilizer Input on Agricultural Development

Referring to Wooldridge’s econometrics [65], the panel model mainly analyzes variables that change with time and space. Some variables that do not change with time, such as soil, average temperature, average humidity and other comprehensive factors, enter the individual effect α i . Therefore, the influence of soil fertility, average temperature, average humidity and other comprehensive factors on agricultural development in different regions is reflected in the individual effects α i , and the results are shown in Table 2.
In the individual effect results, Anhui is the basis for comparison. Its t statistics is −3.52 and the p value is 0.001, which is less than 0.01. This research result indicates that the comprehensive factors such as soil, average temperature and average humidity have a significant impact on agricultural development. Compared with Anhui, the combined factors of soil, average temperature and average humidity in 12 provinces of Neimong, Jilin, Jiangsu, Shandong, Henan, Hubei, Hunan, Guangdong, Guangxi, Shaanxi, Gansu and Xinjiang had a significant impact on agricultural development. Compared with Anhui, the combined factors of soil, average temperature and average humidity in 17 provinces of Beijing, Tianjin, Hebei, Shanxi, Liaoning, Heilongjiang, Zhejiang, Shanghai, Fujian, Jiangxi, Chongqing, Sichuan, Guizhou, Yunnan, Xizang, Qinghai and Ningxia did not have a significant impact on agricultural development.
With the use of agricultural film used as the threshold variable and the use of agricultural film, pesticide and fertilizer input used as the core variables, the regression is performed according to Formula (6). The regression results of a single threshold are shown in Table 3.
The use of agricultural film is both a core variable and a threshold variable. When the use of agricultural film is below the threshold, every 1% increase in agricultural film usage will reduce agricultural output value by 0.9862% and the impact is significant. The main reason for this is that the use of agricultural film is less than the threshold value in Beijing, Tianjin, Shanghai and Guangdong between 2010 and 2021. Although these regions are in the eastern region and have rapid economic development, agriculture is not the main pillar industry that promotes their economic development. The economies of these regions are dominated by tertiary and secondary industries [66,67]. The use of agricultural film in Qinghai in the western region showed an increasing trend from 2010 to 2021, but the use was not very large. When the use of agricultural film exceeds the threshold value, every 1% increase in agricultural film will increase agricultural output value by 1.1843% and the impact is significant. For most provinces in China, the promotion effect of agricultural film is very obvious. The provinces where the use of agricultural film exceeds the threshold of 10.618 are shown in Figure 4. Figure 4 shows that the province with the highest agricultural film usage is Shandong. Although the use of agricultural film tended to decline from 2010 to 2021, the decline rate was relatively slow. Shandong has been a large source of agricultural production in China for many years, and its agricultural products are not only sold all over the country but also exported abroad in large quantities. The second province in the use of agricultural film is Xinjiang. From 2010 to 2021, the use of agricultural film in Xinjiang increased significantly. By 2021, it will almost reach the same level of Shandong. From 2010 to 2013, Henan ranked third in the use of agricultural film, but after 2013, Gansu surpassed Henan to become third. The use of agricultural film in Henan reached its highest value in 2013 and then started to decline. However, its usage was in third place before 2013. After reaching the highest value in 2016, the use of agricultural plastic film in Gansu began to decline, and in 2019, it was lower than that of Henan.
The use of agricultural film is used as the threshold variable. When the use of pesticides is used as the core variable, whether the use of agricultural film is below the threshold or above the threshold, the impact of pesticides on agricultural development is positive, but its impact is significant. Farmers will surely invest a lot of pesticides to promote the increase of agricultural products. China’s agricultural economic growth is accompanied by a large number of pesticide applications [68], which will inevitably cause a large amount of pesticide residues. Once a large amount of residual pesticide enters the natural ecosystem, it will lead to a compromise in the quality and safety of agricultural products and damage the health of residents. Chemical fertilizer input is the core variable. When chemical fertilizer input is below the threshold, every 1% increase will decrease by 0.7738% in agricultural development, and the impact of chemical fertilizer input on agricultural development is significant. This is contrary to the findings of Huang et al. [69]. Fertilizer inputs hinder agricultural development. When chemical fertilizer input crosses the threshold, every 1% increase in fertilizer input will reduce agricultural development by 1.1107%, and the impact of chemical fertilizer input on agricultural development is significant. The level of farmland nutrient management by Chinese farmers is low, and excessive application of chemical fertilizer is quite common [70]. However, less than 40% of fertilizer is absorbed and utilized by crops [71]. Excessive use of chemical fertilizers has led to the aggravation of water pollution and the degradation of cultivated land quality and ecosystem service functions. The result is a decline in crop yields, which has a negative impact on agricultural development.
Land investment can bring about an increase in agricultural development, and the impact is significant. Land input is the main input element of agricultural development and still plays a major role in agricultural development. The effective water input and total power of agricultural machinery promote agricultural development, and the impact is significant.

4.4. Robustness Test

The robustness test is mainly to ensure the stability of the model parameter estimates. The specific test methods mainly include changing the sample or increasing or reducing the sample observation, replacing with other variables and adopting different measurement methods. For the robustness of the results, this paper uses the panel space lag model and the panel space error model to test the robustness. The specific form of the model is
Y i t = ρ j = 1 n w i j Y j t + X i t β + a i + γ t + u i t
Y i t = X i t β + ε i t ε i t = λ w i j ε j t + v i t
where i , j = 1 , 2 , 3 , , n represent regions, t = 1 , 2 , 3 , , T represents time; Y i t represents agricultural development; w i j is an element in the spatial weight matrix W . When region i and region j are adjacent, w i j = 1 ; when region i and region j are not adjacent, w i j = 0 ; w i j Y j t represents the agricultural development of neighboring region; X i t = ( X 1 i t , X 2 i t , , X k i t ) represents the amount of agricultural film usage and other influencing factors; ρ ,   β ,   λ represent the regression coefficient; α i represents the individual effect, γ t represents the time effect; u i t , ε i t , v i t represent the random error term.
Through the spatial correlation test of Formulas (7) and (8), the results are shown in Table 3.
It can be seen from Table 4 that Moran’s I statistic is 13.733 and the corresponding p value is 0, which is less than 0.05. These show that the sample data have spatial correlation. The LM statistic and the robust LM statistic of the spatial panel error model are 179.751 and 145.714, respectively, and the corresponding p value is 0, which is less than the significance level of 0.05, indicating that the spatial panel error model can be used. The LM statistic of the spatial panel lag model is 34.066, and the corresponding p value is 0, which is less than the significance level of 0.05. The robust LM statistic of the spatial panel lag model is 0.05, and the corresponding p value is 0.865, which is greater than the significant level of 0.1. The spatial panel lag model passes the ordinary LM test, indicating that the spatial panel lag model can be used.
Estimating the unknown parameters of Formulas (7) and (8), the regression results are shown in Table 4.
It can be seen from Table 5 that in the panel space lag model and the panel space error model, the coefficients of agricultural film usage are 0.5840 and 0.4587, respectively, and the impact is significant. This is consistent with the sign of the influence coefficient of the agricultural film usage in the threshold regression model that crosses the threshold, but the value is smaller than the coefficient value. The coefficients of pesticide usage are 0.0085 and 0.0254, respectively, and the impact is significant. This is consistent with the sign of the influence coefficient of pesticide usage in the threshold regression model, and the value of the influence coefficient is very close. The coefficient of fertilizer input is −0.3549 and −0.1976, respectively, and the impact is significant. This is consistent with the sign of the influence coefficient of fertilizer input that does not cross the threshold in the threshold regression model, and there is a certain difference in the value of the influence coefficient. The signs of parameter estimates of other control variables did not change, and the magnitude of the values did not change significantly, indicating that the estimated results of the panel threshold are relatively robust.

5. Research Conclusions and Countermeasures

5.1. Research Conclusions

According to the regression results of the panel threshold model, this article draws the following three conclusions. First, when the use of agricultural film is below and above the threshold value, agricultural film usage promotes agricultural development and the impact is significant. This shows that the positive benefit of the use of agricultural film has not reached its upper limit and it still plays a positive role in promoting agricultural output value. Second, when the use of agricultural film is below and above the threshold value, pesticides usage promotes agricultural development and the impact is significant. If farmers want to increase agricultural income, they will use a large amount of pesticides. The main task at this stage should be to improve the efficiency of pesticide use. Third, when the use of agricultural film is below and above the threshold value, fertilizer input will hinder agricultural development and the impact will be significant. This shows that with an increase in chemical fertilizer input, negative effects begin to appear. Therefore, the main task at this stage is to reduce the amount of chemical fertilizer input and increase the level of fertilizer absorption by wheat.

5.2. Countermeasures

First, strengthen the recycling of agricultural film wastes and strengthen the supervision of local governments. In provinces where the agricultural film is lower than the threshold value, the use of agricultural film is far lower than in provinces where the agricultural film is higher than the threshold value. We can learn from the developed countries in Europe, who implement label management for the collected and processed waste agricultural film so that some of them can be partially transformed into valuable commodities and participate in market transactions. Enterprises are encouraged to purchase useful discarded agricultural film, and local governments can implement tax relief, financial subsidies, etc. for these enterprises. In order to avoid some enterprises only for tax relief and financial subsidies, local governments should strengthen supervision to ensure that useful discarded agricultural film can really play a role.
Second, the recycling rate of agricultural film should be increased, and the use of plastic-free biodegradable films should be vigorously promoted. In provinces where agricultural film is higher than the threshold, governments at all levels should implement a recycling system for waste agricultural film. Local government should determine recycling times and methods and designate relevant enterprises to set up recycling stations in rural areas. Local governments and related enterprises should each bear a relative proportion of the recovery costs. The difference between the relevant enterprises’ recycling cost and income can be supplemented by the local government with tax compensation policies to encourage enterprises and farmers to strengthen the recycling and utilization of waste agricultural film. With enterprises working as the main body and government as the auxiliary body, new technologies can be developed and innovated to produce fully biodegradable agricultural film using straw from various crops as raw materials. These fully biodegradable agricultural films should be able to degrade into organic fertilizers quickly after being discarded. In China, buying price of biodegradation films is maybe double/triple-fold higher than traditional agricultural film. The ecological environment has positive externalities. In the case of higher prices for biodegradable agricultural films, either the farmers are subsidized or the manufacturers who produce them are subsidized.
Third, farmers’ pesticide usage behavior should be restricted, and the insurance mechanisms used for protection against agricultural pests and diseases should be improved. Through knowledge and technical training, farmers are aware of the harm to the quality of agricultural products that is caused by large-scale pesticide application. We should promote the use of green pesticides. The technical staff of a pesticide sales station can provide targeted guidance to farmers on the scale and type of rational pesticide use. The government could then improve the monitoring and early warning of agricultural pests and diseases and encourage farmers to purchase insurance against damages caused by such to ensure the economic benefits of farmers.
Fourth, reduce the amount of fertilizer input and incentivize farmers to use organic fertilizers through government subsidies. The utilization rate of chemical fertilizers in China’s farmland is relatively low, the rate of fertilizer absorption and utilization by crops after being applied to the soil is less than 40%. The excessive use of fertilizers can damage the soil aggregate structure and cause soil compaction. The use of organic fertilizer can improve soil, enhance soil fertility, enhance soil nutrient vitality, purify soil ecological environment and ensure high-quality and high-yield agriculture.
This article addresses economic data from the National Bureau of Statistics. It does not involve soil, air temperature, humidity or other experimental data. In future research, a hierarchical model that uses both economic and experimental data can be presented to study the impact of agricultural film use on agricultural development.

Author Contributions

Z.L. and C.L. are the co-first authors. C.L. is the corresponding author. L.W. is third author. All authors contributed equally to this work. All authors have read and agreed to the published version of the manuscript.

Funding

This research was supported by the National Social Science Funding of China (No: 19BJY142) and Hebei GEO University (KJCXTD-2022-02).

Institutional Review Board Statement

This article does not contain any studies with human participants or animals performed by any of the authors.

Informed Consent Statement

Not applicable.

Data Availability Statement

Data is contained within the article.

Acknowledgments

Thanks to the editors and reviewers for their comments; our article has been greatly improved. Moreover, we would like to thank Hebei GEO University for providing us with the necessary financial support.

Conflicts of Interest

All authors declare that there are no conflict of interest.

References

  1. Wu, H.B. CCTV Domestic. 2017. Available online: http://news.cnr.cn/native/gd/20171109/t20171109_524018911.shtml (accessed on 12 May 2023).
  2. Fan, J.H. The Time Significance of the Rural Revitalization Strategy. Adm. Reform 2018, 2, 16–21. [Google Scholar] [CrossRef]
  3. Tian, Y.; Zhang, J.S.; Li, B. Agricultural Carbon Emissions in China: Calculation, Spatial-Temporal Comparison and Decoupling Effects. Resour. Sci. 2012, 34, 2097–2105. [Google Scholar]
  4. Zhang, Z.G.; Yuan, Z.; Li, B.G.; Zhang, H.L.; Zhang, Y.; Deng, M.J. Spatial-temporal evolution characteristics and factors decomposition on agricultural carbon emissions in Henan Province. Chin. J. Agric. Resour. Reg. Plan. 2017, 38, 2097–2105. [Google Scholar] [CrossRef]
  5. Li, B.; Zhang, J.S.; Li, H.P. Research on Spatial-temporal Characteristics and Affecting Factors Decomposition of Agricultural Carbon Emission in China. China Population, Resources and Environment. China Popul. Resour. Environ. 2011, 21, 80–86. [Google Scholar] [CrossRef]
  6. Tian, Y.; Yin, M.H. Re-evaluation of China’s Agricultural Carbon Emissions: Basic Status, Dynamic Evolution and Spatial Spillover Effects. Chin. Rural. Econ. 2022, 3, 104–127. [Google Scholar]
  7. Wang, Y.; Wang, F.; Xian, L.L. Risk Assessment of Agricultural Plastic Films Based on Release Kinetics of Phthalate Acid Esters. Environ. Sci. Technol. 2021, 55, 3676–3685. [Google Scholar] [CrossRef] [PubMed]
  8. National Bureau of Statistics of China; Rural Socio Economic Investigation Department of National Bureau of Statistics. China Rural Statistical Yearbook (2020); China Statistics Press: Beijing, China, 2020; pp. 31–53.
  9. Li, W.F.; Wufuer, R.; Duo, J.; Wang, S.Z.; Luo, Y.M.; Zhang, D.Y.; Pan, X.L. Microplastics in agricultural soils: Extraction and characterization after different periods of polythene film mulching in an arid region. Sci. Total Environ. 2020, 749, 141420. [Google Scholar] [CrossRef]
  10. Huang, Y.; Liu, Q.; Jia, W.; Yan, C.; Wang, J. Agricultural plastic mulching as a source of microplastics in the terrestrial environment. Environ. Pollut. 2020, 260, 114096–114101. [Google Scholar] [CrossRef]
  11. Hou, L.J.; Xi, J.; Chen, X.T.; Li, X.; Ma, W.; Lu, J.; Lin, Y.B. Biodegradability and ecological impacts of polyethylene-based mulching film at agricultural environment. J. Hazard. Mater. 2019, 378, 120774. [Google Scholar] [CrossRef]
  12. Li, Y.Q.; Zhao, C.X.; Yan, C.R.; Mao, L.L.; Liu, Q.; Li, Z.; He, W.Q. Effects of agricultural plastic film residues on transportation and distribution of water and nitrate in soil. Chemosphere 2020, 242, 125131. [Google Scholar] [CrossRef]
  13. Steinmetz, Z.; Wollmann, C.; Schaefer, M. Plastic mulching in agriculture Trading short-term agronomic benefits for long-term soil degradation? Sci. Total Environ. 2016, 550, 690–705. [Google Scholar] [CrossRef]
  14. Li, K.K.; Ma, D.; Wu, J.; Chai, C.; Shi, Y.X. Distribution of phthalate esters in agricultural soil with plastic film mulching in Shandong Peninsula, East China. Chemosphere 2016, 164, 314–321. [Google Scholar] [CrossRef]
  15. Huang, Z.H.; Song, W.H.; Cheng, W.S.; Li, X.X. Has the Development of Leisure Agriculture and Rural Tourism Promoted the Increase of Farmers’ Income: An Evidence from Quasi-natural Experiment. Econ. Geogr. 2022, 42, 213–222. [Google Scholar] [CrossRef]
  16. Zhang, G.G.; Yuan, B.B. Adhere to Green Development to Lead Rural Revitalization. 2019. Available online: http://country.people.com.cn/n1/2019/0518/c419842-31091587.html (accessed on 18 May 2023).
  17. Seo, H.D. White revolution of agriculture in Korea: The achievement of year-round production and distribution of horticultural crops by the expansion of greenhouse cultivation. Hortic. Abstr. 2013, 1, 168. [Google Scholar]
  18. Mosnáčková, K.; Šišková, A.; Janigová, I.; Kollár, J.; Šlosár, M.; Chmela, S. Ageing of plasticized poly(lactic acid)/poly(β-hydroxybutyrate) blend films under artificial UV irradiation and under real agricultural conditions during their application as mulches. Chem. Pap. 2016, 70, 1268–1278. [Google Scholar] [CrossRef]
  19. Gong, D.Z.; Hao, W.P.; Mei, X.R.; Gao, X.; Liu, Q.; Caylor, K. Warmer and Wetter Soil Stimulates Assimilation More than Respiration in Rainfed Agricultural Ecosystem on the China Loess Plateau: The Role of Partial Plastic Film Mulching Tillage. PLoS ONE 2017, 10, e0136578. [Google Scholar] [CrossRef] [PubMed]
  20. Ren, S.Y.; Ni, H.G. A method for measuring the emissions of in situ agricultural plastic film microplastics by ultraviolet and mechanical abrasion. Sci. Total Environ. 2022, 819, 152041. [Google Scholar] [CrossRef] [PubMed]
  21. Kasirajan, S.; Ngouajio, M. Polyethylene and biodegradable mulches for agricultural applications: A review. Agron. Sustain. Dev. 2012, 32, 501–529. [Google Scholar] [CrossRef]
  22. Wang, L.; Li, Q.; Coulter, J.A.; Xie, J.H.; Luo, Z.Z.; Zhang, R.Z.; Deng, X.P.; Li, L.L. Winter wheat yield and water use efficiency response to organic fertilization in northern China: A meta-analysis. Agric. Water Manag. 2022, 229, 105934. [Google Scholar] [CrossRef]
  23. Ding, F.; Jones, D.L.; Chadwick, D.R.; Kim, P.J.; Jiang, R.; Flury, M. Environmental impacts of agricultural plastic film mulch: Fate, consequences, and solutions. Sci. Total Environ. 2022, 836, 155668. [Google Scholar] [CrossRef]
  24. Filipovic, V.; Romic, D.; Romic, M.; Borošić, J.; Filipović, L.; Mallmann, F.J.K.; Robinson, D.A. Plastic mulch and nitrogen fertigation in growing vegetables modify soil temperature, water and nitrate dynamics: Experimental results and modeling study. Agric. Water Manag. 2016, 176, 100–110. [Google Scholar] [CrossRef]
  25. Guo, Y.X.; Wang, J.; Li, D.Q.; Tanng, P.G.; Lerous, F.; Feng, Y.G. Micrometer-sized dihydrogen phosphate-intercalated layered double hydroxides: Synthesis, selective infrared absorption properties, and applications as agricultural films. Dalton Trans. 2018, 47, 3144–3154. [Google Scholar] [CrossRef] [PubMed]
  26. Yu, T.J.; Wang, Y.T.; Liu, W.J.; Jia, X.; Ma, L.; Ren, L.T.; Xue, M.; Liu, X.D. Exploration of highly efficient light conversion agents for agricultural film based on the bay-substituted perylene diimides derivatives. Dye. Pigment. 2018, 159, 483–490. [Google Scholar] [CrossRef]
  27. Ren, S.C.; Wang, L.; Yu, H.J.; Haroon, M.; Ullah, R.S.; Haq, F.; Fahad, S. Recent progress in synthesis of antifogging agents and their application to agricultural films: A review. J. Coat. Technol. Res. 2018, 15, 445–455. [Google Scholar] [CrossRef]
  28. Li, Y.Q.; He, W.Q.; Yan, C.R.; Guo, R.; Zhao, C.X. Effects of Agricultural Plastic Residual Films on Morphologic and Physiological Characteristics of Root System of Cotton and Maize in Seedling Stage. J. Agric. Resour. Environ. 2017, 34, 108–114. [Google Scholar] [CrossRef]
  29. Liu, E.K.; He, W.Q.; Yan, C.R. ‘White revolution’ to ‘white pollution’—Agricultural plastic film mulch in China. Environ. Res. Lett. 2014, 9, 091001. [Google Scholar] [CrossRef]
  30. Chen, P.P.; Gu, X.B.; Li, Y.N.; Qiao, L.R.; Li, Y.P.; Fang, H.; Yin, M.H.; Zhou, C.M. Effects of residual film on maize root distribution, yield and water use efficiency in Northwest China. Agric. Water Manag. 2022, 260, 107289. [Google Scholar] [CrossRef]
  31. Zhang, J.; Chen, J.; Jia, R.M.; Dun, Z.H.; Wang, B.T.; Hu, X.P.; Wang, Y. Selection and evaluation of microorganisms for biodegradation of agricultural plastic film. 3 Biotech 2018, 8, 308. [Google Scholar] [CrossRef]
  32. Sander, M. Biodegradation of Polymeric Mulch Films in Agricultural Soils: Concepts, Knowledge Gaps, and Future Research Directions. Environ. Sci. Technol. 2019, 53, 2304–2315. [Google Scholar] [CrossRef]
  33. Deng, L.; Meng, X.Y.; Yu, R.D.; Wang, Q. Assessment of the Effect of Mulch Film on Crops in the Arid Agricultural Region of China under Future Climate Scenarios. Water 2019, 11, 1819. [Google Scholar] [CrossRef]
  34. Stasi, E.; Giuri, A.; Ferrari, F.; Armenise, V.; Corcione, C.E. Biodegradable Carbon-based Ashes/Maize Starch Composite Films for Agricultural Applications. Polymers 2020, 12, 524. [Google Scholar] [CrossRef]
  35. Wang, X.T.; Zhang, J.B.; Tong, Q.M. Can Participating in Agricultural Technology Training Promote Farmers to Implement Green Production Behavior? Based on the Analysis of Family Endowment and ESR Model. Resour. Environ. Yangtze Basin 2021, 30, 202–211. [Google Scholar]
  36. Zhang, W.E.; Zhao, M.J. Social Networks, Information Acquisition and Households’ Behavior of Agricultural Film Recycling: A Sample of Farm Households in Yellow River Basin. J. Shanghai Jiao Tong Univ. 2022, 21, 40–48. [Google Scholar] [CrossRef]
  37. Wang, Q.; Zhang, C.H.; Sun, L.B. Study on the Willingness of Corps Workers to Participate in the Treatment of Agricultural Residual Film. Sustain. Dev. 2019, 9, 304–314. [Google Scholar] [CrossRef]
  38. Li, C.X.; Li, G.Z.; Li, Z.N. The threshold effect of the efficiency of science and technological services on regional environmental governance in China. Growth Change 2019, 50, 1026–1042. [Google Scholar] [CrossRef]
  39. Li, C.X.; Jia, Q.; Li, G.Z. China’s energy consumption and green economy efficiency: An empirical research based on the threshold effect. Environ. Sci. Pollut. Res. 2020, 27, 36621–36629. [Google Scholar] [CrossRef] [PubMed]
  40. Li, C.X.; Li, G.Z. Does environmental regulation reduce China’s haze pollution? An empirical analysis based on panel quantile regression. PLoS ONE 2020, 15, e0240723. [Google Scholar] [CrossRef]
  41. Li, Z.N.; Li, C.X. How industrial upgrading can improve China’s air quality: Empirical analysis based on multilevel growth model. Environ. Sci. Pollut. Res. 2022, 29, 54456–54466. [Google Scholar] [CrossRef] [PubMed]
  42. Lin, Y.; Ma, J. Economic level of fertilizer application in grain production of farmers: A case study of wheat farmers in North China Plain. J. Agrotech. Econ. 2013, 32, 25–31. [Google Scholar] [CrossRef]
  43. Huang, M.; Wang, Z.H.; Liu, J.S. Improving wheat yield by optimizing seeding and fertilizer rates based on precipitation in the summer fallow season in drylands of the Loess Plateau. Agric. Water Manag. 2022, 264, 107489. [Google Scholar] [CrossRef]
  44. Rachana, D.; Himanshu, P.; Bidisha, C.; Shivdhar, S.; Kumar, G.K.; Harit, R.C. Impact of terminal heat stress on wheat yield in India and options for adaptation. Agric. Syst. 2020, 181, 102826. [Google Scholar] [CrossRef]
  45. Li, C.; Wang, X.S.; Guo, Z.K.; Huang, N.; Hou, S.; He, G.; Batchelor, W.D.; Siddique, K.H.M.; Wang, Z.H.; Zhang, D. Optimizing nitrogen fertilizer inputs and plant populations for greener wheat production with high yields and high efficiency in dryland areas. Field Crops Res. 2022, 276, 108374. [Google Scholar] [CrossRef]
  46. Chi, Y.B.; Yang, P.L.; Ren, S.M.; Ma, N.; Yang, J.; Xu, Y. Effects of fertilizer types and water quality on carbon dioxide emissions from soil in wheat-maize rotations. Sci. Total Environ. 2020, 698, 134010. [Google Scholar] [CrossRef] [PubMed]
  47. Wei, L.; Mi, X.T.; Sun, X.T.; Li, Z.M.; Shi, M.; He, G.; Wang, Z.H. Current Status of Chemical Fertilizers, Pesticides, and Irrigation Water and Their Reducing Potentials in Wheat Production of Northern China. Sci. Agric. Sin. 2022, 55, 2584–2597. [Google Scholar] [CrossRef]
  48. Shi, X.Y.; Li, H.B.; Wang, H.G.; Wang, F.T.; Cao, S.X. Progresses of pesticide reduction techniques in wheat production and the synergistic effects on the prevention and control of wheat pest. J. China Agric. Univ. 2022, 27, 53–62. [Google Scholar] [CrossRef]
  49. Wu, W.B.; Zhang, Z.B.; Dong, R.Y.; Xie, G.N. Characterization and properties of a Sr2 Si5 N8:Eu2+-based light-conversion agricultural film. J. Rare Earths 2020, 38, 539–545. [Google Scholar] [CrossRef]
  50. Xue, Y.H.; Guo, J.B.; Li, C.; Xu, X.B. Influencing factors of farmers’ cognition on agricultural mulch film pollution in rural China. Sci. Total Environ. 2021, 787, 147702. [Google Scholar] [CrossRef]
  51. Lian, Z.M.; Gu, X.; Liu, L.H. Diffuse phthalate acid esters losses induced from large amount of agricultural plastic film residues caused low risks for water quality in China during 1991–2017. J. Hazard. Mater. 2022, 431, 128644. [Google Scholar] [CrossRef] [PubMed]
  52. Li, C.X.; Li, G.Z. Impact of China’s water pollution on agricultural economic growth: An empirical analysis based on a dynamic spatial panel lag model. Environ. Sci. Pollut. Res. 2020, 28, 6956–6965. [Google Scholar] [CrossRef]
  53. Kader, M.A.; Senge, M.; Mojjd, M.A.; Ito, K. Recent advances in mulching materials and methods for modifying soil environment. Soil Tillage Res. 2017, 168, 155–166. [Google Scholar] [CrossRef]
  54. Ramos, L.; Berenstein, G.; Hughes, E.A.; Zalts, A.; Montserrat, J. Polyethylene film incorporation into the horticultural soil of small periurban production units in Argentina. Sci. Total Environ. 2015, 523, 74–81. [Google Scholar] [CrossRef]
  55. Zhang, H.R.; Jin, T.; Geng, M.J.; Cui, K.S.; Peng, J.W.; Luo, G.G.; Delgado, A.N.; Zhou, Y.Y.; Liu, J.; Fei, J.C. Occurrence of Microplastics from Plastic Fragments in Cultivated Soil of Sichuan Province: The Key Controls. Water 2022, 14, 1417. [Google Scholar] [CrossRef]
  56. Li, X.F.; Zhu, J.Z.; Gu, X.J.; Zhu, J.J. Current status of agricultural non-point source pollution and progress in prevention. Chin. J. Popul. Resour. Environ. 2010, 4, 81–84. [Google Scholar]
  57. Wang, X.; Li, X.B. Where Are Potential Regions for the Reallocation of Wheat in the Context of Chinese Land Fallow and Food Security Policies? Findings from Spatio-temporal Changes in Area and Production Between 1990 and 2014. J. Resour. Ecol. 2018, 9, 592–608. [Google Scholar] [CrossRef]
  58. Ye, S.L. Effects of different covering materials on soil water content and wheat yield. Land Dev. Eng. Res. 2018, 3, 56–60. [Google Scholar]
  59. Xu, H.M.; Huo, Y.Z.; Peng, Z.Y.; Guo, Y.F.; Li, S.Y. Effects of different materials mulching on soil moisture-temperature and yield of wheat. J. Arid. Land Resour. Environ. 2019, 33, 107–111. [Google Scholar] [CrossRef]
  60. Huang, M.L.; Li, X.Y.; You, L.Z. Impact of Agricultural Machinery and Agricultural Labor Investment on Grain Production and Its Elasticity of Substitution. J. Huazhong. Agric. Uni. (Soc. Sci. Ed.) 2018, 2, 37–45. [Google Scholar] [CrossRef]
  61. Hansen, B.E. Threshold effects in non-dynamic panels: Estimation, testing, and inference. J. Econom. 1999, 93, 345–368. [Google Scholar] [CrossRef]
  62. National Bureau of Statistics 2011–2022. Available online: https://www.stats.gov.cn/tjsj/ndsj/ (accessed on 20 May 2023).
  63. Jiang, R.; Guo, S.; Ma, D.D. Review of plastic film mulching system and its impact on soil ecological environment in China’s rainfed drylands. Chin. J. Eco-Agric. 2018, 26, 317–328. [Google Scholar] [CrossRef]
  64. Leng, G.X.; Shi, L.P.; Qiu, H.G. Can Agricultural Film Technology Increase Economic Benefits?—Based on Panel Data of 2927 Rural Households in Fixed Observation Points Nationwide. Agric. Econ. Manag. 2020, 1, 44–53. [Google Scholar]
  65. Wooldridge, J.M. Introductory Econometrics: A Modern Approach; Cengage Learning: Boston, MA, USA, 2016; pp. 435–436. [Google Scholar]
  66. Shao, S.; Yang, L.L.; Gan, C.H.; Cao, J.H.; Guan, D.B. Using an extended LMDI model to explore techno-economic drivers of energy-related industrial CO2 emission changes: A case study for Shanghai (China). Renew. Sustain. Energy Rev. 2016, 55, 516–536. [Google Scholar] [CrossRef]
  67. Song, T.; Dong, G.P.; Tang, Z.P. Industrial structure optimization of Beijing-Tianjin-Hebei under the triple restriction of energy, environment and employment. Geogr. Res. 2017, 36, 2184–2196. [Google Scholar]
  68. Yu, W.; Zhang, P. Analysis of spatiotemporal characteristics and influencing factors between pesticide application and agricultural economic growth in China. Chin. J. Agric. Resour. Reg. Plan. 2018, 39, 88–95. [Google Scholar]
  69. Huang, J.K.; Hu, R.F.; Cao, J.M.; Rozelle, S. Training programs and in the field guidance to reduce China’s overuse of fertilizer without hurting profitability. J. Soil Water Conserv. 2008, 63, 165–167. [Google Scholar] [CrossRef]
  70. Sun, Y.; Hu, R.; Zhang, C. Does the adoption of complex fertilizers contribute to fertilizer overuse? Evidence from rice production in China. J. Clean. Prod. 2019, 219, 677–685. [Google Scholar] [CrossRef]
  71. Jiao, X.Q.; He, G.; Cui, Z.L.; Shen, J.B.; Zhang, F.S. Agri-environment policy for grain production in China: Toward sustainable intensification. China Agric. Econ. Rev. 2018, 10, 78–92. [Google Scholar] [CrossRef]
Figure 1. Box plot of agricultural film usage in 30 provinces of China from 2010 to 2021.
Applsci 14 00006 g001
Figure 2. Distribution of agricultural films usage in China in 2010, 2016, 2020 and 2021.
Applsci 14 00006 g002
Figure 3. Estimated value and confidence interval of the first threshold of agricultural film use.
Applsci 14 00006 g003
Figure 4. Provinces where the use of agricultural film is higher than the threshold value.
Applsci 14 00006 g004
Table 1. The threshold effect test.
Core Explanatory VariablesThreshold
Variable
Threshold
Order
Threshold
Value
FpBootstrap Times95% Confidence Interval
AfuAfuSingle threshold10.618 ***58.350.006500[10.580, 10.625]
PeuDouble threshold9.74525.010.364500[9.264, 9.393]
Fei10.618[10.580, 10.625]
Notes: *** is significant at the 0.01 level.
Table 2. Individual effects.
ProvinceCoeftpProvinceCoeftp
Anhui−8.1455 ***−3.520.001Henan0.5389 ***3.490.002
Beijing0.01160.010.988Hubei1.0109 ***7.590
Tianjin 0.26670.470.639Hunan0.3716 ***3.930
Hebei0.03690.370.717Guangdong1.6016 ***6.490
Shanxi−0.0098−0.040.967Guangxi1.3158 ***6.420
Neimong−0.3434 **−2.170.038Chongqing0.46461.240.226
Liaoning−0.5244−1.620.116Sichuan0.13970.710.482
Jilin0.2894 *1.740.093Guizhou−0.2495−0.650.519
Heilongjiang0.150810.600.551Yunnan−0.1248−0.540.591
Jiangsu0.4037 ***4.580Xizang0.45680.600.553
Zhejiang−0.1430−0.450.658Shaanxi1.3516 ***5.460
Shanghai−0.6491−0.780.440Gansu−1.5196 ***−3.070.005
Fujian0.61541.650.111Qinghai−0.3239−0.430.673
Jiangxi0.02580.110.910Ningxia0.15380.340.755
Shandong−0.5529 **−2.390.024Xinjiang−1.1026 ***−3.160.004
Notes: * is significant at the 0.1 level, ** is significant at the 0.05 level, and *** is significant at the 0.01 level.
Table 3. Threshold model regression results of agricultural development as an explained variable.
CoefStd. Errtp > ∣t∣
LnAfu·1 (LnAfu ≤ 10.618)0.9862 ***0.10789.150
LnAfu·1 (LnAfu > 10.618)1.1843 ***0.110210.750
LnPeu·1 (LnAfu ≤ 10.618)0.0184 **0.00792.330.02
LnPeu·1 (LnAfu ≤ 10.618)0.0320 ***0.004080
LnFei·1 (LnAfu ≤ 10.618)−0.7738 ***0.1630−4.750
LnFei·1 (LnAfu > 10.618)−1.1107 ***0.1612−6.890
LnLai0.2979 *0.15921.870.062
LnWri0.2368 ***0.07853.020.003
LnTpm0.2425 ***0.08192.960.003
_cons−6.4407 ***1.0806−5.960
R20.6879
F value55.84
Observations360
Notes: * is significant at the 0.1 level, ** is significant at the 0.05 level and *** is significant at the 0.01 level.
Table 4. Spatial correlation test results.
TestStatisticdfp-Value
Spatial error:
Moran’s I13.73310
Lagrange multiplier179.75110
Robust Lagrange multiplier145.71410
Spatial lag:
Lagrange multiplier34.06610
Robust Lagrange multiplier0.02910.865
Table 5. Regression results of spatial panel lag model and spatial panel error model.
VariablesSpatial Panel Lag ModelSpatial Panel Error Model
LnAfu0.5840 ***0.4587 ***
(8.63)(6.09)
LnPeu0.0085 ***0.0254 ***
(3.37)(3.68)
LnFei−0.3549 ***−0.1976 ***
(−3.85)(−2.17)
LnLai0.5181 ***0.4473 ***
(5.36)(4.32)
LnWri0.1788 ***0.1078 **
(3.69)(2.22)
LnTpm0.1749 ***0.1379 ***
(3.47)(3.05)
Spatial rho0.7090 ***
(24.74)
Spatial lanbda 0.8044 ***
(27.32)
Number360360
AIC−436.855−390.627
BIC−405.766−359.538
Notes: The value in parentheses is the z value. ** indicates significant at 0.05 level and *** indicates significant at 0.01 level.
Disclaimer/Publisher’s Note: The statements, opinions and data contained in all publications are solely those of the individual author(s) and contributor(s) and not of MDPI and/or the editor(s). MDPI and/or the editor(s) disclaim responsibility for any injury to people or property resulting from any ideas, methods, instructions or products referred to in the content.

