1. Introduction
Due to the growing emphasis on environmental protection and sustainable development, the use of timber as a construction material is increasing. Thus, the need for quality inspection of timber is also becoming more important. Timber panels are the most common raw material used for engineered wood products such as multiplex. It can be obtained by peeling off the trunk of a tree with sharp blades or by slicing rectangular blocks of wood. Reliable quality control of timber panels is necessary to detect any timber flaws, improve wood product safety, and expand their service life.
Defects occur during both the production process and the use phase of timber panels. In the production process, they can arise during pressing, gluing, drying, and curing. During long-term use, the deterioration of timber structures occurs due to both biological (decay, fungi, termites, etc.) and physical (acid rain, sunshine, worms, etc.) factors. Considering the engineering applications, defects such as delaminations, knots, wormholes, and cracks are often of great concern [
1].
Many nondestructive testing (NDT) methods have been developed to detect the aforementioned defects [
2,
3,
4,
5]. Machine vision techniques are promising methods [
6,
7], but they have two major drawbacks. Firstly, they can only detect surface defects but not inner defects. Secondly, timber panels are unique even if they originate from the same tree, which requires the application of advanced pattern recognition methods for defect detection [
8]. Some techniques, such as those using sonic stress waves, electrical resistivity, or ultrasound, need direct contact or a coupling agent between the transducers and the sample, which makes the inspection process cumbersome and time-consuming. Furthermore, coupling agents, such as gel, liquid, or glue, may contaminate the sample.
Therefore, the air-coupled ultrasound (ACU) method is preferred because it overcomes these drawbacks by avoiding direct contact with the sample [
9,
10,
11]. Furthermore, transducers mounted on brackets can scan a large area within a short time, the measurement process can be fully automated, and the defects can be visualized using the C-scan method [
12]. All these advantages make the ACU method suitable for automated industrial timber production, especially for continuous manufacturing [
13,
14,
15,
16,
17].
The ACU techniques are often divided into two modes: through-transmission mode and reflection-transmission (echo) mode. In the through-transmission mode, the transmitter and the receiver are located on both sides of the sample. The receiver receives the pulses which travel through the sample. In the reflection-transmission mode, the transmitter and the receiver are located on the same side of the sample and the receiver receives the reflected pulses. In both cases, the time of flight (TOF) and attenuation of the signal are the two main parameters used to detect the defects present in the specimen [
18]. In this paper, attenuation and TOF are picked for defect detection.
The most significant challenge of the ACU techniques versus contact-type ones is the significant impedance mismatch between the air and solids. At every boundary (transducer/air, air/solid, solid/air, and air/receiver), the majority of energy is reflected and only less than 0.5% of the energy of the transmitter can be captured by the receiver [
19]. Thus, the research on the ACU testing technology mainly focuses on the following two aspects: (1) the development of high-performance ultrasonic transducers, and (2) efficient signal processing of weak ultrasonic signals. Various studies have been published on the two subjects. Hossack and Hayward [
20] proposed that composite ultrasonic transducers with a high enough ceramic column and small column spacing would have a significantly better performance. Grandia et al. [
21] added a quarter wavelength thickness impedance matching layer to the outer surface of traditional sensors to reduce the attenuation of ultrasonic waves. Hayward et al. [
22] suggested that resonators made of composite materials comprising piezoelectric ceramics and polymer could improve conversion efficiency and reduce energy losses. They all focused on high-performance ultrasonic transducers. Studies on high-performance ultrasonic transducers use composite materials, which significantly increases the cost of testing systems. The focus of this paper is reducing the cost of industrial quality assurance of engineered wood products by improving signal processing. Stoessel et al. [
23] pursued research on the applications of the ACU technology to wood, fiber-reinforced plastics, “smart” structures, and fiber-reinforced ceramics, which is the enlightenment of applying the ACU method for defect detection of timber panels.
In this study, ACU measurements on timber panels for defect detection in engineered wood products are reported. To satisfy the trade-off of cost and efficiency for commercial applications, commercially available piezo-ceramic ACU transducers were adopted, and a detection testbed was designed. Through-transmission mode was used in this testbed. The composite images were drawn using the C-scan technology to determine and detect existence and identify their specific types and locations in timber panels. The results showed that the testbed was capable of detecting and visualizing most of the defects in the sample timber panels within a short time.
2. Materials and Methods
Chinese fir panels were used as test specimens to examine the measurement technology in the through-transmission mode. Samples were 150 mm × 150 mm solid timber panels. The density of timber panels used was 450 kg/m
3. The wood equilibrium moisture content was approximately 10% at 50% relative air humidity and the test temperature was 25 °C. The sawn lumber was the plains-sawn lumber. To simplify the defection detection process, the sawn lumber was pre-sorted and free from shape defects (twist, bow, cup, etc.), rots, reaction (compression) wood, and slope of grain. Panels with a thickness from 10 mm to 40 mm with natural and artificial defects were used. Experiments indicated that the ACU method could not be used for defect detection in Chinese fir panels thicker than 40 mm because of the dramatically increased signal attenuation, making it impossible to distinguish between noise interference and useful signals indistinguishable.
Table 1 shows the testing parameters applied at the testbed. Chinese fir was selected because it is one of the most widely used building materials in China and many other Asian countries [
24]. However, defects, such as knots, wormholes, and cracks, are of great concern in engineering applications. The reference samples selected for this study had natural defects, such as knots and cracks. Wormholes and additional cracks were simulated using drilling. These defects were considered to explore the potential of ACU for the detection of different types of defects. Moreover, measurements on areas without defects were performed for comparison.
The adopted commercially available piezo-ceramic ACU transducers (NU200E, produced by Jinci Technology Ltd., Shenzhen, China) had a center resonance frequency of 200 kHz. The experimental setup is shown in
Figure 1. Firstly, a discrete sinusoidal signal (or an excitation signal modulated with a 13-bit Barker code) with a frequency of 200 kHz was produced by an output channel of the main controller. It was then processed by a 1st order passive RC high pass filter to remove DC signals. After passing a voltage following the circuit, the signal was amplified by a two-stage power amplifier circuit composed of two operational amplifiers (OPA455 for the first stage and OPA544 for the second stage) and related capacitors and resistors. At last, it was boosted to the voltage of 400 Vpp to excite the transmitter. The 200 kHz frequency was a trade-off between the resolution and the penetration depth. Experiments on the same testbed showed this frequency achieved optimal results.
The ultrasonic signal propagated into the sample. On its path, it passed through several boundaries (e.g., sample surface, air, and defects) with different acoustic impedances, where the wave was partly reflected with significant energy losses. The distance between the transducer and the receiver was set to 15 cm according to the experiments, while the wood panel was placed in the middle of it. After being transmitted through the sample, the signal was first received by the receiver.
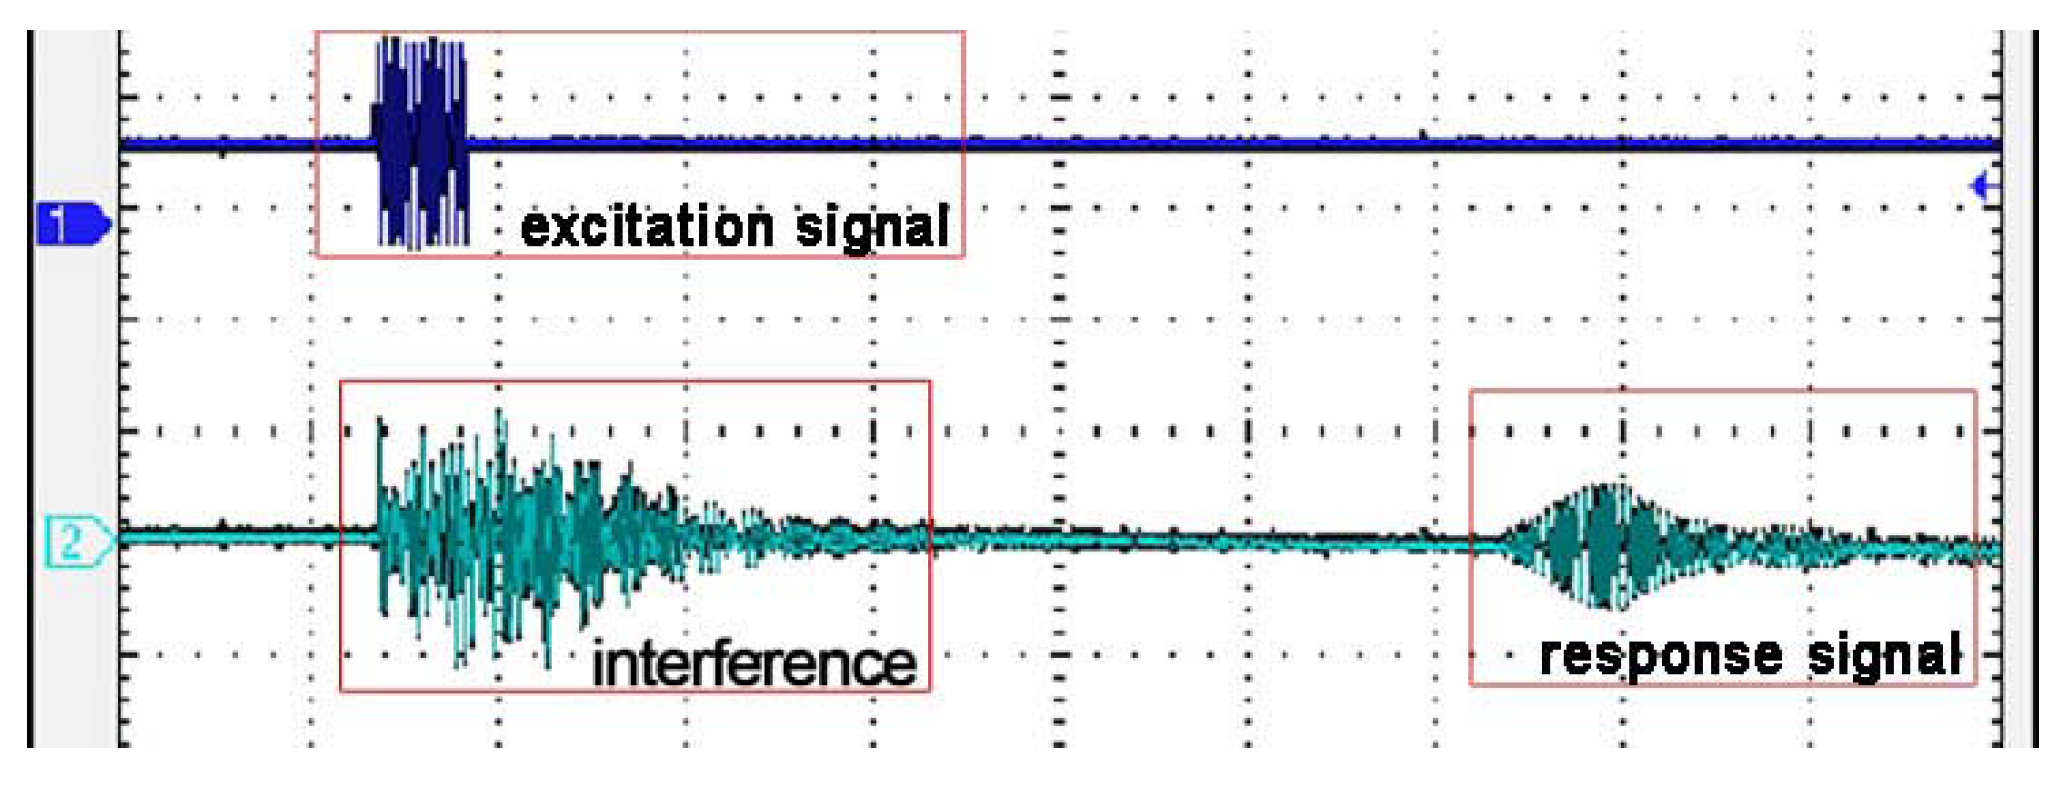
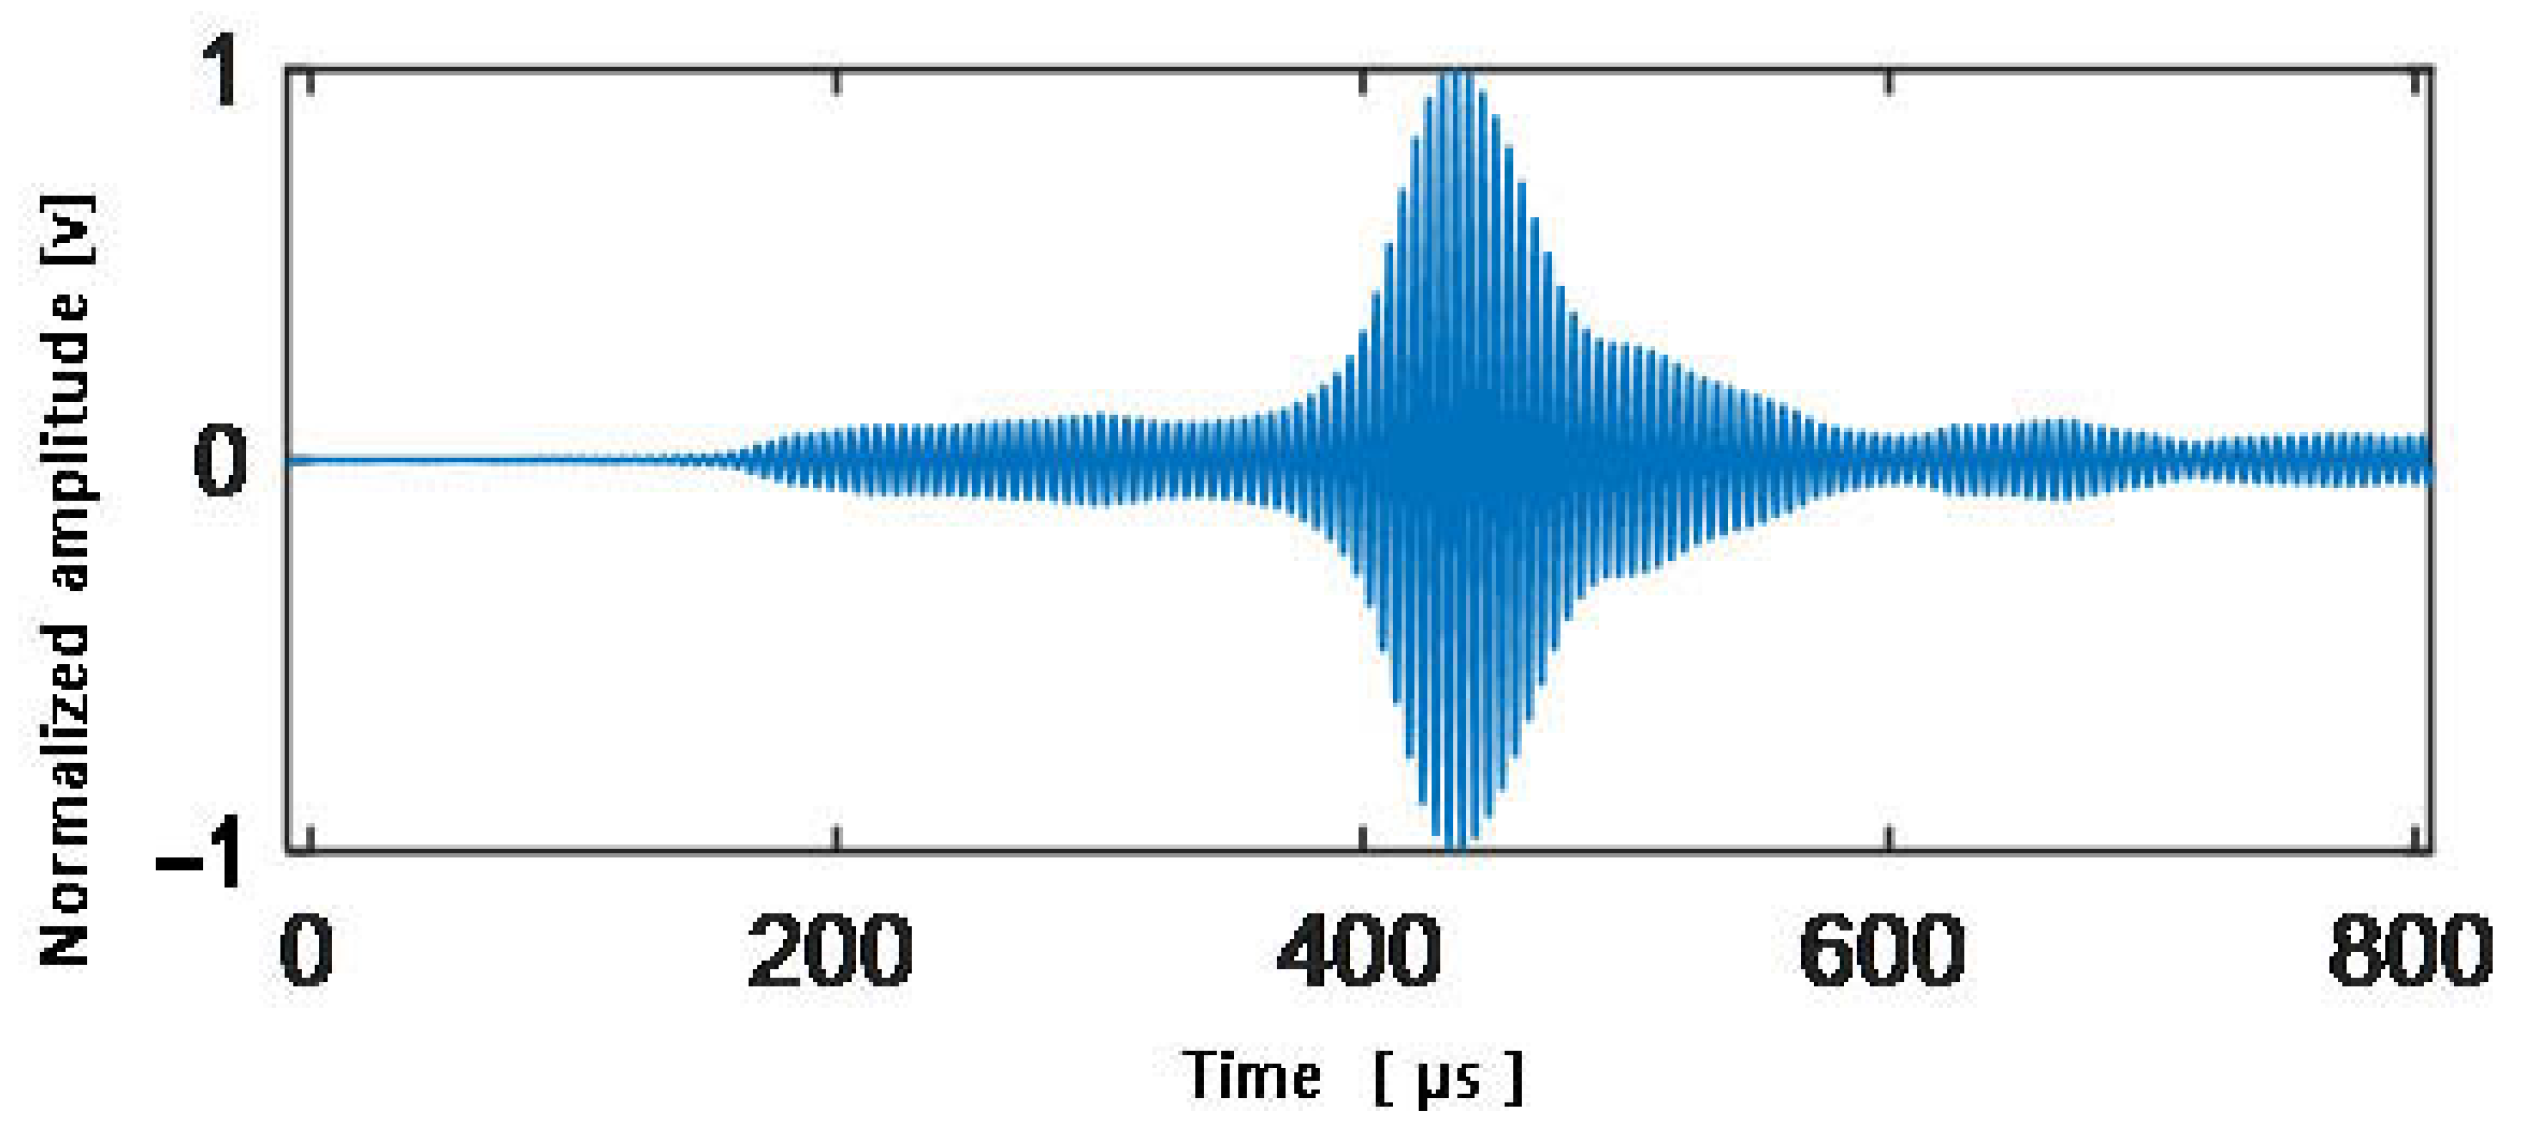
Figure 2 shows a received waveform. The first part of the signal received is the electromagnetic wave interference caused by the high voltage excitation and filtered in the signal processing process.
The signals received by the receiver were very weak, so a high-precision amplifier circuit composed of an instrumentation amplifier AD8421 was set to amplify the received signals. The AD8421 is a low-power, extremely low noise, low bias current, and high-speed instrumentation amplifier that is ideally suited for data acquisition applications. Then, the signal was processed by a band-pass filter with a frequency range between 190 kHz and 210 kHz and amplified by an in-house low-noise amplifier with a gain of 70 dB. According to the experiments, the differential amplifier circuit composed of instrumentation amplifier AD620 was used. The filter and amplifier designs were essential to the whole process since the signal captured by the receiver was very weak due to the reflection and attenuation. Finally, the post-processing was performed by the main controller of the system and sent to a PC for imaging if necessary.
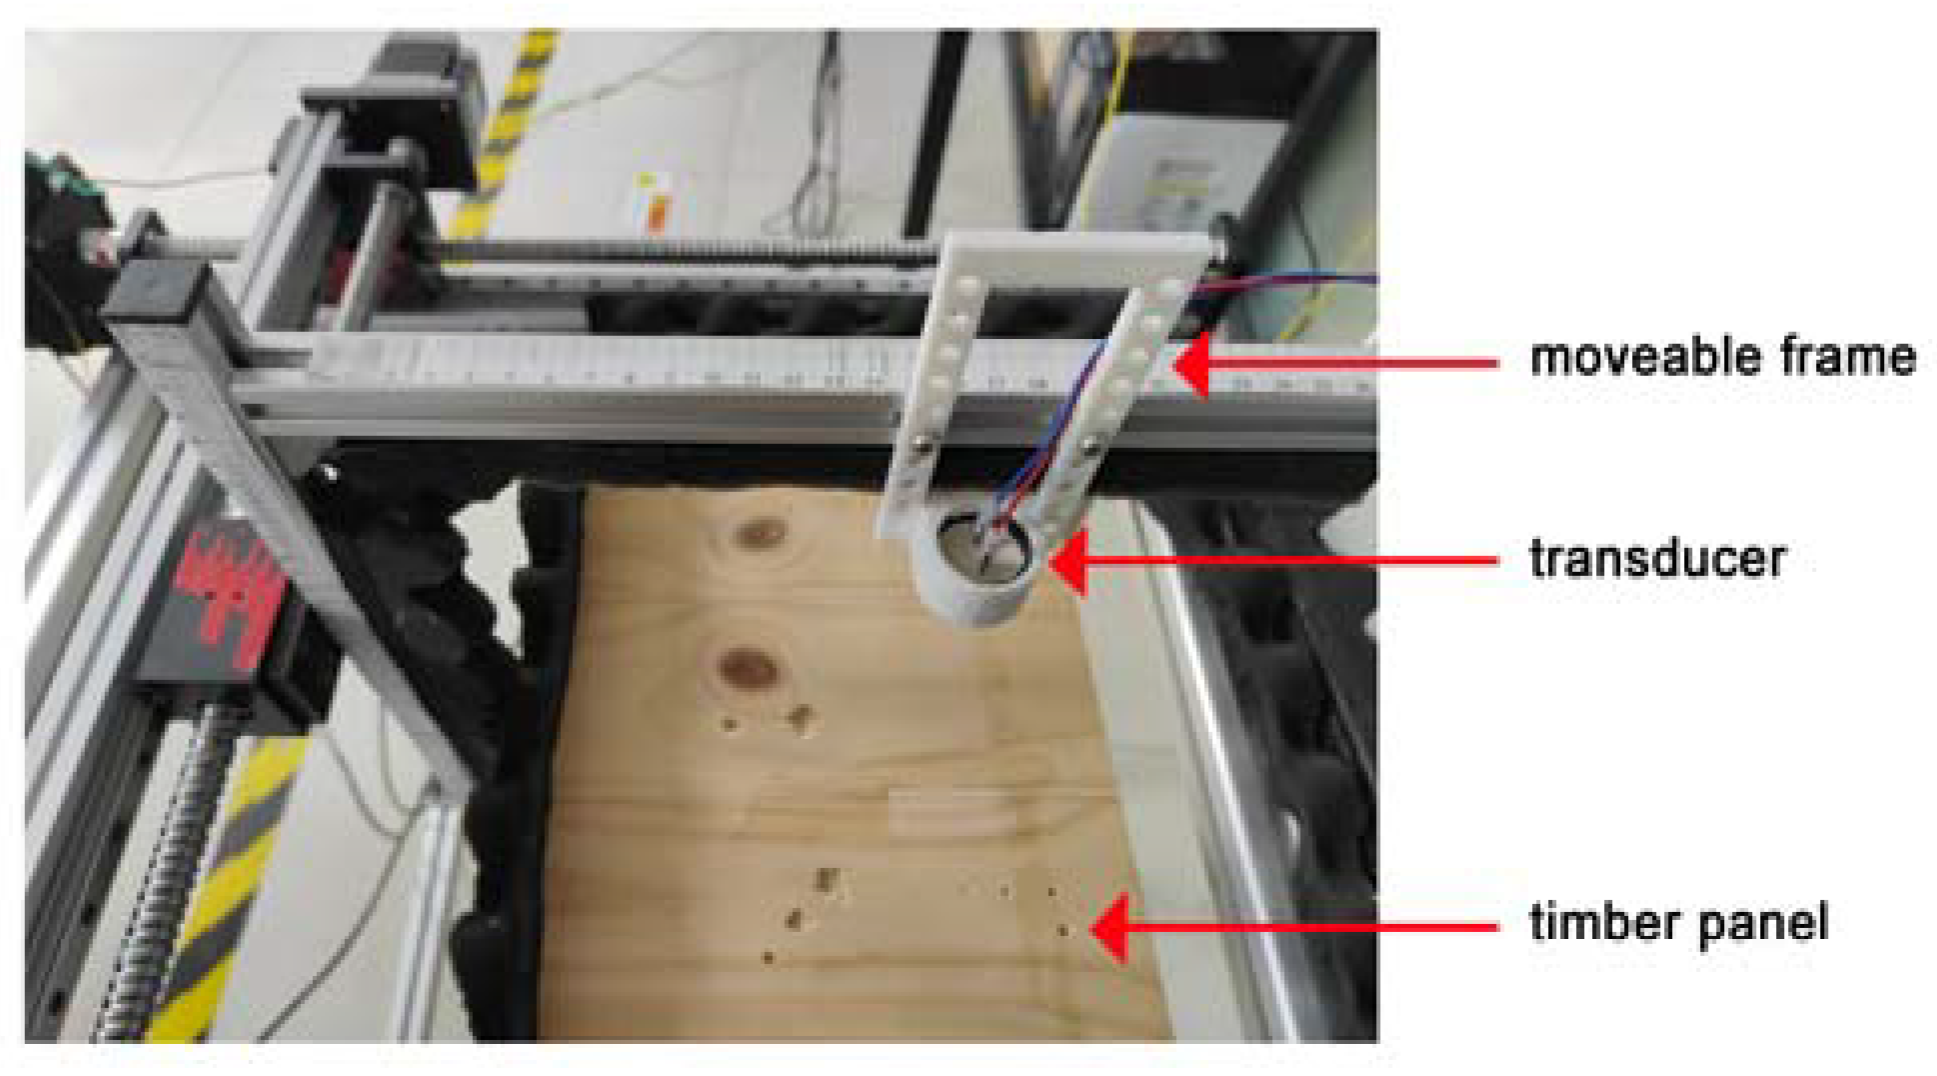
The scanning assembly was also driven by the main controller with fully automatic data acquisition and post-processing. During the scan, the transmitter and the receiver were clamped in a frame attached to a stepping motor driven over an XY-stage while the samples were held in a fixed position. The transmitter and the receiver moved together over the surface of the sample in a meandering pattern, while the main controller captured the signal amplitude and the TOFs of individual pulses with a peak detector and a time synchronizer. All the information was then sent to a PC and combined into composite images called C-scan and D-scan, respectively. In C-scan images, the received signal amplitude of each sample position was normalized and colored representing attenuation. In D-scan images, TOFs of each sample position were recorded and colored representing flight time. Experiments suggested that the orientation of the transducers should be perpendicular to the surface of the samples. A gap between the transmitter and the receiver of 150 mm was adopted based on past experiments. The samples were scanned radially/ tangentially to their surface. The adopted scan grid was 2 mm but it can vary depending on the resolution required.
Figure 3 shows the integrated measurement system. The receiver is fixed on the back of the frame.
The signals captured by the receiver were weak and vulnerable to interference because of the significant impedance mismatch between the air and solids. One way to improve the accuracy of detection is to apply pulse compression technology [
25,
26]. The successful application of pulse compression technology in radar and medical fields [
27] provided an effective reference for solving problems such as low signal-to-noise ratio (SNR) and poor defect detection accuracy in timber air-coupled ultrasonic testing area without increasing the instantaneous peak power of the transmitter. Barker coded method was a typical phase-coded pulse compression method [
28]. It was used in this application, since it required only a single transmission signal, making it easier to generate compared to other modulation methods.
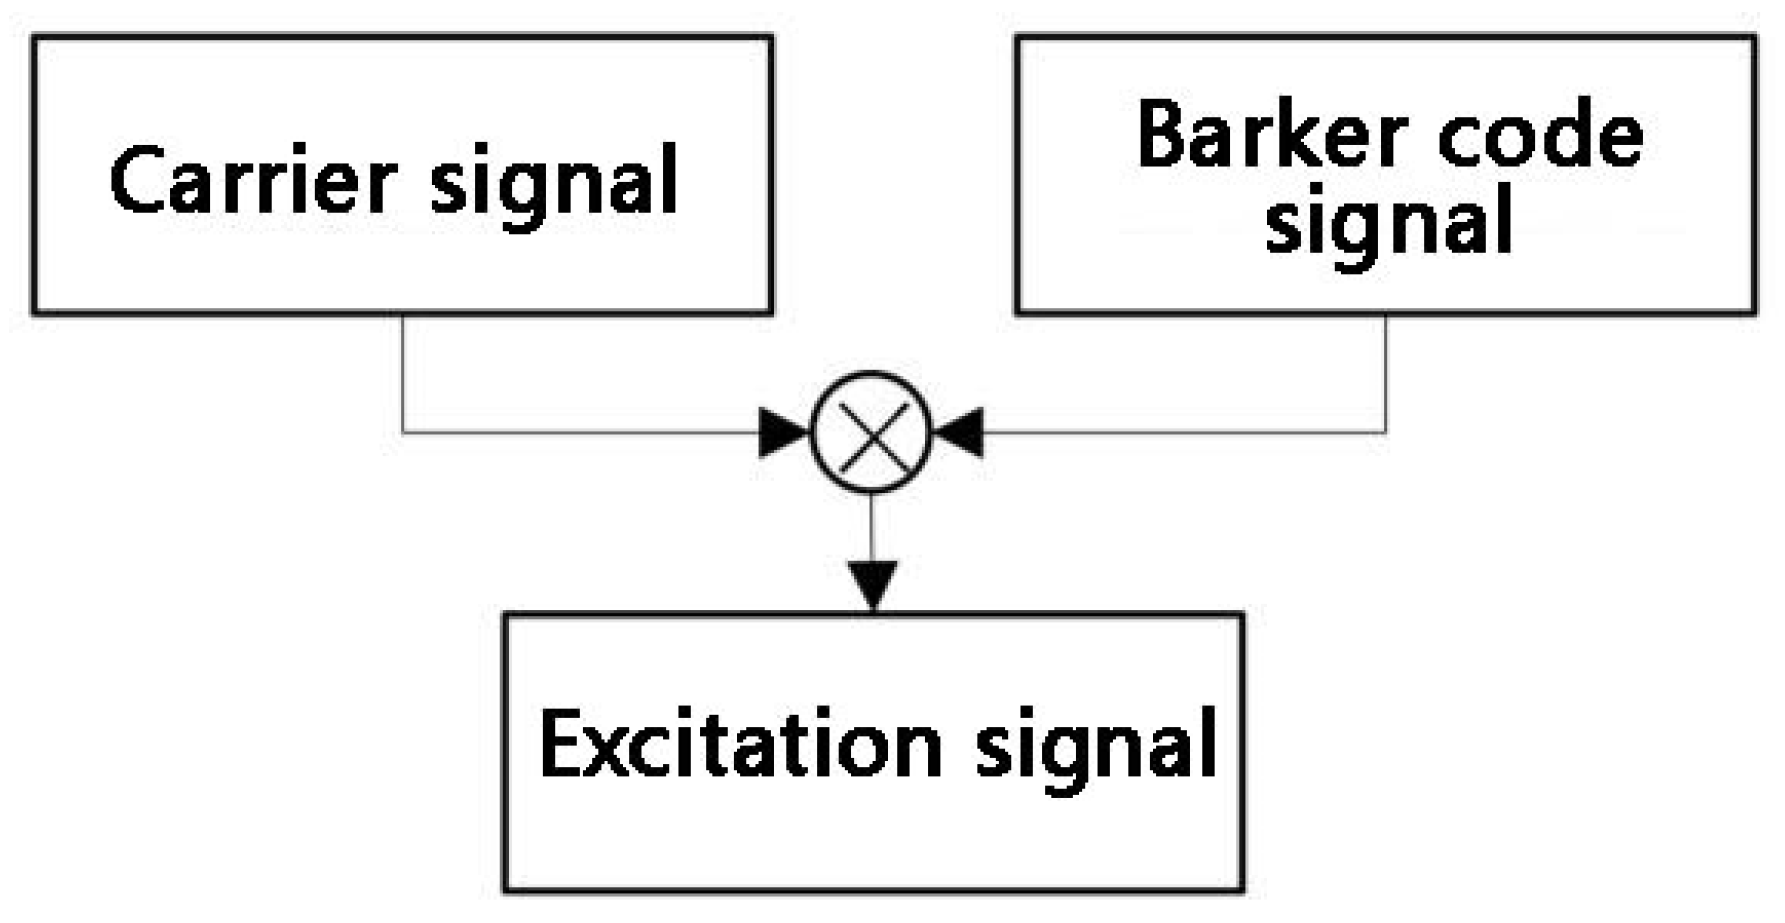
Barker code is a binary code group with values of only +1 and −1, and cannot be directly used as the excitation signal for ultrasonic transducers. It requires high-frequency carrier modulation to be used as the excitation signal for transducers. For example, taking the sine signal as a carrier signal, it is multiplied by the Barker code signal in the time domain as the excitation signal. The principle of its modulation process is shown in
Figure 4.
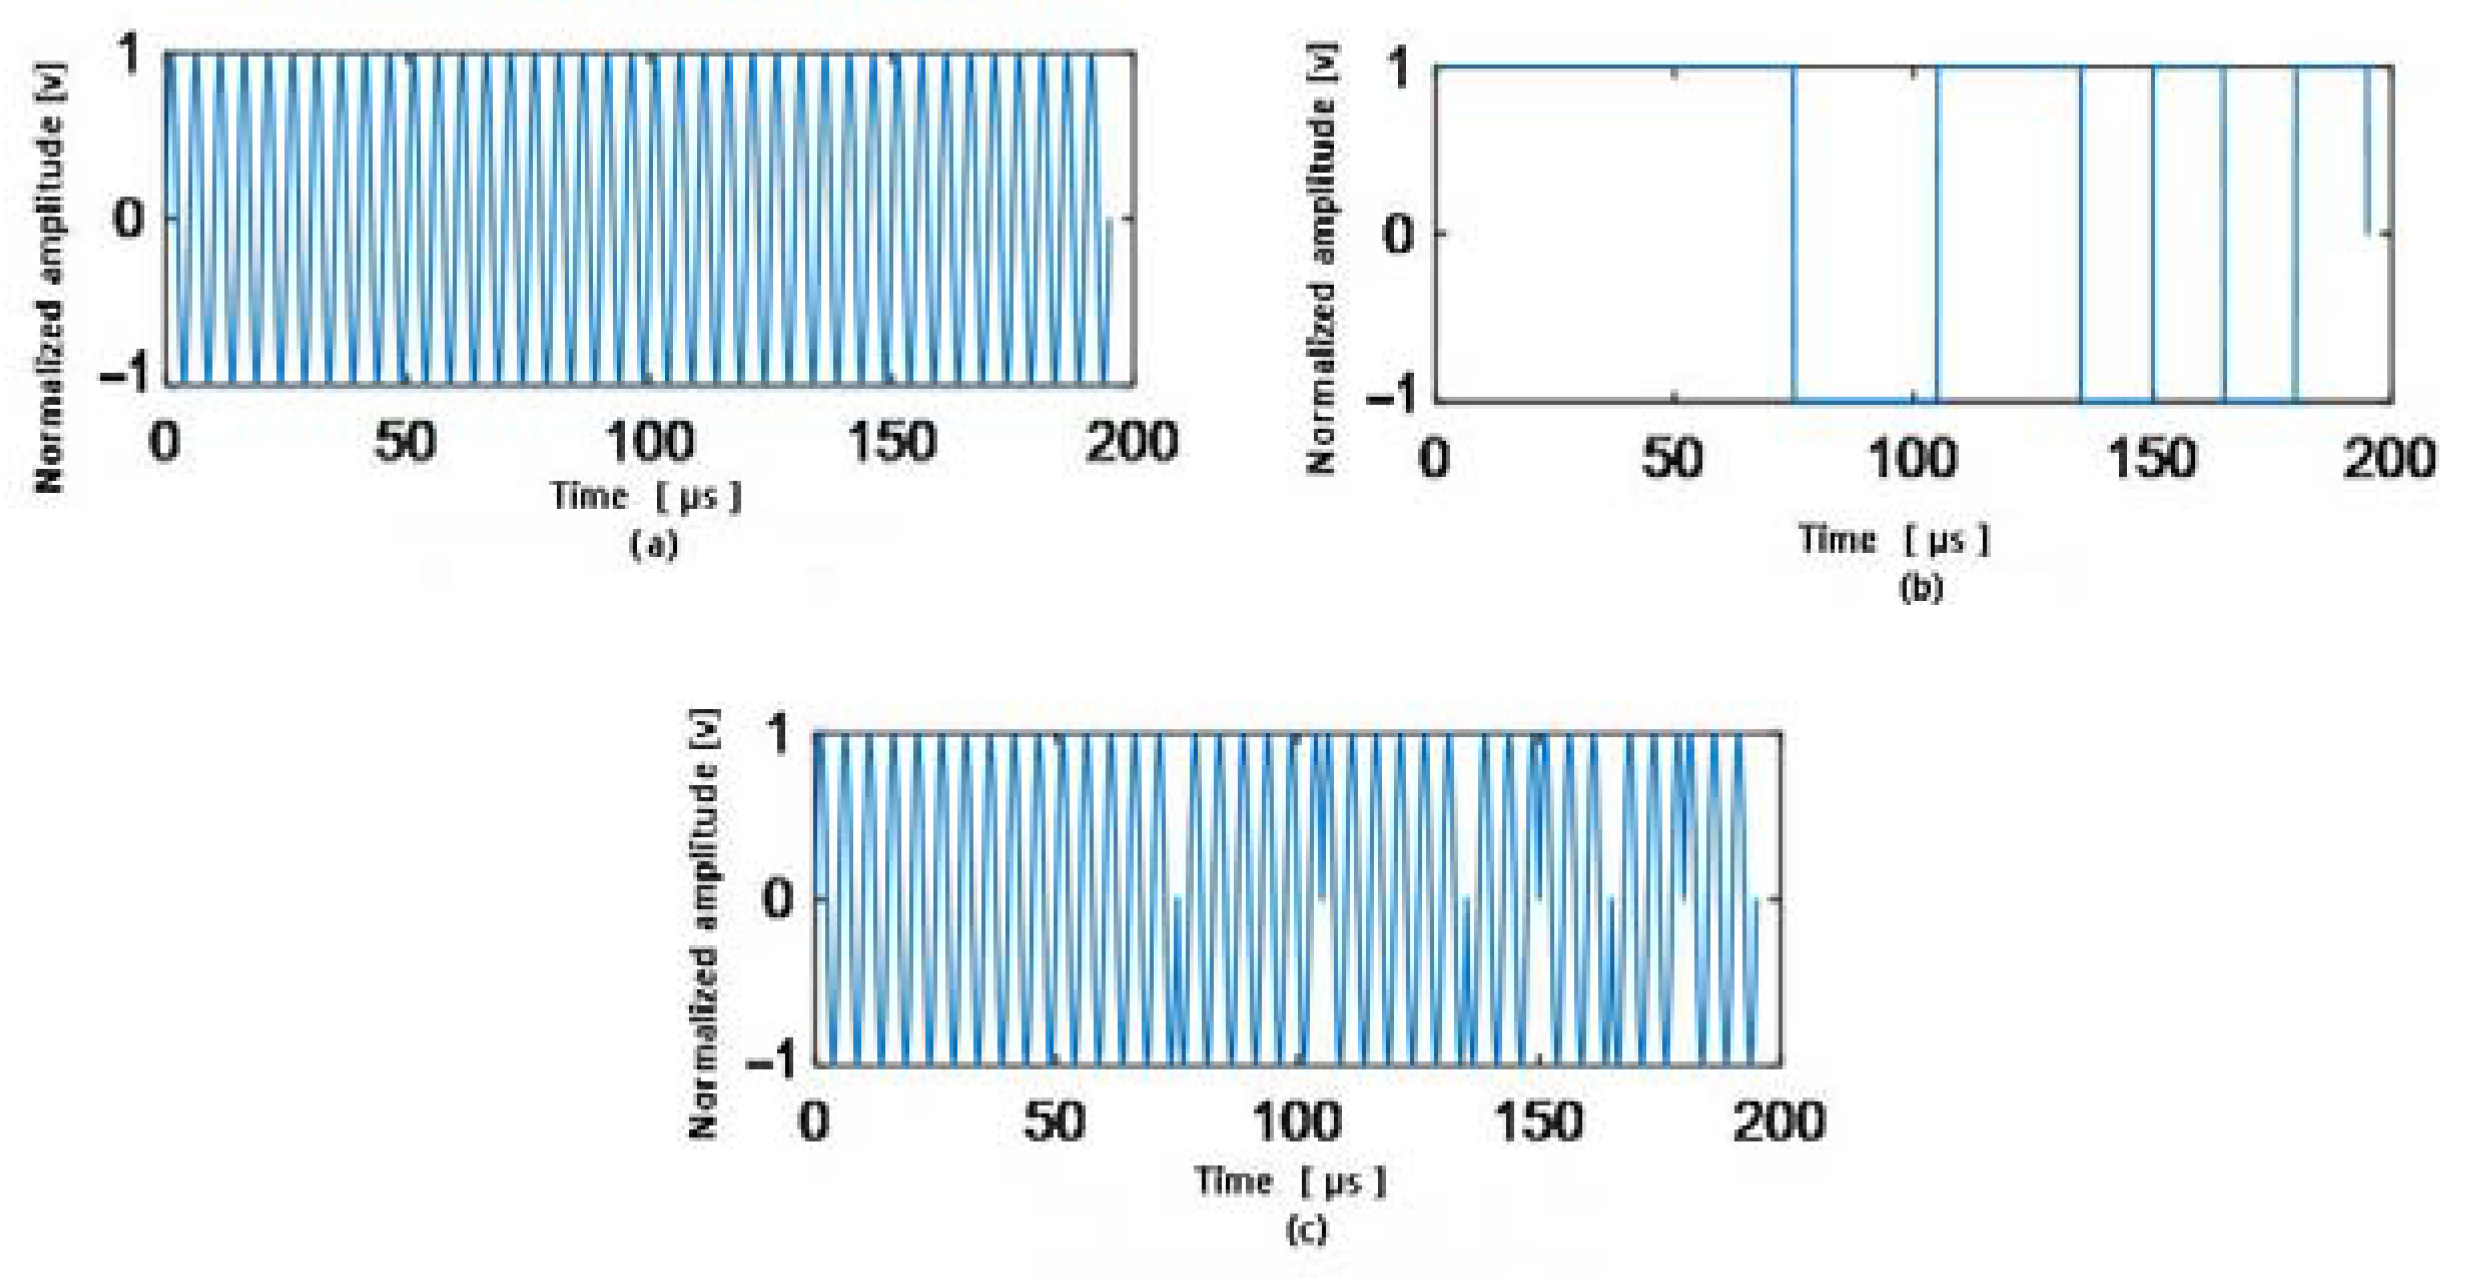
In this paper, 13-bit Barker code {+1, +1, +1, +1, +1, −1, −1, +1, +1, −1, +1, −1, +1} was used as a modulating signal for ultrasonic transducers because it had highest Peak Sidelobe Level (PSL) compared to other Barker codes.
Figure 5a showed a sinusoidal carrier signal, whose frequency was the resonant frequency of the transmitter. The Barker code signal is shown in
Figure 5b. Multiplying the Barker code signal with the carrier signal in the time domain yielded the modulated excitation signal as shown in
Figure 5c.
At the receiver end, the matched filter was used for pulse compression of the received signals. This process is the cross-correlation between received signals and excitation signals. The principle of its modulation process is shown in
Figure 6. In
Figure 6, the reference signal h(t) is the excitation signal from the transmitter, and the response signal s(t) is the captured signal from the receiver.
3. Results and Discussion
Knots, cracks, and wormhole-like defects were analyzed for their effects on air-coupled ultrasonic signal propagation in timber panels.
Figure 7 shows two typical defects. A 70 mm × 70 mm sample area shown in
Figure 7a contains a natural knot defect. A 70 mm × 70 mm sample area shown in
Figure 7b contains a natural crack in the middle of a knot. Compared to
Figure 7a, defect detection on
Figure 7b is more challenging since both crack and knot defects are fixed, making it difficult to distinguish.
Both sinusoidal signal and Barker-coded signal were used as excitation signals. In
Figure 8, sinusoidal signals were used as the excitation signals. The signals received by the receiver were filtered and then amplified as the response signal.
Figure 9 shows the filtered signals at the receiving end using the excitation signals shown in
Figure 5c. It presented a much higher SNR compared to the sine signals as excitation signals shown in
Figure 8, making capturing the main lobe peak voltage easier.
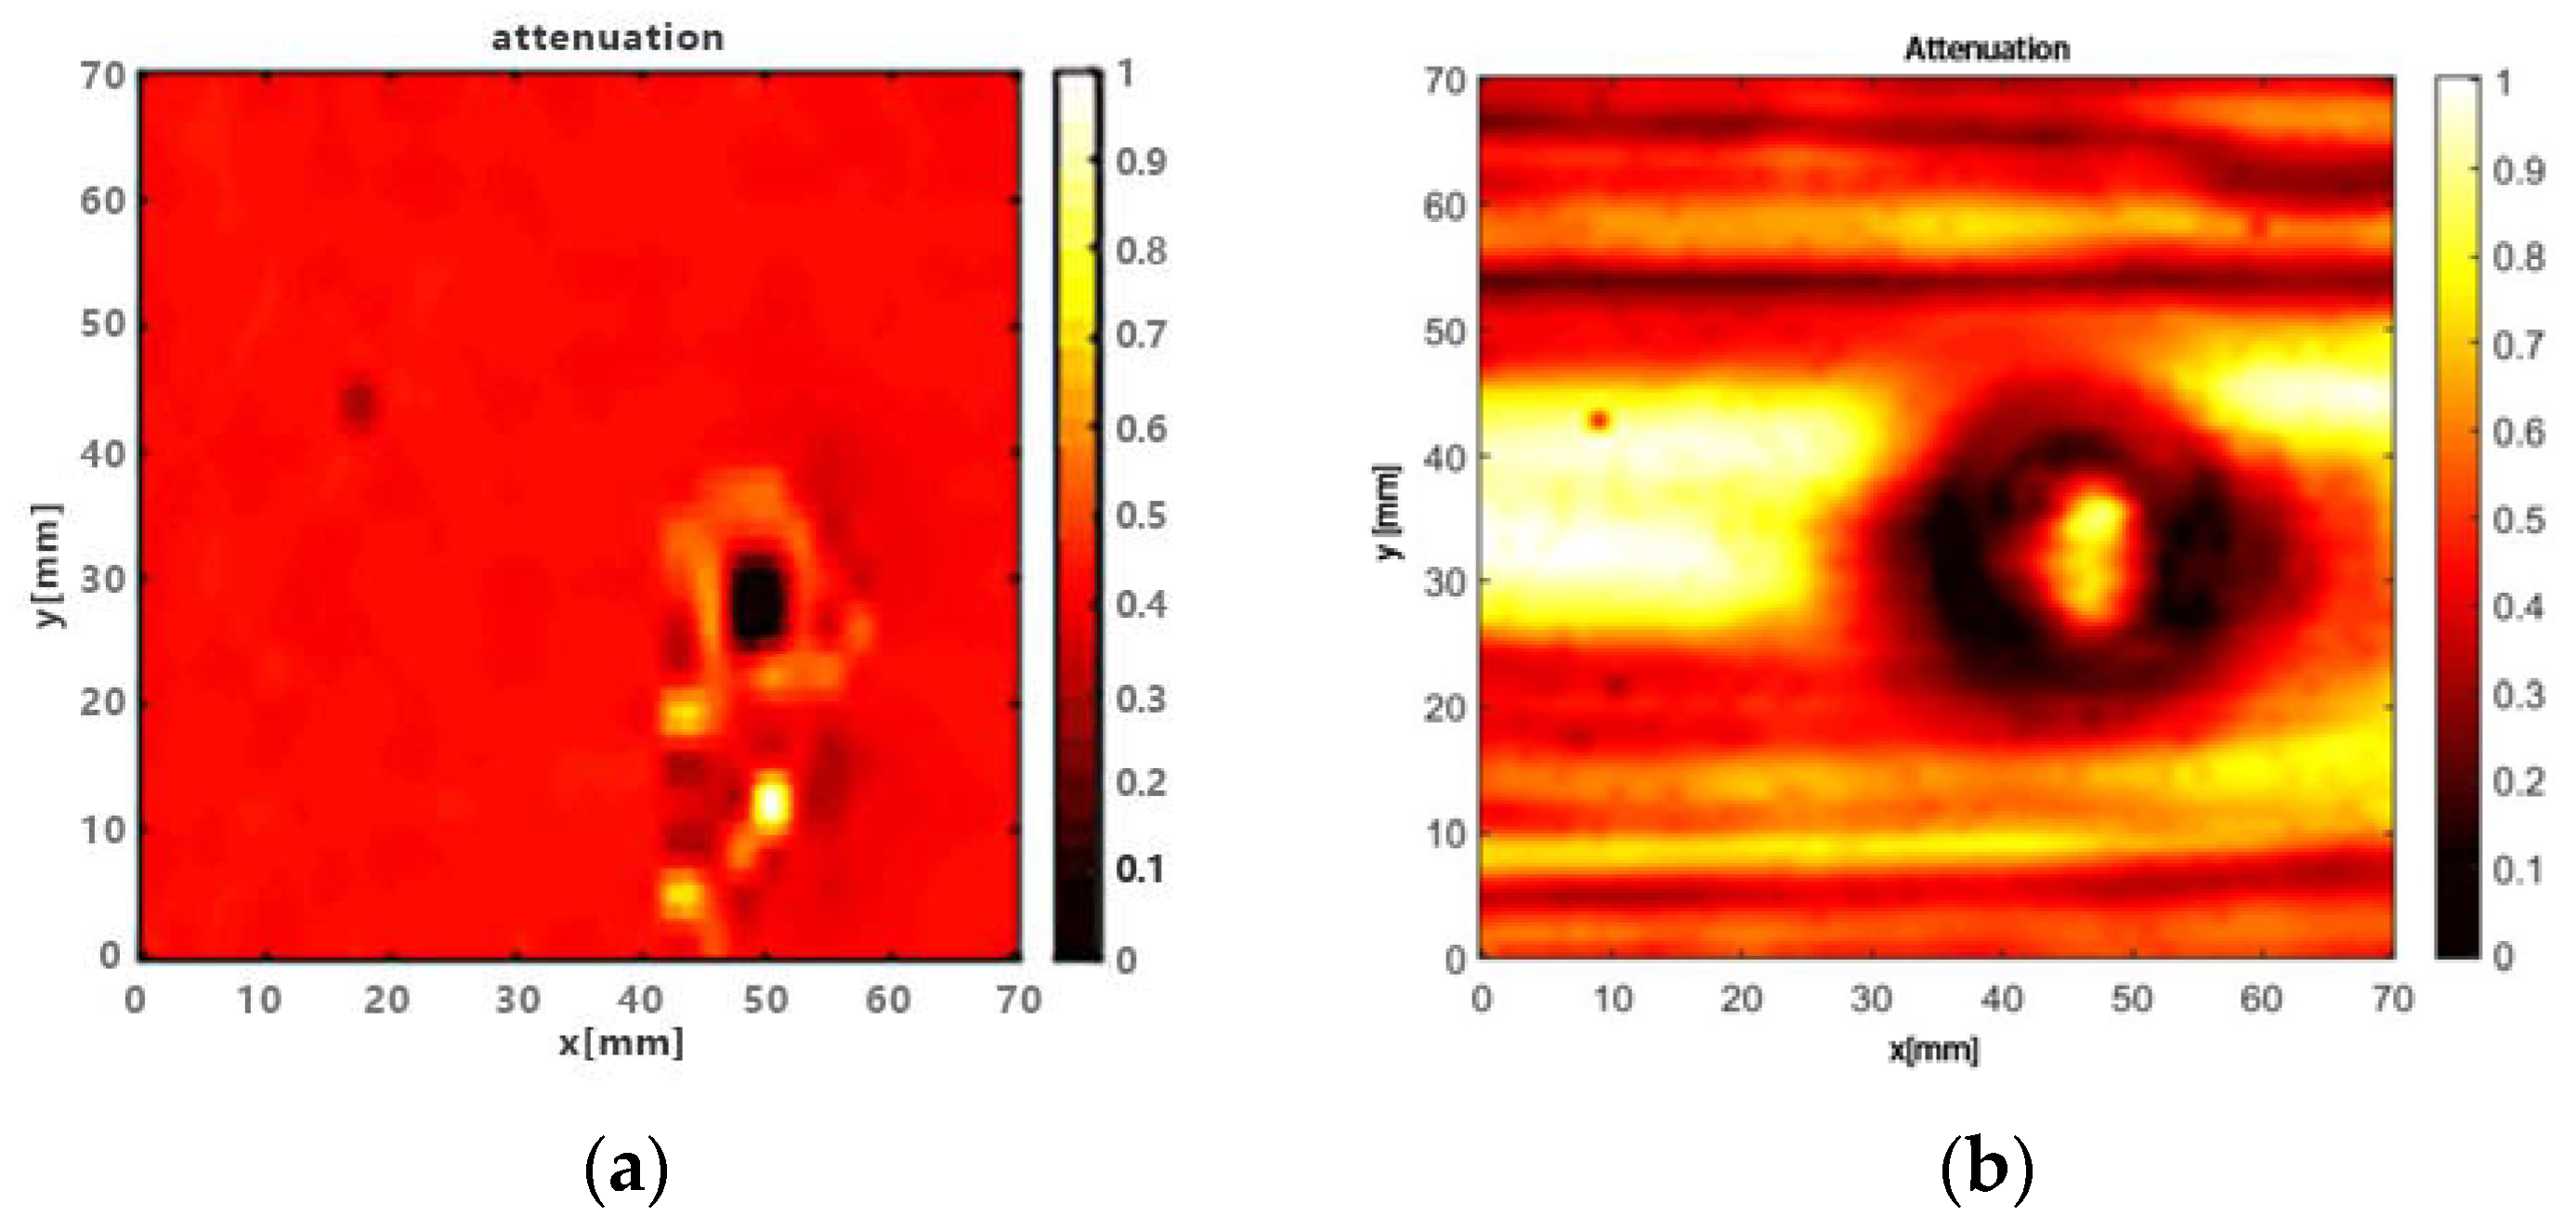
The amplitude (C-scan) images of the sample shown in
Figure 7 using two different excitation signals are presented in
Figure 10, the received signal amplitudes are normalized and colored to represent the attenuation. Comparing
Figure 10a to
Figure 10b, it is demonstrated both methods are reliable inspection for knot detection. However, the size of the knot in
Figure 10a is much less than the actual size of this defect due to the limited precision of the system and noise interference. The image size of
Figure 10b matches the actual size. Furthermore, the result shown in
Figure 10a demonstrates no detection ability when combined defects occur. The result shown in
Figure 10b, on the contrary, demonstrates a much higher resolution to distinguish combined defects due to different colors at the edge of both defects. It is proved that applying the Barker code method can improve the measurement accuracy compared to taking a sinusoidal signal as an excitation signal. Thus in this paper, Barker code pulse compression technology was used for all the other scenarios.
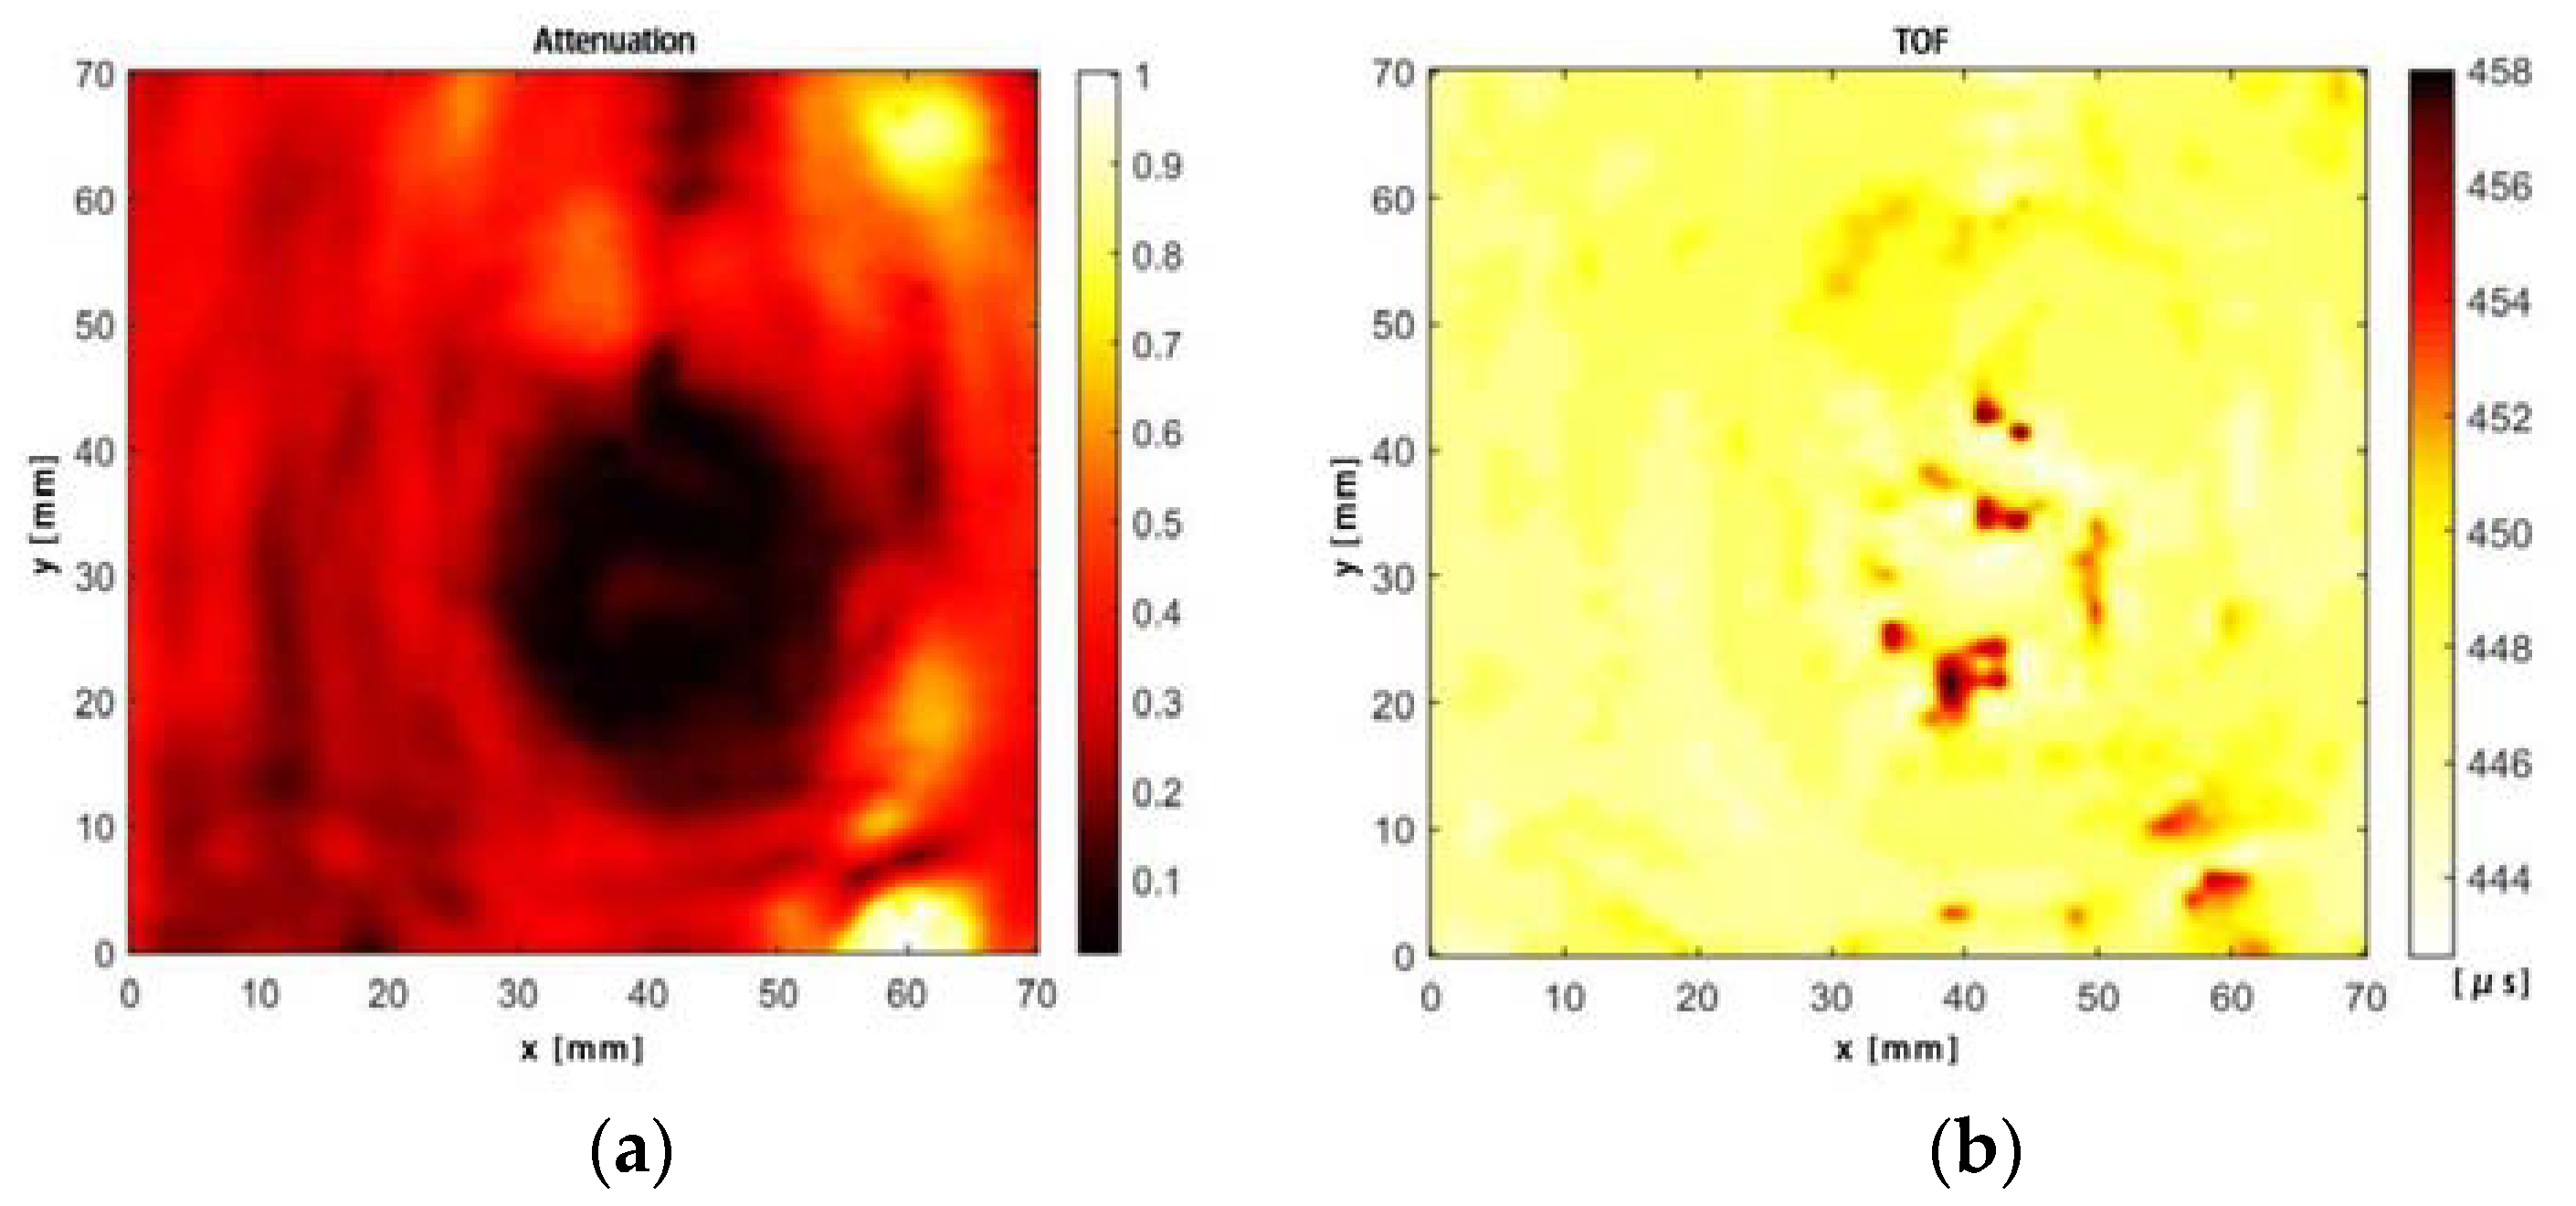
A 70 mm × 70 mm sample area shown in
Figure 7a contains a natural knot defect with a diameter of 22 mm. The amplitude (C-scan) image is presented in
Figure 11a and the TOF (D-scan) image in
Figure 11b, respectively. Comparing
Figure 7a to
Figure 11a, the imaging result (
Figure 11a) was essentially consistent with the actual defect size (
Figure 7a). However,
Figure 11b shows that the TOF method did not perform as well as the amplitude method. It is probably because the attenuation differences were amplified by the amplifiers at the receiving end, while TOF is not sensitive to knot defects, making it much harder to distinguish from normal areas. It is thus demonstrated that the ACU method is a reliable inspection for knot detection. However, the diameter of the knot in
Figure 11a is 24 mm, which is 2 mm larger than the actual size. The error was mainly because of the following reasons:
The main cause of errors was the limited specifications of the adopted typical commercially available piezo-ceramic transducers, which were selected to reduce cost. To improve detection accuracy, advanced transducers, such as those made of cellular polypropylene, could be used which are more powerful and have smaller scattering angles.
Timber properties. Because wood grows naturally, the features of wood such as grain orientation and annual rings, lead to anisotropy and heterogeneity even in areas without defects.
Insufficient localization accuracy of the stepping motor could also influence the results.
A 70 mm × 70 mm sample area shown in
Figure 7b contains a natural crack in the middle of a knot. The amplitude (C-scan) image is presented in
Figure 10b and the TOF (D-scan) image in
Figure 12, respectively. Comparing
Figure 7b to
Figure 10b and
Figure 12, both imaging results (C-scan and D-scan results) are essentially consistent with the actual combined defects. It is thus demonstrated that the ACU method is a reliable tool for detecting combined defects. However, as the defect shown in
Figure 7b consists of both a crack and a knot,
Figure 10b demonstrates that the C-scan method works well for such combined defects. Moreover, the diameter of the knot and the length of the crack detected in
Figure 10b, are equal to the actual diameters and length in
Figure 7b. It is clear that both the amplitude and the TOF methods can detect the combined defects, including their size and location. However, as seen in
Figure 12, it is difficult to distinguish the knots and the cracks if the TOF is used. Comparing
Figure 7,
Figure 11 and
Figure 12, it is concluded that the C-scan method demonstrates better performance than the D-scan method when knot and crack defects need to be evaluated since imaging results of C-scan perform more accurate size information and higher resolution when combined defects need to be distinguished.
To further explore the potential of the ACU for NDT of timber products, artificial wormhole-like defects were simulated by drilling holes.
Figure 13 shows a C-scan image of drilled holes with different diameters. Again, it is demonstrated that the ACU method is a reliable inspection tool for wormhole defect detection. However, it is also concluded that defects smaller than 3 mm in diameter (area B) may not be detected due to the limited precision of the system and noise interference.
Comparing
Figure 11,
Figure 12 and
Figure 13, it is easy to distinguish knots from the other two types of defects because of the large attenuation of the wave amplitude. However, distinguishing between cracks and wormholes using attenuation characteristics is more challenging. Nevertheless, it is expected to be able to identify them with the help of pattern recognition methods (e.g., support vector machine), since cracks and wormholes usually have obvious shape differences [
8]. Pattern recognition methods may also help to differentiate areas with defects from those without defects.
Due to the non-contact nature of the ACU method, the measuring process is more efficient and does not contaminate the samples or scratch the surface of the samples, especially in the continuous manufacturing process, which is critical for successful industrial applications.
4. Conclusions
It has been demonstrated that the ACU method is a powerful tool for automated defect detection in solid timber panels. The most challenging problem is that the signal captured by the receiver is very weak because of the significant impedance mismatch between the air and solids. Applying phase-coded pulse compression technology is a promising method to improve measurement accuracy without increasing the instantaneous peak power of the transmitter. So far, measurements in the proposed testbed are limited to samples not thicker than 40 mm, because signal attenuation increases dramatically for thicker samples, making it impossible to distinguish between noise interference and actual signals. In future research, thicker samples should be examined, applying more sensitive and powerful transducers and more precise signal processing circuits. Furthermore, samples used in this paper were solid timber panels made of Chinese fir, with a density of 450 kg/m3. In future work, experiments should focus on timber panels made with other materials, since density is a key parameter for ACU methods. Nevertheless, common defects, such as knots, cracks, and wormholes, can be detected, together with their size and location. Thanks to its non-contact nature, the measuring process of the ACU method is more efficient than the conventional contact methods. Moreover, using the composite images (called C-scan and D-scan), combined with the pattern recognition technology, it may be possible to identify the types of defects.
Since the ACU methods allow for regular, fast reliable, and comprehensive inspections, the possibility to detect defects in timber and engineered wood products may improve the quality of the products and reduce the costs of their production and maintenance. The ACU technology can help to perform timber product quality inspection and maintenance.


