1. Introduction
In recent decades, rapid technological progress has significantly increased the consumption of natural resources, leading to a decline in high-quality ore reserves. This poses a serious threat to essential materials required in today’s society. Recycling emerges as a crucial remedy, reinstating materials into supply chains while alleviating environmental and social impacts. Industrial and urban wastes are gaining attention due to their higher concentrations of valuable metals compared to natural sources [
1]. “Urban mining,” the retrieval of raw materials from discarded items, is on the rise. Over 40% of the EU’s copper demand is fulfilled through recycling, a testament to Directive 2012/19/EU’s objectives for electrical goods. Waste electrical and electronic equipment (WEEE) represents a swiftly expanding waste stream [
2].
The annual production of WEEE surpasses 40 million tons [
3], with a projected yearly volume increase of 3–5%, which is three times faster than the growth of municipal waste [
4]. Printed circuit boards (PCBs) and lithium-ion batteries (LIBs) within WEEE are notable for their valuable metals. PCBs consist of a copper-clad laminate with 40% metals, 30% organic materials, and 30% ceramics. Copper, constituting 34.5% of this composition, remains in high demand due to its diverse applications in electronics, vehicles, and power generation [
5]. Although the consumption of copper reached 23.5 million tons in 2017, mine production lags behind at 20 million tons, with China being the largest consumer [
6]. Current methods employed for metal recovery from PCBs and LIBs have limitations. Pyrometallurgical techniques, being energy-intensive and expensive, contrast with hydrometallurgical processes involving hazardous chemicals and high costs [
7]. Bio-hydrometallurgical processes show promise for metal recovery from ores and WEEE, proving effective and eco-friendly [
8,
9,
10,
11]. The mechanisms of the bioleaching processes have been widely studied in the recovery of metals from minerals, whereas it has been relatively less studied in the recovery of WEEEs.
Current research in bioleaching emphasizes the use of microorganisms for a more environmentally sustainable approach to metal extraction. Our research is based on the profitable recovery of metals from end-of-life mobile phones through an automated bioleaching process. Key objectives include refining pre-treatment procedures, improving leaching agents, and perfecting metal recovery techniques. Our ongoing aim is to integrate these stages into a continuous and optimized process, primed for potential industrial application. You can find an illustrative example of our research in [
12]. Bioprocesses are sensitive to operational parameters such as temperature or pH and the monitoring of these parameters and the control can become crucial for the optimal operation of the plants. Before industrial deployment, operation at bench plant scale contributes to the better knowledge of the systems to define control strategies for steady long-term operations. In the case of biological processes, the disturbances can mean an irretrievable loss of biological activity and the definitive failure of the operation. In this context, the requirement to develop new tools for monitoring and controlling bioprocesses plays a vital role and a reliable and safe operation. The objective of the bioleaching process is to recover copper from electronic components using oxidizing bacteria. The basis of the process is the biological recovery of the leaching agent where the biomass oxidizes Fe(II) to Fe(III)at controlled conditions of pH and dissolved oxygen concentration in fixed bed reactors. Subsequently, the biogenic Fe(III) solution is put in contact with e-waste, minimizing mass transport limitations through an optimal contact in an irrigated column. The e-waste has previously been processed in fractions, balancing energy and time consumption with added value in terms of efficiency. The resulting solutions of metals, in the last stage, are recovered selectively and the leaching agent (Fe(II)) is regenerated biologically in a cyclic process (see
Figure 1).
To regulate and enhance the bioleaching process, we introduce a system specifically designed for real-time monitoring of the bioleaching plant. This system is tailored to optimize and precisely control various stages within the bioleaching procedure. It addresses the specific needs of laboratory technicians by providing a digital solution within the plant’s infrastructure. This system facilitates decision-making and bolsters control capabilities, focusing on secure access, real-time data monitoring, proactive event management, and effective data visualization. Ultimately, it significantly enhances plant performance, safety, and efficiency.
The system architecture integrates smart sensors with the Arduino microcontroller to establish a wireless sensor network via Raspberry Pi 4 model B (Raspberry Pi Ltd., Cambridge, UK). Key software tools employed in its development encompass Arduino IDE 1.8.16, LabWindows/CVI 2020, Matlab R2023b, and Visual Studio 17.8. To the best of our knowledge, this is the first time that a bioleaching system manages collected data using a cloud-based Big Data System (BDSs), continuously analyzing information from various sources such as electrochemical and optical sensors, pumps, electrical motors, actuators, solenoid valves, and alarm setpoints. A new Android mobile app, which is connected to the cloud, has been created specifically to process real-time data from integrated hardware involved in the bioleaching process. This app facilitates the activation of different actuators (e.g., pumps, solenoid valves, motors) aimed at integrating this technology into industrial processes for long-term stability through automated decision-making.
The specific objectives of this proposed solution encompass several key aspects:
Enhanced Control Management: Developing a digital solution for precise control over chemical plant operations, with a focus on managing actuators, secure data storage, event notifications, and user management for specific administrators.
User-Centric Secure Access: Constructing a user-friendly API for secure access to plant management functions through user accounts, offering enhanced control capabilities for administrators.
Informed Decision Making: Implementing a real-time monitoring system to capture diverse data formats (e.g., pH, temperature, redox sensor values) to facilitate informed decisions about plant performance and process status.
Proactive Event Management: Creating a system to proactively identify and respond to potential emergencies in the plant, ensuring safe and efficient chemical process operations.
Comprehensive Visualization: Providing users with critical parameter visualizations for each station, such as pH, redox, temperature, and tank levels, along with graphical trends for improved oversight.
Data Accessibility: Enabling the easy downloading and sharing of information in readable formats to encourage collaboration and enhance data accessibility.
1.1. State of the Art
Monitoring chemical plants plays a crucial role in ensuring safety, compliance, efficiency, and environmental responsibility. It aids in early detection of potential hazards, enabling proactive actions to prevent accidents [
13]. Compliance with safety regulations, environmental standards, and product quality requirements is facilitated through monitoring, with data essential for compliance reporting [
14]. Monitoring further contributes to cost-effective process optimization by identifying inefficiencies, thereby enhancing production efficiency and product quality [
15]. Predictive maintenance techniques, including vibration analysis and machine learning, reduce equipment downtime and extend equipment lifespan [
16]. Monitoring in the context of environmental impact is crucial for compliance with regulations and reducing harm to communities and ecosystems. The European Commission’s 2022 report highlights the need for regional cooperation in sustainable chemical value chains and the use of digital technologies in eco-friendly manufacturing. Europe’s chemical industry regulations emphasize the importance of implementing best practices and efficient environmental management systems [
17].
Currently, there are no specialized open-source software platforms exclusively designed for monitoring bioleaching plants. However, open-source SCADA (Supervisory Control and Data Acquisition) systems and data acquisition platforms can be adapted and customized to monitor and control various industrial processes, including bioleaching plants. Companies such as Maccion [
18] provide tailored solutions, encompassing integration, development, and consulting services to enhance factory performance through sensor and network utilization. Specializing in custom mobile applications across various sectors, including industrial automation, ABAMobile [
19] addresses evolving needs. While certain local applications, like WTRtec App [
20], offer specific monitoring capabilities, there is no universal solution due to project-specific requirements. Analyzing existing open-source options reveals certain limitations. Grafana [
21] offers real-time monitoring and data visualization for chemical processes but lacks built-in alerting features, with advanced functionalities reserved for the paid Grafana Enterprise version, potentially impacting budgets. InfluxDB [
22] serves as a time-series database for data retrieval but lacks support for traditional SQL-style joins and requires the paid InfluxDB Enterprise edition for advanced features. FreeSCADA [
23] provides real-time monitoring but may offer a more limited feature set compared to commercial SCADA software (version 5.5.9). OpenHAB [
24] is an adaptable home automation platform for industrial use but may have a less user-friendly interface than commercial alternatives. Lastly, Blynk [
25] is an open-source IIoT platform for creating custom monitoring apps but may require a subscription for expanded functionality and device connections, potentially affecting costs.
Our review of existing systems has revealed significant issues, including complex system designs, excessive reliance on numerous tools and components, installation challenges, and features restricted to paid versions, highlighting a clear need for real-time data storage in bioleaching processes. In practical terms, our research has introduced an open-source solution for bioleaching systems, characterized by scalability and ease of replication. The design configuration relies entirely on open-source software, enabling the effective monitoring of the bioleaching plant. This capacity allows for the detection of crucial alerts, including checks for bioreactor faults, leaching faults, and copper recovery faults. Furthermore, it offers remote control over plant pumps and real-time alerts for registered users.
2. Materials and Methods
In this section, we will offer a high-level overview of the bioleaching process hardware, encompassing its stages and essential components. Our subsequent focus will turn to the software technological elements that serve as the cornerstone of the developed IIoT system.
2.1. The Physical Plant
The bioleaching plant is divided into five distinct stations, each with a clearly defined purpose: Bioreactor, Tank 1, Leaching, Tank 2, and Copper Recovery System. Here, you will find an in-depth overview of each station, including a detailed list of the essential pumps and sensors required for their operation.
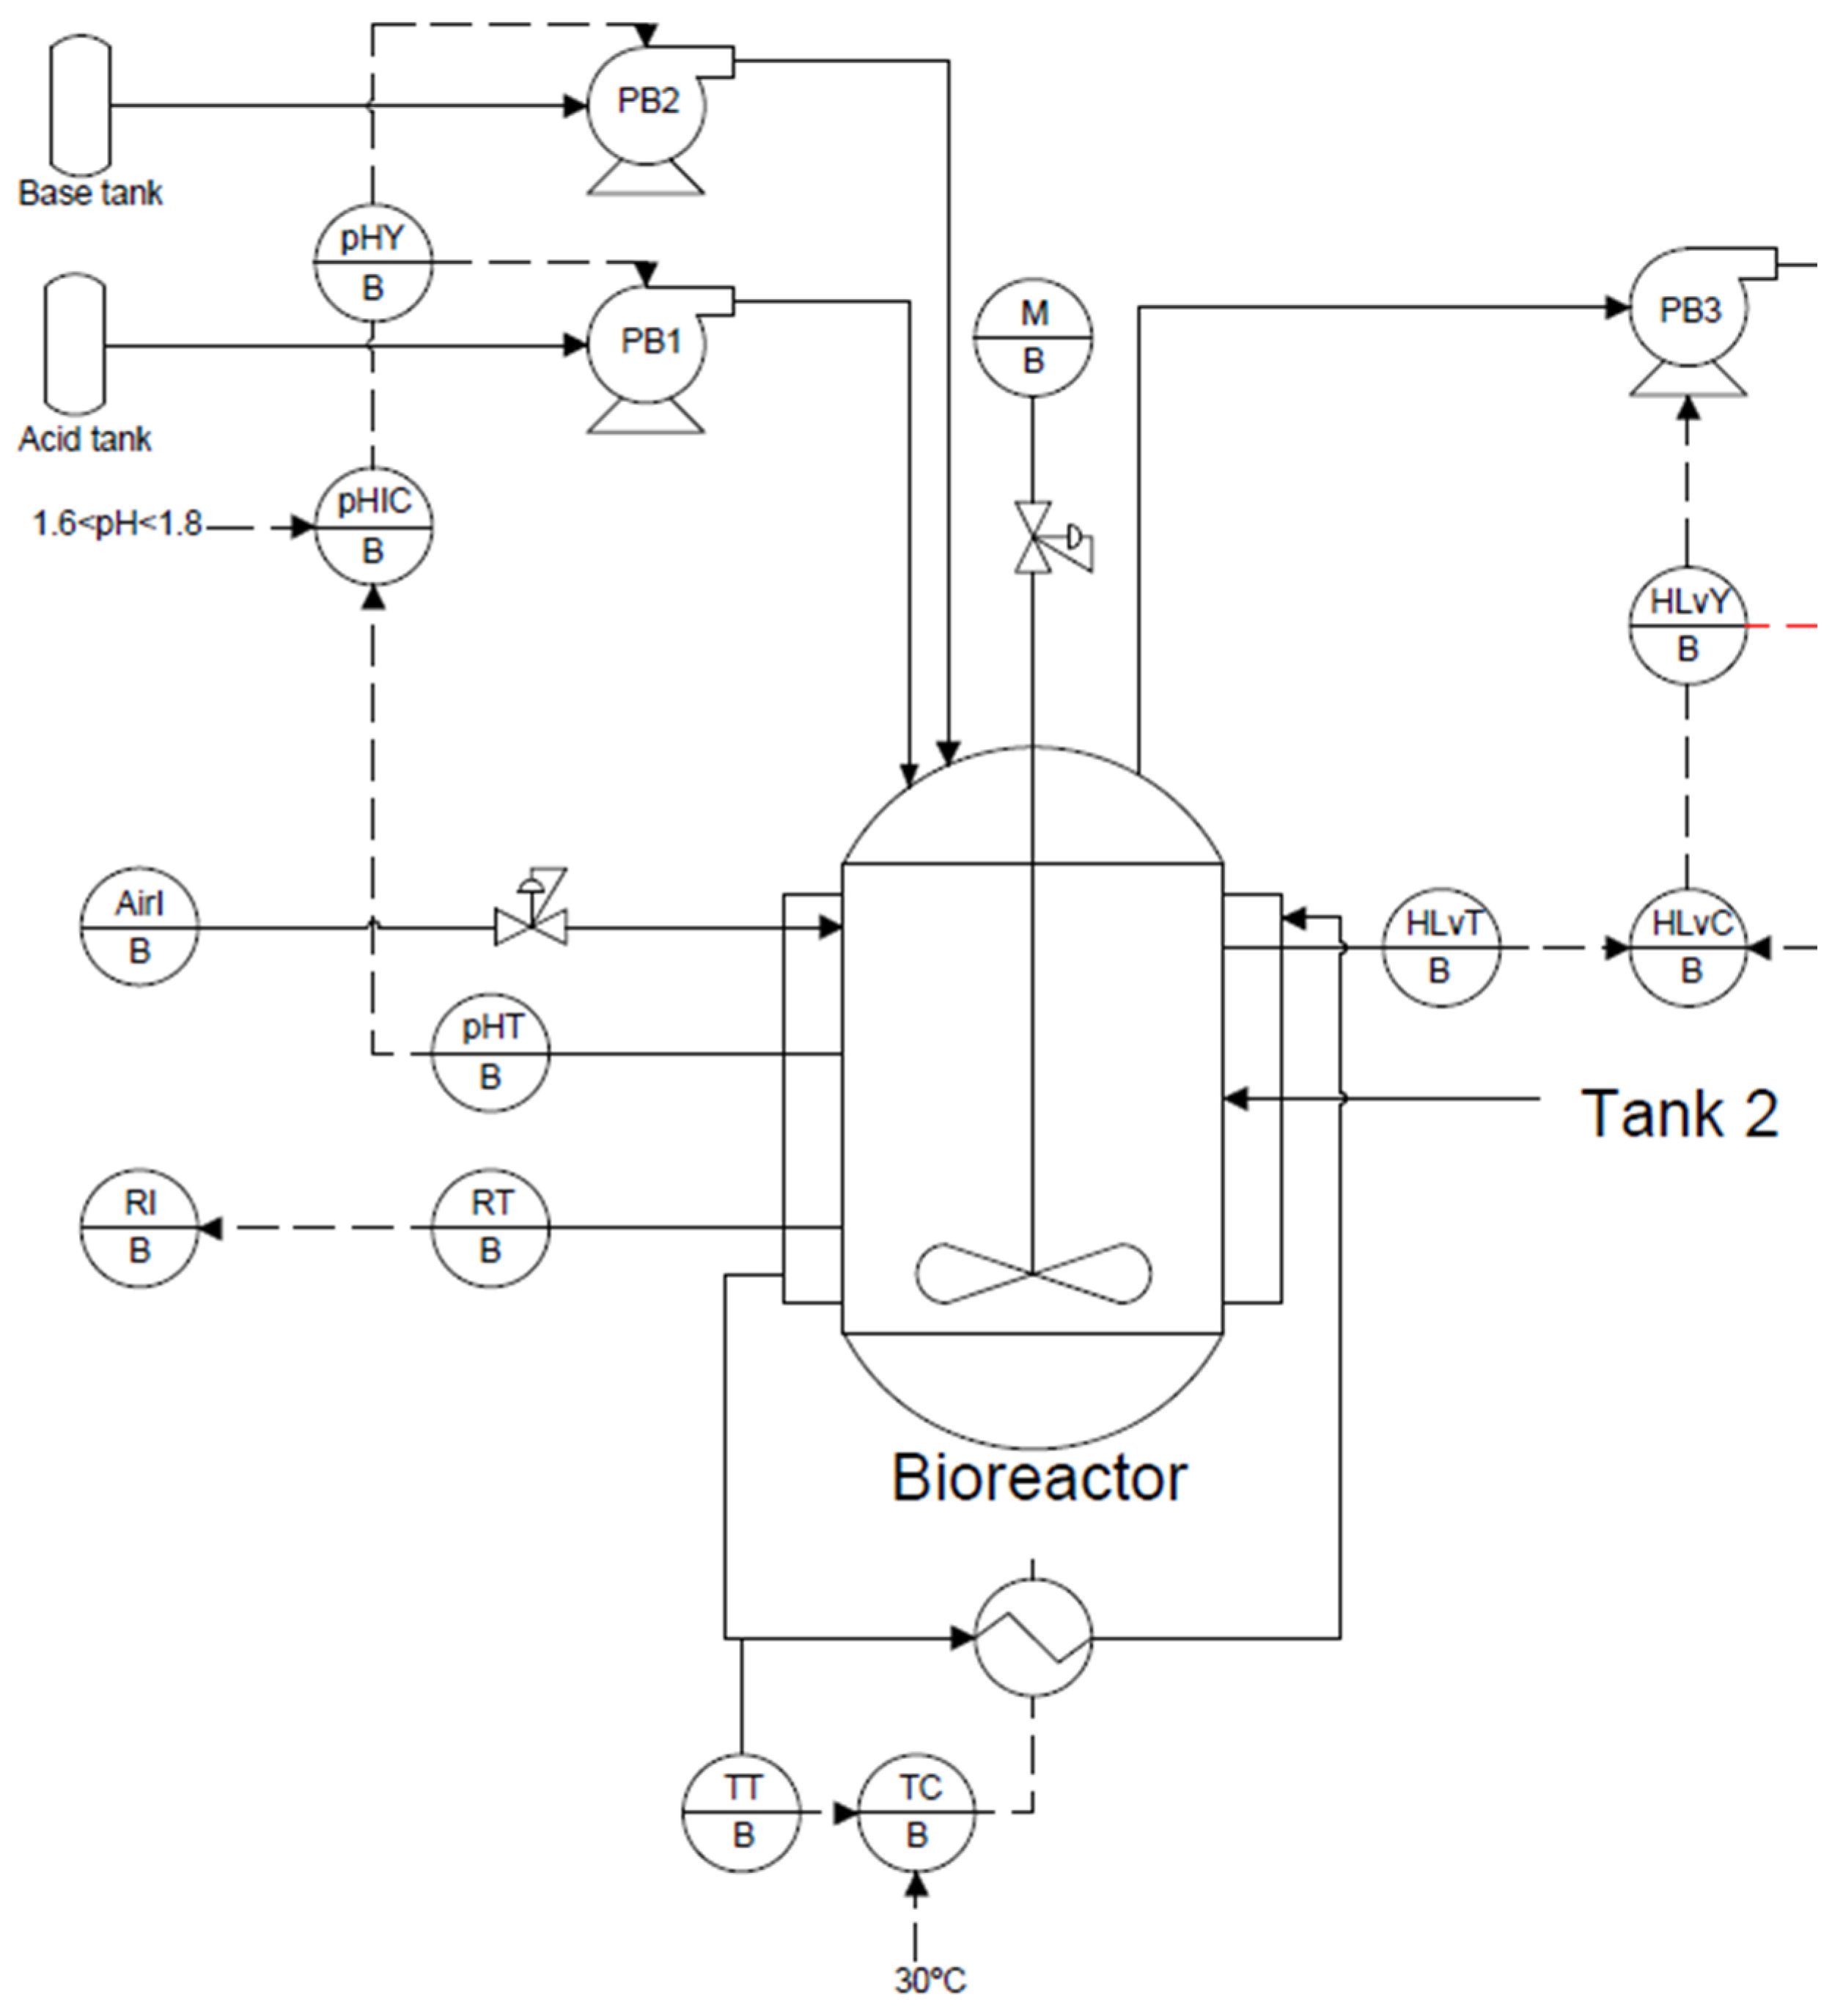
Bioreactor: The objective is to preserve and regenerate the biological leaching agent by controlling pH, temperature, and dissolved oxygen in the reactor. This is achieved through the continuous operation of an air injector and a stirrer, with temperature regulation (31 °C). pH is monitored and adjusted within specific intervals (1.75), and any deviations result in the injection of base or acid. Redox levels in the reactor are measured and recorded, and a maximum liquid level sensor is installed for the bioreactor. Pumps PB1 and PB2 add acid and base, respectively, while pump PB3 sends the agent to Tank 1.
Figure 2 illustrates the key components of the Bioreactor station, showcasing pumps PB1, PB2, and PB3, alongside level sensors denoted as HLvTB, temperature sensors as TT, pH sensor as PhT, redox sensors as RT, and a stirrer motor as M. Henceforth, the color red in figures solely indicates connection to other units. The system specifications involve pH and temperature control, redox monitoring, and high-level safety measures:
- ○
Monitoring and recording of the reactor’s redox level.
- ○
pH control is implemented to maintain the reactor’s pH. pH readings are taken every minute with a pH meter, using an all-or-nothing control approach:
- ▪
If pH > 1.8, acid is injected by activating pump PB1 for 2 s.
- ▪
If pH < 1.6, base is injected by activating pump PB2 for 2 s.
- ○
The active duration of PB1 and PB2 is documented. If pH remains outside the range [1.6, 1.8] for 10 consecutive readings, an alarm is triggered.
- ○
A high-level sensor (HLvTB) is installed in the bioreactor. When triggered, it activates pump PB3 to transfer the leaching agent to Tank 1. This controller remains normally closed and activates only upon receiving a signal from the HLvTB sensor. Additionally, if the controller detects that the HLvTB signal does not stop, possibly indicating an issue with pump PB3 or interrupted drainage, it sends an emergency signal to cease the bioreactor’s supply and prevent potential flooding.
Figure 2.
Main components of the Bioreactor station.
Figure 2.
Main components of the Bioreactor station.
If the LLvT sensor is activated, it halts liquid output until a sufficient volume is reached, effectively pausing the PL1 pump (leaching stage) (see
Figure 3).
Column and reservoir (leaching): Copper dissolution occurs in this station. The state of the process is determined by the color of the leaching agent, which changes from orange to green. A color sensor (CTL) indicates the end of the process. Pumps PL4 and PL5 send water from the reservoir to the column, pump PL3 adds acid to regulate the pH, and PL2 conducts the agent to the next station (see
Figure 4). This setup is complemented by level sensors labeled as L/HLvT, temperature sensors denoted as TT, and a pH sensor referred to as PhT. The leaching process is initiated using a button, and the sequence is as follows:
- ○
PL1 pump transfers liquid from Tank 1 to the leaching column reservoir until the HLvTL level is achieved. It stops in emergencies, such as a full electrolysis tank (HLvCR signal) or insufficient liquid in Tank 1 (LLvFT signal).
- ○
The color sensor is monitored, and either PL4 or PL5 pump recirculates water in the column. The choice between PL4 and PL5 alternates to allow manual PCB changes without interrupting the process.
- ○
After changing a column’s PCB, a button signals the column’s availability for a new leaching process. If no column is available, the system halts.
- ○
The process continues until the desired color is reached, indicating the end of leaching. PL2 pump operates until the LLvTL level is reached for reservoir emptying. pH control involves adding acid, with PL3 activated if pH > 1.8.
Figure 4.
Main components of the Leaching station.
Figure 4.
Main components of the Leaching station.
Copper recovery (electrolysis): In this phase, copper recovery occurs, with a color sensor indicating the completion of the reaction, changing the solution from light green to dark green (see
Figure 5). The specifications include:
- ○
Upon completing leaching, PL2 pump is activated to extract all liquid from the leaching column and transfer it to the electrolysis stage, halting upon HLvCR activation (level sensors marked as L/HLvT). A signal is then sent to the leaching stage via link 4 to prevent further fluid entry.
- ○
PL6 pump is used to recirculate the liquid and provide agitation in the tank.
- ○
The power supply applies a fixed 2 V voltage to the electrodes, monitoring the current (IT). After 180 min, the voltage should decrease to 1.7 V to conclude the operation. Intensity sensor is identified as CT.
- ○
Like the previous stage, color is monitored, and when the operation is deemed finished:
- ▪
PL6 and the power supply are deactivated.
- ▪
PR pump is activated until it reaches the LLvTR level, emptying the liquid into Tank 2, followed by two additional signals (link 6 and link 7) to initiate the purging process.
Figure 5.
Main components of the Copper recovering system.
Figure 5.
Main components of the Copper recovering system.
Tank 2: Similar to Tank 1, this stage allows the integration of the continuous-discontinuous regime. Additionally, it is responsible for purging the system (see
Figure 6). The monitored system includes PST1, PST2, and PST3 pumps:
- ○
Shortly after receiving input from copper recovery through link 6, a signal opens the PST1 pump for a controlled time period.
- ○
Subsequently, via link 7, PST3 pump is activated to introduce a biological agent into the plant. This pump is also deactivated after a controlled time.
- ○
PST2 pump continuously supplies the bioreactor with a flow unless it receives specific signals:
- ○
LLvTST, which activates PST pump if Tank 2 is empty, introducing additional biological agents.
- ○
An emergency signal from link 1 originating from the bioreactor can also stop the PST2 pump, indicating a flooding situation that requires investigation.
- ○
If, under any circumstances, Tank 2 reaches its maximum capacity (HLvT), which should never occur and likely implies a pump malfunction, an alarm signal is triggered, leading to the shutdown of the entire system.
Figure 6.
Main components of Tank 2.
Figure 6.
Main components of Tank 2.
The nine Level sensors (HlvTB, HlvtTL, HLvTR, LlvTL, LlvTR, HLvTFT, LLvTFT, HLvTST, LLvTST) are of the ILMU5, Carlo Gavazzi, Milano, Italy. The two pHTB and pHTL sensors belong to the Analog Industrial Ph Sensor/Meter Pro Kit V2, Gravity, Austin, TX, USA. The Redox Sensor RTB is the SENTIX ORP-T 900, WTW, Frankfurt am Main, Germany. The 13 pumps (PB1, PB2, PB3, PL1, PL2, PL3, PL4, PL5, PR, PFT, PST1, PST2, PST3) are Cole-Parmer, Model 77202-50, Eaton Socon, UK.
2.2. Software Architecture
Here is an examination of the technologies and protocols used, accompanied by their technical rationales. We will begin by examining the control software related to the chemical plant, then proceed with an analysis of the server architecture, and conclude with details of the APIs. To facilitate collaboration and provide access to the full source code of each module responsible for the processes described in this section, a developer manual available at [
26] offers comprehensive technical guidance and ongoing support for project maintenance. Additionally, a GitLab repository is made accessible at [
27] for code management and version control.
2.2.1. The Bioleaching Plant Software
The control system of the plant operates with its current control software, which collects data from a range of sensors and actuators, as detailed in the preceding section. The plant has its own control mechanism for managing the pumps and sensors. Based on sensor readings, the control system independently activates the pumps to ensure proper functioning of the chemical process. Alerts need to be transmitted to the server to signal unfavorable conditions.
A general view of the different control devices on the plant is depicted in
Figure 8. The basic and standalone closed loop control of the physical parameters is performed by an Arduino like device rugged for industrial environments (ESP32-PLC), this device manages the readout of the different sensors and control of the different pumps and actuators. Any rugged hardware platform could be used for control and acquisition. Additionally, since the programming is based on Arduino, transitioning to other platforms should be straightforward. The control and acquisition information are sent using the standard MQTT protocol to the embedded computer (Raspberry Pi) running a Node-Red server. Using the publish/subscribe methods the messages and control transmission is simplified. The communication is performed on a local ethernet network with no external connectivity. The last element is the touch panel displaying all information on the Raspberry Pi computer. A simplified pictogram of the plant enables the user to control and display information of the different elements of the plant. This visualization and control software is programmed in the python language. Lastly, the computer also acts as an intermediate server, regularly updating the database on the main server through WebSockets connection.
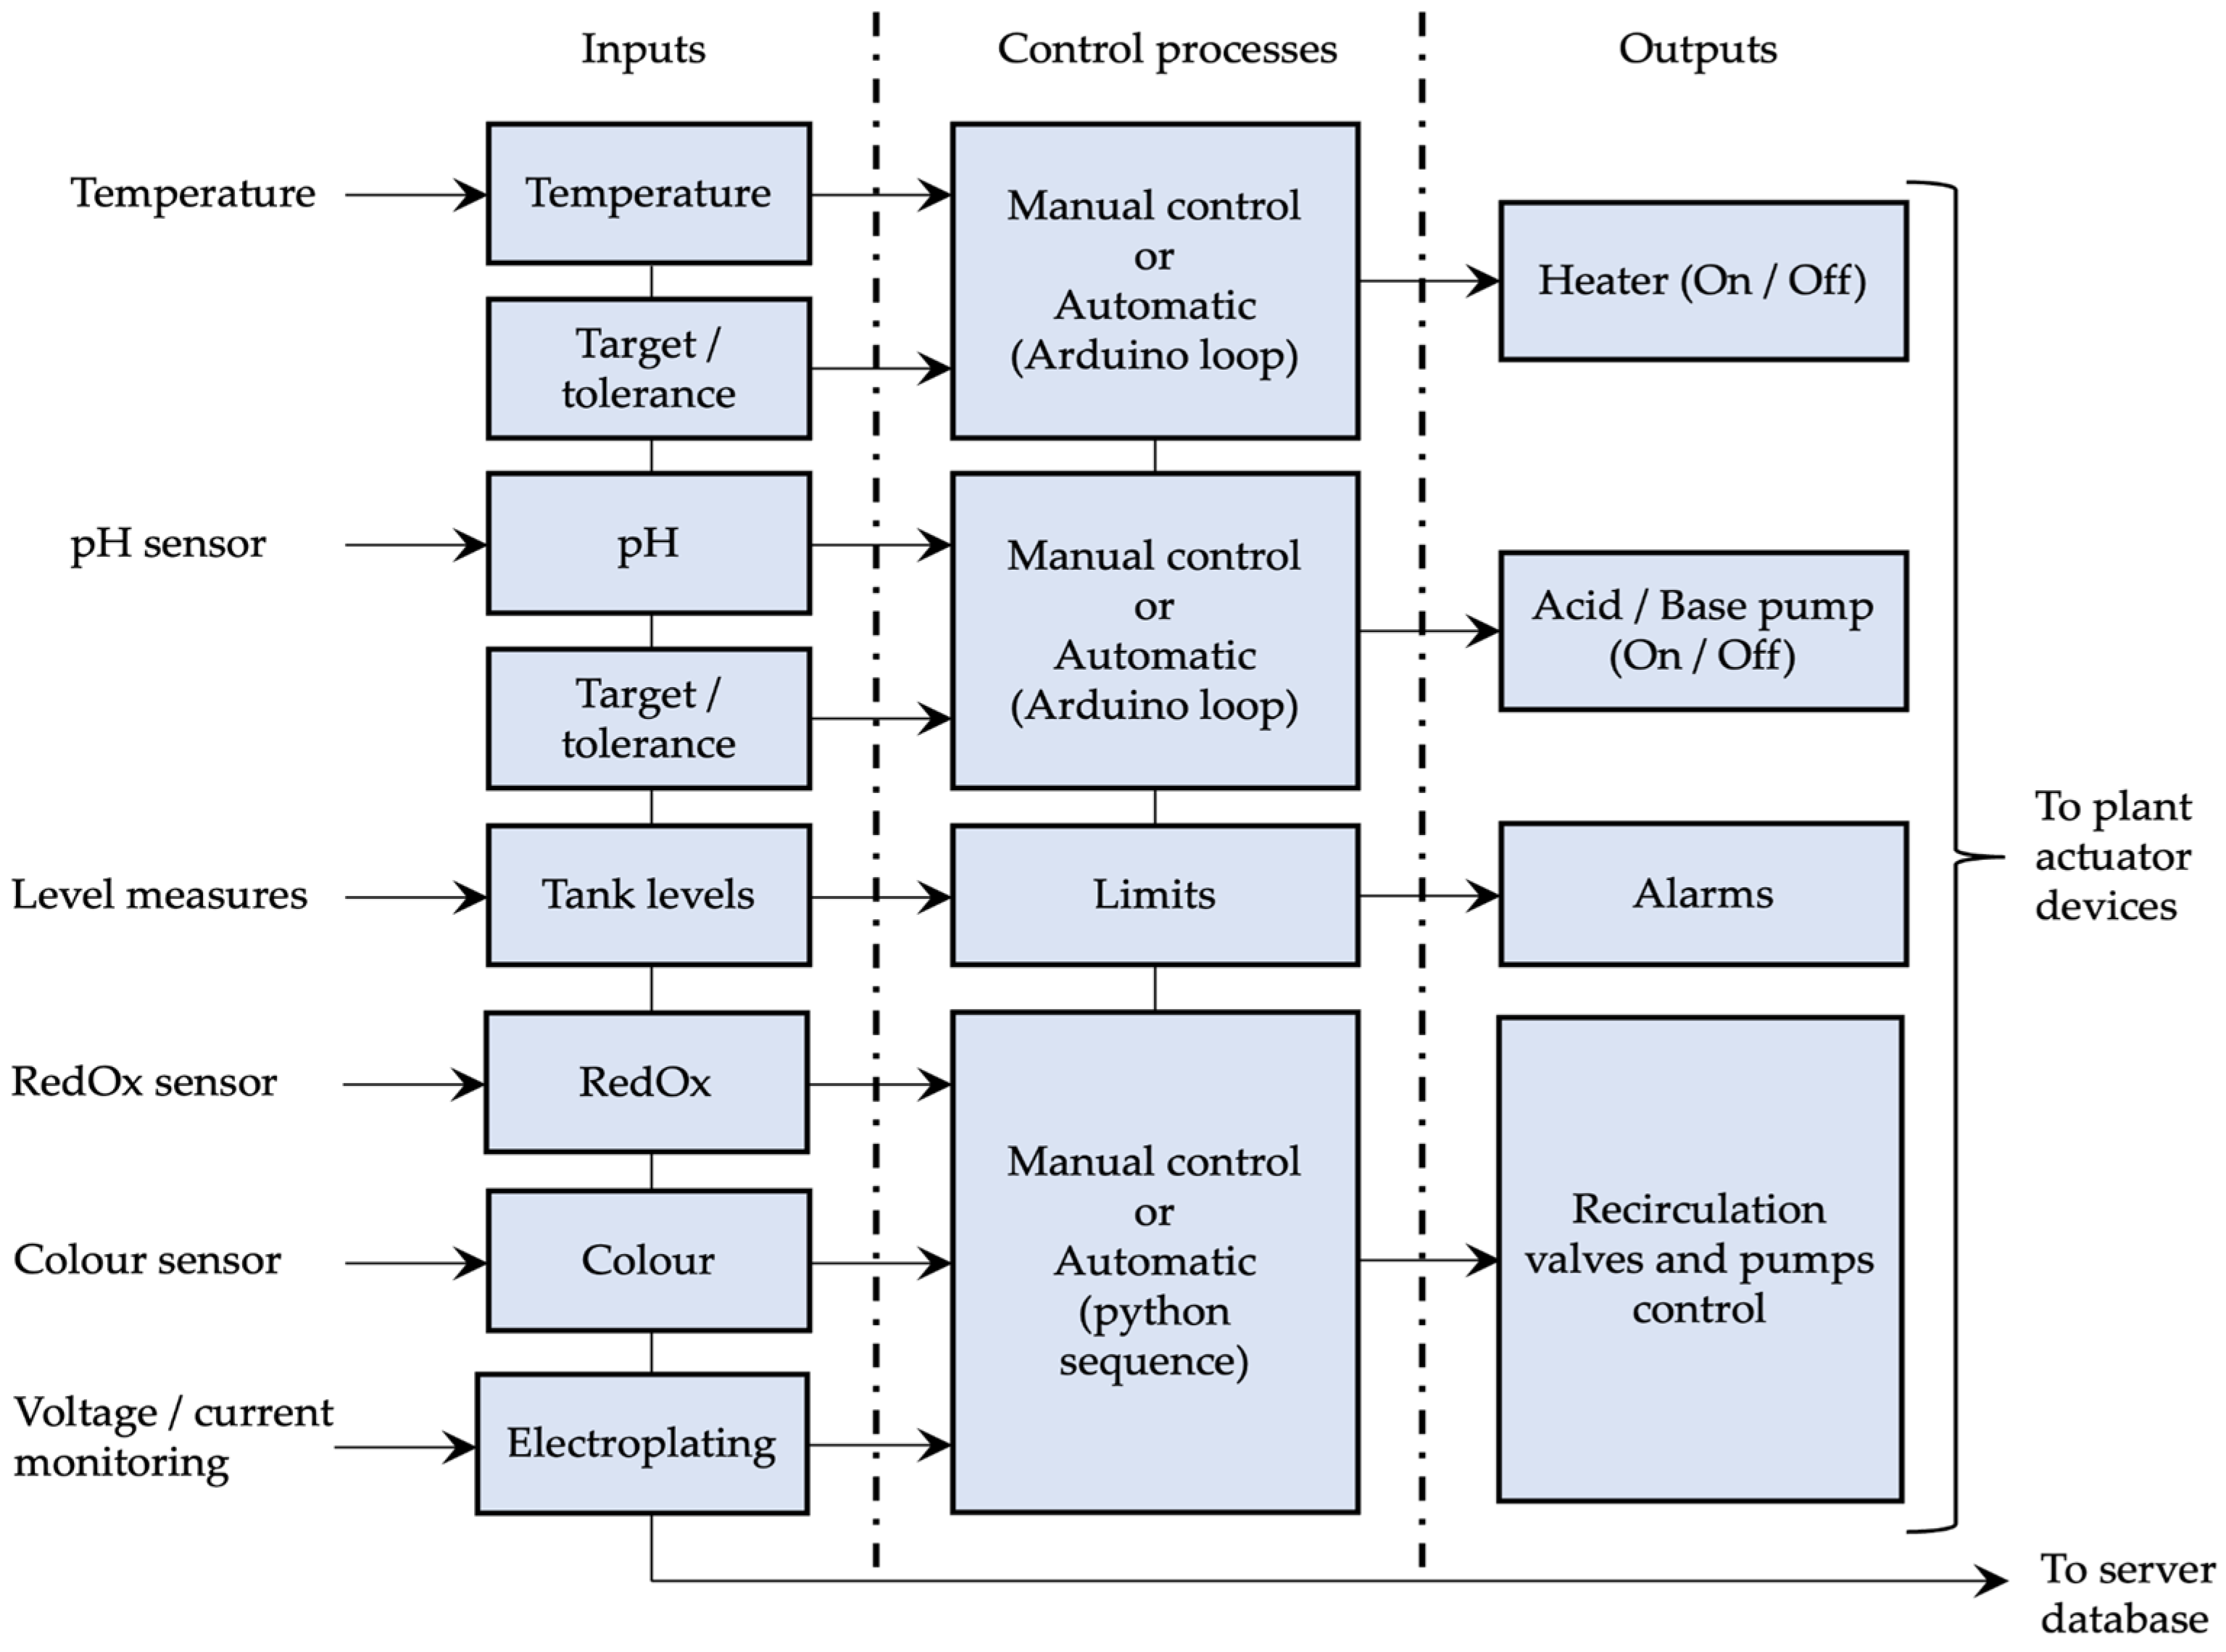
A general block diagram about the software logic is depicted in
Figure 9. Only one of the different sensor types is present for simplicity. The main control software can get control inputs either from the app or the touch screen on the plant achieving a very flexible control datapath. In any case, the changes in control signals are transmitted to the rest of the system and enable or disable automatic control loops in the Arduino code or in the Python code. Manual control of the actuators is also possible and also a mix between automatic (such as keeping temperature or pH to a constant value) and manual control of the rest of the plant. At a given frequency, all sensing and status values are saved to the server database enabling the user to obtain historical data. Several critical sensing parameters (the ones with limits) are shared between different control blocks in order to avoid malfunction of the plant. The RedOx and color sensors are fundamental to obtain the status of the biological and electroplating processes and thus used to control the transition of the process from one phase to another.
Bidirectional real-time communication between the plant and the server is established using WebSockets; refer to [
27] for implementation specifics. The library supports WSS (WebSocket Secure) and client certificates for secure communication. Technicians chose JSON as the data exchange format between the plant and server for its efficiency in rapid data exchange, and it aligns with the sufficient bandwidth capacity of both the server and the plant. This facilitates the seamless transmission of the collected data to the server and its efficient storage in the database. This integration allows for the utilization of real-time data in decision-making and analysis, thereby advancing the attainment of project objectives. The responsibility for maintaining the plant’s control mechanism rests with technical control specialists who have collaborated in defining the format and internet protocol for seamless data exchange between the plant and the server. It is noteworthy that the software for these two components can operate independently, providing flexibility in their operation.
The plant’s software securely stores client keys for server authentication, verified through a root certification authority (CA) creating intermediate CAs for signing client certificates. To identify the plant in the connection, it is proposed to use a client certificate generated using OpenSSL, which is a set of tools for working on the security layer in internet connections. The plant certificate ensures connection authenticity, while future plans involve a Raspberry Pi for simplified authentication, with certificates ready for future deployment following guidelines in [
26].
2.2.2. The Server
The server functions as an intermediary between users of the Biometallum App and the bioleaching plant, handling the storage of plant information and processing administrator requests. By utilizing Flask (version 1.1.2), Gunicorn (version 20.0.4), and Nginx (version 1.18.0) in conjunction with Telegram (version 10.2.3) integration and web-based APIs on the server, we have developed a robust solution for constructing a user-friendly interface that enables real-time control and monitoring of the IIoT devices within the bioleaching plant via the popular Telegram messaging platform.
Figure 10 depicts the system’s key components, with APIs on the left, the server in the center, and the bioleaching plant on the right.
2.2.3. API Development
To streamline application development and ensure system scalability, we have developed an API to enhance information accessibility. This Application Programming Interface (API) serves as a user-friendly interface that facilitates seamless communication between diverse applications. It clearly defines available requests, their execution procedures, and potential responses. More specifically, we have crafted a REST (Representational State Transfer) API, [
28], to optimize data access while adhering to REST architecture principles. REST offers a client-server structure, statelessness, cache ability, a uniform interface, a layered system, and optional code on demand. It enables flexible interaction with resources without being tied to the server’s state. When modifying the API, we have two approaches: linking changes to new routes for gradual updates or maintaining obsolete parts while building on new ones. This RESTful API promotes modularity, extensibility, and customization, fostering versatile application development across diverse platforms and use cases. It offers simplicity and flexibility by avoiding server-state constraints, enabling each application to independently manage resource access. This flexibility also facilitates the creation of new interfaces across various platforms, catering to a range of use cases. GitLab’s key directories [
27] comprise several essential categories: /users/stores user information, /data/manages database records, /data/alerts/contains error logs, /elements/houses plant sensors and components, and /auth/is designated for session management. Detailed API documentation can be found in the developer’s guide [
26].
2.2.4. Server Software
Our server software system seamlessly integrates Flask Web Framework (version 1.1.2) [
29], and Gunicorn (Green Unicorn) (version 20.0.4) [
30]. Flask serves as the foundational cornerstone for creating adaptable web applications, acting as the application environment. It handles project code execution, supervises database management, manages client requests, and establishes connections with the plant.
Gunicorn, a specialized HTTP server for WSGI applications, adeptly assumes dual roles as an application server and an interface with Flask applications. It efficiently manages multiple concurrent requests and is renowned for its ease of implementation and support for gevent during development, ensuring optimal performance. Additionally, it interfaces seamlessly with Nginx (version 1.18.0) [
31], which serves as a gateway to external networks. Nginx is configured as a reverse proxy server in front of Gunicorn, offering advantages such as load balancing, SSL termination, heightened security, and streamlined handling of incoming HTTP requests. Both Flask and Gunicorn are optimized to function within a Python version 3.8.10 virtual environment. This configuration enables independent library management and affords control over the application’s structure, free from constraints related to specific requirements, including the selection of the desired database engine. We anticipate accommodating approximately 70 concurrent users, with a predominant focus on read-only requests, considering that the primary plant primarily generates write requests. Users retrieve data from the server or transmit instructions, with the latter not necessitating write operations. The selection of SQLite3 as the server database engine was based on its simplicity and the anticipation of a low level of concurrent write/read requests from a limited number of users (fewer than 100).
To streamline the development process, we utilize SQLAlchemy [
32], which encompasses a set of tools and an Object-Relational Mapper (ORM). SQLAlchemy addresses the challenges of abstracting database functionality by creating object creation and interaction interfaces reminiscent of traditional methods, while also providing automation tools for repetitive tasks. This approach affords the technician maximum control over the database and facilitates a smooth transition to an alternate SQL engine. According to [
32], websites with fewer than 100,000 daily requests do not experience performance issues. The same object relationships can be maintained while configuring support for the new engine. Furthermore, our configuration work in Flask is optimized using the Flask-SQLAlchemy library.
The database serves as a repository for plant data, detected alerts, and user accounts, with a comprehensive database model available in [
26]. The initialization process involves reading a file, mirroring the operation performed within the application (see
Section 2.2). User management incorporates secure storage of passwords on the server, employing hashing and salting techniques to mitigate security risks. This robust approach presents a formidable challenge for potential attackers attempting to access private data, even in the event of a compromised database. Authentication occurs over a secure channel, utilizing encrypted Internet Protocol, with passwords subject to hashing and salting. Validation against stored hashes is executed using the Werkzeug security library (for reference, please consult the models.py file, [
27]).
While alternatives such as Machine-to-Machine (M2M) protocols like MQTT (Message Queuing Telemetry Transport) can be secured using mechanisms like TLS/SSL for encryption and authentication, it is important to note that implementing these security features may necessitate additional configuration compared to the built-in security offered by WSS. It is worth mentioning that server software Nginx, as its default configuration, is primarily tailored for handling HTTP and HTTPS traffic. While it excels in serving web content and acting as a reverse proxy for HTTP-based applications, it does not inherently support the MQTT protocol. According to [
33], disadvantages of MQTT compared to WebSockets include its stateless nature, leading to a lack of continuous connections for real-time bidirectional data transfer. MQTT often exhibits higher overhead due to its publish–subscribe model and additional headers, potentially increasing message size and network traffic. Managing topics, subscriptions, and QoS levels can introduce complexity, particularly in large-scale deployments. Moreover, MQTT is not native to web browsers, requiring JavaScript libraries or WebSocket bridges for web application integration, while WebSockets are well-supported. MQTT’s non-standard port (1883) may face firewall blocking issues, whereas WebSockets use standard ports (80 and 443). Lastly, MQTT’s security depends on implementation, while WebSockets can leverage robust SSL/TLS security mechanisms. MQTT’s primary design for publish–subscribe messaging makes it less suitable for request-response interactions compared to HTTP and WebSockets.
2.2.5. Server Hardware
The server, hosted by the university, runs on Ubuntu 20.04, offering 5-year LTS support extendable through paid security maintenance until April 2025. It has two CPUs, 2 GB RAM, and 15 GB free disk space, meeting web server management and project needs.
2.2.6. Communication between the Server and the Bioleaching Plant
Within our bioleaching plant management system, the need arises for real-time, duplex communication that operates without delays. This involves the continuous transmission of component information every minute and the reception of commands for the actuators. As previously discussed in
Section 2.2.1, we employ WebSockets as the internet communication protocol to fulfill this requirement. For secure communication, we use WebSocket Secure (WSS) when establishing connections via HTTPS. WSS ensures a secure communication channel through encryption (TLS/SSL). For more comprehensive information on WSS, please refer to works like those cited in [
34,
35]. In practice, our bioleaching plant efficiently utilizes WebSockets for real-time duplex communication while maintaining secure HTTPS communication. We have also integrated Nginx into our system for client certificate authentication within the WebSocket channel.
The connection is established through the Flask-Sockets library, which allows the use of protocols not available by default in Flask. The service is provided through gevent, which uses greenlets. Greenlets are tasks that run sequentially, mimicking concurrency. Unlike other methods, greenlets always run within the main thread. When an administrator wants to send an order to the plant, it must be sent to the open WebSocket. The MessageManager class is responsible for managing messages between different contexts. When a WebSocket is opened, it creates a mailbox inside the instance. Each administrator request is sent to the manager, where it is placed in all available mailboxes. The maximum number of allowed mailboxes on the server is one, which is established only on the WebSocket.
The connection management program opens two greenlets: one for receiving messages from the plant and the other for command messages. Both wait to receive some information, which is then sent to the initial greenlet. Depending on the information, the program saves it in the database or sends it through the WebSocket. When disconnected, everything is closed.
When information is received from the plant, alerts and, in a specific case, data are managed. For each received value, it is checked whether an alert should be generated. The same alert is not generated within a 12 h time frame to avoid notification saturation. This time frame is sufficient to check and regulate the state of the plant, through the application or in person. Detailed program listings and source code can be found in GitLab [
27], file ws.py.
2.2.7. Communication between the Server and the Biometallum App
The mobile app communicates securely via Hyperlink Transfer Protocol Secure (HTTPS), ensuring encryption, data integrity, and server authentication through public certificates [
36]. Minute-by-minute requests are implemented using short polling, chosen for its resource efficiency despite packet exchange for each request. HTTPS ensures that the content of the packets exchanged between the client and the server is encrypted, preventing eavesdropping. It also protects against man-in-the-middle attacks by ensuring data integrity and authenticating the server’s identity to prevent impersonation. The decision to use HTTPS for communication with the mobile application was based on its widespread use and availability of implementations, which speeds up the creation of new interface applications. The security of HTTPS is achieved by public certificates, which certify the authenticity of the server connection and are typically obtained from certification authorities. In this project, Let us Encrypt, a non-profit authority that offers free certificates within established limits, is proposed to be used for obtaining certificates [
37]. To obtain and renew certificates from this authority, it is highly advisable to utilize Certbot, a specialized tool. The current certificate is valid until 26 November 2023, 13:50:46 GMT. Detailed instructions for renewing the certificate are available in [
26].
The possibilities considered for accessing information from the server every minute are short polling, WebSocket, and Server-Sent Events. Short polling is chosen as the method for managing requests due to its resource-saving nature, as the server does not need to maintain a constant connection with clients like in WebSocket or Server-Sent Events. Short polling allows each client to enter and exit without maintaining a connection, resulting in lower resource usage on the server. However, it should be noted that short polling requires the exchange of packets to open and close the connection with each HTTPS request, which can result in a higher amount of information being exchanged compared to other methods. In the project, it was estimated that the time interval between requests (typically one minute, on average) and the expected number of users within the service make it feasible to establish a connection each time without any issues. In fact, the tests carried out with the detailed bioleaching plant components and concurrent access users have been successfully completed. Short polling method implies that the user takes the initiative to receive information, and the data is received asynchronously. If the plant sends data before its time, the client does not receive it until making a request to the server in the next cycle. To avoid cases of bottlenecks where the server and/or the network are saturated by the number of requests sent at the same time, a random margin of time (between 0 and 5 s) is added to each periodic request.
2.2.8. Authentication
The creation and management of cookies in communication between the application and the server are explained as follows. Cookies are used as an authentication method, where a cookie is generated for each client accessing/auth/login (see [
27]) with their credentials. Subsequent requests to the server must include the cookie to verify its authenticity. In Flask, cookies can be encrypted using a secret key to prevent modification by clients, and this secret key must be kept confidential to maintain system security. It is worth mentioning that utilizing sessions is not aligned with the principles of a REST API, particularly the principle of statelessness, where each request should be self-contained and include all the necessary information for understanding. However, in the specific context of this project, there might be a requirement to access user accounts and maintain authentication state, which could necessitate the utilization of cookies for managing session-related information. Two alternatives for authentication in a REST API are presented as follows:
Including the username and password in each request sent to the server, where the server logs the user for each request and performs the corresponding command if the required permissions are available. However, this approach requires storing the username and password in memory, which can be a security risk if unauthorized access to this information is gained.
Using a third-party application for registration, which generates a token code to be sent with each request.
However, in the current project, the use of cookies is preferred due to their simplicity in management, and the proposed alternatives are not suitable for this project. When a client successfully accesses the/auth/login endpoint with valid credentials, a distinct and unique cookie is generated for that specific client. To ensure the client’s authenticity in subsequent interactions with the server, this generated cookie must be included in all subsequent requests.
Within the Flask framework, cookies can be further fortified by employing encryption mechanisms, secured by a confidential secret key. Safeguarding the secrecy of this key is of paramount importance, as it is instrumental in upholding the overall security and integrity of the system.
2.2.9. Telegram Bot API
The Telegram bot component in this application demonstrates API usage and has a simpler software architecture compared to other components, comprising four modules: bot_telegram, database_manager, commands, and alerts_pooling. Initially, all objects are initialized, and the bot and alerts class are executed. The bot operates in the main thread, receiving alerts, while in an alternate thread, it awaits commands through long polling. The bot includes a subscription system for data notifications, allowing users to request access, administrators to grant or deny it, and manage admin permissions for registered users. Users are treated as separate entities for private chat and group requests.
The bot offers different commands depending on the user’s permission level. Clients have access to commands like/start (displays a welcome message), /help (lists available commands), and /status (checks their current user status). Clients without access can use/register to send a one-time access request. Registered clients can utilize /quit to stop notifications. Administrators have commands for managing users, including /requests to accept or remove requests, /remove_user to delete a user, and /add_admin or /remove_admin to grant or revoke administrator permissions.
This system’s database includes a single user table with variables like Chat (chat identification number), Username (access requester’s username), and State (user status options: Waiting, Canceled, Registered, or Admin with account management privileges). The implementation of the Telegram bot is documented in reference [
27].
Figure 11 shows a screenshot illustrating an example conversation with the Telegram bot and presenting a sample alert message regarding an out-of-range pH level. The execution of ‘/help’ provides information about the available self-explanatory commands.
/start: start conversation
/help: Provide information about the listed commands
/status: current status
/requests: Allows accepting a request and displays all the requests with the option to confirm or deny.
/requests_remove: Remove a request
/remove_user: Remove a user
/add_admin: grant admin privileges to a user
/remove_admin: deny admin privileges to a user.
Figure 11.
A conversation with the Telegram bot displaying the reception of an alert triggered by an out-of-range pH value and featuring the self-explanatory commands.
Figure 11.
A conversation with the Telegram bot displaying the reception of an alert triggered by an out-of-range pH value and featuring the self-explanatory commands.
2.2.10. The Biometallum App
The Android app, designed for bioleaching plant actuators and sensors, provides real-time access, data management, alarms, and external Telegram alerts. It is compatible with Android versions 5.0 and newer, optimized for Android 11. The app features an intuitive plant schematics interface for status communication and scalability while maintaining backward compatibility.
2.2.11. App Requirements
The application is designed to enable pump control, database access, event notifications, and secure user account management. The subsequent functionalities were defined by stakeholders, encompassing chemical process managers, laboratory technicians, and control professionals:
The control mechanism should enable one-minute data readings in three modes: real numbers for measurements like pH and temperature, integers for color sensors (requiring preprocessing for binary coding), and boolean data for level and agitation sensors, with two states, true or false. Plant elements and their registration modes are documented in [
26].
Emergency situations, including high-level activation in tank 2, pH values outside the [1.60, 1.80] range for ten minutes, prolonged high-level sensor activity in the bioreactor, and low-level sensor activation in Tank 1, trigger automatic plant shutdown.
- ○
Bioreactor: pH, redox, agitation, current temperature, time elapsed since reagent was last added to correct pH, state of high level (HLvT) or low level (LLvT) indicators, and graphs depicting the evolution of pH and redox over the past 24 h.
- ○
Tank 1 and Tank 2: state of high- or low-level sensors.
- ○
Leaching Stage: pH, operating time of pump PL4 or PL5, graphs showing the evolution of pH and color sensor, and time elapsed since reagent was last added.
- ○
Copper Recovery Stage (electrolysis): current, voltage, active time of pump PL6, state of level sensors, and graphs depicting the evolution of current, voltage, and color.
Users should have the capability to download and share information from the database in user-friendly file formats, with a preference for spreadsheets like Microsoft Excel or LibreOffice Calc. Additionally, the application should incorporate graphical elements to aid in visualizing the plant’s status, including graphical representations of level sensor statuses, pump states, and color sensor values.
Below, you will find a technical description outlining the implementation of the app, with reference to code details, please refer to the GitLab repository [
27].
2.2.12. App Retrieval of Data from the Server
As explained in
Section 2.2.2, in the context of server synchronization, the application employs HTTPS and actively maintains background monitoring of data and alerts. It queries for alerts every minute, ensuring rapid event detection even when the device is in Android’s Doze mode. The app manages tasks through classes like UpdateReceiver, which issues notifications and queries the server for new alerts. Server-generated alerts reduce bandwidth usage and offer flexibility. Component records are downloaded when the user interacts with the app, synchronized every minute with a 5 s variance to prevent issues. Server requests are handled by the DataRequest class, which stores data in the app’s database, ensuring efficient information retrieval without redundancy. Below, you will find justifications for our implementation choices.
One of the requirements of the application is to establish synchronous connections to the server every minute to request data and check for alerts, as well as to fetch information that may not be available in the device’s memory. Administrator users are granted the ability to send commands to specific plant elements. Those actions must be performed constantly, whether the application is open or closed, and whether the phone screen is on or off. After turning the device off and on with the application, the task must be resumed without explicit user action. Android provides several functions for processing data in the background, which differ depending on whether the task is immediate or after a set time, with the latter being executed at the exact or delayed time. The variance depends on conditions such as battery status and network connection.
The execution of the alert query is performed every minute at the exact time using the AlarmManager class, [
27]. Android documentation recommends executing tasks in the background, allowing their execution at the most appropriate time. This behavior is documented for Android 6.0 or higher, in the mode called Doze. When a device is left stationary with the screen off for a while, it enters this mode. Restrictions are applied to minimize battery usage, such as suspension of network access and postponement of the execution of deferred tasks. Periodically, maintenance windows are briefly opened to perform pending tasks. The frequency of these windows decreases as the time in the mode increases.
In this system, tasks are executed at the exact time without adhering to suspension periods. This decision was made based on the requirement for prompt detection of problematic events. Analysis of the recorded behaviors of various AlarmManager functions during Doze mode (as shown in [
26]) revealed that requests to the server using non-exact methods were irregular and unsatisfactory. Therefore, the Android Doze feature, which activates a low-power mode when the device is idle for an extended period, is utilized as a part of the fault detection and diagnosis mechanism. The custom app is designed to detect the Doze mode and generate alerts or notifications to facilitate investigation by a human operator or a remote monitoring system.
As documented in [
27], the UpdateReceiver class is a subclass of BroadcastReceiver, which enables it to receive notifications from other classes. When a notification is received, the UpdateReceiver executes the corresponding code. In the case of UpdateReceiver, it is designed to handle task execution requests from the AlarmManager. When triggered by the AlarmManager, UpdateReceiver issues a notification and queries the server for alerts. The time range requested for alerts is from the last successful execution up to the current minute, ensuring that only new alerts that have not been previously downloaded are obtained. The startAlarm method is called to initiate the request routine. The implementation of this management can be found in [
27], specifically in the file UpdateReceiver.java. The server generates alerts as events happen, and the application collects and processes them. This approach offers numerous advantages compared to alternatives that detect alerts at the client level:
Bandwidth usage is reduced as the application only needs to consult the alerts managed by the server, instead of downloading data of components every minute from both inside and outside the application. This eliminates the need to download all records and only focuses on new alerts.
The types of alerts can be easily modified, added, or deleted by making changes on the server, without requiring updates to be made on the apps of all users.
Any new interface can easily access alerts from the server without having to implement its own detection method.
The component records are downloaded only when the user interacts with the application, and this task is performed every minute using the DataUpdateSchedule class. The latest data of each component is consulted every minute to provide the user with up-to-date information on the plant. The DataUpdateSchedule class is started in all activities to continue the process when the application starts or resumes from suspension, but it is destroyed when the application is closed. This ensures that data is only obtained when an activity is open, and other information requested by the user is obtained independently. The code for making requests is available in the application file DataUpdateSchedule.java [
27]. The downloading of alerts and records is synchronized across all devices and carried out at the beginning of each minute to avoid adverse behaviors, with the only difference being a variance of 5 s as explained in the previous section. The DataRequest class contains all the necessary functions for making requests to the server to retrieve information, which is used for periodic tasks and for the interface. The downloaded information is stored in the application’s database, and redundant requests are avoided by checking if the requested information is already available on the device. The Ranges table in the database defines the available information, consisting of start and end records, with all intermediate records already stored. When information is requested, the records to be retrieved are determined, requested, and the ranges are updated accordingly. The code for updating ranges can be found in the DataRequest.java file [
27].
2.2.13. App Session and Cookies
Access to plant management features requires user authentication via a user account. Requests to the server without proper user permissions are rejected. User account authentication is achieved using cookies, which are pieces of information sent from the server to the client and included in subsequent requests to the server for authentication. The cookies are stored in the device’s memory using the CookieStoreBioapp management class and are automatically included in all requests using the CookieHandler.setDefault method of the operating system.
2.2.14. App Database
The app uses a dedicated database server for managing the plant’s structure (components and stations) and efficiently storing and retrieving previously accessed data. This customized database differs from Android’s default SQLite and is implemented using the Room library, which simplifies database operations through three core components: the Database Class, Entities representing database table rows, and Data Access Objects (DAO) for database operations. LiveData objects in Room notify an Observer class of data changes, updating real-time information displayed in the app, such as station activity and elements.
The database structure and table definitions are documented in [
26]. The initial setup involves parsing a file (raw/stations_elements.xml) to generate stations and components, including unique identifiers and names for each station, component identifiers, names, and data types. Shared components are marked as ‘duplicate,’ and the file allows for defining graphic value limits. During the app’s first launch, the BDRoom class executes the initDB method, reading the XML file and populating the database with the specified values.
The application utilizes its own database server to support various functionalities, including the following:
The database used in the application is a modified version of the server’s database, tailored to cater to the needs of the application. In Android applications, the default database used is SQLite. Android provides two interfaces to interact with SQLite: low-level commands or the Room library, which serves as an abstraction layer for managing the database. The Room library consists of three main components:
Database class: This serves as the access point to the database, where variables and saved data are initialized.
Entities: These represent rows of each table in the database, and they can be added, modified, or deleted. The variables and functions of entities act on the values in the corresponding table.
Data Access Objects (DAO): These offer functions to perform actions on the database, such as adding, deleting, modifying rows, or executing SQL commands for searching the database.
With Room, database rows can be registered within a LiveData object, which notifies an observer class (Observer) when the contained object is modified. In the project, this feature is utilized to update the screens where the latest received information is observed, such as the station activity and elements. The next
Section 2.2.15 provides detailed information about Station activity and elements within the App Interface.
The initialization of the database for the first time involves reading a file (raw/stations_elements.xml, [
27]) and generating the different stations and components accordingly. The stations_elements.xml file stores the structure and relationships between all elements, including the identifying number and name for each station, and the identifying number, name, and type (e.g., boolean, integer, decimal) for each component. If a component is referenced in another station, it is marked as ‘duplicate’. The file also specifies if the element is an actuator and allows for specifying value limits for graphics. The BDRoom class contains the initDB method, which is called when the application starts for the first time and reads the XML file to assign values to the database (refer to [
27] code in the BDRoom.java file).
2.2.15. The App Interface
This app streamlines user interaction via two main entry points: the main screen and alerts, requiring user registration on the initial launch and offering convenient navigation through a side menu. Each activity within the Android application serves as a distinct screen, equipped with unique resources and code to engage users effectively. The access screen is displayed in these scenarios:
Initial Setup: When the app is first launched, it prompts users to enter their credentials.
Logout: When a registered user chooses to log out via the ‘Log out’ option in the side menu.
Session Expiry: When the session cookie expires (usually set for 30 days), causing server request rejection and triggering the display of the access screen based on user interaction.
Upon user credential input, the app sends them to the server for authentication. The server responds with a JSON object signifying access authorization and, if applicable, administrative privileges, including authentication cookies. If a user’s account is deemed irretrievable, the app takes several measures: cancels data and alert collection, removes saved cookies, and obliterates database records and rankings. The initial screen (
Figure 12 and
Figure 13) serves as the primary entry point during app launch, featuring buttons for accessing various plant stations. The five components of the bioleaching plant, as illustrated in
Figure 3,
Figure 4,
Figure 5,
Figure 6 and
Figure 7, are depicted for your reference.
The station screen (depicted in
Figure 14,
Figure 15,
Figure 16,
Figure 17 and
Figure 18) provides real-time status updates for a specific segment of the plant, replicating the five primary stations outlined in
Section 1.1 (Bioreactor, Tank 1, Leaching, Copper Recovery, and Tank 2). Each component of the physical plant is depicted in red within the API interface. The upper section offers a graphical station representation, including level sensors, color sensors, and pumps. The lower section hosts buttons for station components, displaying each component’s name and its latest recorded value.
Figure 9 integrates the components outlined in
Figure 3 of the system, while
Figure 10 enables the presentation of elements from the preceding
Figure 4.
Figure 11 encompasses the components illustrated in
Figure 5 for leaching,
Figure 12 encompasses those from
Figure 6, and
Figure 13 comprises the elements from
Figure 7. Pumps and sensors are labeled according to the nomenclature specified in
Section 1.1. Level sensors are identified as L/HLvT, temperature sensors as Temperatura, pH sensors as pH, redox sensors as Redox, stirrer sensor as Agitació, intensity as Intensitat, voltage as Tensió, color as Color, and intensity/voltage as PFT.
Figure 19 provides in-depth insights into the selected component. It caters to translation requirements and employs the MPAndroidChart library for displaying a dynamic linear chart of the last 24 h’ data. The chart adjusts to the component type, ensuring real-time updates through LiveData objects. In this instance, we can observe that the pH level of the Leaching Station falls within the appropriate range of 1.6 and 1.8.
Figure 20, the administrator’s command window, provides precise control over integer values for pump components within each system component, allowing users to toggle commands while preserving uninterrupted real-time status updates.
Figure 21’s data screen activity showcases recorded data in a tabular format with component-specific filters, promoting informed data requests, facilitating easy CSV data export, and efficiently handling substantial data volumes through the use of RecyclerView.
The alerts screen (
Figure 22 and
Figure 23) serves as a repository for plant notifications, with buttons displaying component names, station titles, notification dates, and accompanying messages, seamlessly leading to the corresponding station activity when clicked.
Figure 24’s user screen, exclusively designed for administrators, provides comprehensive control over user accounts, including creation, modification, and deletion, along with additional features like password generation and the capability to capture and share account details.
Activities in the Android app follow a stack structure, with the home screen as the starting point. Alert notifications form separate stacks, including the home screen, alerts screen, and relevant station activity. Login, alerts, and user management activities use single task mode, managing the stack by removing recent activities when new ones are created. The data activity operates in single instance mode, adding instances to the stack without disrupting the existing structure for improved user workflow and experience.
3. Results
Software architecture validation procedure [
38] was performed through Architecture Tests and Model Validation. Stakeholders reviewed the architecture, and Model Validation ensured compliance with functional, performance, and security criteria under diverse loads. The assessment of the application’s command and read functionalities on the plant has yielded successful results, affirming its robust performance in real-world scenarios.
The app interface presented in
Section 2.2.15, depicted in
Figure 13,
Figure 14,
Figure 15,
Figure 16,
Figure 17,
Figure 18,
Figure 19,
Figure 20,
Figure 21 and
Figure 22, demonstrates the flawless operation of the real-time monitoring, processing, and control components. Over a span of 28 days, the system has diligently recorded data, ensuring the stability of critical operating parameters mainly related to sensors. This continuous and optimal data recording serves the purpose of generating comprehensive reports for laboratory technicians, enabling them to assess the operational performance. This meticulous approach safeguards against any system failures.
During the development phase, 15 users maintained concurrent connections. Over the weekend, two incidents arose within the bioleaching process, prompting swift intervention by the developed software to prevent failure and restore the process to its optimal state. These incidents highlighted the application’s capability to promptly issue alerts and mitigate potential damage. In one of these incidents, a pH anomaly was detected due to the depletion of acid in dosing pump PB1 within the bioreactor (refer to
Figure 2 and
Figure 13). This resulted in the pH exceeding the critical threshold necessary for biological growth in the bioreactor. Without the timely issuance of appropriate alerts, irreversible consequences would have occurred by Monday, as a pH level above 2 leads to biomass inactivity with no chance of recovery. Consequently, the prompt alert issued by the system (via the application and via the Telegram) preserved the plant’s operation, extending its functionality for several additional days, allowing the operator to rectify the dosing deficiency and ensuring the continuous activity of the bioleaching process. Furthermore, the system allows for remote command operations of the pumps, with the option to deactivate (0) or activate (1) them, as depicted in
Figure 19.
The chemical technician can access reports that enable real-time monitoring within a 24 h window at the plant. For instance, the application facilitates the monitoring of nighttime temperature and pH operations, as exemplified in
Figure 18 and
Figure 20, along with tank level assessments. All of this can be achieved without the necessity of physical presence at the plant. The Alerts screen, as portrayed in
Figure 21 and
Figure 22, in combination with the Telegram Alert feature showcased in
Figure 10, streamlines the dissemination of incident notifications to all stakeholders, irrespective of whether they have the application actively running.
Within the research group, 15 users in geographically distant cities like Seville and the Basque Country can actively monitor the real-time status of the bioleaching process and contribute valuable enhancements to both the plant and the biological process, leveraging their specialized expertise. It is important to emphasize that having an application that enables control over an experimental bioleaching plant, while offering a flexible, open, adaptable, and downloadable code for future enhancements, is a rare and valuable asset in this context. After successful testing, this section highlights the fundamental characteristics and benefits of the open-source software developed for the remote monitoring and control of a bioleaching plant:
Open-source replicable APIs: The development effort yielded an Android application customized for bioleaching plant monitoring, effectively fulfilling its primary objectives and technical specifications. The application provides comprehensive plant status and evolution information, accessible on Gitlab [
27].
Intuitive APIs: The REST API design ensures a deep understanding of the bioleaching plant’s status, offering robust functionality for actions and database access based on user permissions. It enhances user experience with visual aids, serving as endpoints for IoT device communication via standard HTTP requests. The application adheres to RESTful API principles, ensuring consistency and seamless IoT resource interaction. Flask facilitates an intuitive and responsive interface, allowing users to interact with IoT devices via the Android app and receive Telegram alarms, offering flexibility and accessibility for various preferences and scenarios.
Robustness: Extensive testing of the application’s command and read functionalities on the plant demonstrated reliable real-world performance. Notably, the application can issue warnings and prevent damage, as evidenced by two plant accidents during development. Utilizing WebSocketSecure functionality, the application offers real-time monitoring of IoT device data, delivering live updates and notifications through both the Telegram bot and the UI, thereby improving the overall user experience.
Innovation in Open-Source Alert Generation Software: The server’s API enables the development of new interfaces, exemplified by the Telegram bot, showcasing diverse functionalities achievable through this feature. Flask integration with Telegram in an IoT application creates a user-friendly interface for IoT device control and monitoring via the widely-used Telegram messaging platform.
System Security: Web technologies establish a continuous, bidirectional communication channel with the plant, streamlining information exchange in a predefined format. The server incorporates certificates and customizable settings for implementing security protocols such as the bioleaching plant scales. Gunicorn serves as the application server, efficiently handling multiple requests concurrently and ensuring optimal performance and stability. The Nginx Web Server functions as a reverse proxy server positioned ahead of Gunicorn, offering several benefits including load balancing, SSL termination, and enhanced security. Nginx adeptly manages incoming HTTP requests, directing them to Gunicorn while also serving as a robust protective layer against potential security risks. Implementing security practices like HTTPS encryption, authentication mechanisms, and access controls safeguards user data and IoT device communication. Telegram’s messaging platform offers end-to-end encryption, ensuring data privacy.
Data Acquisition and Archival Storage: The tools created within this project facilitate data monitoring and recording throughout various plant project phases, enhancing the potential for future predictive analytics related to potential bioleaching plant failures.
Scalability and Adaptability: The architecture is designed for scalability, accommodating additional IoT devices and users without compromising system performance. Horizontal scaling can be achieved by adding more server instances behind Nginx to distribute the load. To facilitate ongoing component evolution, a comprehensive developer’s manual with technical implementation guidelines and optimal change strategies has been compiled, available in [
26].
4. Discussion
In this work, we provide an automated approach aimed at enabling real-time control of biologically based industrial processes, leveraging the capabilities of open-source software and fortified with robust alarm functionalities. The resultant Android app embodies versatility, replicability, and scalability, while the adaptable API design opens up a realm of possibilities for innovative user interfaces. The API interface is intuitive and visual, easily reflecting each of the plant components. It has been tested and successfully deployed.
In our HTTP experiments, we observed rapid data transmission. Nonetheless, recent studies (see for example the works in [
39]) indicate that MQTT, while generally lauded for its power efficiency, showed a 4.1% daily battery saving when using 3G technology by maintaining a stable connection over HTTPS. Another study found HTTPS [
40] to be marginally more efficient in connection establishment. This suggests that HTTPS offers benefits in terms of connection efficiency, making it a promising choice in IoT for addressing power consumption. Future research should consider additional MQTT tests in the context of the bioleaching plant’s software and hardware.
The system’s design prioritizes flexibility, allowing seamless adaptation to forthcoming physical network standards like 4G or 5G across various data transmission protocols (such as HTTPS, MQTT, XMPP, etc.), ensuring ease of conversion. It is important to remember the inherent limitations of hardware components, such as the DHT11 temperature sensor, which can sample data at a maximum rate of once every two seconds. In many cases, the system’s speed hinges on these physical sensor limitations.
5. Conclusions
A comprehensive data pipeline has been effectively developed to monitor and control a bioleaching plant for the recovery of metals from e-waste, encompassing a spectrum from data extraction and the upload of Server Web Services, all the way through the inference phase where incident reports are automatically generated and distributed via Telegram. These processes function seamlessly within an intervention-free framework. Furthermore, this achievement is complemented by an application that streamlines the monitoring of all key parameters of the bioleaching plant processes and enables direct control and corrective actions of its physical components.
Highlighting the model’s prowess in discerning various process behaviors is crucial. This capability, coupled with an operator’s expertise, holds substantial potential for delivering considerable value. Moreover, the model’s capacity to offer alerts in specific scenarios has demonstrated that this proposal amplifies the efficiency and robustness of the operation. Detailed graphical reports provide comprehensive insights, depicting process trends and showcasing the evolution of each component over recent weeks or months in an intuitive environment for non-specialized staff. These reports aid in identifying patterns or anomalies such as color sensor behavior, facilitating the detection of issues such as mixing misalignments, valve malfunctions, or similar failures in order to start a quick automatic correction.
Looking ahead, we identify several promising avenues for future endeavors. Potential next steps may encompass the development of an iOS app, or the establishment of a web-based platform endowed with comparable plant-related functionalities. Our adaptable API empowers the creation of additional applications without intrinsic constraints, paving the way for pioneering solutions in the field. CSV files containing measurement parameters from station activities are systematically preserved, facilitating future studies involving both received and computed data, including predictive analytics.
Results presented herein demonstrate that integrating automated predictive studies in research, combined with the amassed data, ultimately lead to the development of a completely automated system guaranteeing high standards of quality with the minimum human intervention.

 ,
, 
