Article

Quantification of the Influence of Ink Penetration and Optical Ink Density on the Print-through of Printed Straw-Based Papers

Faculty of Graphic Arts, University of Zagreb, Getaldićeva 2, 10000 Zagreb, Croatia
*
Author to whom correspondence should be addressed.
Appl. Sci. 2024, 14(1), 288; https://doi.org/10.3390/app14010288
Submission received: 25 November 2023 / Revised: 22 December 2023 / Accepted: 26 December 2023 / Published: 28 December 2023

Abstract

:
In recent years, due to environmental awareness regarding the harmfulness of polymeric materials, there has been a growing interest in using papers, especially those from alternative raw materials. The importance of using all available raw materials is imperative today. Raw materials that were once viewed as waste are now of great importance because they have the ability to replace raw materials that are used irrationally or are lacking. Cereal straw is a lignocellulosic material that could be used in the paper industry and in the production of increasingly prevalent paper packaging. The aim of this research was to analyze the relationships between the qualitative parameters of straw-based printed papers containing 30% agricultural residues (wheat, barley, or triticale). The influence of two qualitative parameters (ink penetration depth and optical ink density) on the print-through was observed using multiple regression analysis on straw-based papers produced at the laboratory level. Throughout the research, 100% recycled wood paper was used as a reference sample. The results of the regression analysis showed that none of the variables individually make a statistically significant contribution to the prediction of the dependent variable in a linear context, that is, they indicate a non-linear interaction between the variables and the specific conditions under which the dependent variable reaches local extremes and changes in the gradient. Considering the results of the regression analysis and the visualization of the relationship, the model was additionally tested with other independent variables (paper type). From the results obtained, it can be concluded that the alternative straw-based paper with 30% barley pulp has the best interaction between ink and paper, which is the most similar to the reference sample in terms of printability, while the alternative straw-based paper with 30% wheat generally differs significantly from the reference paper when all three prints are considered.

1. Introduction

Graphic papers constitute approximately one-third of the world’s total paper production, with packaging paper accounting for more than half of this output. Leading paper-producing nations, such as China, the United States of America, and Japan, are collectively responsible for half of global paper production. Over the last four decades, there has been a staggering 400% increase in the global demand for paper, a trend that is poised to persist [1]. Overall demand for graphic papers declined by 1.8% last year, which can be attributed to a shortage of raw materials and soaring utility costs. Simultaneously, available data for the first nine months of the same year showed an increase in demand for packaging paper and board of 0.5% [2]. One undeniable drive behind the increased use of paper and cardboard is the on-going shift towards more sustainable and environmentally friendly materials, replacing plastics. In recent years, due to environmental awareness regarding the harmfulness of polymeric materials, there has been a growing interest in using paper as an alternative raw material from non-wood sources of cellulose fibers in order to preserve wood as the basic raw material of the paper industry in natural habitats. The biggest changes concerning the usage of raw materials are in the area of packaging, where it is extremely important that the materials used, in addition to the function they must fulfill, are also environmentally friendly, sustainable, and biodegradable. Much of the current research is focused on analyzing the utilization of non-wood sources from various annual or perennial plants, depending on availability, from which cellulosic fibers of the same quality as from wood sources can be obtained, which at the same time provide a fast-growing, renewable, and cost-effective fiber source. Additional requirements in the production of paper intended for printing must consider the interaction of the printing substrate and printing ink, which is very important for the quality of the print. Looking ahead, it is anticipated that even with recycling efforts, there will still be an insufficient supply to meet the mounting demand for paper. This demand surge is primarily due to excessive deforestation, a concern that has gained prominence among environmental organizations dedicated to preserving the Earth’s forested areas [3]. Thus, it is imperative to explore alternative sources of cellulose fibers, distinct from wood, to bridge the potential deficit in pulp and paper production. Although non-wood sources were used in Chinese papermaking as early as the 1st century AD, their wide-spread utilization waned after 1840, when the German inventor Gottlob Keller developed a process for producing pulp and paper from raw wood [1,3]. In theory, virtually every plant contains a viable amount of fiber that could serve as a raw material for pulp and paper production. However, a suitable plant for this purpose must possess qualities such as high yield, renewability, excellent pulping characteristics, adaptability to the regional climates, and cost-effectiveness [1,4].
Recent years have witnessed a growing interest in using alternative sources of cellulose fibers for paper production [5]. Nevertheless, their use still accounts for less than 11% of the global production of pulp and paper. These non-wood fiber sources are broadly classified into three categories based on their origin: agricultural by-products (e.g., sugarcane bagasse, corn stalks, cotton stalks, rice straw, and wheat straw), naturally growing plants (e.g., bamboo, esparto, reeds, Sabai grass, papyrus, Napier grass, and invasive alien plants), and industrial crops (e.g., ramie, cotton fiber, kenaf, abaca, and jute) [6,7]. With wheat consumption in the European Union at 108 million metric tons in 2022 and nearly 150 million metric tons in China, and global cereal consumption expected to increase by 0.8 percent in 2023/24, the remains of wheat straw after mowing are considered a potential alternative for the source of cellulose fiber for paper production [8,9,10].
The primary objective of this research is to study the influence of ink penetration and optical ink density of prints on the print-through using the gravure printing process on paper substrates containing 30% agricultural residues, with a focus on wheat, barley, and triticale. In this research, the selection of gravure printing technology was driven by its prominence in achieving high-quality printing with a wide spectrum of color tones, a performance made possible by the inherent porosity of the paper, characterized by numerous tiny openings called pores or voids. Given that knowledge about the possibility of printing paper from alternative raw materials as a substitute for wood is incomplete, the need for this research arose. There is a lack of data observing the reciprocal influence of quality parameters on the printability of innovative printing substrates, especially based on important quality parameters such as ink penetration depth, optical ink density, and print-through. This choice highlights the crucial role of the paper composition in influencing the interaction between ink and paper as well as its impact on the permeability properties [11]. The gravure printing process, characterized by the use of low-viscosity inks, yields ink coverage ranging from 0.8 µm to 2 µm. This capability enables high-quality printing on substrates with thicknesses ranging from very thin films (approximately 200 µm) to thicker cardboard (approximately 800 µm) [12,13]. This technology is used in the fastest-growing segment of the graphic industry: the production of packaging and labels. Environmentally friendly packaging and labels make paper the first choice in the food industry as primary or secondary packaging [14].

2. Materials and Methods

2.1. Raw Material for Paper Pulp Production

The first phase of paper pulp preparation consisted of collecting straw left over after the grain harvest in the fields of central Croatia from three types of cereals: wheat (Triticum spp.), barley (Hordeum vulgare L.), and triticale (Triticale sp.). After purifying and removing grain and dirt residues, the straw of each cereal type was cut into smaller pieces (10–30 mm) and processed into a semi-chemical pulp, in which delignification was carried out using the soda pulping method under highly alkaline conditions (16% NaOH) and a high temperature (120 °C) for 60 min [15]. The pulp slurry was removed from the black liquor by decantation and rinsed with tap water. The fibers suspended in a water slurry (23 L of tap water) were refined using a Höllander Valley beater (Techlab Systems (TLS), Spain) at 24 °C for 40 min. In addition, pulp was prepared from recycled wood fibers for the production of a reference paper sample and for blending with each cereal straw pulp at a weight ratio of 70%.

2.2. Laboratory Production of Paper Substrates

From previously prepared pulp, paper sheets were produced under laboratory conditions using the Rapid-Köthen sheet former (FRANK-PTI), according to the EN ISO 5269-2:2004 standard [16] presented in Table 1.
Overall, four different types of paper substrates were obtained:
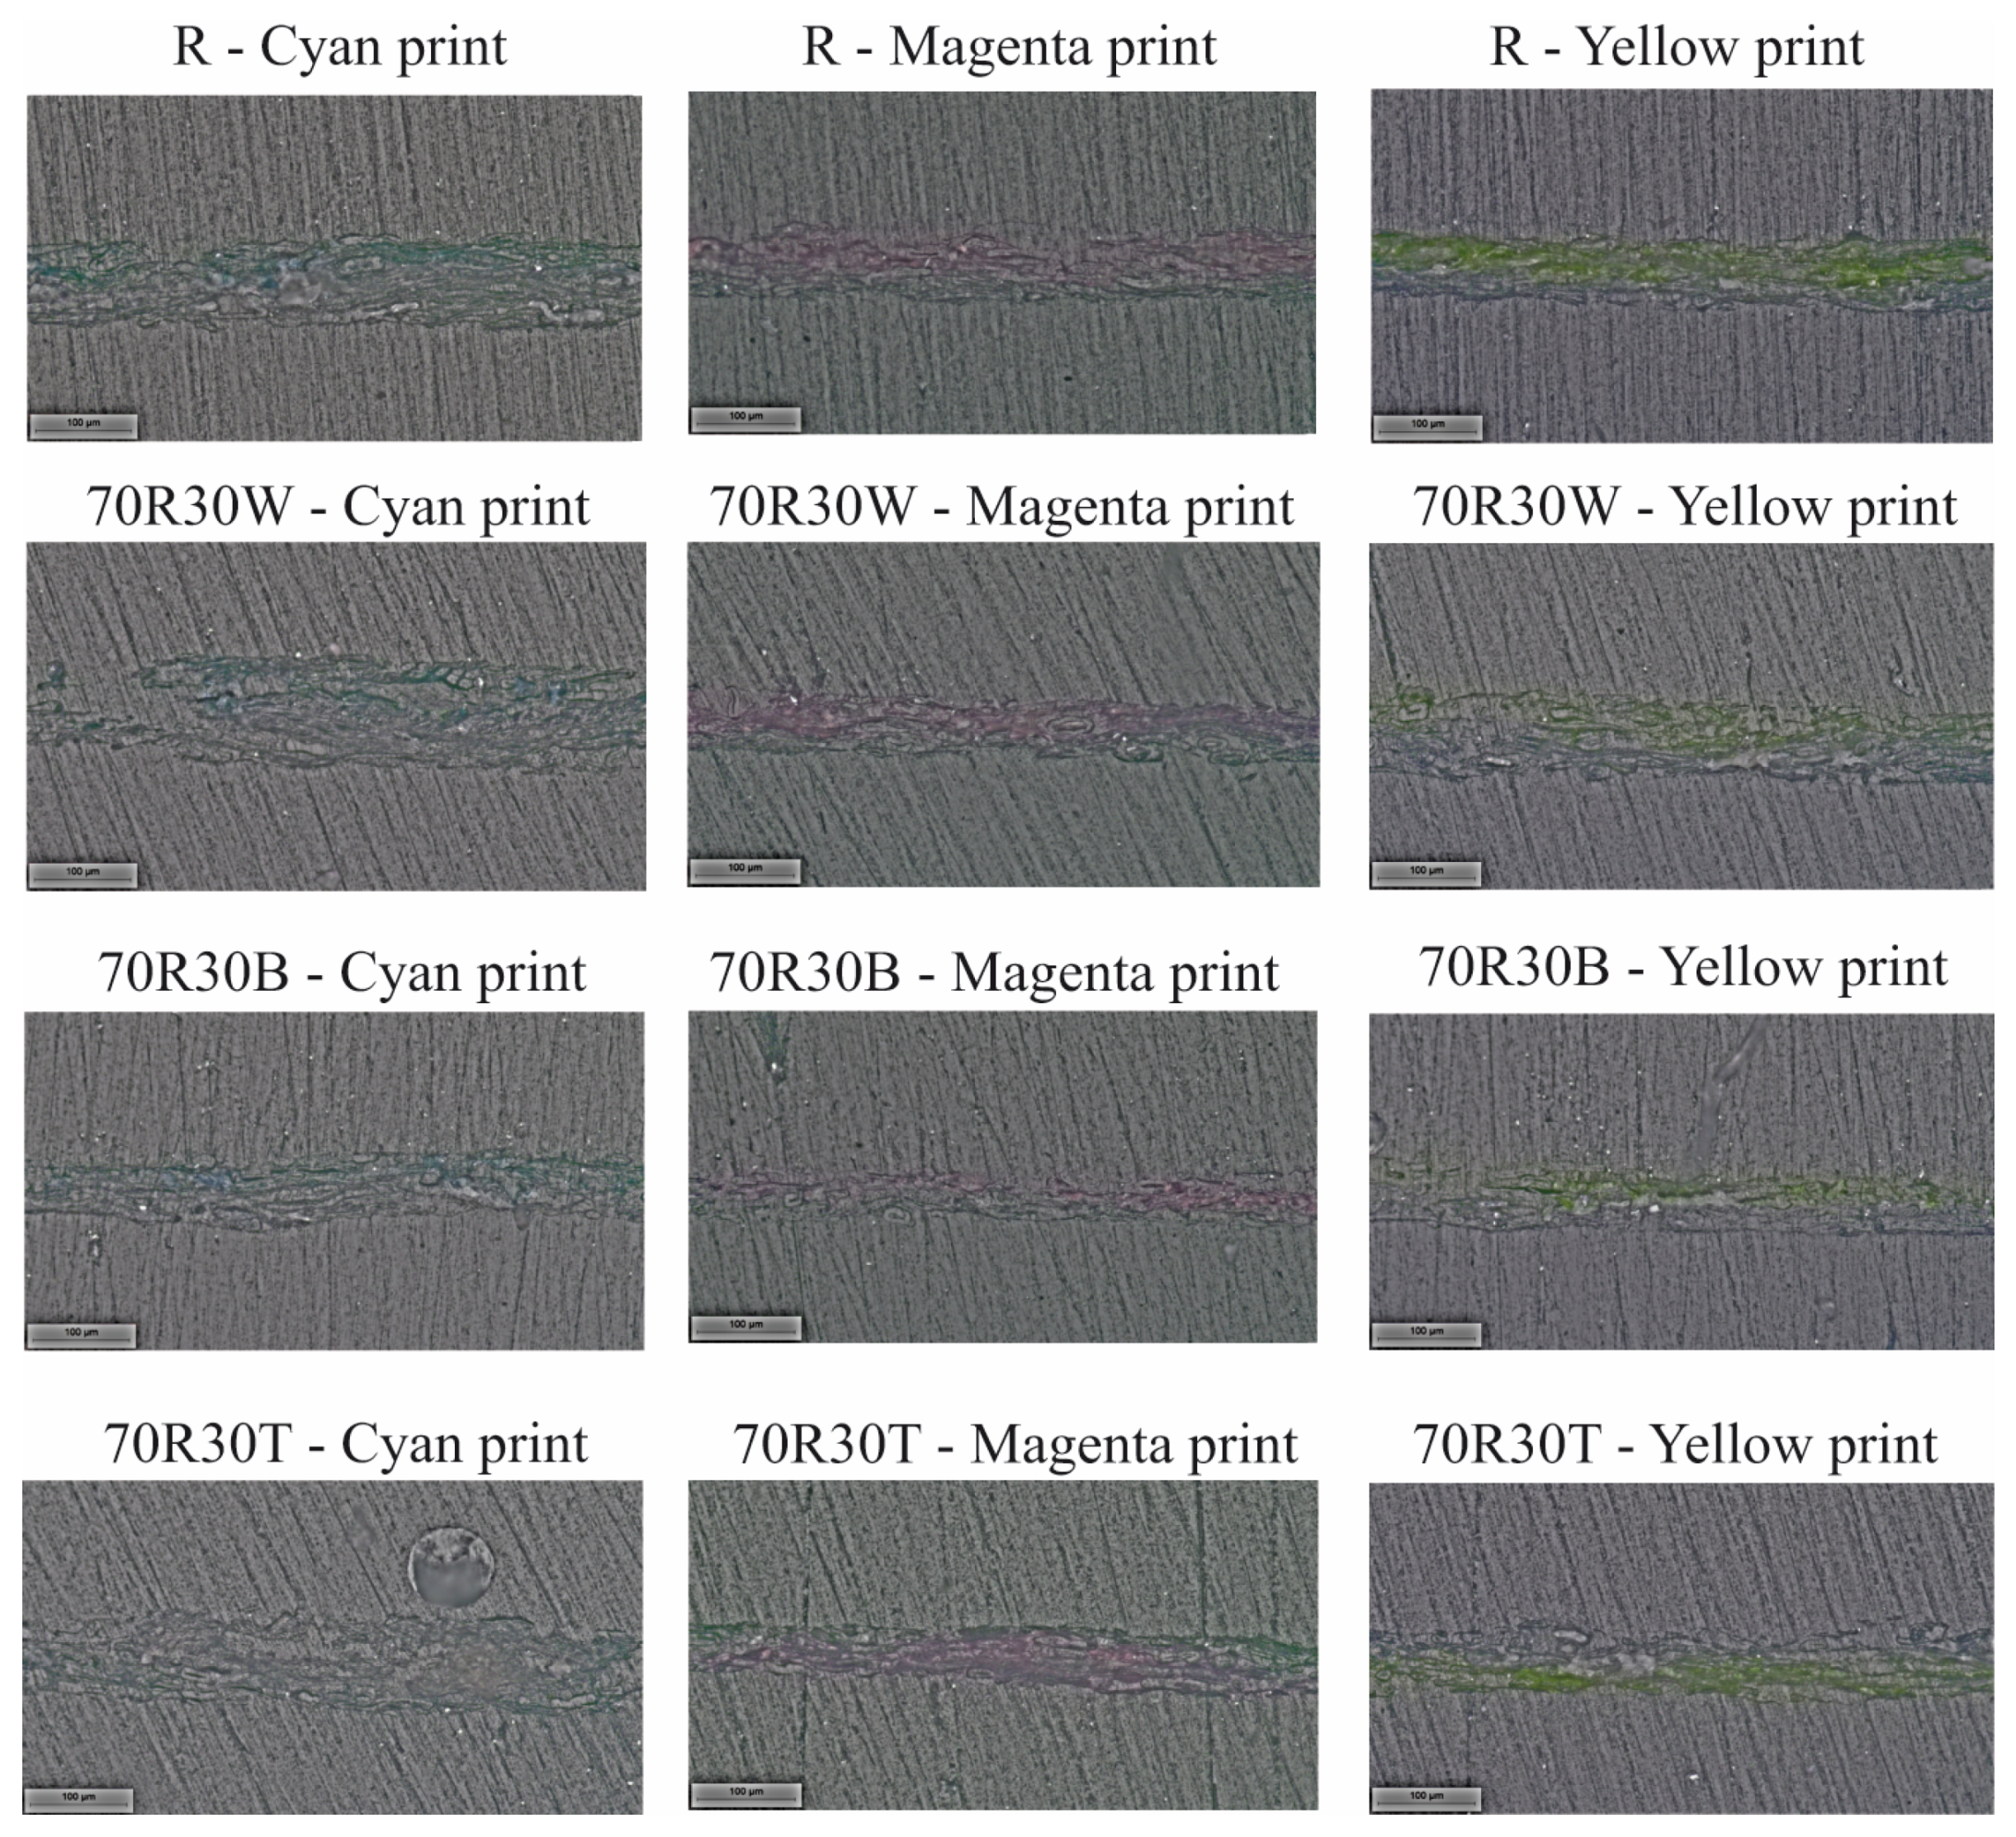
  • R—reference paper substrate with 100% recycled wood pulp;
  • 70R30W—paper substrate with 30% wheat straw pulp and 70% recycled wood pulp;
  • 70R30B—paper substrate with 30% barley straw pulp and 70% recycled wood pulp;
  • 70R30T—paper substrate with 30% triticale straw pulp and 70% recycled wood pulp.
On each paper substrate, 10 samples were formed in a circular shape with a diameter of 200 mm and a weight of approximately 42.5 g/m2. The properties of the obtained paper substrates are shown below in Table 2.

2.3. Printing on Paper Substrates

Printing was performed on a KPP Printing Proofer Gravure System (RK Print Coat Instruments Ltd., Royston, UK) using Sunprop low-viscosity gravure inks (Sun Chemical, Parsippany, NJ, USA). All paper substrates were printed with an engraved printing plate at an angle of 37° using a diamond needle at an angle of 130° with a screen frequency of 100 lines/inch in full tone with a single layer of cyan (C), magenta (M), and yellow (Y) inks. The printing conditions were as follows:
  • temperature: 23 °C;
  • relative humidity: 50%;
  • printing speed: 20 m/min;
  • engraving plate: 100 lines/inch (40 lines/cm);
  • impression roller with a mechanical hardness of 65 Shore.
All prints were air dried for 24 h under the same conditions as the printing process.
Table 3 shows the viscosity values of the inks used, which were measured at a temperature of 23 °C and a relative humidity of 50% using a DIN 4 cup. The kinematic viscosity was determined from the flow time and calculated according to the DIN 53211 standard [24].

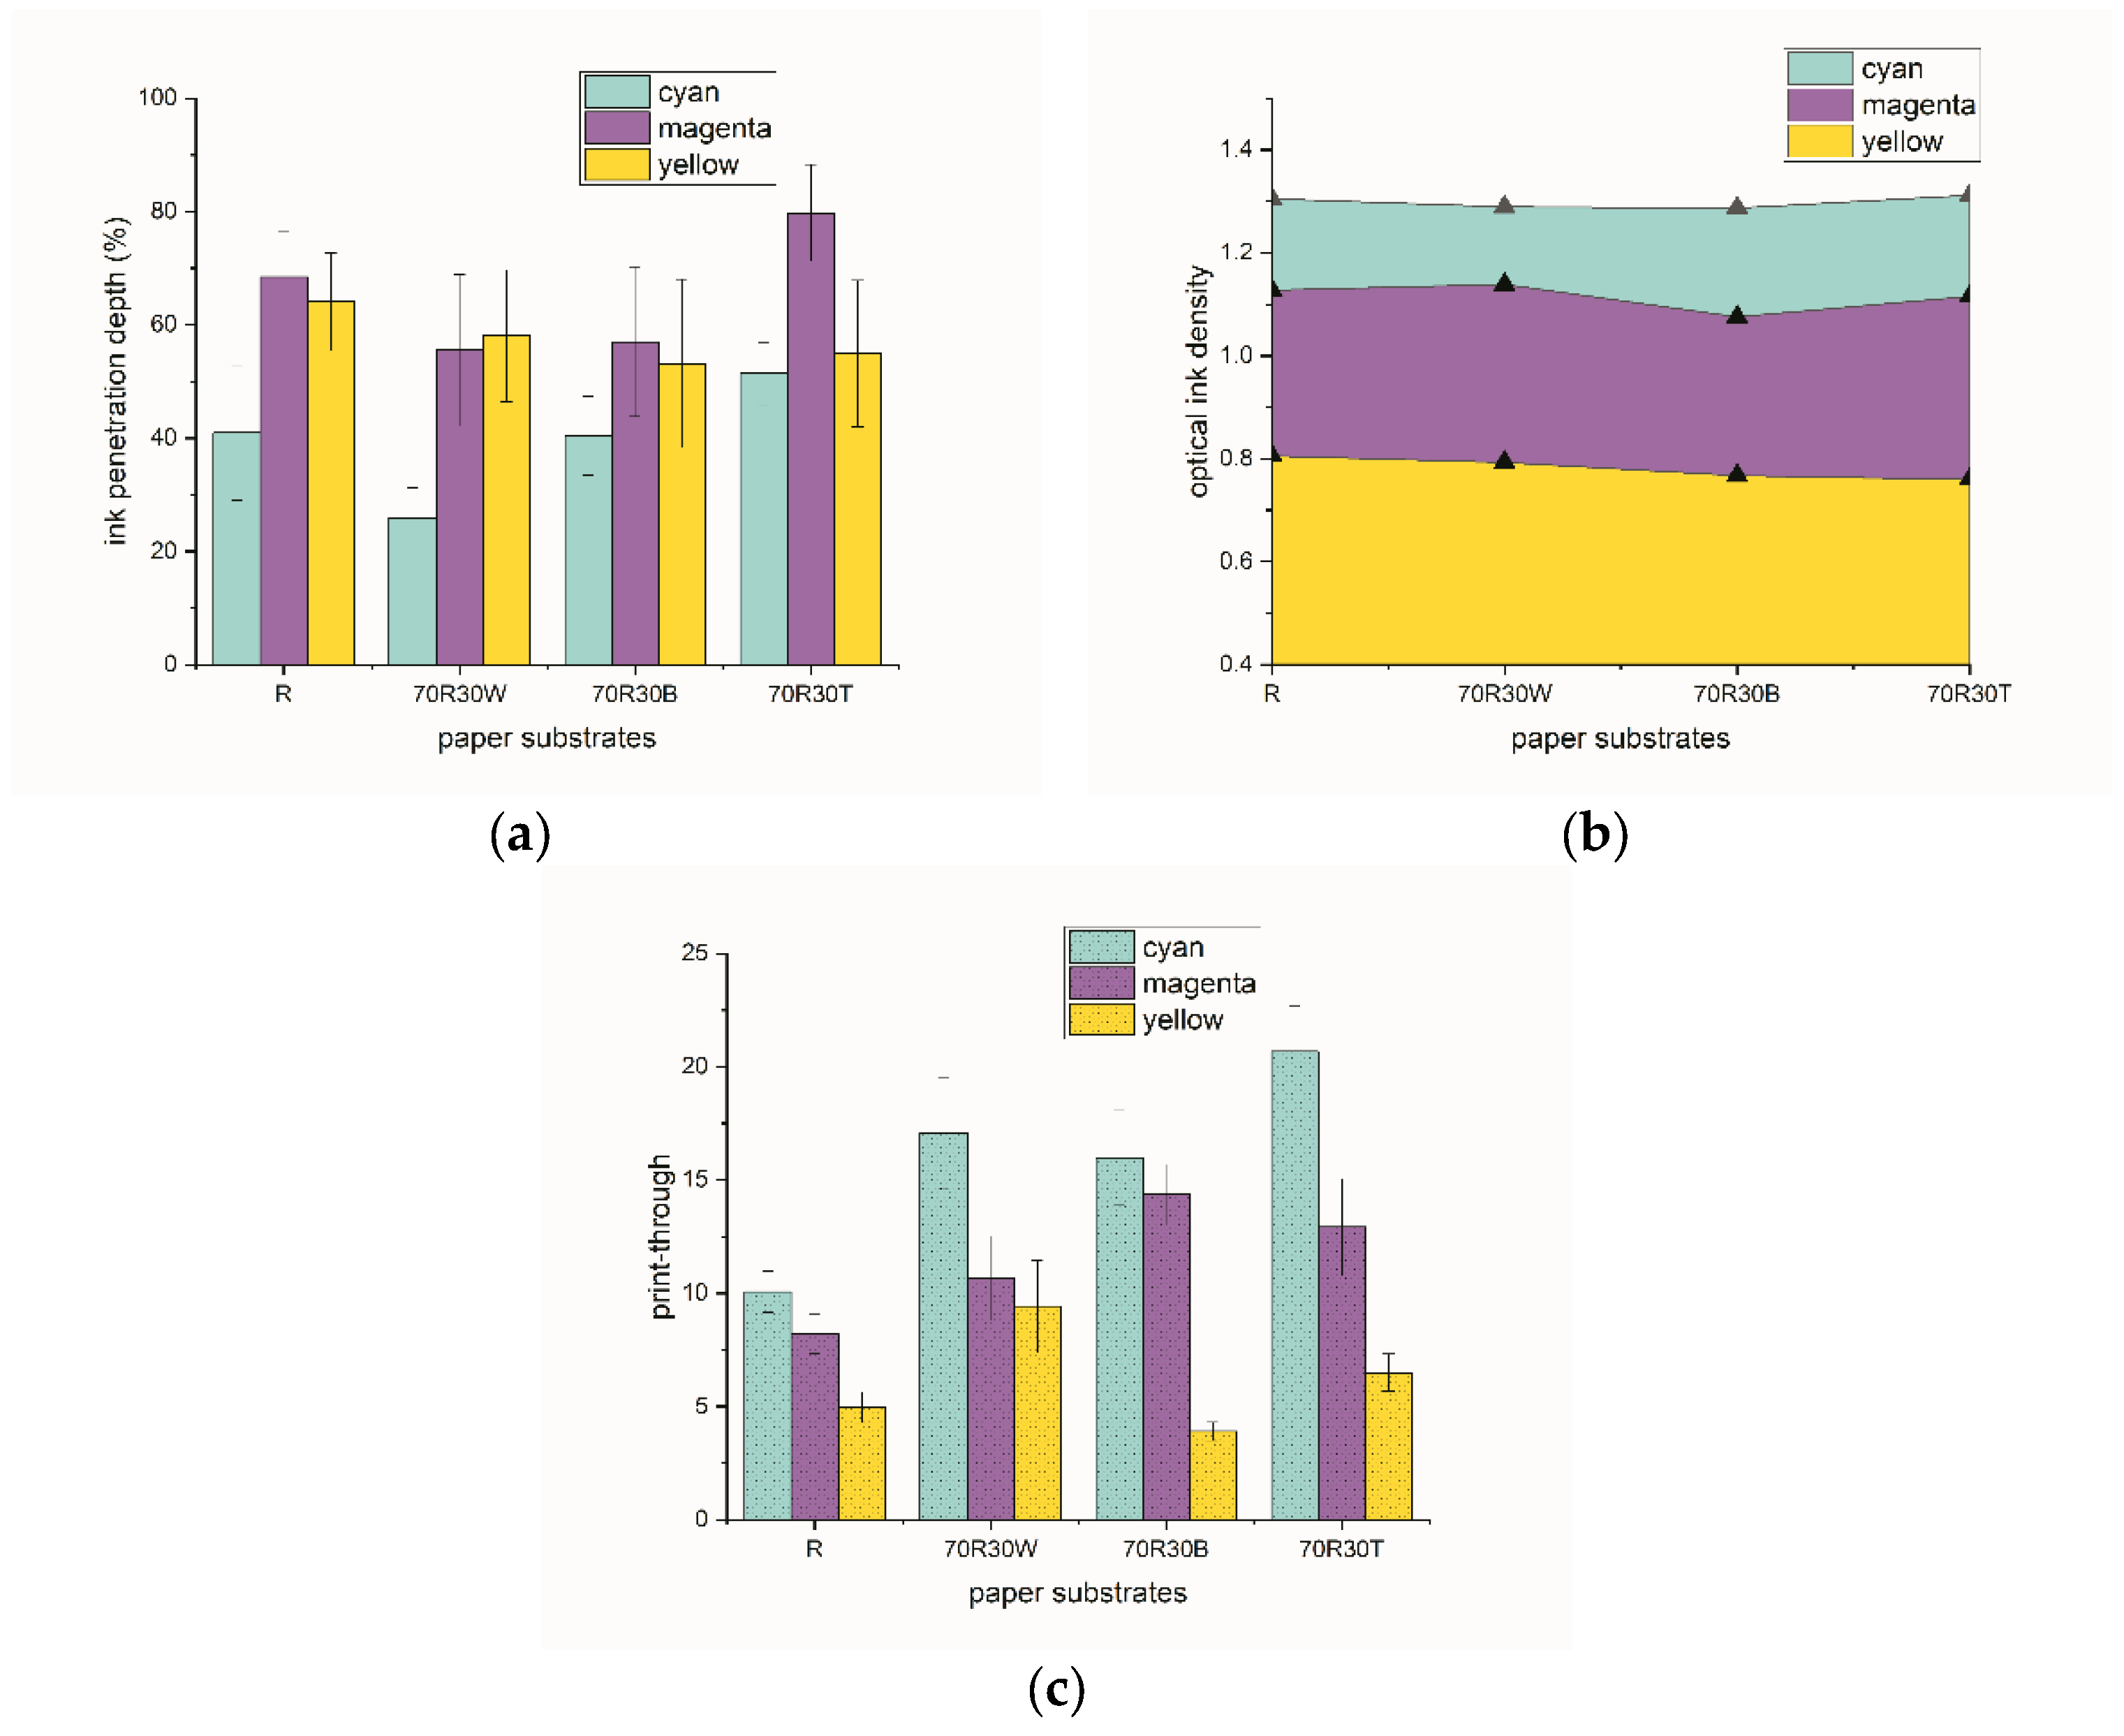
2.4. Ink Penetration Depth

The penetration of the printing ink into the paper substrate was observed on the basis of the cross-section of the printed samples. The prepared printed samples of size 10 mm × 30 mm were dipped into an epoxy resin mixture of Epofix (containing bisphenol A diglycidyl ether) and Epofix hardener (containing triethylenetetramine) in a volume ratio of 15:2. The molded samples were dried for 12 h at room temperature without pressure. Using a Buehler grinding machine and a Struers DAP-V polishing machine, the specimens were ground and polished with different grits of abrasive paper and polishing pastes to obtain a smooth cross-sectional surface. The cross-section was photographed with the Olympus GX 51 light microscope at 200× magnification and analyzed with the AnalySIS® Materials Research Lab software. The images were further analyzed using ImageJ 1.54 software (bundled with Java 8) on 10 sections to determine the thickness of the paper. The maximum penetration depth of the ink (Hpm) was calculated using the following equation:
H p m = l d × 100
where l is the maximum ink penetration value of the observed section and d is the local paper thickness.

2.5. Integral Optical Ink Density
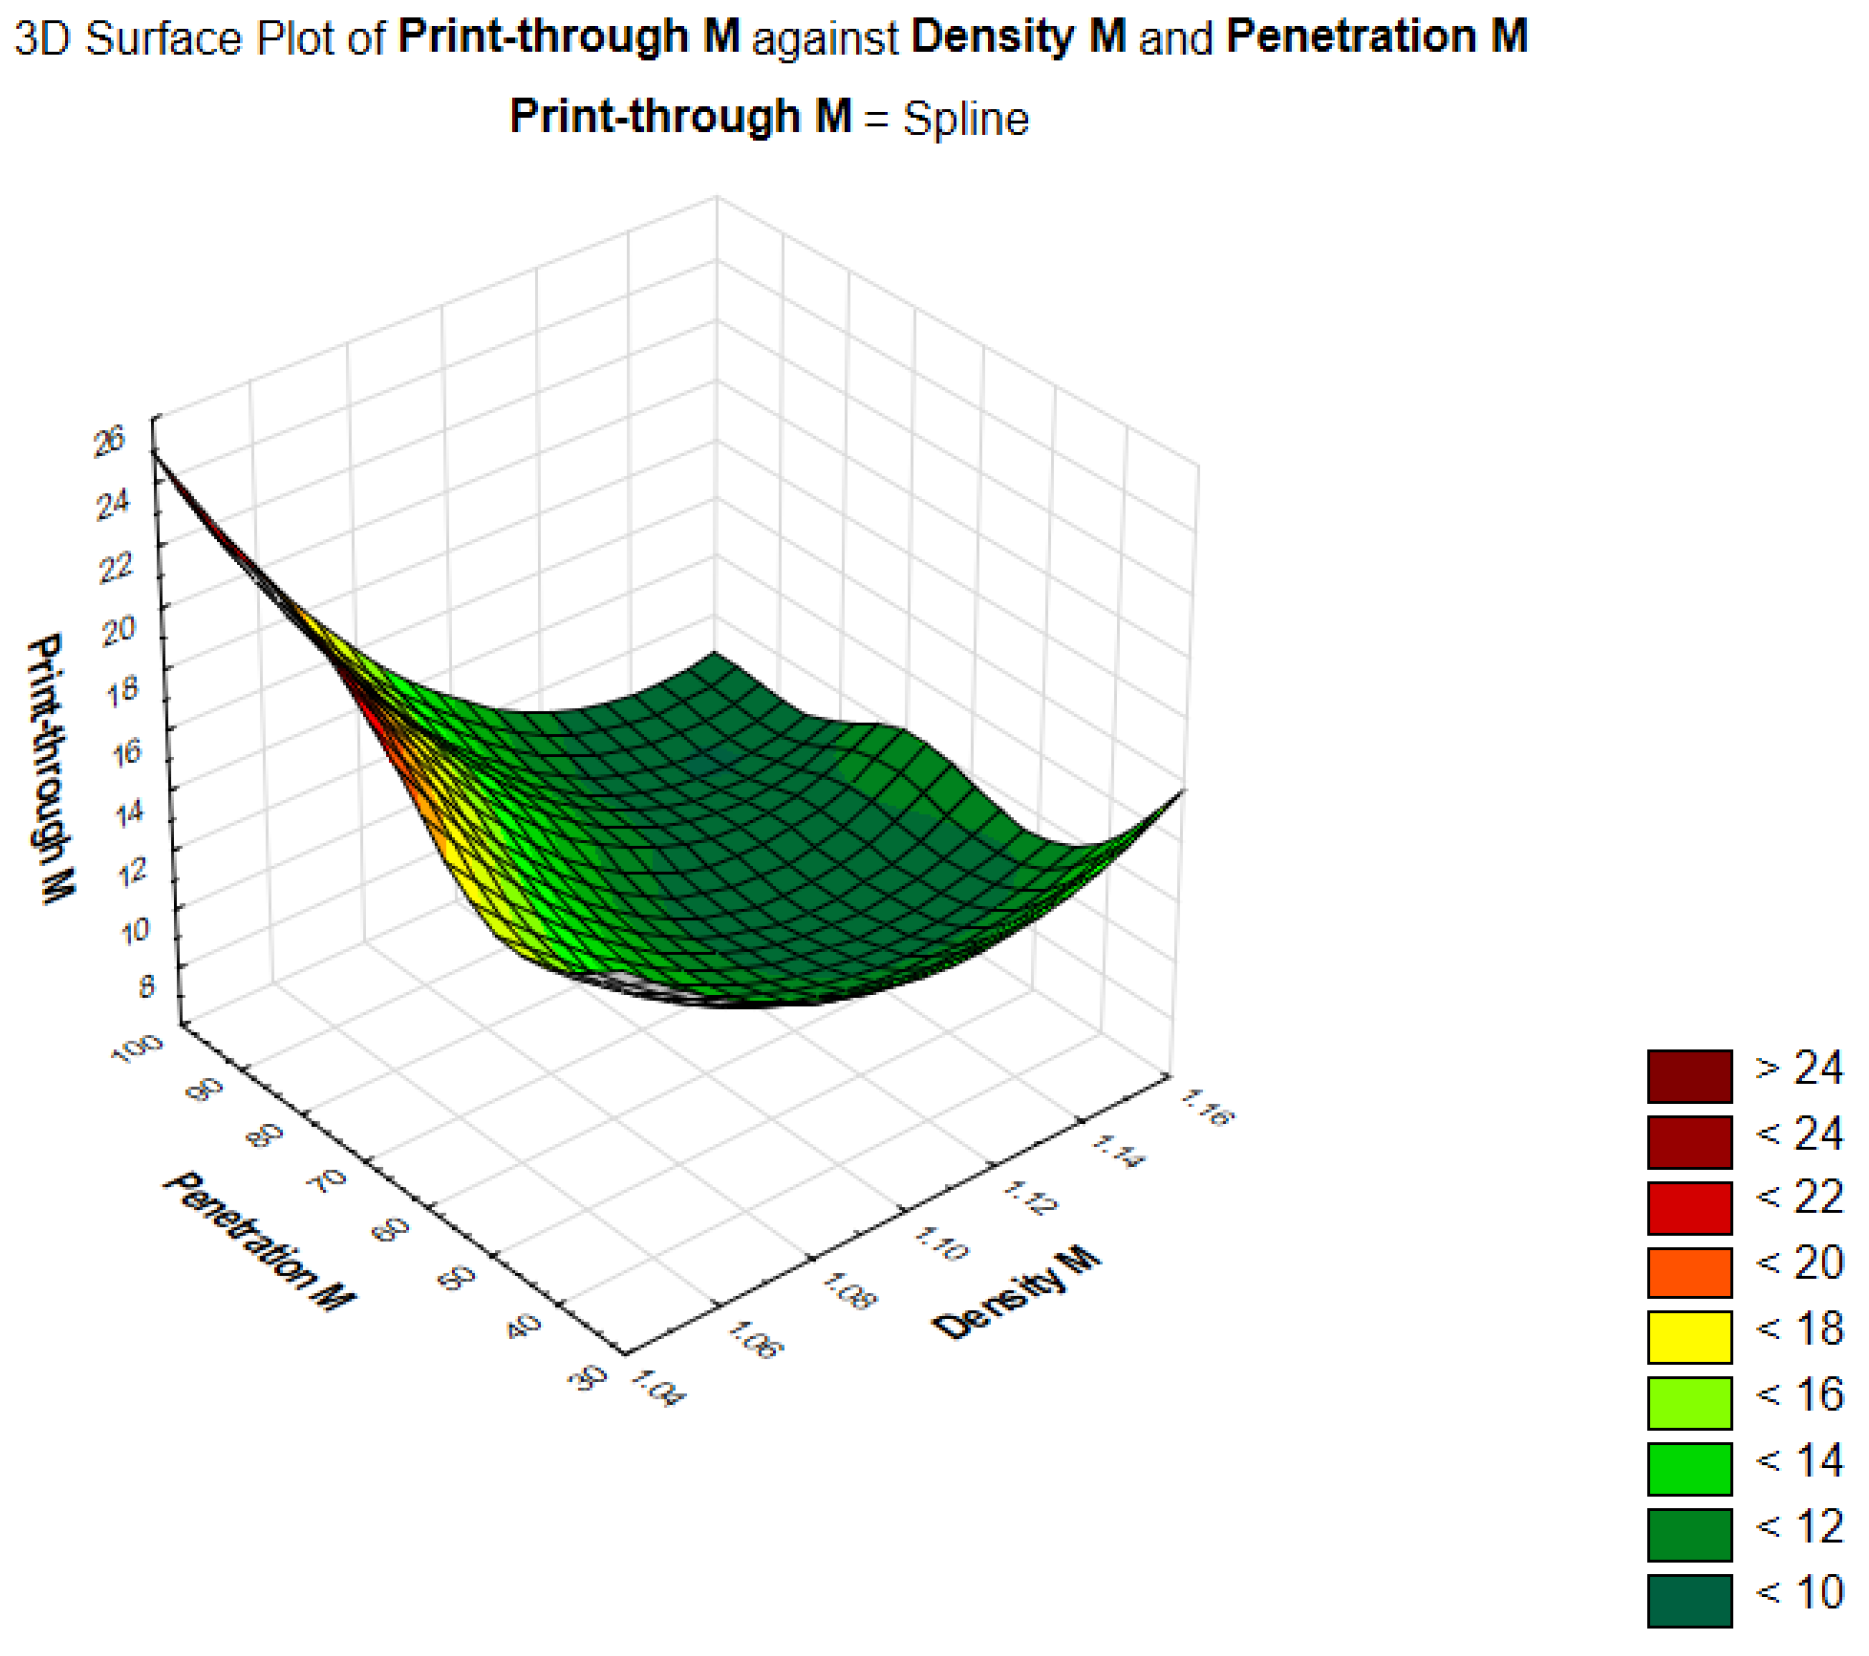
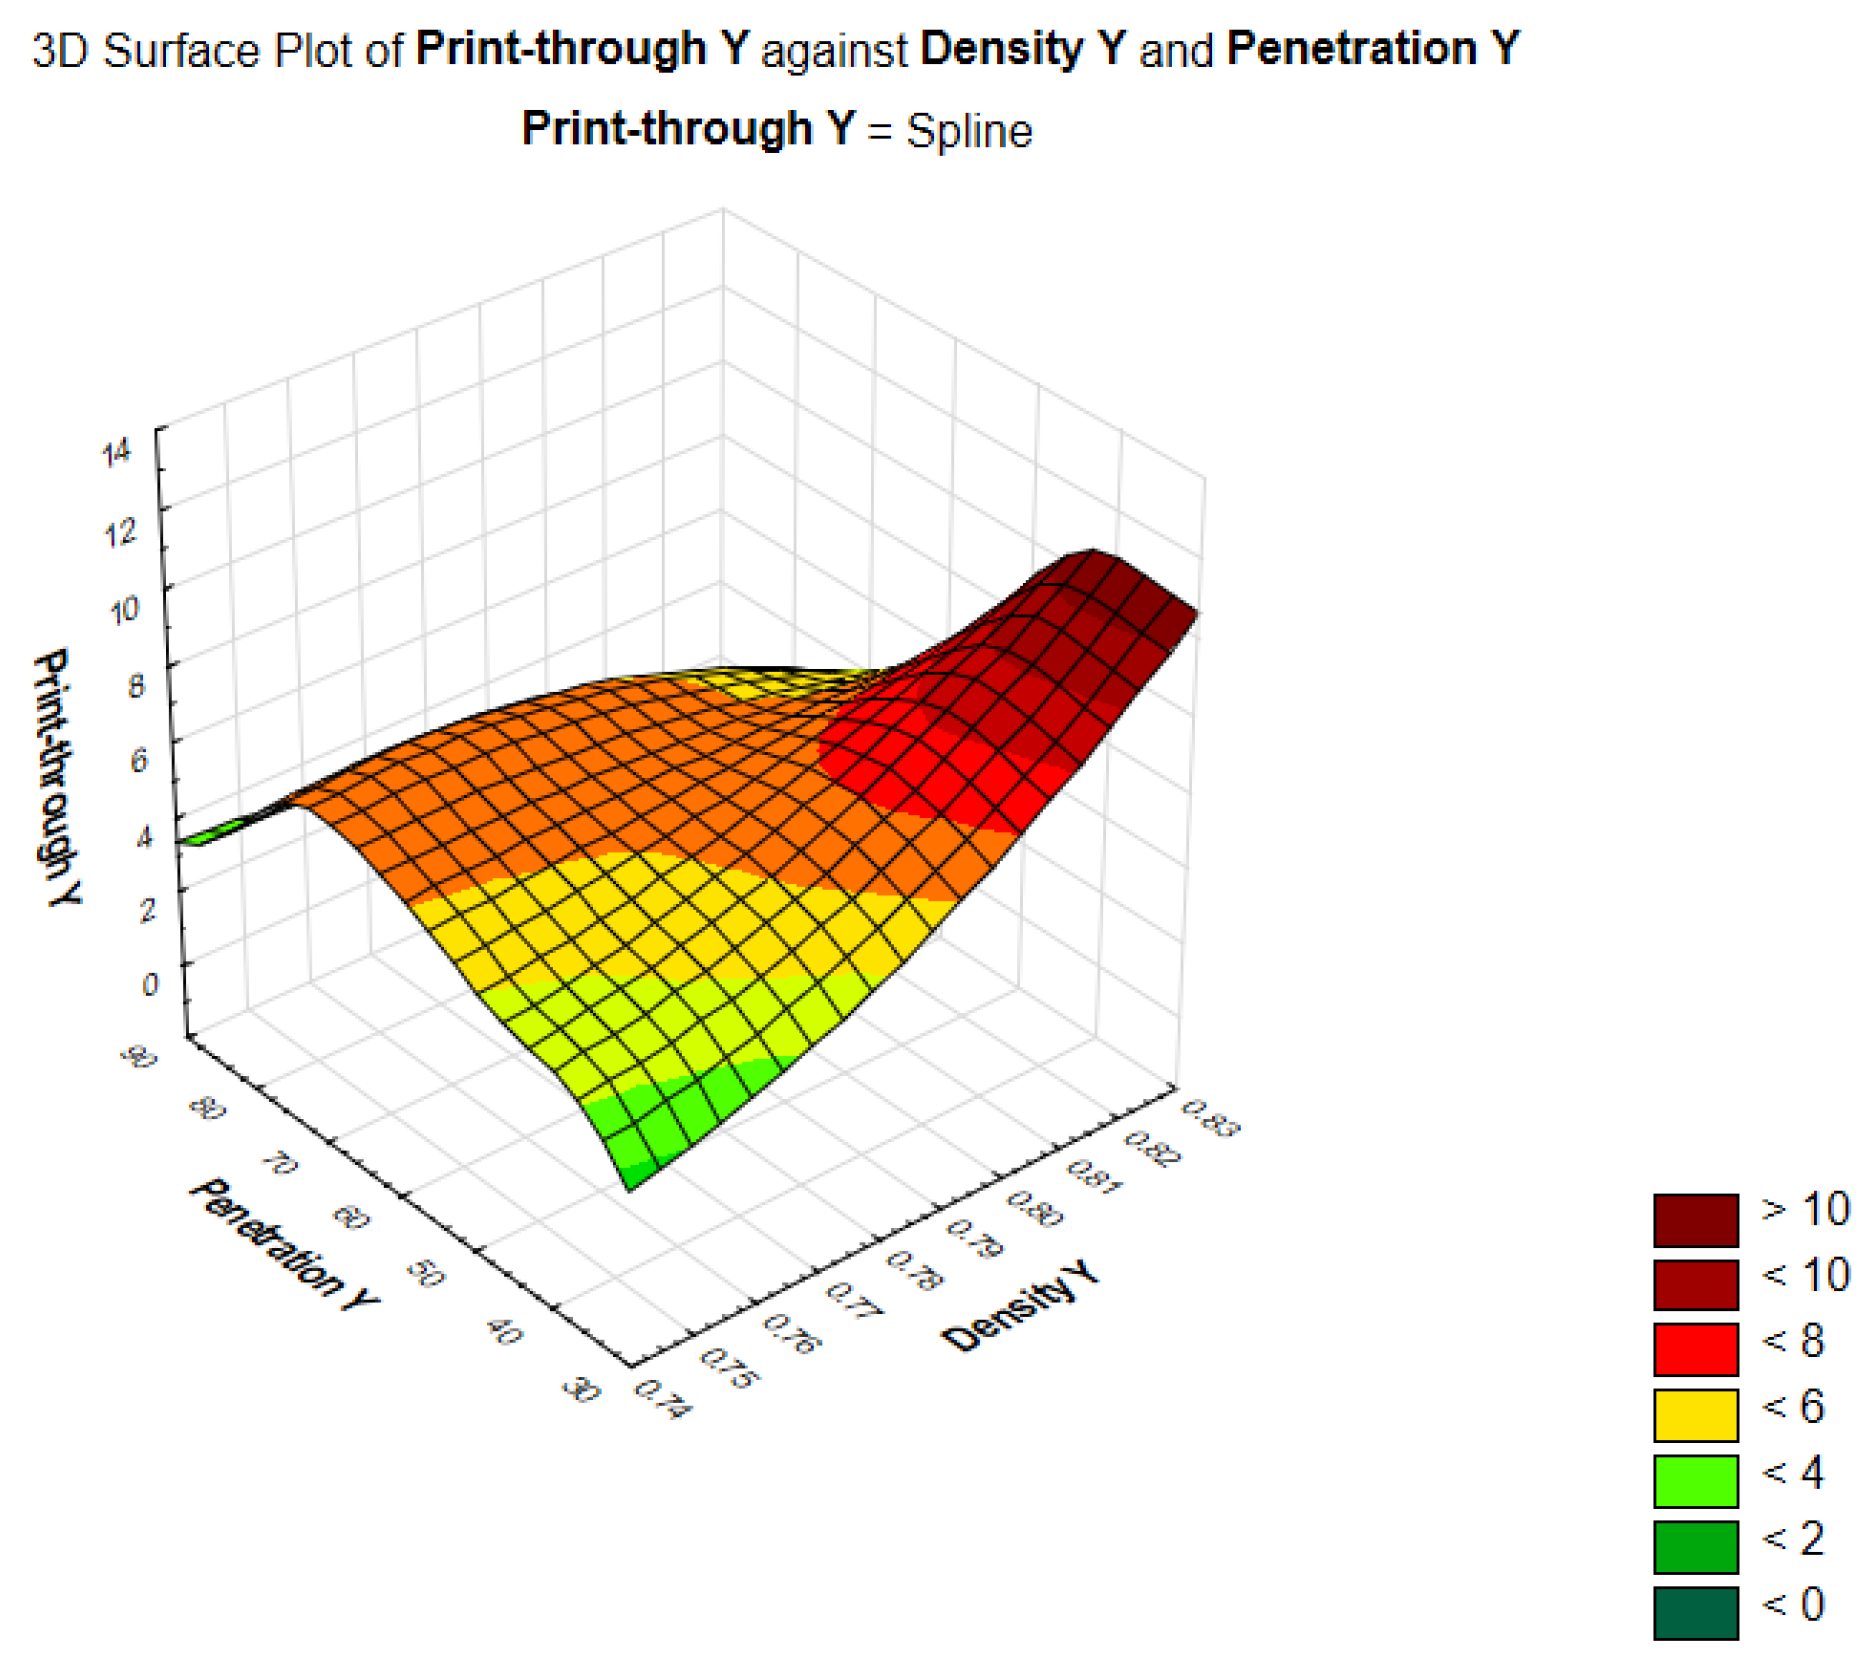
The integral optical ink density (Di) of cyan, magenta, and yellow prints was determined according to Equation (2).
D i = l o g   I 0 I R
where IR is the value of the light intensity reflected by the printed ink layer and I0 is the light intensity transmitted and reflected by the unprinted paper substrate.
The average optical ink density was determined from 10 measurements using an X-Rite Exact densitometer with illuminance D50 and a 2° standard observer.

2.6. Print-through

The surface topography plays a decisive role in ink adhesion and transfer, especially on laboratory paper that is not additionally industrially calendered and has a rough surface structure. Several factors influence the penetration of the ink into the substrate, including the printing pressure, whether it is a single or multi-layer print, the properties of the ink, the substrate properties, and the environmental conditions during the printing process. The print-through, a qualitative measure, characterizes the visibility of the ink on the reverse side of the paper substrate. This phenomenon occurs when the opacity of the paper decreases due to the infiltration of the ink vehicle after printing, the penetration of the ink pigments into the paper, and the inherent transparency of the paper itself. Print-through is precisely defined as the appearance of a thin layer of ink on the paper substrate that is visible through a white background [25,26].
The color difference (ΔE*00) between the CIE colorimetric values L*, a*, and b* on the white background of the printed paper substrate and the white background of the unprinted paper substrate was used to calculate the print-through. These colorimetric values were determined with a spectrophotometer (X-Rite Exact, D50/2°), and Equation (3) was used to calculate the color difference.
Δ E 00 * = Δ L k L S L 2 + Δ C k C S C 2 + Δ H k H S H 2 + R T Δ C k C S C Δ H k H S H
where ΔL′ represents the transformed lightness difference, ΔC′ represents the transformed chroma difference, ΔH′ represents the transformed hue difference, RT is the rotation function; kL, kC, and kH represent the factors for the variation in the experimental conditions; and SL, SC, and SH are the weighting functions.

2.7. Quantitative Methods

A multiple regression analysis was performed to analyze the relationships among multiple metric variables (Density, Penetration, and Print-through) using TIBCO Statistica® 13.5.0.17 advanced analytical software.
Multiple regression analysis is a key method in the quantitative research of this study. It is a statistical technique that enables the simultaneous investigation of the effects of several independent variables (predictors) on a single dependent variable (criterion) [27]. Although this method is based on the assumptions of a linear relationship between the observed variables and the main objective is to determine how well the independent variables predict the dependent variable and to understand the nature of their interactions, it is also suitable for non-linear relationships. In cases of non-linear relationships, multiple regression analysis can be modified to fit non-linear patterns by transforming the independent or dependent variable through logarithmic, quadratic, cubic, or other types of transformations to linearize their relationship [28].
In this analysis, the impact of multiple independent variables, or predictors in this case, and types of paper on the dependent variable of Print-through was observed.
Mathematically, the multiple regression analysis can be represented as:
Y = b 0 + b 1 X 1 + b 2 X 2 + b 3 X 3 + + ϵ
where Y is the dependent variable; b0 is the y-intercept; b1, b2, b3, … are the regression coefficients indicating the strength and direction of the influence of the independent variables; X1, X2, X3, … are the independent variables; and ϵ is the error of the estimate [29].
Multiple regression analysis using Wald statistics is an advanced method that facilitates a detailed exploration of the relationship between a dependent variable and several independent variables. The focus is on determining the significance of the influence of each independent variable on the dependent variable, considering the presence and influence of other variables in the model. To assess the statistical significance of each regression coefficient, the Wald test is used, which is an essential part of this analysis. This test is determined by squaring the ratio between the estimated coefficient and its standard error. The resulting statistic is then compared with values from the χ2 distribution to determine the p-value [30].
This method was used because it allows us to determine exactly which factors are statistically significant and therefore crucial for understanding the dynamics of the dependent variable.

3. Results

In order to define the usability of paper with agricultural residues for secondary packaging and labels, the influence of ink penetration depth and the integral optical density of prints on the print-through was investigated. When analyzing the cross-sections of the printed samples with and without agricultural residues in epoxy resin (Figure 1), the maximum penetration values were recorded at 10 points where ink penetration into the paper substrate was observed. The results are shown as mean values in Figure 2a.
Based on the qualitative characteristics of the printed paper substrates, it is clear that there are differences in the prints depending on the color of ink used. Observing the ink penetration depth parameter (Figure 2a), it is evident that the prints obtained with cyan ink show the lowest ink penetration (Hpm = 25.90–51.42%) inside the paper substrate, while the highest ink penetration was achieved with magenta (Hpm = 55.50–79.76%) and yellow ink (Hpm = 53.16–64.08%). Regarding the optical ink density parameter (Figure 2b), which is obtained from the light reflected by the print and describes the proportional value of ink coverage on the paper substrate [10,31], it is possible to conclude that the yellow prints show the lowest value of optical ink density (Di = 0.767–0.806), while the cyan prints show the highest value of optical ink density (Di = 1.286–1.312). The print-through parameter (Figure 2c), which can be reduced by coating and lamination, is very important for packaging and labels, whether they come into direct contact with food or not, where the background must be opaque, that is, able to hide the content printed on the reverse [31,32]. Looking at the printed paper substrates in terms of the ink used, cyan prints have the highest print values, ranging from 10.06 to 20.67, while the lowest values were measured for the yellow prints, ranging from 3.89 to 9.42.
An analysis of the data normality was conducted using the Shapiro–Wilk test for normality. The Shapiro–Wilk parametric test is employed for small sample sizes (<50) due to its sensitivity and precision in detecting deviations from normality.
Each variable was tested individually owing to the distinct characteristics of the variables, precision in interpretation, sensitivity analysis, and potential decision-making regarding transformation.
The p-value is observed, and if it is >0.05, the null hypothesis is not rejected, leading to the conclusion that the data do not significantly deviate from a normal distribution. If the p-value is <0.05, the null hypothesis is rejected, suggesting that the data are not normally distributed (Table 4).
Furthermore, for the analysis of the relationships among multiple metric variables (Density, Penetration, and Print-through), a multiple regression analysis was employed. This analysis observed the impact of multiple independent variables, or predictors in this case, and types of paper on the dependent variable of Print-through.
Previous research carried out on prints made on paper substrates with triticale pulp using the UV inkjet printing process showed a correlation between the penetration depth of the ink and the print-through parameters. Therefore, the analysis of the behavior of these two qualitative parameters together with the integral optical density in this study is based on testing the interdependence of the variables using multiple regression analysis [18].
For the cyan prints, a linear regression analysis was conducted with two independent variables, Density C and Penetration C, to evaluate their impact on the dependent variable Print-through C (Table 5).
The correlation coefficient (R) is 0.19670, indicating a very weak negative linear correlation between the independent variables and the dependent variable. However, it still exists, albeit with a very low coefficient of determination (R2) of 0.03881, explaining only about 3.88% of the variance of the dependent variable. Furthermore, the adjusted R2 is negative, which may be indicative of the model lacking predictive value, as suggested by the F-test value of 0.74693 with a p-value of 0.48083, meaning the model as a whole is not statistically significant (p > 0.05). The intercept coefficient is 12.23850, with a large standard error of 41.73720 and a high p-value, further confirming the model’s lack of statistical significance. The observed independent variable, Density C, has a regression coefficient (b*) of 0.00225 with a high standard error relative to the coefficient itself and a very high p-value of 0.98908, indicating that Density C is not a statistically significant predictor. Similarly, the independent variable Penetration C is not a statistically significant predictor, having a regression coefficient (b*) of 0.19659 with a relatively small standard error and a p-value of 0.23729. The model demonstrates a very low capacity to explain the variability of the dependent variable, and none of the predictors are statistically significant. However, additional predictors (different types of printing substrates) could improve the explanation of the dependent variable.
The regression results indicate that none of the variables individually provide a statistically significant contribution to predicting the dependent variable within a linear context. Given the very low R2 and high p-values for the coefficients, it can be concluded that the linear model is inadequate in explaining the relationship between the independent variables (Density C and Penetration C) and the dependent variable (Print-through C). Therefore, a non-linear spline model was used for data visualization. Spline models can capture more complex patterns of relationships that are not strictly linear, offering greater flexibility in data modeling. This is because spline interpolation can provide a smoother and potentially more informative representation of the relationships among variables by allowing adjustments to local variations in the data without assuming a specific functional form of the relationship between the variables.
The spline model is formulated as follows:
P T = a b × x 1 + c × x 1 2 + d × x 2 e × x 2 2 + f × x 1 × x 2
where PT is the dependent variable Print-through; x1 is the independent variable Density; x2 is the independent variable Penetration; and a, b, c, d, e, and f are coefficients that are specific to each Print-through variable.
Figure 3 shows a 3D surface plot that visualizes the relationship among three variables: the independent variables Density C (X-axis) and Penetration C (Y-axis), and the dependent variable Print-through C (Z-axis). The visible curvature on the surface confirms that the relationship between the variables is not simply linear.
A linear regression analysis was also conducted for magenta prints with two independent variables, Density M and Penetration M, to assess their influence on the dependent variable Print-through M (Table 6).
The correlation coefficient (b*) is −0.519160, indicating a moderate negative linear correlation between the independent variables and the dependent variable and suggesting that an increase in the independent variables does not necessarily lead to an increase in the dependent variable. The coefficient of determination R is 0.51708, suggesting that 51.7% of the variance of the dependent variable (Print-through M) can be explained by the independent variables in the model. The adjusted R2, which accounts for the number of predictors in the model, is 0.26737, indicating that the model explains approximately 26.7% of the variability, representing a moderate ability of the model to explain the variability of the dependent variable. Furthermore, the F-test value of 6.75170 with a p-value less than 0.00316 indicates that the model is statistically significant, meaning there is less than a 0.316% chance that the results were obtained by chance. The intercept coefficient is 69.89130 with a standard error of 15.93540, while its t-value is 4.38592 and the p-value is very small (0.00009), signifying that it is significantly different from 0 at this level of significance, thus denoting a high statistical significance.
The regression coefficient (b*) for the independent variable Density M is −0.51961, indicating that an increase in this independent variable by one unit decreases the dependent variable by 0.51961 units. With a p-value of 0.0075, this variable is statistically significant. In contrast, the independent variable Penetration M has a regression coefficient (b*) of 0.02816 but a p-value of 0.84325, suggesting that this variable is not statistically significant and likely does not contribute to the model. Therefore, Density M is a significant predictor, while Penetration M is not significant in this model.
Given that the coefficients from the regression analysis have shown significance and there is a moderate R2 value, it can be postulated that there exists some form of non-linear relationship. Therefore, for the visualization of the relationship between the three observed variables, a 3D surface plot has been chosen, specifically a non-linear spline model (Figure 4).
The X-axis represents the independent variable Density M, the Y-axis represents the independent variable Penetration M, and the Z-axis represents the dependent variable Print-through M. Based on the surface shape and the color gradations on the graph, it can be deduced that there is some form of non-linear relationship between the observed independent variables and the dependent variable. This implies that a higher density and penetration lead to an increased print-through, indicating that there is an optimal level of Density M at which Print-through M is minimized, and beyond that point, an increase in Density M leads to an increase in Print-through M.
In the third step, a linear regression analysis was performed for the yellow prints with two independent variables, Density Y and Penetration Y, to assess their impact on the dependent variable Print-through Y (Table 7).
The correlation coefficient (R) value of 0.14506 indicates a very weak linear correlation between the independent variables Density Y and Penetration Y and the dependent variable Print-through Y. However, given that the R value is very close to zero, it can be concluded that the linear relationship between the independent variables and the dependent variable is negligible. Looking at the coefficient of determination, or R2, which is 0.02104, it is evident that the model explains only 2.1% of the variability of the dependent variable Print-through Y. This is quite low and suggests that the model does not account for a significant portion of the variability of the dependent variable. Since the adjusted R2 is even lower than the R2, it further emphasizes that the independent variables Density Y and Penetration Y do not significantly contribute to explaining the variability of Print-through Y. The intercept coefficient is −5.45168, but with a p-value of 0.68002 and a standard error of 2.42650, this result is not statistically significant. The regression coefficients (b*) for the independent variable Density Y of 0.14252 and for Penetration Y of 0.01389 are also not statistically significant, considering their p-values of 0.39098 and 0.93303, respectively. The F-test value of 0.39768 with a p-value of 0.67472 indicates that the model as a whole is not statistically significant, which once again confirms that the independent variables Density Y and Penetration Y do not explain the variability of Print-through Y any better than a model that does not include these variables. Given that none of the regression coefficients (b*) are statistically significant, it can be concluded that there is no statistically significant linear relationship between the independent variables and the dependent variable in the model, that is, the regression model does not provide a significant predictive utility for the dependent variable.
Considering the very low R2 and adjusted R2, which suggest that the current linear model does not adequately explain the variability of the dependent variable, a 3D surface plot, specifically a non-linear spline model (Figure 5), has been selected again for the visualization of the relationship between the independent and dependent variables.
This 3D surface plot illustrates the complex relationship between two independent variables, Density Y on the X-axis and Penetration Y on the Y-axis, and the dependent variable Print-through Y on the Z-axis. The shape of the surface and its smoothness indicate a non-linear interaction between the variables and the specific conditions under which the dependent variable reaches local extremes and changes in gradient. Considering the results of the regression analysis and the visualization of the relationship between the independent and dependent variables, the model will be further examined with additional independent variables (types of substrates) to assess its predictive power.
To compare three alternative types of paper with a 100% wood-based paper as the standard, the paper was used as the reference category in the model, which means that all effect estimates were made in relation to this paper. For this purpose, dummy coding of the categorical variable ‘type of paper’ was performed in such a way that for reference paper (R), the dummy variable was assigned a value of 0 to serve as the reference value. The Wald test was used because it can be applied to both linear and non-linear models; this test evaluates the significance of individual coefficients (parameters) of the model by squaring the ratio of the estimated parameter to its standard error.
Regression analysis of measurement results obtained for cyan (C), magenta (M), and yellow (Y) prints is presented in Table 8.
The results of the multiple regression analysis for samples printed in each ink (cyan, magenta, and yellow) show the impact of each variable on the print-through (Print-through C, Print-through M, and Print-through Y) using a logarithmic transformation (log link function) due to the normal distribution of responses.
By observing the obtained values of the Wald statistics and p-values, it can be concluded that for the alternative paper 70R30W (Wald statistics = 46.06860 and p < 0.0001), there is a statistically significant influence of the paper substrate composition on the print-through (Print-through C) in comparison to the reference category, that is, the reference paper R. Given the low p-value, the impact is significant. Furthermore, for the alternative paper 70R30B, the values of Wald statistics (42.59720) with a p-value < 0.0001 indicate that there is also a statistically significant influence of the paper composition on the print-through (Print-through C) in comparison to the reference category. For the third alternative paper 70R30T, by observing the values of Wald statistics and p-values (Wald statistics = 100.59890 and p < 0.0001), it has been determined that there is a pronounced statistically significant influence of the paper on the print-through (Print-through C) compared to the reference category.
When observing the other variables, optical ink density (Density C) and ink depth penetration (Penetration C), it cannot be concluded that they have a significant impact on the print-through (Print-through C), because the obtained values of Wald statistics for Density C are 0.01780 with a p-value of 0.89380, while for Penetration C, the values of Wald statistics are 0.00080 with a p-value of 0.97701. From the above, it can be concluded that relative to the reference value, that is, the reference paper R, the type of paper (70R30W, 70R30B, and 70R30T) has a significant impact on the variable print-through (Print-through C), while the variables optical ink density (Density C) and ink depth penetration (Penetration C) are not statistically significant in this model.
Considering the p-value for each of the three alternative papers (70R30W: p < 0.0001, 70R30B: p < 0.0001, and 70R30T: p < 0.0001), all three types of alternative papers exhibit statistically significant differences compared to the reference paper R concerning the print-through variable (Print-through C). However, to determine which one is closest to the reference paper, it is essential to look at the effect size, that is, the values of Wald statistics (70R30W: 46.06860, 70R30B: 42.59720, and 70R30T: 100.59890). Paper 70R30T has the highest Wald statistic, indicating the most significant difference compared to the reference paper. Papers 70R30B and 70R30W have lower Wald statistics compared to 70R30T, meaning these two types of alternative paper are statistically closer to the reference paper from recycled wood pulp. Since Wald statistics measure how much the estimated coefficient differs from zero, a higher absolute value of Wald statistics indicates a higher likelihood that the corresponding coefficient is not zero, pointing to a greater significance of the variable in the model.
Hence, it can be concluded that alternative paper 70R30T has the most substantial difference compared to reference paper R, while alternative papers 70R30W and 70R30B also show significant differences, but the differences are less pronounced than in the case of paper with triticale straw pulp (70R30T) when observing the print-through on samples printed with cyan ink.
By observing the obtained values of Wald statistics and p-values for magenta prints, it can be concluded that for the alternative paper 70R30W (Wald statistics = 12.36398 and p = 0.0004), there is a statistically significant influence of the paper on the print-through (Print-through M) compared to the reference category, that is, reference paper R. The low p-value (p = 0.00044) indicates that this difference is statistically significant. For the alternative paper 70R30B, the values of Wald statistics (41.52813) indicate an even more significant statistical impact of the paper on the print-through (Print-through M) compared to the reference category, due to a very low p-value (p = 0.0000). The Wald statistic value for the third alternative paper 70R30T of 39.60972 and a p-value of 0.000 indicate a very significant difference compared to the reference paper R when considering the print-through (Print-through M).
Looking at the variables of density (Density M) and penetration (Penetration M), it can be concluded that there is no statistically significant relationship between them and the print-through (Print-through M), given the obtained values of Wald statistics of 1.92377 with a p-value of 0.16544 for density (Density M) and Wald statistics of 1.60490 with a p-value of 0.20521 for penetration (Penetration M).
The results of this analysis demonstrate that the type of paper, unlike density (Density M) and penetration (Penetration M), has a statistically significant impact on the print-through (Print-through M). All three types of alternative papers showed significant differences compared to the reference paper R, although they are more pronounced for papers 70R30B and 70R30T.
However, when observing which alternative paper exhibits properties most similar to the reference paper, the Wald statistic values (70R30W: 12.36398, 70R30B: 41.52183, and 70R30T: 39.60972) and p-values were compared again. It can be concluded that the 70R30W paper has the highest p-value, meaning it is least likely to differ from the reference paper concerning the print-through variable (Print-through M). Therefore, based on these data, 70R30W would be closest to the reference paper when observing the print-through of papers printed in magenta color.
Observing the obtained values of the Wald statistics and p-values for yellow prints, it can be concluded that for the alternative paper 70R30W (Wald statistics = 80.78472 and p = 0.0000), there is a very significant difference between paper with the addition of wheat straw pulp and the reference paper R made only from recycled wood pulp in terms of print-through (Print-through Y). Furthermore, for the alternative paper 70R30B, the values of Wald statistics (1.41681) with a p-value of 0.23393 suggest that there is no statistically significant difference between it and the reference paper R. This indicates that its characteristics in terms of print-through (Print-through Y) are equivalent to those of the reference paper. For the third alternative paper 70R30T, the values of Wald statistics (9.81380) and p-value (0.00173) indicate that there is a statistically significant difference in the impact of the paper composition on the print-through (Print-through Y) compared to the reference paper R.
From the analysis of the optical ink density variable (Density Y), it can be concluded that there is no statistically significant association with print-through (Print-through Y), given the Wald statistics value of 0.08607 and a p-value of 0.76924. However, when observing the impact of ink depth penetration (Penetration Y) on the print-through (Print-through Y), the analysis results indicate a significant influence of penetration on the print-through, as evidenced by the Wald statistics value of 9.56031 with a p-value of 0.001988. This suggests that as ink depth penetration increases, the value of the print-through also rises.
All the above leads to the conclusion that the alternative paper with the addition of wheat straw pulp (70R30W) significantly differs from the reference paper R when observing the print-through. The alternative paper with the addition of triticale straw pulp (70R30T) also shows a difference, but not as much as 70R30W, while paper with the addition of barley straw pulp (70R30B) is most similar to the reference paper as there is no significant statistical difference when observing the print-through on papers printed with yellow ink.

4. Conclusions

Based on the partial analysis of the results for each of the three prints (cyan, magenta, and yellow), the following can be concluded:
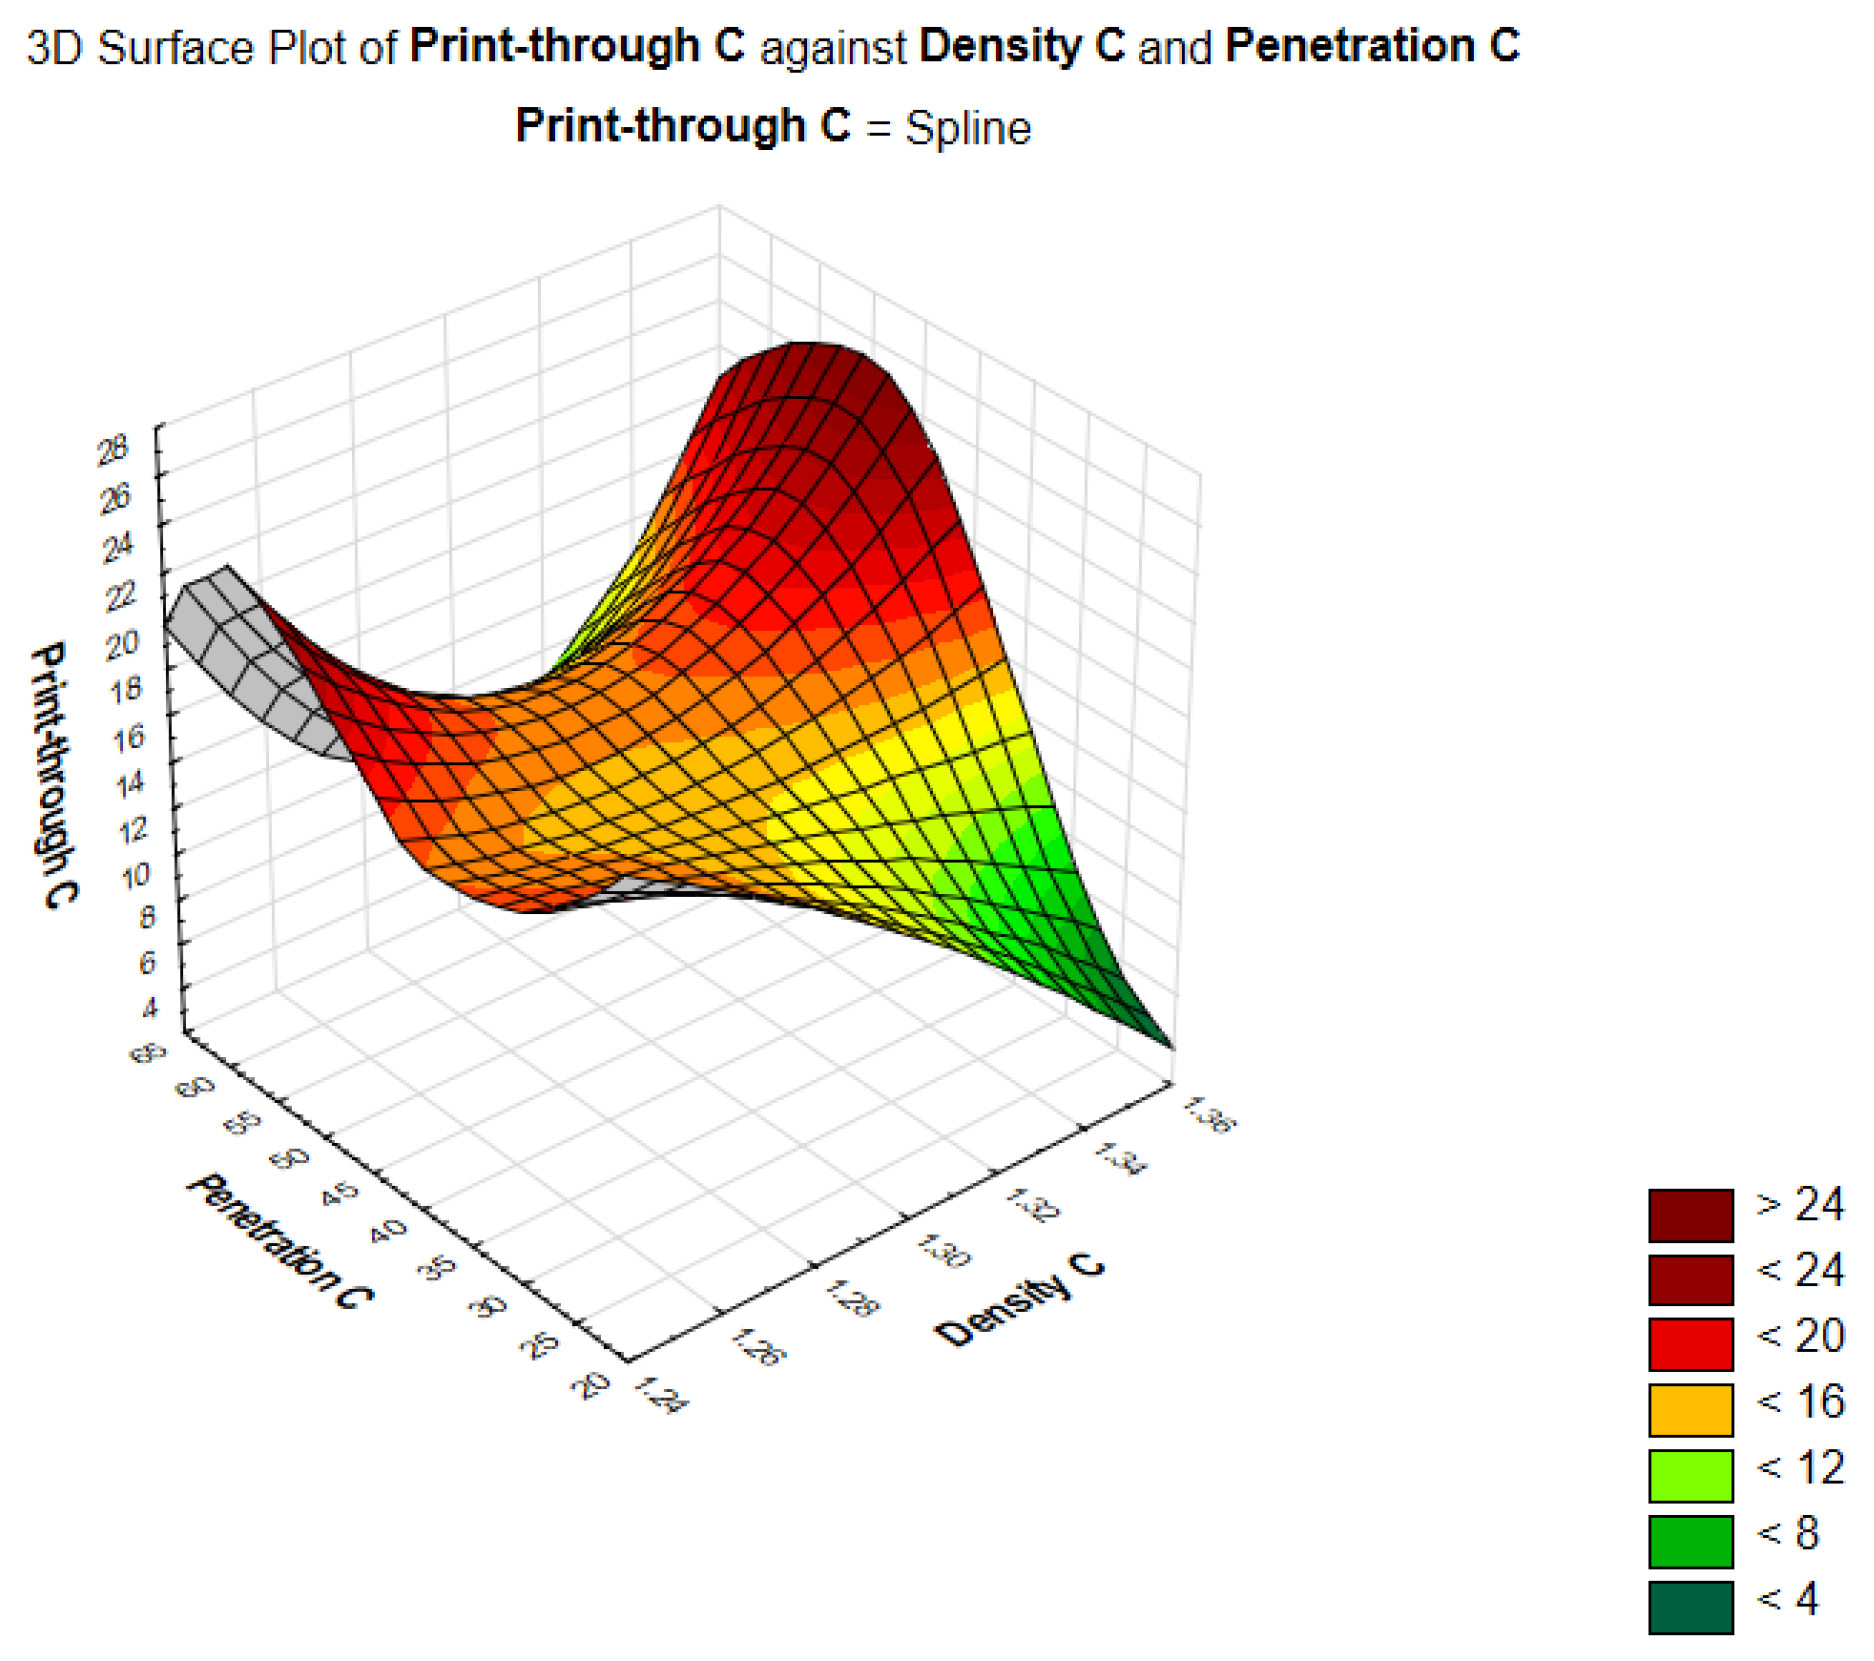
  • The findings from the multiple regression analysis indicate that none of the variables independently provide a statistically significant impact on forecasting the dependent variable within a linear framework. The employed non-linear spline models reveal the presence of non-linear interactions among the variables, highlighting specific conditions where the dependent variable exhibits local extremes and shifts in gradient.
  • For prints made with cyan gravure ink, alternative paper 70R30W significantly differs from reference paper R, paper 70R30B has some significant differences compared to the reference paper but is not as drastic as the 70R30W, and paper 70R30T is the most similar to reference paper made only from recycled wood pulp.
  • For prints made with magenta gravure ink, alternative papers 70R30W and 70R30T have significant statistical differences compared to reference paper (70R30W somewhat more than 70R30T), while paper 70R30B is the most similar to reference paper R, although some differences exist.
  • For prints made with yellow gravure ink, the alternative paper 70R30W has a significant statistical difference compared to reference paper; for paper 70R30T, it is slightly less pronounced; and the paper 70R30B is again proven to be the most similar to reference paper R, although some differences exist.
As an overall conclusion, it can be highlighted that the alternative paper 70R30W generally significantly differs from reference paper R in prints obtained with all analyzed inks, that paper 70R30B is the most consistent in similarity with reference paper printed with M and Y gravure inks, and that paper 70R30T is similar to reference paper when printed with C gravure ink.
Therefore, alternative straw-based paper 70R30B seems to be the best candidate that is the most similar to the reference paper R in printability when all three prints are considered.

Author Contributions

Conceptualization, I.B.; methodology, I.B., D.B., I.P. and M.R.; formal analysis, I.B., D.B., I.P. and M.R.; investigation, I.B., D.B, I.P. and M.R.; resources, I.B., I.P. and M.R.; writing—original draft preparation, I.B. and D.B.; writing—review and editing, I.P. and M.R.; visualization, I.B.; supervision, I.B.; project administration, I.B.; funding acquisition, I.B. and D.B. All authors have read and agreed to the published version of the manuscript.

Funding

This research was funded by the Croatian Science Foundation, grant number: UIP-2017-05-2573.

Institutional Review Board Statement

Not applicable.

Informed Consent Statement

Not applicable.

Data Availability Statement

Data are contained within the article.

Acknowledgments

The authors would like to thank Valentina Radić Seleš and Katja Petric Maretić for their technical support.

Conflicts of Interest

The authors declare no conflicts of interest.

References

  1. Azeez, M.A. Pulping of Non-Woody Biomass. In Pulp and Paper Processing, 1st ed.; Kazi, S.N., Ed.; IntechOpen: London, UK, 2018; Chapter 3; pp. 55–86. [Google Scholar]
  2. Cepi Preliminary Statistics 2022. Available online: https://www.cepi.org/wp-content/uploads/2023/02/Cepi_Preliminary-statistics-2022_15022023.pdf (accessed on 10 June 2023).
  3. Bajpai, P. Nonwood Plant Fibers for Pulp and Paper; Elsevier: Amsterdam, The Netherlands, 2021; pp. 1–31. [Google Scholar]
  4. Fahmy, Y.; Fahmy, T.Y.A.; Mobarak, F.; El-Sakhawy, M.; Fadl, M.H. Agricultural Residues (Wastes) for Manufacture of Paper, Board, and Miscellaneous Products: Background Overview and Future Prospects. Int. J. ChemTech Res. 2017, 10, 424–448. [Google Scholar]
  5. Eugenio, M.E.; Ibarra, D.; Martín-Sampedro, R.; Espinosa, E.; Bascón, I.; Rodríguez, A. Cellulose Alternative Raw Materials for Pulp and Paper Production in the Concept of a Lignocellulosic Biorefinery; IntechOpen: London, UK, 2019. [Google Scholar]
  6. Ashori, A. Nonwood Fibers—A Potential Source of Raw Material in Papermaking. Polym.-Plast. Technol. Eng. 2006, 45, 1133–1136. [Google Scholar] [CrossRef]
  7. Roth, S.; Zetterberg, L.; AcWorth, W.; Kangas, H.-L.; Neuhoff, K.; Zipperer, V. The pulp and paper overview paper. Clim. Strategy 2016, 1–43. Available online: https://www.diw.de/documents/dokumentenarchiv/17/diw_01.c.534645.de/cs-pulp-and-paper.pdf (accessed on 5 November 2022).
  8. Vrabič-Brodnjak, U.; Možina, K. Invasive alien plant species for use in paper and packaging materials. Fibers 2022, 10, 94. [Google Scholar] [CrossRef]
  9. Wheat Consumption Worldwide in 2021/2022, by Country. Available online: https://www.statista.com/statistics/1094065/total-global-wheat-consumption-by-country/ (accessed on 23 October 2023.).
  10. FAO Cereal Supply and Demand Brief. Available online: https://www.fao.org/worldfoodsituation/csdb/en/ (accessed on 24 October 2023).
  11. Kirwan, M.J. Handbook of Paper and Paperboard Packaging Technology, 2nd ed.; Wiley: Hoboken, NJ, USA, 2012; pp. 1–432. [Google Scholar] [CrossRef]
  12. Kipphan, H. Handbook of Print Media: Technologies and Production Methods, 1st ed.; Springer: Berlin, Germany, 2001; pp. 206–372. [Google Scholar]
  13. NIIR Board of Consultants & Engineers. Handbook on Printing Technology (Offset, Flexo, Gravure, Screen, Digital, 3D Printing with Book Binding and CTP), 4th ed.; Asia Pacific Business Press Inc.: Delhi, India, 2019; pp. 63–73. [Google Scholar]
  14. Oloyede, O.O.; Lignou, S. Sustainable paper-based packaging: A consumer’s perspective. Foods 2021, 10, 1035. [Google Scholar] [CrossRef] [PubMed]
  15. Plazonic, I.; Bates, I.; Barbaric-Mikocevic, Z. The Effect of Straw Fibers in Printing Papers on Dot Reproduction Attributes, as Realized by UV Inkjet Technology. BioResources 2016, 11, 5033–5049. [Google Scholar] [CrossRef]
  16. ISO 5269-2:2004; Pulps—Preparation of Laboratory Sheets for Physical Testing—Part 2: Rapid-Köthen Method. International Organization for Standardization: Geneva, Switzerland, 2004.
  17. ISO 534:2011; Paper and Board—Determination of Thickness, Density and Specific Volume. International Organization for Standardization: Geneva, Switzerland, 2011.
  18. Bates, I.; Plazonić, I.; Petric Maretić, K.; Rudolf, M.; Radić Seleš, V. Assessment of the UV inkjet ink penetration into laboratory papers within triticale pulp and its influence on print quality. Color. Technol. 2022, 138, 16–27. [Google Scholar] [CrossRef]
  19. ISO 2144:2015; Paper, Board and Pulp—Determination of residue (ash) on Ignition at 900 Degree C. International Organization for Standardization: Geneva, Switzerland, 2015.
  20. ISO 4287:1997; Geometrical Product Specifications (GPS)—Surface Texture: Profile Method—Terms, Definitions and Surface Texture Parameters. International Organization for Standardization: Geneva, Switzerland, 1997.
  21. Kurek, M.; Bates, I.; Plazonić, I.; Rudolf, M.; Radić Seleš, V.; Galić, K.; Petric Maretić, K. Effects of Non-Wood Fibres in Printed Paper Substrate on Barrier and Migration Properties. Tech. J. 2022, 16, 299–305. [Google Scholar] [CrossRef]
  22. ASTM E96-80; Standard Test Method for Water Vapor Transmission of Materials. ASTM B Standards: West Conshohocken, PA, USA, 1980.
  23. Bates, I.; Plazonić, I.; Radić Seleš, V.; Petric Maretić, K.; Rudolf, M. Usability of Discarded Lignocellulosic Fibers in Paper for Secondary Green Packaging and Labeling. Sustainability 2023, 15, 5378. [Google Scholar] [CrossRef]
  24. DIN 53211; Determination of Flow Time Using the DIN Flow Cup. Deutsche Institut für Normung e.V.: Berlin, Germany, 1987.
  25. Eriksen, O.; Gregersen, O.W. The influence of ink pigment penetration and paper structure on print through. Nord. Pulp Pap. Res. J. 2005, 20, 242–246. [Google Scholar] [CrossRef]
  26. Eriksen, O.; Gregersen, O.W. Ink pigment location measured as the position of clay in coldset ink. Nord. Pulp Pap. Res. J. 2006, 21, 460–465. [Google Scholar] [CrossRef]
  27. Hair, J.F.; Black, W.C.; Babin, B.J.; Anderson, R.E. Multivariate Data Analysis: A Global Perspective, 7th ed.; Pearson: Upper Saddle River, NJ, USA, 2010; pp. 155–162. [Google Scholar]
  28. Moore, D.S.; McCabe, G.P.; Craig, B.A. Introduction to the Practice of Statistics, 9th ed.; Macmillan Learning: New York, NY, USA, 2017; pp. 607–642. [Google Scholar]
  29. Golberg, M.A.; Cho, H.A. Introduction to Regression Analysis; WIT Press: Southampton, UK, 2010; pp. 179–242. [Google Scholar]
  30. Keith, T.Z. Multiple Regression and Beyond: An Introduction to Multiple Regression and Structural Equation Modeling, 2nd ed.; Routledge—Taylor & Francis Group: New York, NY, USA, 2019; pp. 26–182. [Google Scholar]
  31. Field, G.G. Color and Its Reproduction, 2nd ed.; GATF Press: Pittsburg, PA, USA, 1999; pp. 130–156. [Google Scholar]
  32. Fairley, M. Encyclopedia of Labels and Lebel Technology; Tarsus Publishing Ltd.: London, UK, 2004; p. 141. [Google Scholar]
Figure 1. Microscopic cross-sectional images of printed paper substrates (R, 70R30W, 70R30B, and 70R30T) in epoxy resin at 200× magnification.
Applsci 14 00288 g001
Figure 2. Qualitative parameters: (a) ink penetration depth, (b) optical ink density, and (c) print-through of printed paper substrates (R, 70R30W, 70R30B, and 70R30T).
Applsci 14 00288 g002
Figure 3. 3D surface plot of Print-through C against Density C and Penetration C.
Applsci 14 00288 g003
Figure 4. 3D surface plot of Print-through M against Density M and Penetration M.
Applsci 14 00288 g004
Figure 5. 3D surface plot of Print-through Y against Density Y and Penetration Y.
Applsci 14 00288 g005
Table 1. Processes of forming paper substrates under laboratory conditions.
DisintegrationHomogenization
m (pulp)80 g
V (H2O)1.6 LV (H2O)10 L
pH8pH7.5
T45 °CT45 °C
t20 mint5 min
Table 2. Characteristics of paper substrates.
Paper
Substrate
Thickness
(µm)
[15,17]
Ash
(%)
[15,18,19]
Roughness, Ra
(µm) [15,18,20]
Water Vapor Permeability, WVP
(×10−10 g/s·m·Pa)
[21,22]
Surface Free Energy, σs (mN/m)
[23]
R90.10 ± 2.134.73 ± 0.224.15 ± 0.343.39 ± 0.0540.92
70R30W101.67 ± 17.223.64 ± 0.074.59 ± 0.513.33 ± 0.1540.70
70R30B91.67 ± 4.083.32 ± 0.674.24 ± 0.413.41 ± 0.1241.38
70R30T101.67 ± 14.723.99 ± 0.154.40 ± 0.393.84 ± 0.2343.55
Table 3. Viscosity of cyan, magenta, and yellow printing inks.
Printing InkKinematic Viscosity (mm2/s)
[24]
Cyan146.54 ± 5.29
Magenta143.62 ± 8.11
Yellow135.61 ± 4.13
Table 4. The Shapiro–Wilk parametric test results for each variable.
VariableShapiro–Wilk Wp-Value
Density C0.977560.59957
Penetration C0.950670.07995
Print-through C0.946420.05715
Density M0.919950.07670
Penetration M0.978690.64096
Print-through M0.952900.09545
Density Y0.642520.40207
Penetration Y0.965020.24767
Print-through Y0.987220.15908
Table 5. Linear regression analysis results for cyan prints.
Regression Summary for Dependent Variable: Print-through C
R = 0.19670 R2 = 0.03881 Adjusted R2 = ---
F(2.37) = 0.74693 p < 0.48083 Std. Error of Estimate: 4.32250
N = 40b*Std. Err.
of b*
bStd. Err.
of b
t(37)p-Value
Intercept 12.2385041.737200.293230.77099
Density C0.002250.163660.4467832.437450.013770.98908
Penetration C0.196590.163660.077340.064381.201250.23729
Table 6. Linear regression analysis results for magenta prints.
Regression Summary for Dependent Variable: Print-through M
R = 0.51708 R2 = 0.26737 Adjusted R2= 0.22777
F(2.37) = 6.75170 p < 0.00316 Std. Error of Estimate: 2.49210
N = 40b*Std. Err.
of b*
bStd. Err.
of b
t(37)p-Value
Intercept 69.8913015.935404.385920.00009
Density M−0.519610.14143−52.7473314.36986−3.670690.00075
Penetration M0.028160.141430.006020.064380.199130.84325
Table 7. Linear regression analysis results for yellow prints.
Regression Summary for Dependent Variable: Print-through Y
R = 0.14506 R2 = 0.02104 Adjusted R2= ---
F(2.37) = 0.39768 p < 0.67472 Std. Error of Estimate: 2.42650
N = 40b*Std. Err.
of b*
bStd. Err.
of b
t(37)p-Value
Intercept −5.4516813.11423−0.415710.68002
Density Y0.142520.1641914.7013016.936640.868020.39098
Penetration Y0.013890.164190.002810.033170.084600.93303
Table 8. The results of the multiple regression analysis for samples printed with cyan, magenta, and yellow gravure inks.
Test of All Effects
Distribution: NORMAL; Link Function: LOG
Print-through CPrint-through MPrint-through Y
EffectDegree of FreedomWald
Statistics
p-ValueDegree of FreedomWald
Statistics
p-ValueDegree of FreedomWald
Statistics
p-Value
Intercept14.336900.0372910.036620.8482510.277800.59815
R0 0 0
70R30W146.068600.00000112.363980.00044180.784720.00000
70R30B142.597200.00000141.521830.0000011.416810.23393
70R30T1100.598900.00000139.609720.0000019.813800.00173
Density10.017800.8938011.923700.1654410.086070.76923
Penetration10.000800.9770111.604900.2052119.560310.00199
Disclaimer/Publisher’s Note: The statements, opinions and data contained in all publications are solely those of the individual author(s) and contributor(s) and not of MDPI and/or the editor(s). MDPI and/or the editor(s) disclaim responsibility for any injury to people or property resulting from any ideas, methods, instructions or products referred to in the content.

