Article

Numerical Simulation and Experimental Research on Heat Transfer Characteristics Based on Internal Meshing Screw

1
School of Mechanical and Electrical Engineering, Inner Mongolia Agricultural University, Hohhot 010018, China
2
School of Mechnical Science and Technology, Huazhong University of Science and Technology, Wuhan 430074, China
*
Authors to whom correspondence should be addressed.
Appl. Sci. 2024, 14(1), 220; https://doi.org/10.3390/app14010220
Submission received: 3 December 2023 / Revised: 22 December 2023 / Accepted: 22 December 2023 / Published: 26 December 2023
(This article belongs to the Section Mechanical Engineering)

Abstract

:
The mixing and processing of high-viscosity materials play a pivotal role in composite material processing. In this context, the internal meshing screw mixer, rooted in volume extensional rheology, offers distinct advantages, including heightened mixing efficiency, exceptional material adaptability, and favorable thermomechanical properties. This research endeavors to advance our understanding of these qualities by presenting an in-depth exploration of internal meshing screw mixing. To facilitate this, an internal meshing screw mixing experimental apparatus was meticulously constructed, accompanied by extensive numerical simulations and experimental investigations into its heat transfer characteristics. Two distinct heat transfer modes are established: Mode 1 entails the transfer of the high temperature from the outer wall of the stator to the interior, while Mode 2 involves the transmission of the high temperature from the inner wall of the rotor to the exterior. The ensuing research yields several notable findings: 1. It is evident that higher rotational speeds lead to enhanced heat transfer efficiency across the board. However, among the three rotational speeds examined, 60 rpm emerges as the optimal parameter for achieving the highest heat transfer efficiency. Furthermore, within this parameter, the heat transfer efficiency is superior in Mode 1 compared to Mode 2. 2. As eccentricity increases, a corresponding decline in comprehensive heat transfer efficiency is observed. Moreover, the impact of eccentricity on heat transfer efficiency becomes increasingly pronounced over time. 3. A lower gap dimension contributes to higher heat transfer within the system. Nevertheless, this heightened heat transfer comes at the expense of reduced stability in the heat transfer process. 4. It is demonstrated that heat transfer in Mode 1 primarily follows a convection heat transfer mechanism, while Mode 2 predominantly exhibits diffusion-based heat transfer. The heat transfer efficiency of Mode 1 significantly surpasses that of Mode 2. This research substantiates its findings with the potential to enhance the heat transfer efficiency of internal meshing screw mixers, thereby making a valuable contribution to the field of polymer engineering and science.

Graphical Abstract

1. Introduction

In the present day, there is a growing demand for processing polymer materials [1,2,3]. However, conventional screw mixers exhibit certain limitations in achieving optimal material mixing [4,5,6]. To address this challenge, recent advancements have seen the emergence of a piece of novel high-viscosity material-processing equipment known as the eccentric rotor extruder [7]. Whether it is a traditional screw extruder relying on shear rheology [8,9] or a modern internal meshing screw mixer grounded in extensional rheology [10,11], comprehensive research into the convective heat transfer within these devices is of paramount importance [12,13]. In order to mix the obtained materials smoothly, it is necessary not only to improve the operating efficiency within the device, but also to improve the heat transfer efficiency between the device components [14,15,16]. As an illustrative instance, conventional screw extruders offer an insightful context for the examination of convective heat transfer efficiency [17,18,19]. The extrusion process in screw extruders necessitates the transfer of heat from a heater to the material via heat exchange within the extruder barrel, a fundamental step in achieving successful melt processing [20,21,22]. Furthermore, the airflow around the extrusion port during screw extrusion processes can significantly enhance the heat dissipation on the material surface, playing a pivotal role in convective heat transfer mechanisms [23,24,25]. These intricacies of heat transfer within screw extruders are integral to the broader field of polymer engineering and science, offering valuable insights into material-processing efficiency and product quality. This aspect has garnered attention both domestically and internationally, exemplified by notable contributions. For instance, Barr [26] introduced a novel screw design aimed at optimizing the flow characteristics of liquid materials and mitigating temperature differentials. This inventive device incorporates variably pitched spiral edges to enhance energy transfer, resulting in a more uniform temperature distribution within the heated liquid. In a similar vein, Fei Teng [27] leveraged the principles of liquid heat transfer in polymer materials to delve into the intricate interplay between the screw structure and the process parameters, particularly concerning the cooling of liquid materials within the screw extruders. Moreover, Jian Ranran [28] employed advanced fluid simulation software to refine specific components within the collaborative screw-metering section, exploring the profound influence of the structural and process parameters on the heat and mass transfer dynamics in the final product. These studies underscore the significance of optimizing the polymer-processing equipment and techniques to advance our understanding of heat transfer, with implications for enhanced material quality and processing efficiency in polymer engineering and science.
Chris [29] introduced an innovative approach for the prediction of the temperature distribution within a liquid in a twin-screw extruder. The findings underscore the minimal heat conduction through the screw in high-speed twin-screw extruders. By harnessing our knowledge of viscosity and heat transfer properties, it becomes feasible to calculate the melt temperature with a high degree of precision.
Drawing upon insights from international research, it becomes evident that a comprehensive examination of the heat transfer mechanisms within internal meshing screw devices holds paramount significance [30,31,32]. Nonetheless, the investigation into heat transfer within volumetric-stretching-dominated internal meshing screw mixers remains an uncharted territory. An insightful approach would involve drawing from the research methodologies established in traditional screw extruder heat transfer studies and adapting them to explore the heat transfer efficiency of internal meshing screw mixers using numerical simulations and actual experimental verification methods. This cross-application of established methodologies may lead to valuable insights in this novel area of study and contribute to the knowledge base of polymer engineering and science.
This article commences with an elucidation of the operational principles and processes governing internal meshing screw mixers. Subsequently, it expounds upon the experimental equipment and instrumentation utilized in mixer testing. The article outlines the practical temperature measurement experiments performed on the mixer. It explores the motion equations governing every point of the rotor within the device and the system’s control equations. This investigation culminates in the design and validation of a numerical simulation model for simulated experiments, corroborating its grid independence.
In order to assess the accuracy of these simulated experiments, a comparative analysis is conducted between the actual experimental findings and the simulated results. This study delves into the intricacies of the heat transfer mechanisms of internal meshing screw mixers. Two distinct heat transfer modes are established, and three heat transfer characterization methods are applied to evaluate convective heat transfer efficiency. Moreover, the research investigates the impact of rotational speed, eccentricity, and gap dimensions on heat transfer efficiency. These insights collectively contribute to a comprehensive understanding of heat transfer within internal meshing screw mixers, furthering the field of polymer engineering and science.

2. The Working Principle and Process of an Internal Meshing Screw Mixer

The internal meshing screw mixer employs an eccentric rotor, which undergoes simultaneous rotation along its own axis while revolving around the stator axis in an opposing direction within the stator cavity [33]. This distinctive motion results in the periodic alteration of material dynamics in both the axial and radial dimensions, occurring between the eccentric rotor and the inner stator cavity. Ultimately, through the distinctive stretching and deformation mechanisms inherent in the eccentric rotor extruder, the material experiences positive displacement conveyance [34].
Figure 1 presents a top view of the internal meshing screw mixing and conveying section. In this configuration, the eccentric meshing rotor is positioned at the apex of the stator cavity, signifying a rotor rotation angle of 0°. The eccentric rotor exhibits a circular profile in the top view, while the stator cross-section comprises a continuous elongated slot formed by two identical semicircular arcs and two straight segments, each measuring four eccentricities in length. The center point O2 of the rotor circle is situated at a distance equal to one eccentricity from the initial position O1 of the rotational axis, and the center of the rotor circle is positioned at a distance equal to two eccentricities from the midsection of the stator geometry.
As depicted in the figure, the motion of the small circle centered at point O represents the rotation axis motion. The eccentric rotor exhibits an angular velocity of ω 1 around the rotational axis, and, simultaneously, it forms a motion ω 2 with identical speed, yet in the opposite direction around the stator axis. It is this unique spatial movement that characterizes the behavior. In a three-dimensional context, the motion of the eccentric meshing rotor is a periodic lateral oscillation within the stator’s inner cavity. In a two-dimensional framework, the trajectory of the eccentric rotor’s center on the inner stator wall assumes a linear path—a straight line, measuring a length of four eccentricities.
The trajectory of the rotor center’s motion follows a straight-line path with a length equivalent to four eccentricities, and this behavior adheres to the principles of hypocycloids [35]. As commonly recognized, when a rolling circle is constrained within another fixed circle and the rolling circle revolves, a point on the rolling circle traces out a specific trajectory known as a hypocycloid. Notably, when the rolling circle’s radius is set to half the radius of the fixed circle, the trajectory of a point on the rolling circle becomes a straight line, and its hypocycloidal path precisely aligns with the diameter of the fixed circle.
The operational sequence of the internal meshing screw mixing and conveying section unfolds as follows: The eccentric meshing rotor effectively divides the stator’s inner cavity into two distinct chambers. As the eccentric rotor undergoes periodic rotation, the cavity’s volume sandwiched between the rotor and the stator experiences corresponding alterations. When this cavity attains a larger volume, material is drawn into it due to pressure differentials [36]. Upon material intake, the cavity volume reaches saturation, leading to its closure, followed by the material’s transportation, facilitated through axial and radial compression, and its subsequent release. These processes are governed by the action of the stretching flow field deformation. Ultimately, the material is thoroughly mixed and, subsequently, discharged at the outlet. This process of material intake from the inlet and simultaneous mixture discharge contributes to the seamless functionality of the system.

3. Material and Methods

3.1. Experimental Equipment and Dimensions

The experimental apparatus was conceptualized and developed under the guidance of Professor Guo Fang from the School of Mechanical and Electrical Engineering at Inner Mongolia Agricultural University. Figure 2 illustrates a schematic representation of this experimental setup, encompassing Components (a) through (f), which include the Internal meshing screw mixing section, support apparatus, coaxial output rotation and revolution transmission mechanism, torque sensor, gear reducer, and servo motor. Figure 3a provides both a three-dimensional rendering and a dimensional diagram of the internal meshing screw mixing and conveying section. Additionally, Figure 3b–d present respective cross-sectional schematic depictions of the straight segment and the return section within the internal meshing screw mixing area.
The internal meshing screw mixing and conveying section comprises an eccentric meshing rotor and a stator inner cavity. The eccentric rotor is structured with alternating spiral and straight rotor sections, while the stator cavity incorporates corresponding spiral and straight stator sections, with a one-to-one correspondence between them [37,38]. The strategic arrangement of spiral and straight sections promotes volumetric material deformation during transport, thus inducing a periodic volumetric stretching phenomenon [39].

3.2. Experimental Plan and Experimental Equipment

This study employs a comprehensive simulation approach to investigate the convective heat transfer efficiency of the internal meshing screw mixing device, primarily due to the cost constraints associated with experimental validation when altering structural parameters. Therefore, the structural and process parameters of the experimental setup align with the data provided in the previous figure. In practical experiments, the temperature variations at specific points are measured to establish temperature change patterns, while simulations are executed to obtain the corresponding temperature point variations. A comparative analysis is performed to validate and align the measurement results obtained through experimental instruments under specific experimental conditions. These experiments yield temperature data for the temperature measurement point located at the inlet of the internal meshing screw mixer, collected within a time frame of 1–4 s.
During the experimental phase, the temperature measurement instrument’s probe was positioned at a precise radial distance of 0.5 mm from the bottom of the stator inlet. This placement corresponds to the radial position of the temperature measurement point, aligning with the initial radial position of the rotor. The axial position of the temperature measurement point is defined as the center of the feed inlet circle. For a visual reference, Figure 4a below illustrates the axial position with respect to the temperature measurement point’s upward reference plane.
Figure 4b provides an overview of the key instrumentation employed in the experiment, while Table 1 offers details regarding the models and manufacturers of these instruments. Figure 4c–f highlights the remaining experimental instruments and components. Figure 4f specifically showcases the oil plug component located at the feed inlet of the internal meshing experimental device. To accommodate the temperature probe’s dimensions, a small hole was drilled at the center of the oil plug, enabling the temperature probe to pass through. Figure 4c introduces the rotational viscometer, NDJ-8S, featuring a measurement range of 1–2,000,000 mPa·s, measurement accuracy of ±2%, repeatability error of ±1%, and operating conditions of 5 °C to 35 °C at a relative humidity not exceeding 80%. This instrument is employed to determine the viscosity of Newtonian fluids. In Figure 4e, the electric heating digital display constant temperature water bath (HH-1 single hole) is depicted. This unit boasts a power rating of 300W and offers a temperature control range from room temperature to 100 °C with an accuracy of ±1 °C. Its temperature uniformity is less than or equal to 1 °C, and it provides a temperature display resolution of 0.1 °C.

3.3. Material Properties

The experimental materials encompassed maltose syrup, a highly viscous transparent liquid. This substance exhibits a density of 1340 kg/m3, a viscosity measuring (28 ± 0.19) Pa·s at 20 °C, and an exceptional light transmittance of 98.2%. Maltose syrup served as a representative high-viscosity liquid component for the study. In addition, distilled water, a transparent liquid, was incorporated into the experimental setup. With a density of 1000 kg/m3, distilled water exhibits a significantly lower viscosity of 0.8949 × 10⁻³ Pa·s at 25 °C.
The experimental materials were formulated by blending maltose syrup and distilled water in a precise ratio of 5:1. Given the analogous properties of the experimental materials to those used in Ángela L. Alarcón’s referenced article, the parameter values detailed within that study were adopted for this experiment. The test material exhibits a density of 1120 kg/m3, a specific heat capacity of 2400 J/(kg·K), and a thermal conductivity of 0.26 W/(m·K).
The viscosity of the test material underwent multiple measurements, yielding an average value of 18,910 mPa·s. These results substantiate the characterization of the test material as a Newtonian fluid.

3.4. Steps of the Experiment

(1)
Experiment equipment setup: The experimental setup involved the application of a heating element to the surface of the internal meshing screw mixing section, followed by the envelopment of the heating element with glass insulation cotton to ensure compliance with overall temperature requirements.
(2)
Preparation of experiment materials: The test materials were meticulously prepared by adhering to a 5:1 ratio of corn syrup to distilled water. This mixture was subsequently placed within a temperature-controlled water bath set to 25 °C, allowing it to stabilize for a duration of 40 min.
(3)
Experimental procedure: The prepared test material was gently introduced into the internal meshing screw device. The inlet was sealed with an oil plug, and the temperature measuring instrument’s probe was inserted through the oil plug to attain the designated position.
(4)
Experimental execution: The heating plate temperature was methodically adjusted to reach a steady state at 50 °C. Subsequently, the equipment was initiated, with the rotation speed calibrated to 60 rpm. Temperature variations were recorded by the temperature-measuring instrument within a time frame of 1–4 s.
(5)
Post-experiment protocol: Following the completion of the experiment, the equipment was meticulously cleaned, and the test bench was maintained in a pristine condition. Finally, the power supply was switched off.

4. Numerical Simulation Model

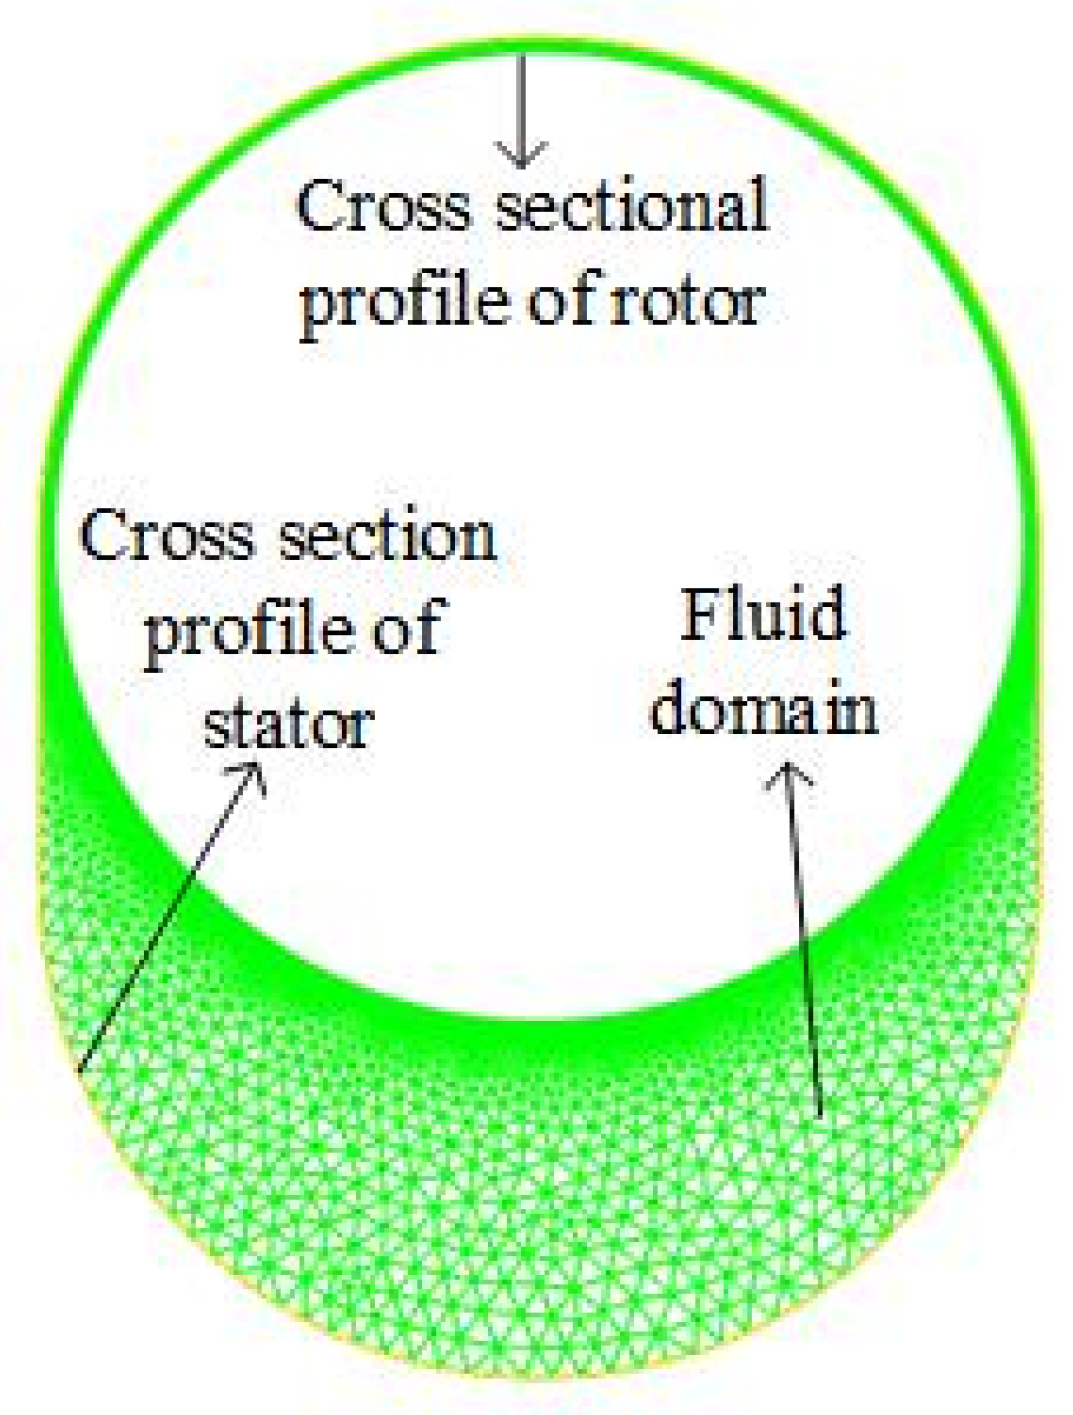
4.1. Geometric Model

Figure 1 illustrates the pivotal point locations on the selected rotor. In this depiction, the X-axis represents the horizontal direction, with the rightward direction denoted as positive, while the Y-axis signifies the vertical direction, with the upward direction representing the positive axis. The rotor encompasses three key points: O2, O1, and O. Point O2 is situated at the geometric center of the rotor, whereas Point O1 serves as the rotational center of the rotor. Point O1 undergoes counterclockwise rotation around the stator’s geometric center, maintaining a defined radius of rotation. Point O marks the position where the rotor’s initial location coincides with the geometric center of the stator. The motion equation of Point O1 is:
x B = e cos ( π 2 + ω t ) = e sin w t y B = e sin ( π 2 + ω t ) = e cos w t
All other points rotate clockwise around Point O1, and their motion equations are:
x = x B + L sin ( φ ω t ) y = y B + L cos ( φ ω t )
Let L represent the distance between the point in question and O2, φ denote the angle between the line connecting the point and O2 and the abscissa, and ω indicate the angular velocity of the rotor’s combined rotation and revolution. In this context, a counterclockwise rotation is considered positive, while a clockwise rotation is deemed to be negative. Consequently, the angular velocity for the rotor’s revolution is denoted as ω , whereas the angular velocity for its rotation is represented as ω .
Based on these considerations, the motion equations for each point can be derived, taking into account the revolution radius denoted as e and the rotor radius designated as R . Table 2 shows the trajectory equations and speed equations of each point on the rotor.

4.2. Mathematical Model

According to the assumptions, the control equation of the fluid in the eccentric rotor system can be established:
Mass conservation equation:
ρ t + ( ρ ν ) = 0
Among them, ρ is the fluid density and ν is the fluid velocity.
Momentum conservation equation:
ρ ν t + ( ρ ν ) ν = p + μ 2 ν
Among them, p is the pressure and μ is the fluid viscosity.
Energy conservation equation:
ρ C p ( T t + ν T ) = k T
Among them, T is the temperature, C p is the constant pressure specific heat capacity, and k is the thermal conductivity.

4.3. Grid and Calculation

The provided Figure 5 illustrates the grid calculation cloud diagram of the cross-sectional configuration within the internal meshing screw mixing section. This depiction encompasses the cross-sectional profiles of both the rotor and stator, delineating the fluid domain that lies between these two components.
Employing Ansys 2021 R1 software, heat transfer in the internal meshing screw mixing section was simulated. The geometric model employed in the simulation precisely matched the structural parameters of the mixer utilized in the experimental setup. The computational domain was saturated with fluid, mirroring the properties observed in the experiment. Throughout the investigation, the rotor speed remained below 90 rpm, and the Reynolds number did not surpass 109. It was assumed that the mixing process occurred within a laminar flow state. The modeling of the fluid domain was performed with Space Claim 2021 R1 software. The process involved importing mesh settings, designating the rotor section wall as the interior surface, labeling the stator’s outer wall surface, and identifying the fluid domain in between as the liquid phase. The mesh of the fluid domain was subdivided into a structured triangular mesh, with a uniform unit size set at 1 mm for the overall mesh. Further refinement was applied to the rotor wall’s grid, adjusting the unit size to 0.1 mm. Specify the mixing wall surfaces of the rotor and stator as no-slip boundary conditions, with the rotor wall surface configured as an adiabatic boundary. The simulation analysis employed the material parameters described previously, considering the selected physical properties as representative of Newtonian fluids.
This article examines the influence of two distinct modes on the heat transfer efficiency of the internal meshing screw mixer system. Mode 1 involves establishing a constant wall temperature of 50 °C while maintaining an internal temperature of 0 °C. Conversely, Mode 2 maintains an internal temperature of 50 °C while ensuring the wall is designed to achieve zero heat flux. This distinction between Mode 1 and Mode 2 is commonly referred to as ‘external heat’ and ‘internal heat’ configurations.
The rotor’s motion was enabled by implementing a user-defined function (UDF), which was subsequently compiled into Fluent 2021 R1 software. The moving mesh technique, accompanied by smoothing and mesh reconstruction methods, was employed. Given the eccentricity parameter, e = 3 mm, a moving mesh interior region was established. The selection of ‘rigid body’ as the type was made, along with the incorporation of the compiled UDF. The center of gravity position was defined at Y = 3 mm.
The numerical solution technique employed in this study is based on the SIMPLE algorithm, a pressure-velocity coupling approach. The momentum equation and pressure discretization are both resolved using the second-order upwind method. The sub-relaxation factor is initially set to 0.5, a value selected to expedite the computational speed. Convergence thresholds for the residual values are specified at 10−9 for each component, and a maximum of 30 iterations are allowed in a single time step. The computational process concludes upon achieving convergence.

4.4. Grid Independence Verification

The grid size plays a pivotal role in determining the accuracy of numerical simulations, a phenomenon commonly known as grid independence verification. In this study, grid independence is validated through the utilization of three distinct grid datasets. Each of the three datasets adheres to separate grid reconstruction criteria, as detailed in Table 3. As depicted in Figure 6, with consistent cross-sectional parameters in relation to the prior specifications, the time-averaged fluid velocity profiles of the three grid sets during a given time period were observed. By considering a fine mesh, which boasts the highest mesh count, as the reference benchmark, the deviations of the remaining two types of grids from the fine mesh’s average fluid velocity over time were computed.
Deviation 1 = (coarse mesh − fine mesh)/fine mesh) × 100%
Deviation 2 = (medium grid − fine mesh)/fine mesh) × 100%
As illustrated in Figure 7, it is evident that both deviations exhibit a rapid ascent from 0 at the initial time, signifying substantial disparities in the calculated results of this model when subjected to different grid sizes during the initial phase. However, within a span of 0.05 T, both deviations experienced a considerable reduction. During this time frame, the deviations did not surpass 5%, and Deviation 1, in particular, remained below 1% and exhibited a smaller value compared to Deviation 2. In light of a combined assessment that considers the magnitude of deviation, the average rate, and operation hours, the grid configuration of coarse mesh is designated as the optimal grid model for subsequent numerical simulation computations.

5. Heat Transfer Analysis of Internal Meshing Screw Mixer

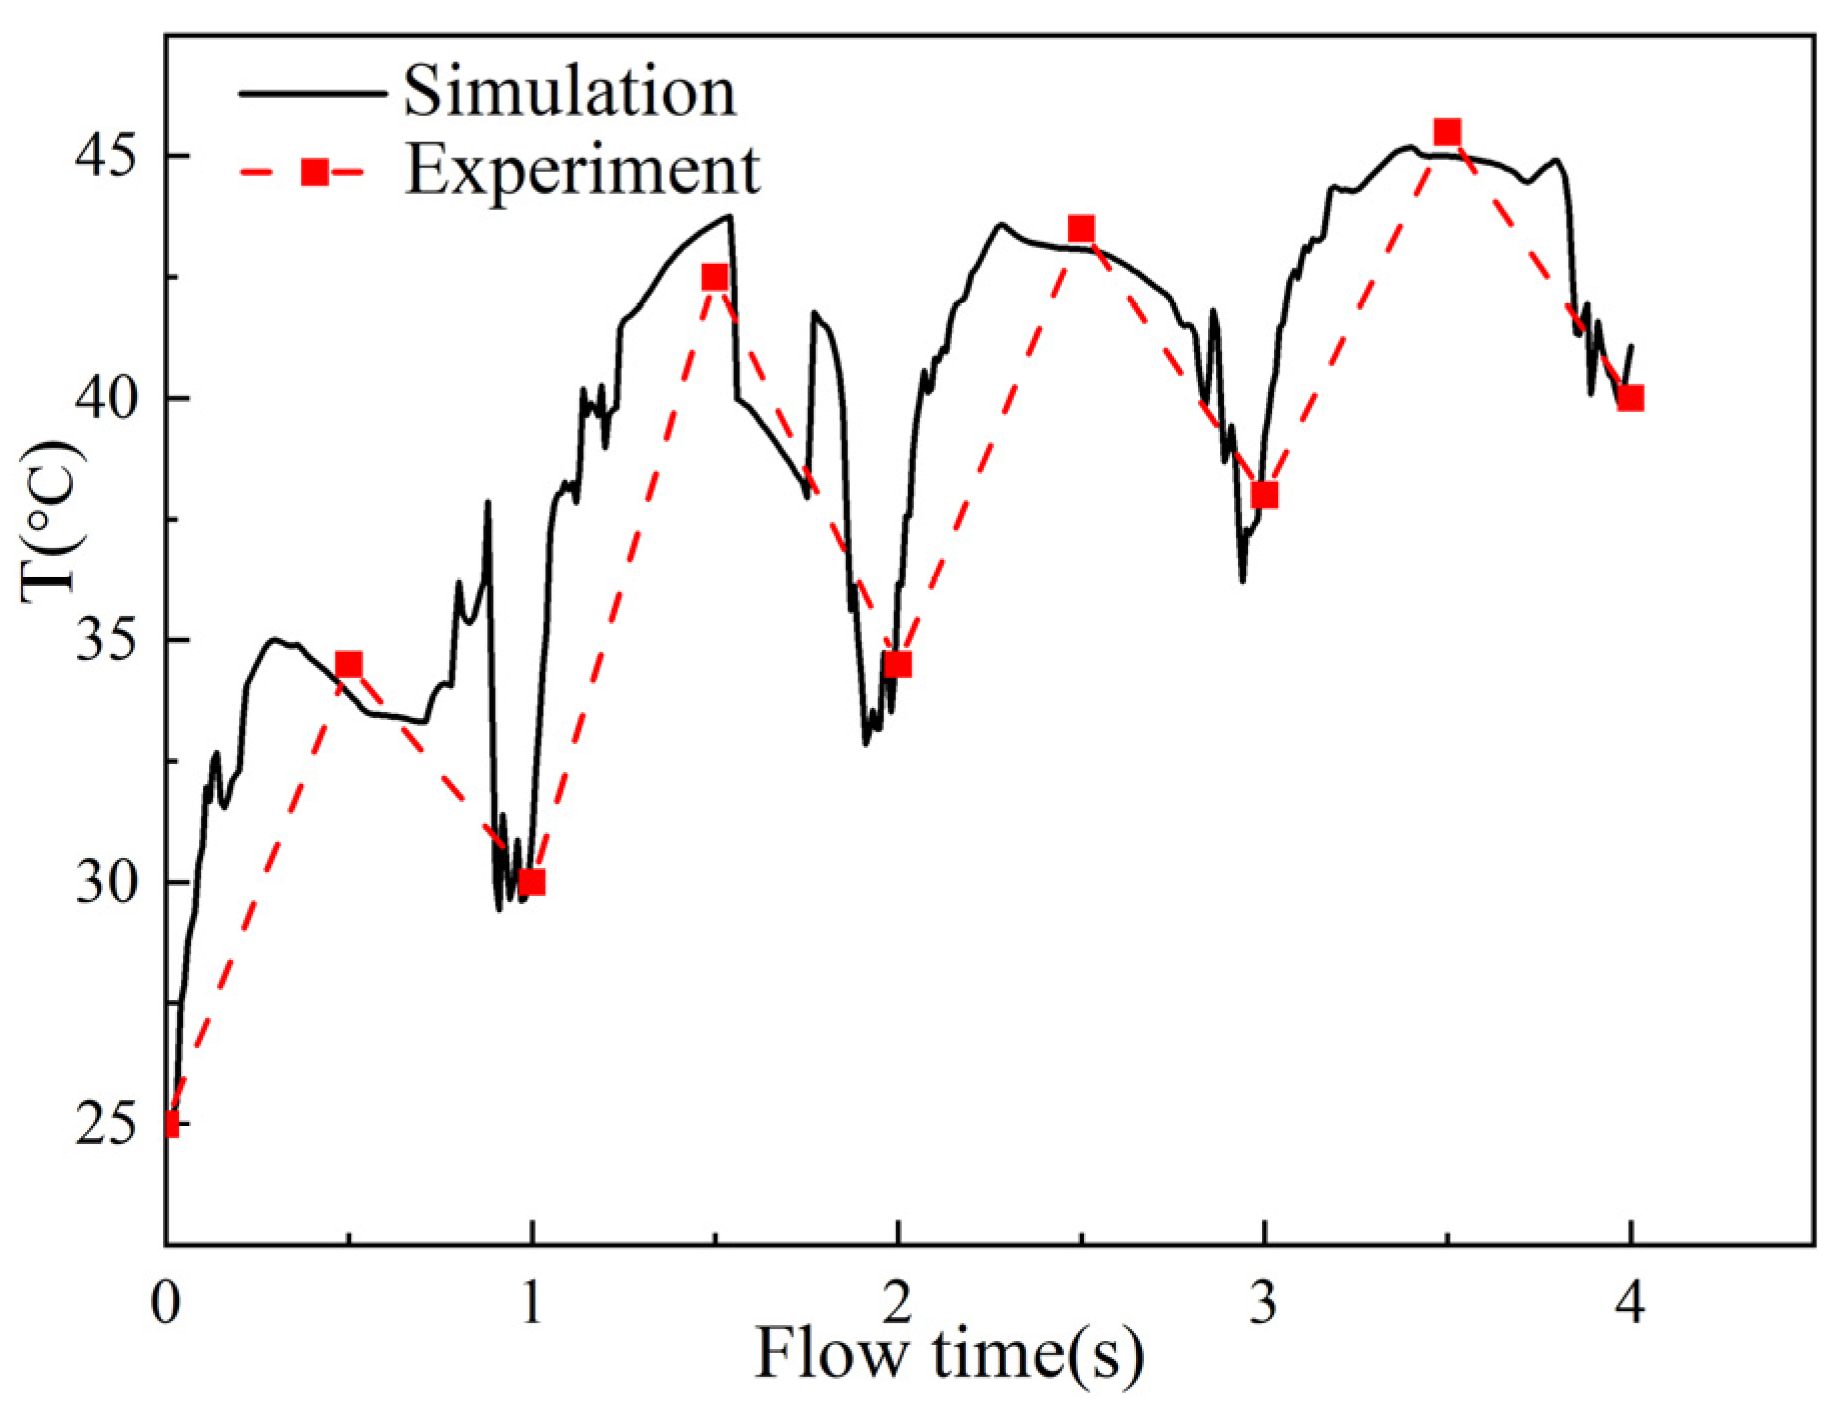
5.1. Comparisons of CFD Simulations and Experiment

As depicted in Figure 6, the actual experimental findings provide a comparative analysis between the temperature change process of the experimental material within the internal meshing screw mixing section, occurring in Mode 1 over the span of 1–4 s, and the corresponding simulation outcomes.
The temperature-measuring instrument utilized in the experiment operates with a measurement cycle of 0.5 s. As depicted in the figure, it can be inferred that the temperature variation at the midpoint of the actual test displays an overall increase. As previously mentioned, the rotor traverses the stator cavity over one second, signifying that the temperature variation of the test point occurs once per second. Notably, within the same cycle, when the rotor moves for half a cycle—specifically, when the rotor rotates to the bottom of the stator—the temperature at the test point effectively reaches its peak. Conversely, within the same cycle, when the rotor completes one full revolution, specifically, when it returns to its initial position, the temperature at the test point essentially achieves its minimum value. This phenomenon occurs because, as the rotor moves further from the test point during its cycle, the test point absorbs heat transferred from the outer wall of the stator. This process occurs continuously, resulting in the highest temperature value. Conversely, as the rotor gradually approaches or even reaches the test point, the test point’s heat is transferred to the rotor wall. Consequently, the temperature of the test point within a cycle reaches its nadir.
The numerical simulation settings align with the previously defined structural and process parameters. As illustrated in the figure, it is apparent that the simulated temperature change profile closely matches the experimental data. This alignment indicates that the data obtained from the simulation corroborates the accuracy of the empirical test results, affirming the universality of the conclusions drawn from the simulation.

5.2. Comprehensive Index of Heat Transfer

This article will employ three distinct heat transfer characterization parameters to investigate the influence of varying process parameters or structural parameters on system heat transfer in different operational modes. The first of these parameters is the average fluid temperature, which is a representative value signifying the system temperature, derived by weighing the average temperature of each internal point within a fluid system. Its formal definition is provided as follows:
T m = x = 1 n S x T x S m i x
In this context, T x denotes the fluid temperature at the x -th grid, S x signifies the surface area of an individual grid, and S m i x represents the cumulative area of the entire fluid domain.
The second characterization parameter pertains to temperature uniformity. Temperature uniformity quantifies the disparity in temperatures among different regions within an object or system. Elevated temperature uniformity is indicative of minimal temperature variations between distinct areas, thus ensuring a more consistent and stable temperature distribution throughout the object or system. The formal definition is provided as follows:
M I T = 1 σ T 2 σ T max 2
In this context, σ T max 2 corresponds to the theoretical maximum variance of fluid temperature. The upper limit of the temperature across the entire system is set at 50 °C, denoted as σ T max 2 = 50 − T m . Additionally, σ T 2 represents the standard deviation of fluid temperature throughout the complete fluid domain:
σ T 2 = 1 S m i x x = 1 n ( S x ( T x T m ) 2 )
Consequently, the two heat transfer characterization parameters hold significant relevance in the context of heat transfer. They encompass distinct facets of heat transfer phenomena. Variations in the average fluid temperature can effectively signify the flow and heat transfer dynamics throughout the heat transfer process, thereby serving as a gauge for heat transfer efficiency. Temperature uniformity, on the other hand, captures the collective thermal energy distribution within the fluid. Thus, to attain the most objective and efficacious heat transfer index, it is imperative to consider both these parameters concurrently. Drawing inspiration from the methodology of Omari and Guer [40], we can consolidate these parameters to derive a novel and comprehensive heat transfer index:
C I m = 1 t f i n a l t f i n a l 0 U I d t
The definition of U T is as follows:
C I = T m M I T
C I represents a pivotal index employed to depict the temporal evolution of the system’s instantaneous heat transfer performance (hereafter referred to as the thermal performance parameter). This metric serves as a valuable tool for appraising the instantaneous heat transfer efficiency of the system, thereby elucidating the dynamic alterations in the system’s heat transfer performance.
C I m serves as an assessment tool for determining the average heat transfer performance of the system over the designated time frame t = 0 t f i n a l . As indicated by prior research findings, a noteworthy correlation is evident, with increased thermal performance parameters closely aligning with heightened system heat transfer efficiency.

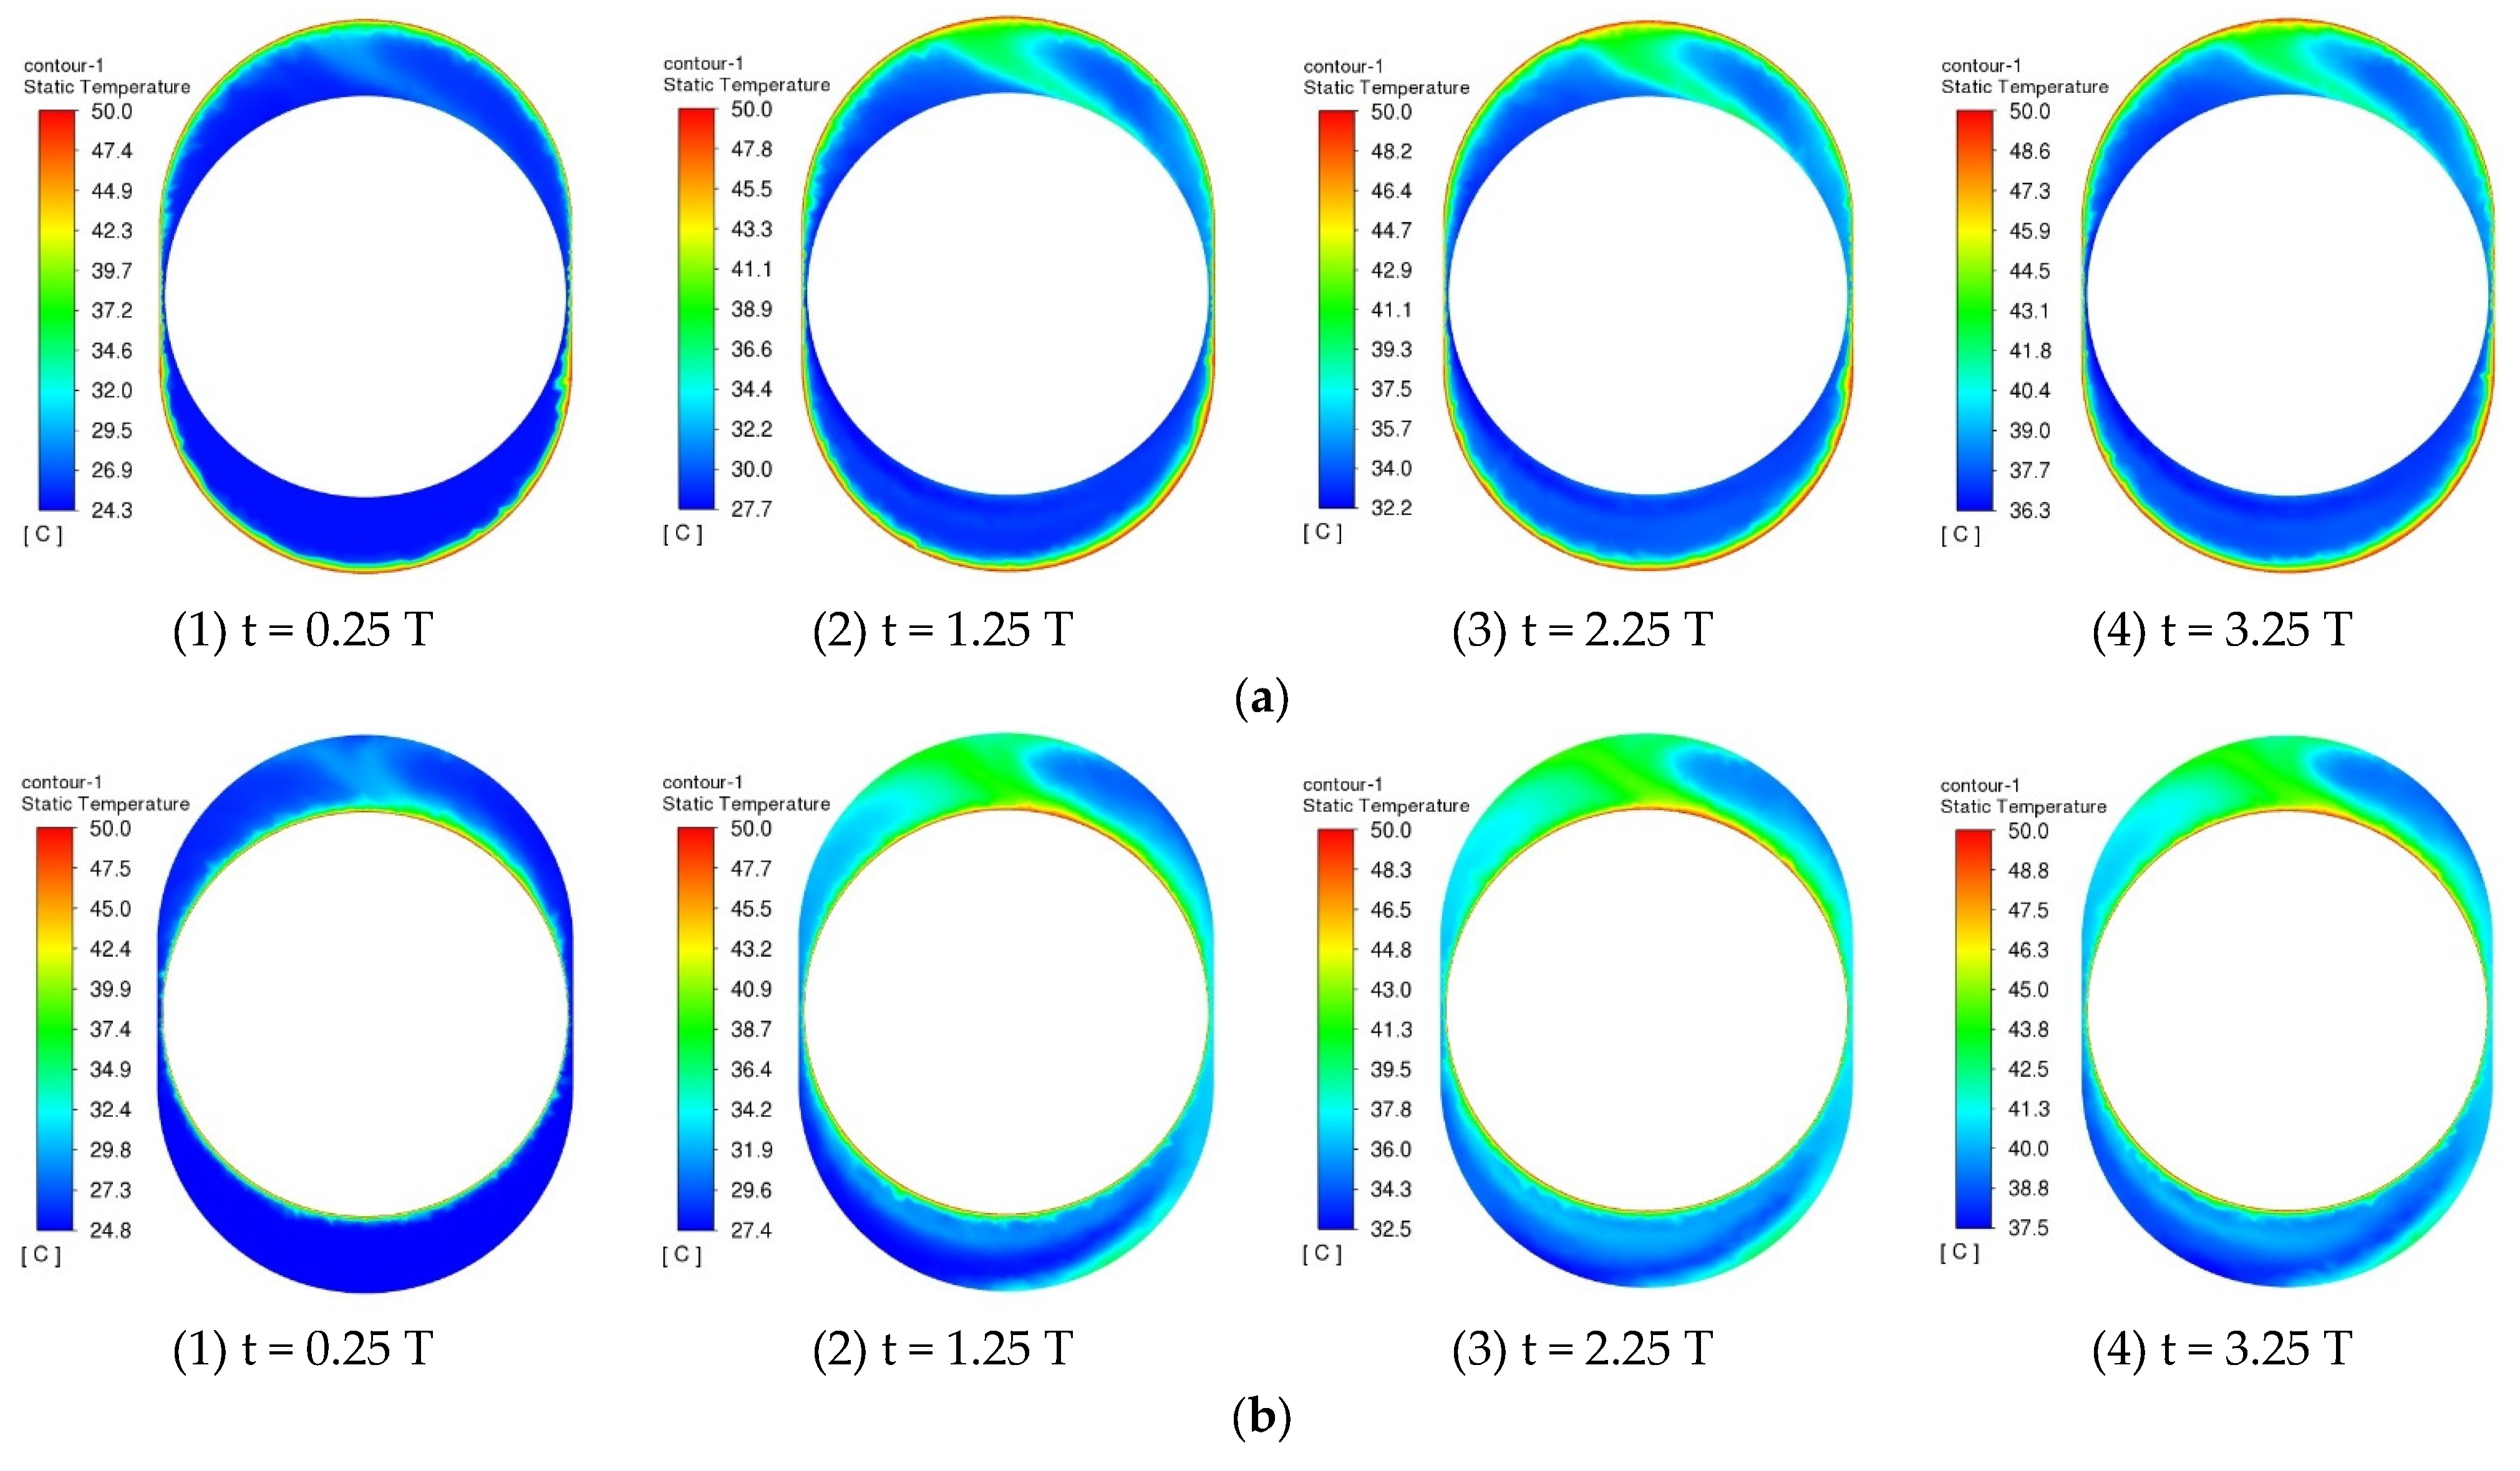
5.3. Heat Transfer Mechanism in Two Models

In the course of conventional screw extruder operations, as the material undergoes heating within the extruder barrel, the transmission of heat from the heating element to the material is indispensable for achieving the melt-processing phase [41]. This heat transfer process encompasses a combination of diffusion, convection, and radiation [42,43,44]. Within the screw extruder, heat primarily propagates to the material via diffusion and convection mechanisms. More specifically, heat generated by the heating element initially diffuses to the screw and barrel, and, subsequently, propelled by the rotation and pressure exerted by the screw, the heated material undergoes convection between the screw and barrel, thereby facilitating the transfer of heat.
One can draw upon the heat transfer research methodologies established for traditional screw extruders and employ them in the investigation of convective heat transfer efficiency within the realm of internal meshing screw mixers. Heat transfer mechanisms within the internal meshing screw mixer can be categorized into two primary modes. Mode 1 entails the transfer of high temperatures from the outer wall of the stator to the interior, while Mode 2 involves the conveyance of elevated temperatures from the inner rotor wall to the external surroundings. An in-depth analysis of the heat transfer mechanisms within the internal meshing screw mixing conveyor section, operating under these two modes, is conducted through the comparison of temperature cloud diagrams at various time intervals and a thorough exploration of the dynamic trends in heat transfer efficiency, taking into account varying process and structural parameters.
As depicted in the Figure 8, the temperature trend cloud diagram showcases the movement of the rotor to the midpoint of the stator in each cycle of the internal meshing screw mixing and conveying section within the time frame of t = 1~4 s. Figure 8a clearly illustrates the transfer of heat to the fluid domain through the stator wall. At t = 0.25 s (corresponding to the first cycle as the rotor moves from its initial position to the midpoint of the stator), a thin layer of thermally activated fluid becomes evident within the stator wall. Within this region, there is a pronounced temperature gradient. By t = 1.25 s, the heated fluid residing on the stator’s heat transfer wall has traversed to the rotor wall and further dispersed, giving rise to a heat fluid wake where temperature gradients are notably high. At t = 3.25 s, the stator’s heat transfer wall still exhibits a trail of thermally activated fluid streaming toward the rotor wall, while the thermal fluid on the stator wall continues its diffusion toward the rotor wall. As time progresses, both the fluid temperature and the temperature gradient expand. Hence, based on the evolving fluid temperature trends and the flow direction of heated fluid as observed in the temperature cloud diagram, it can be deduced that Mode 1 primarily involves convective heat transfer.
Figure 8b illustrates the heat transfer mechanism through the rotor wall to the fluid domain. At t = 0.25 s, a layer of thermally activated fluid is also observed on the rotor wall’s surface, with the thermal fluid’s presence on the upper wall of the rotor being more pronounced compared to the lower wall. This disparity arises from the rotor’s recent movement from its initial position to the midpoint of the stator, facilitating greater heat dispersion on the rotor wall during its motion. By t = 1.25 s, the heated fluid on the rotor wall continues to diffuse outward, displaying a divergent trend. At t = 3.25 s, the diffusion pattern of thermal fluid remains relatively consistent with the earlier observations; however, the rate of temperature change becomes less pronounced, signifying that heat transfer in Mode 2 predominantly occurs through diffusion.
Displayed in Figure 9, the evolving trends of fluid average temperature, temperature uniformity, and instantaneous heat transfer comprehensive indicators are analyzed within the time frame of t = 1~4 s for both operational modes. Figure 9a provides a comparative view of the average fluid temperature and temperature uniformity in these two modes. The illustration reveals a consistent increase in the overall average fluid temperature over the specified time range. This phenomenon is attributed to the elevated temperature of the heat transfer wall in relation to the fluid. Notably, Mode 2 consistently maintains a higher average temperature than Mode 1. This is primarily due to the smaller heat transfer wall area of the rotor in Mode 2 compared to the stator in Mode 2, resulting in the dissipation of the same amount of heat over a reduced surface area and, consequently, leading to a higher average fluid temperature.
In Figure 9b, the temperature uniformity curve provides valuable insights. It reveals an initial decrease, followed by a periodic pattern of increase and decrease in both operational modes. This distinctive behavior arises from the uneven temperature distribution between the inner surface of the rotor and the outer stator wall. The process begins with either the inner or outer surfaces heating and transferring heat. As the heat transfer continues, the rotor rotates along its own axis within the inner stator wall while moving along the stator. Both rotations are synchronized and in opposite directions, leading to periodic variations in fluid temperature and, consequently, a corresponding cyclic dynamic stability. Notably, the magnitude and amplitude of fluctuations in Mode 1 are greater than those in Mode 2. This disparity indicates that Mode 1 maintains a more uniform system temperature distribution, resulting in enhanced heat transfer efficiency. The even temperature distribution reduces heat accumulation and losses, ultimately improving the overall heat transfer efficiency.
Referring to the instantaneous heat transfer comprehensive index diagram depicted in Figure 9b, we can observe that the trends of these indicators under both operational modes exhibit remarkable similarities. Furthermore, the variations in Mode 1 exhibit a steeper ascent and descent pattern, accentuating the contrast in heat transfer performance between the two modes. This differentiation is aptly illustrated through the temperature uniformity and heat transfer comprehensive index curves. Notably, Mode 1 demonstrates superior convective heat transfer capabilities compared to Mode 2.

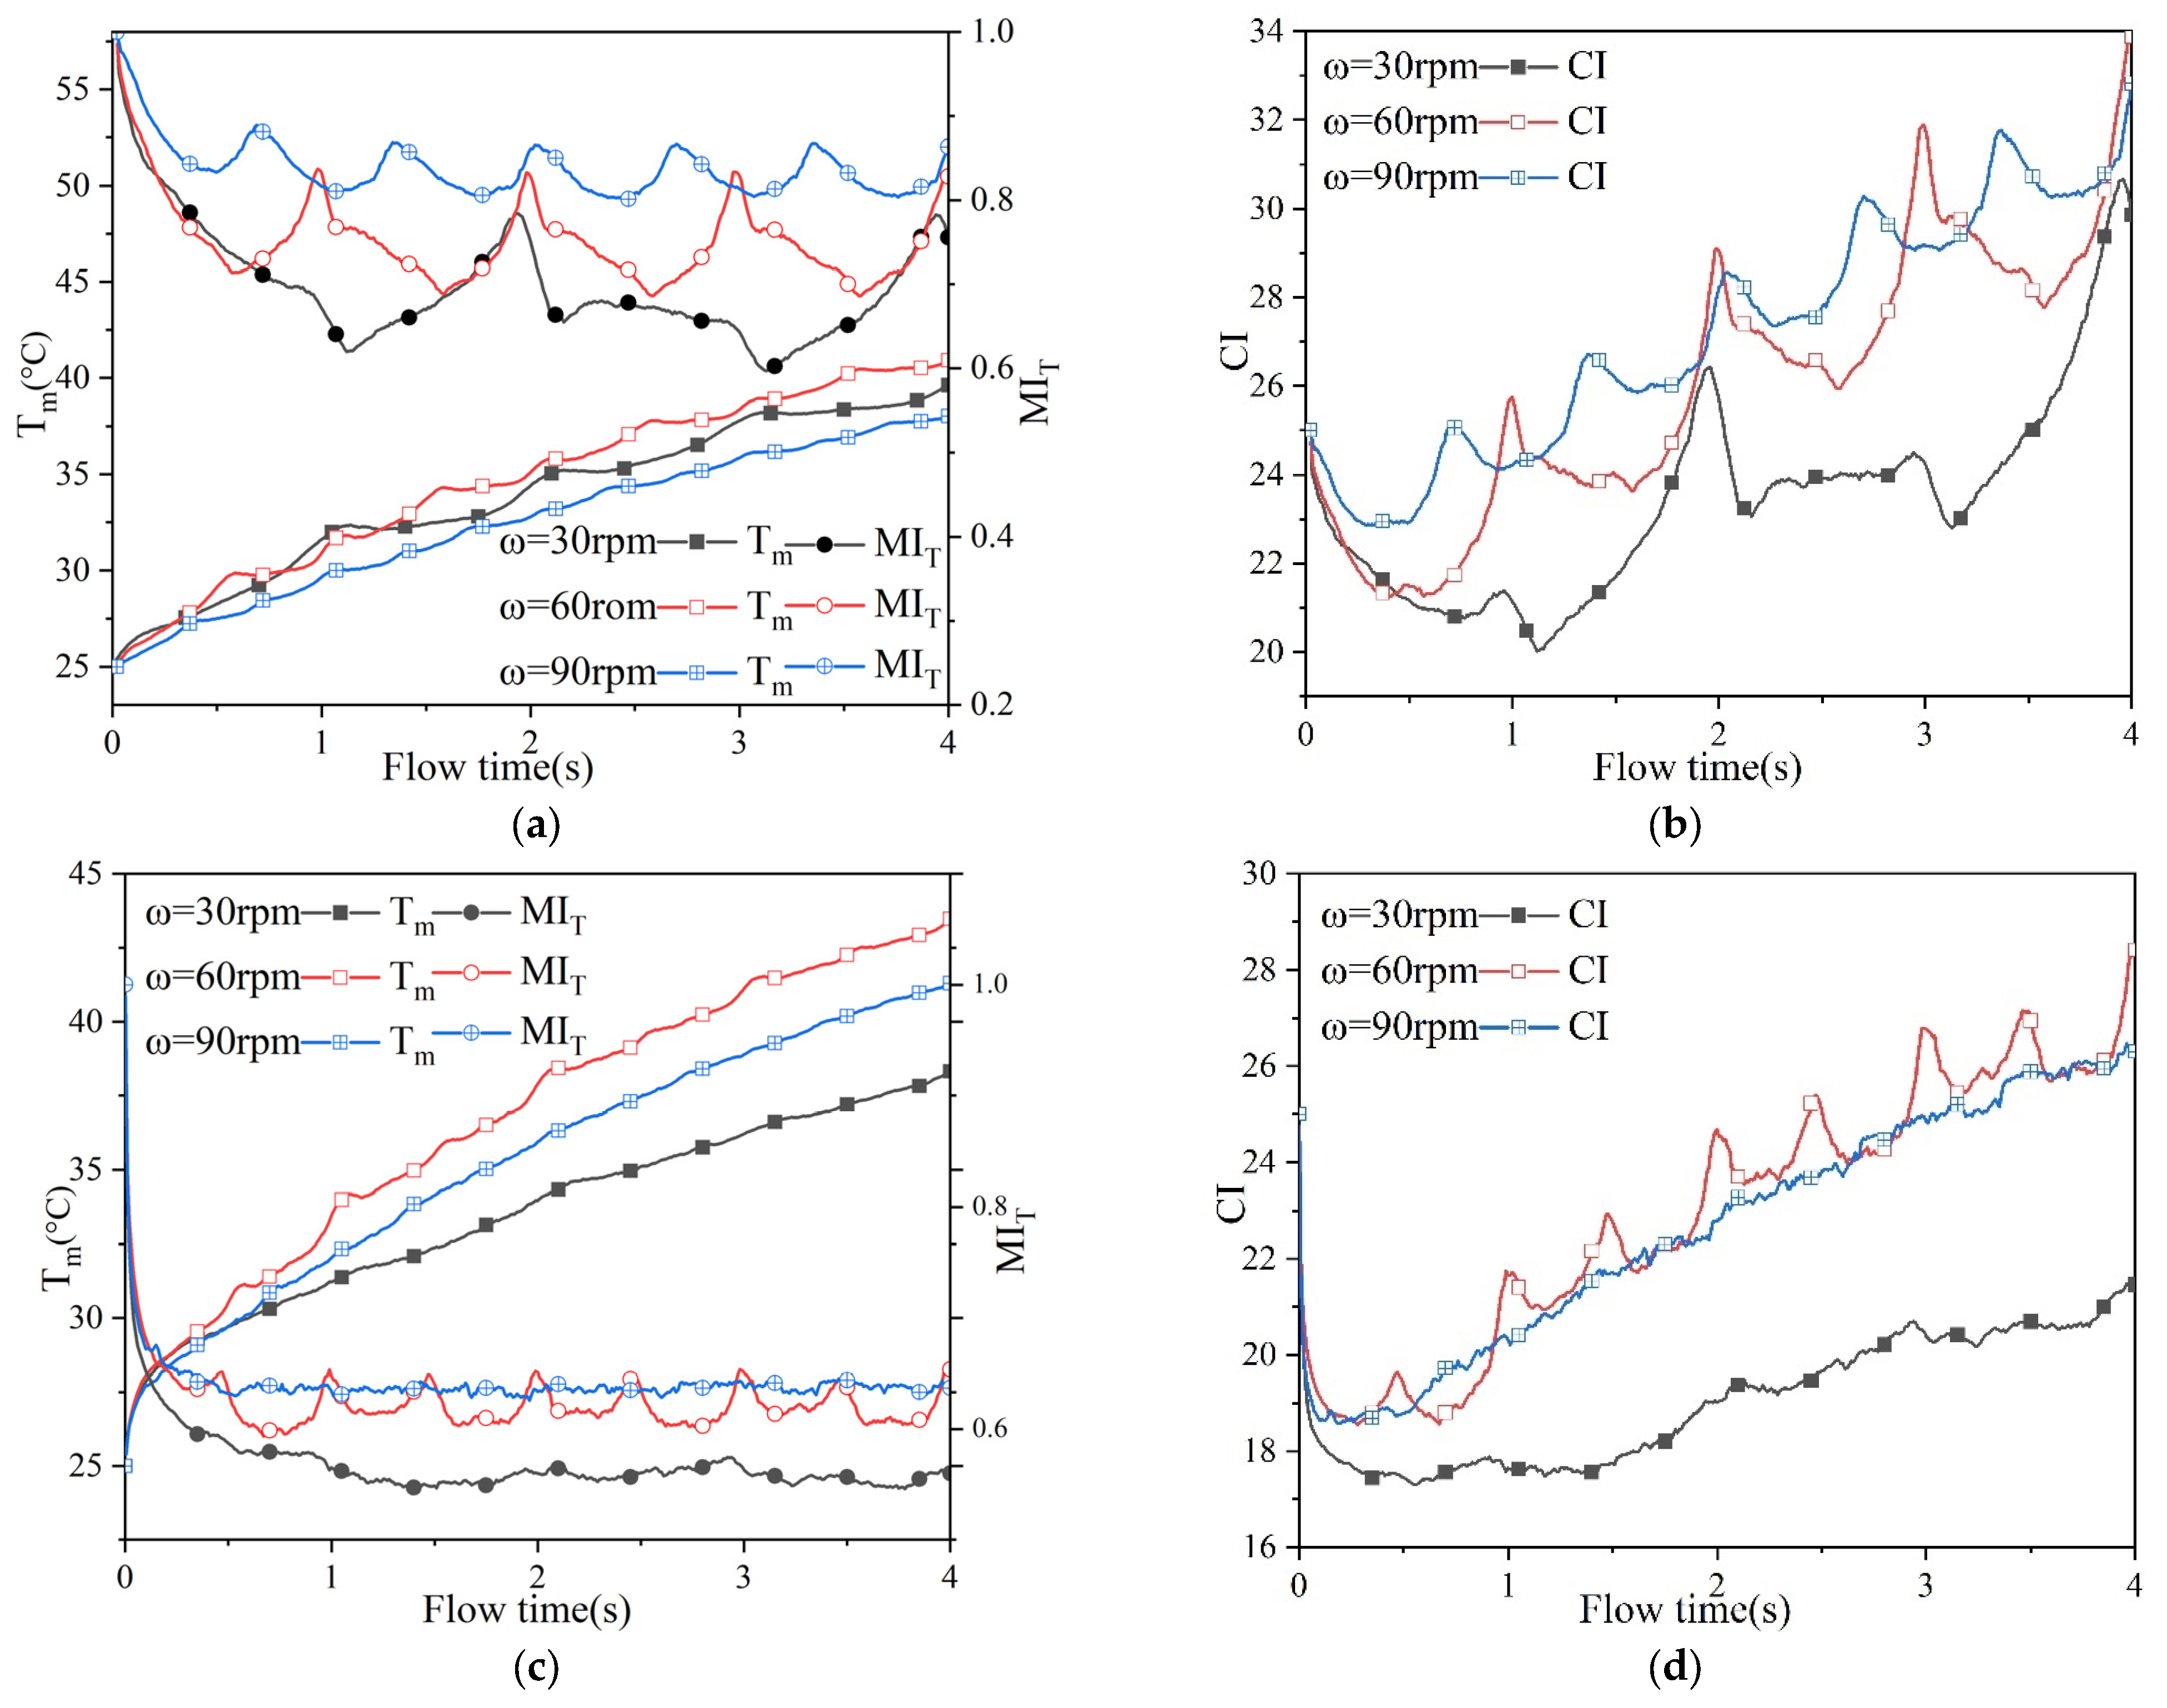
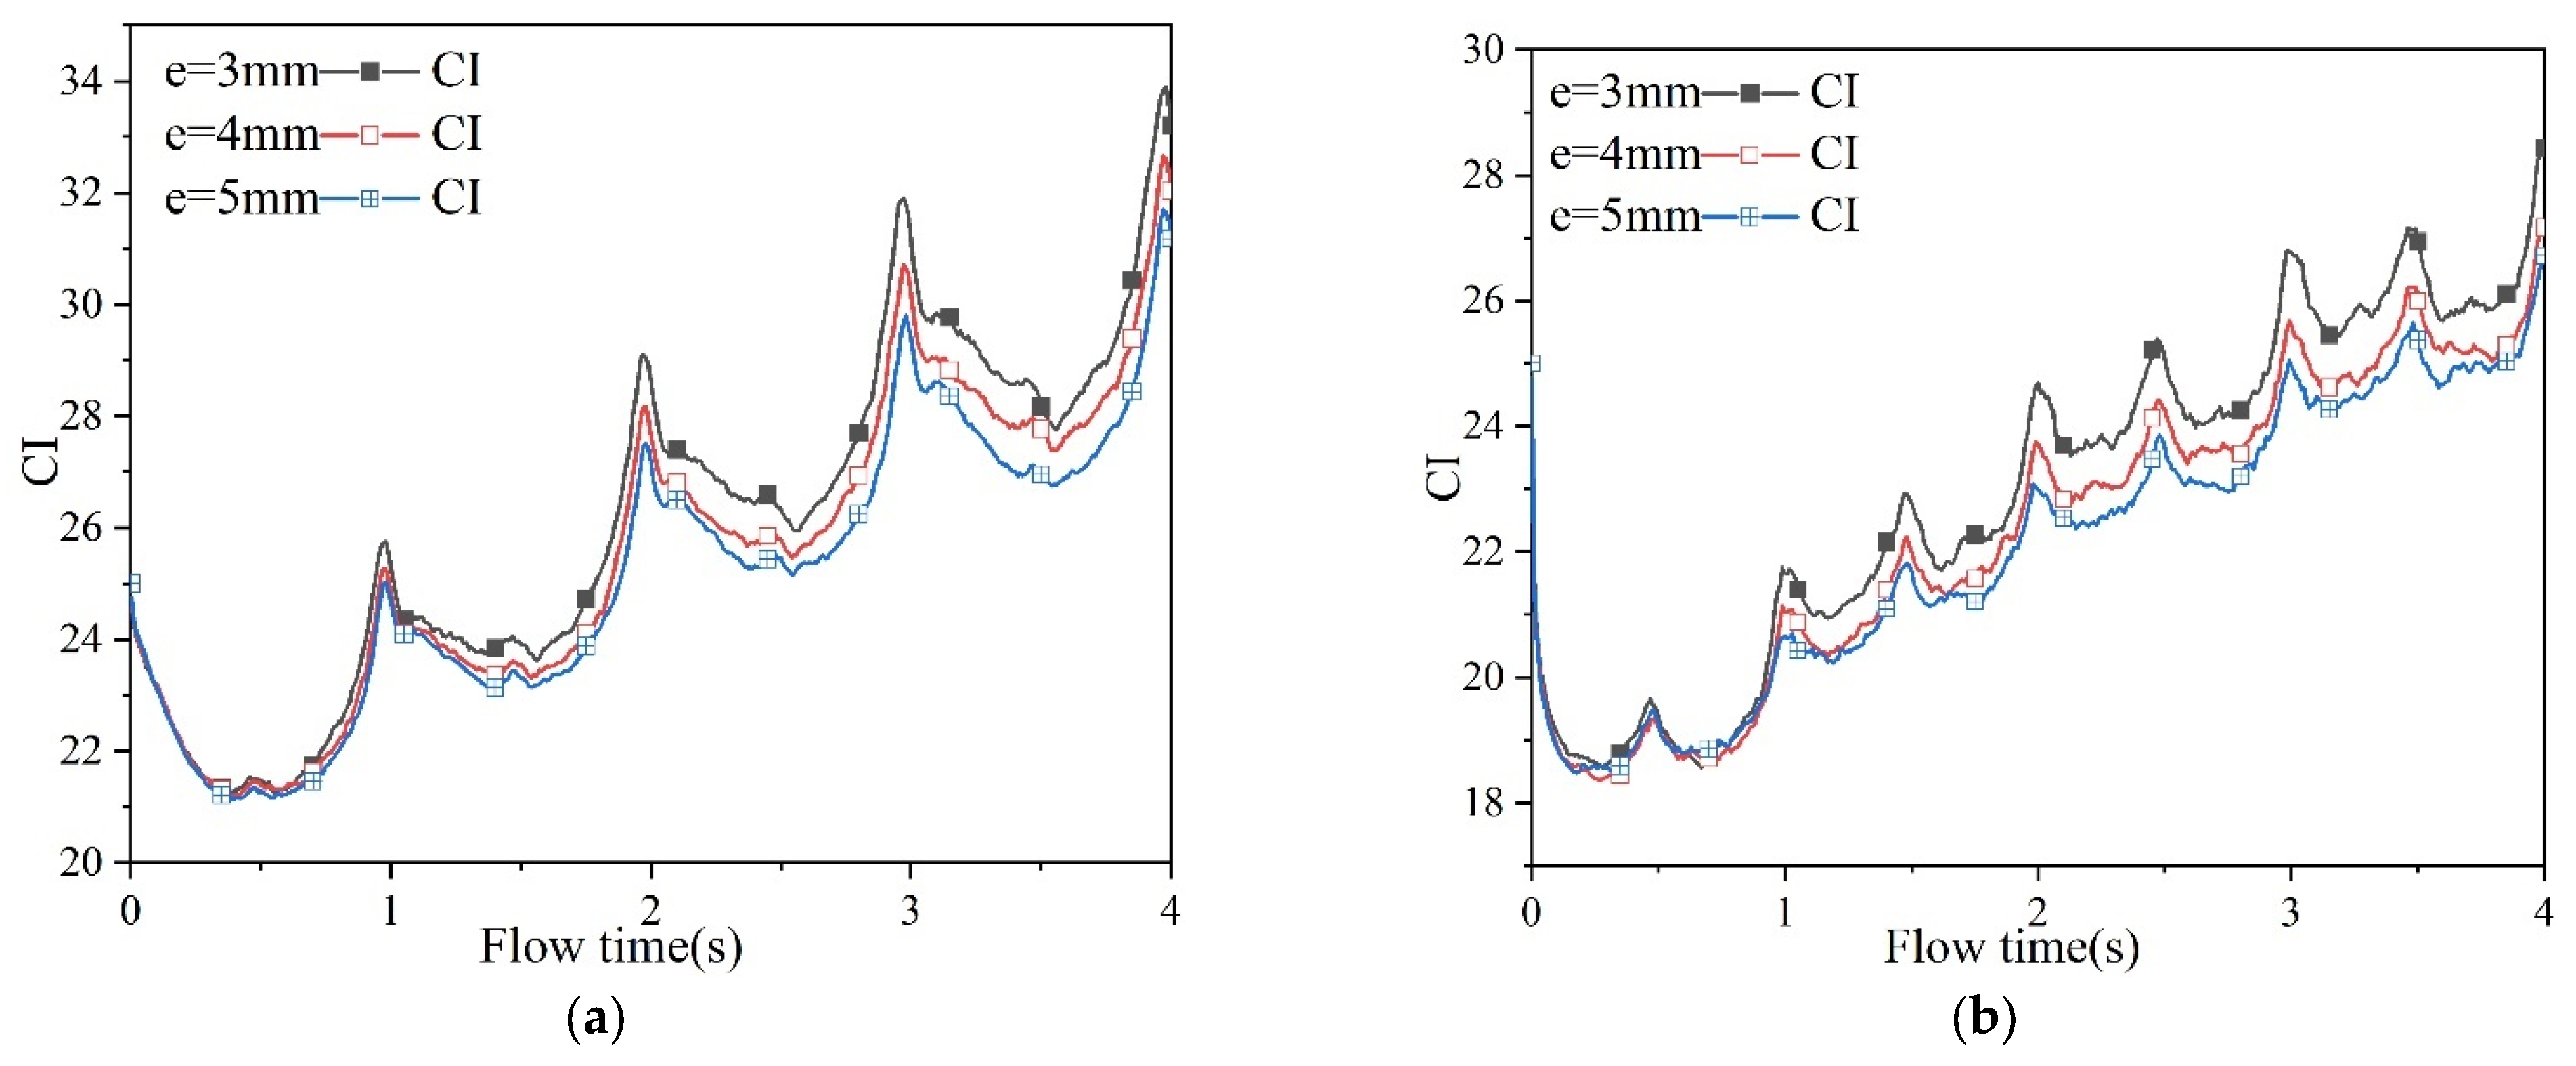
5.4. Effect of Process Parameters on Heat Transfer

Investigate the influence of varying rotational speeds ( ω = 30, 60, and 90 rpm) on the heat transfer efficiency within the internal meshing mixing device. Figure 10a,b, presented below, provides an overview of the impact of rotational speed on T m , M I T , and C I in both operational modes. In the context of Figure 11a, corresponding to Mode 1, it is evident that the T m of ω = 30 and 60 rpm consistently surpasses that of ω = 90 rpm throughout a complete cycle. Notably, within the time interval t = 0~1 s, the T m curves of ω = 30 rpm and ω = 60 rpm exhibit alternating leadership. This alternation is rooted in the fact that 1 s represents one full cycle of rotor rotation, where a cycle involves movement from the upper apex to the lower apex and back to the starting position. It is imperative to highlight that, prior to 0.4 s, the T m of ω = 30 rpm exceeds that of ω = 60 rpm. This phenomenon can be attributed to the heat transfer mechanism in Mode 1, which entails heat transfer from the outer wall of the stator to the interior. Consequently, when the rotor initially descends from the upper vertex, the top region of the stator’s heat transfer wall is the closest point with the largest heat transfer area. Therefore, at lower rotational speeds, more heat is absorbed from the outer wall. As evidenced in Figure 11, the trend becomes apparent; at lower rotational speeds, the duration of the increasing T m period is prolonged, thereby causing the alternating patterns between ω = 60 rpm and ω = 30 rpm. Due to the variance in the time required for a full cycle of rotation at different speeds, the moment corresponding to the maximum T m value within one cycle also varies with speed.
In Figure 10a, the M I T curve exhibits a characteristic pattern characterized by an initial decrease, followed by the establishment of dynamic stability, which resembles the shape of a sin x function. It is discernible that the M I T variations at ω = 90 rpm appear relatively smooth, whereas those at ω = 60 rpm and 30 rpm are marked by a more convoluted profile. This phenomenon underscores that higher rotational speeds contribute to a more uniform temperature distribution within the system. Notably, with reference to the T m diagram, ω = 90 rpm is associated with the lowest T m value, resulting in minimal temperature fluctuations, enhanced temperature uniformity, and elevated temperature uniformity values.
Analyzing Pattern 1 in Figure 10b reveals that, under the influence of three different rotational speeds, there is an overall upward trend in the C I curve. The C I curve of ω = 90 rpm follows a similar trajectory to that of C I , exhibiting a uniform periodic increase. Notably, the change observed at ω = 60 rpm is particularly significant, with the peak node within each cycle surpassing the value of ω = 90 rpm, indicating that, at certain time points, its C I is higher than that of ω = 90 rpm. Figure 10b also highlights that the C I curve adheres to a specific pattern. This pattern is characterized by different time requirements for a full cycle of rotation at varying speeds. For instance, ω = 90 rpm experiences a complete cycle in approximately 0.5 s, while ω = 60 rpm completes a cycle in 1 s, and ω = 30 rpm takes 2 s for one cycle. Consequently, by evaluating the C I value of the peak node within each cycle, it becomes evident that, overall, increasing the rotational speed leads to higher C I values. Notably, ω = 60 rpm stands out as having the highest heat transfer efficiency within the system.
In Mode 2, a detailed examination of the T m , MIT, and C I curves presented in Figure 10c,d reveals intriguing insights. Across all three rotational speeds, the T m associated with ω = 60 rpm surpasses that of the other two speeds, and the contrast between the T m of ω = 30 rpm and the other two average temperatures continues to widen. Regarding Figure 10c, it is noteworthy that solely the ω = 60 rpm curve maintains dynamic stability, while the M I T curves for the other rotational speeds remain predominantly stable with no observable trends. Figure 10d provides further clarity by illustrating a conspicuous trend: the C I value for ω = 30 rpm is significantly smaller than that of the other two speeds, and this gap progressively widens. The C I value for ω = 60 rpm generally exceeds that of ω = 90 rpm. Additionally, the C I curve for ω = 60 rpm maintains a distinct peak period of 0.5 s, while the growth of C I for the other two speeds follows a relatively slower and more stable trajectory. Consequently, within Mode 2, ω = 60 rpm consistently exhibits the highest heat transfer efficiency. A comparative analysis of the C I diagrams for Mode 1 and Mode 2 reveals notable distinctions. Notably, the C I curve of Mode 1 exhibits a distinct periodic pattern, while this characteristic is observed solely in the C I curve for ω = 60 rpm in Mode 2. Furthermore, the C I for Mode 1 consistently outperforms Mode 2 in terms of both growth rate and C I values, thus reaffirming the superior convective heat transfer efficiency of Mode 1. This leads to the conclusion that an increase in rotational speed has a positive effect on heat transfer efficiency. In a broader context, higher rotational speeds correspond to enhanced heat transfer efficiency. Nevertheless, among the three rotational speeds, ω = 60 rpm stands out as the optimal parameter with the highest convective heat transfer efficiency.

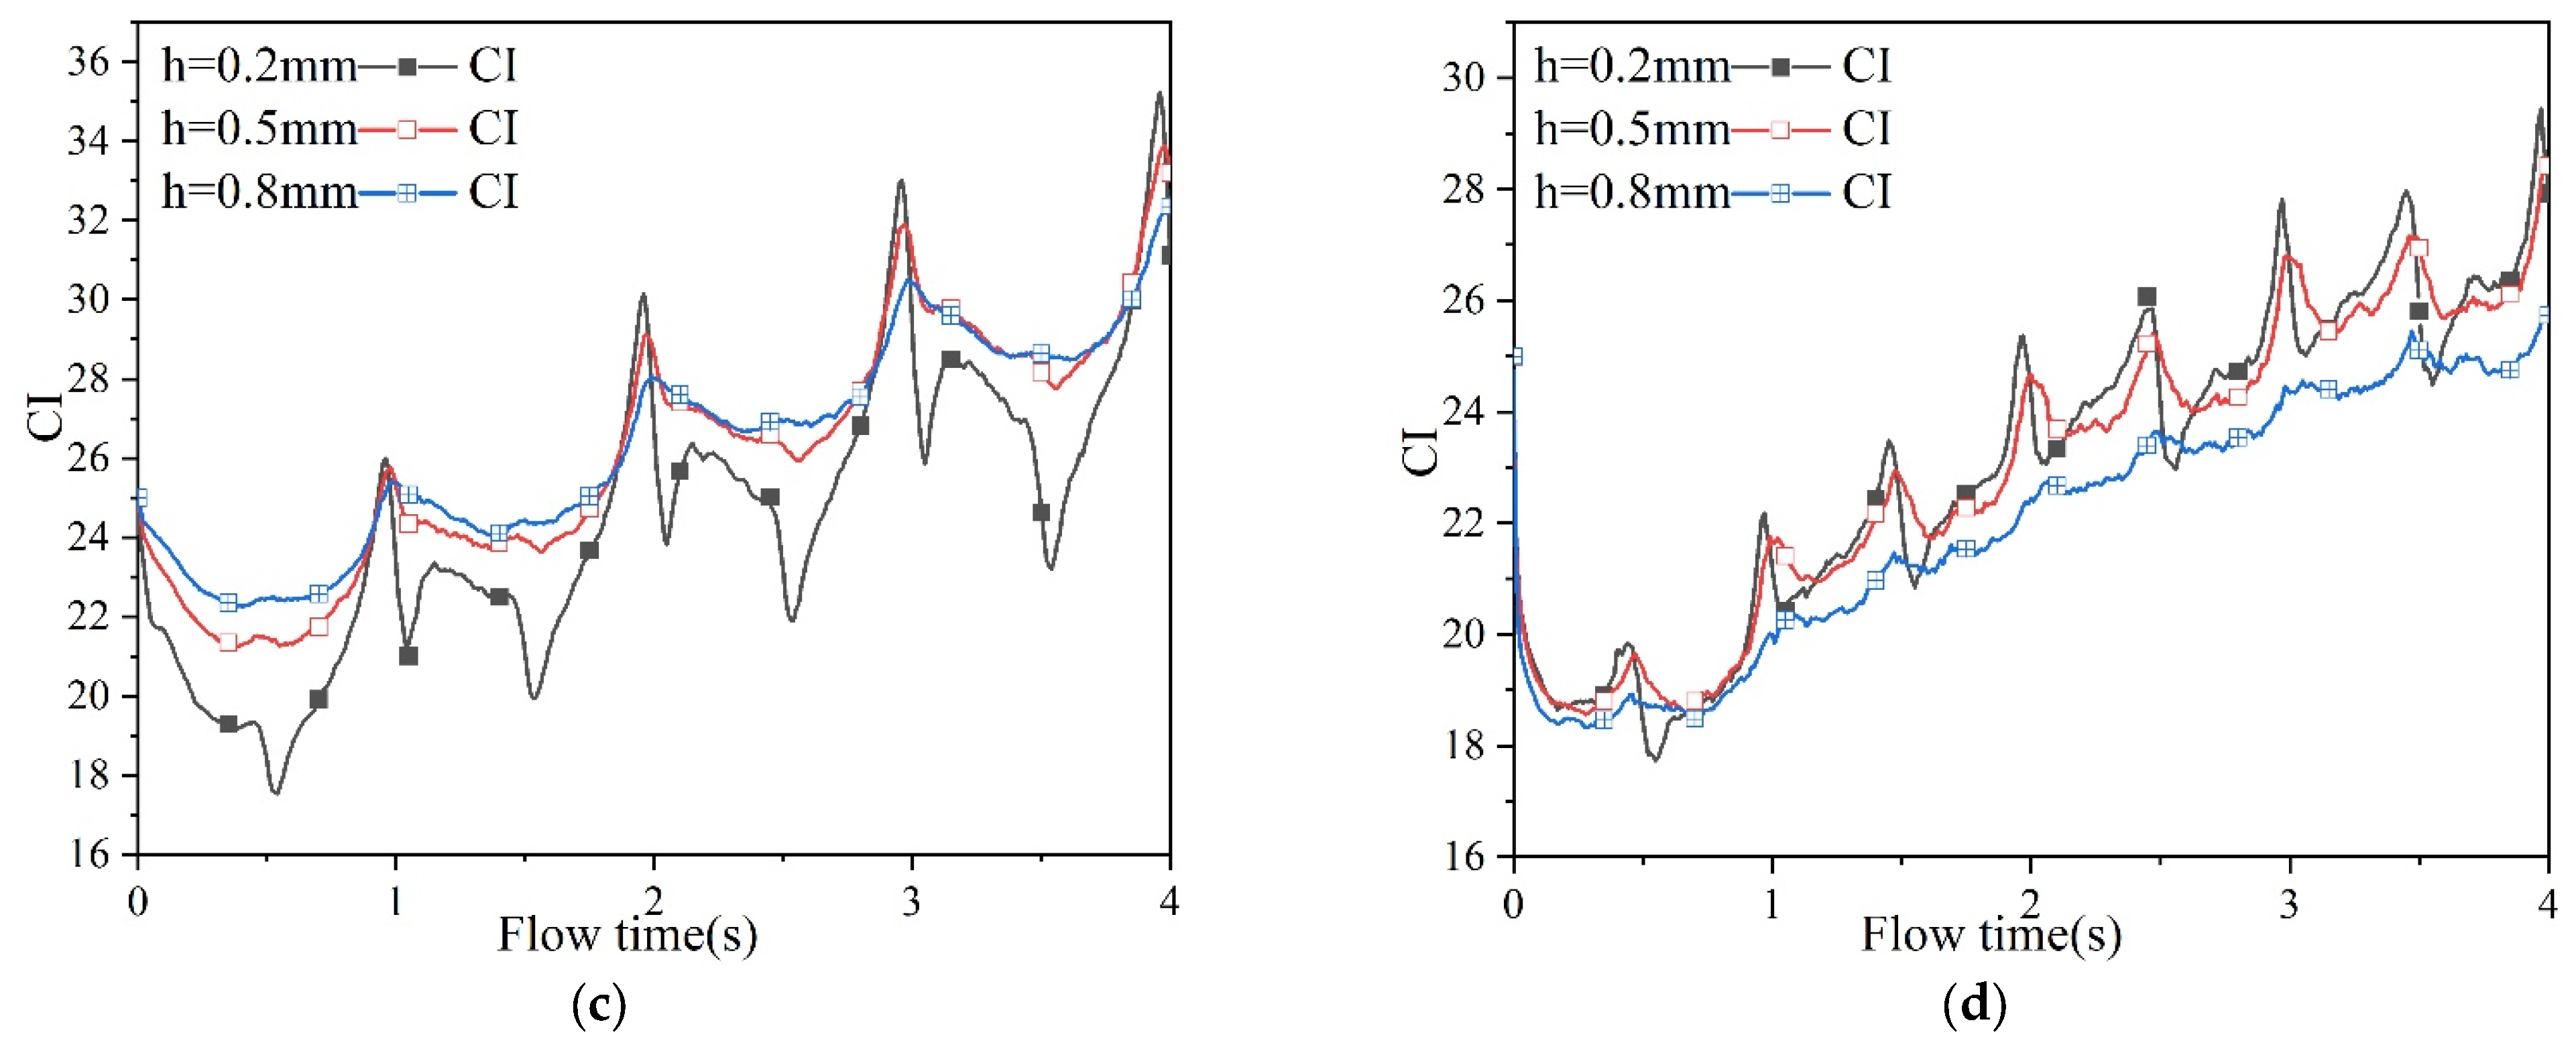
5.5. Effect of Structural Parameters on Heat Transfer

Our investigation delves into the influence of eccentricity on heat transfer within the internal meshing screw mixing device. Device eccentricity, in this context, denotes the displacement between the center of the rotor section and the center of the stator section. We maintained a constant rotational speed at ω = 60 rpm while systematically varying the eccentricity (e) to 3 mm, 4 mm, and 5 mm. Our focus was on comprehending how eccentricity impacts the heat transfer dynamics of the device during the time interval of t = 1~4 s.
Figure 11a,b presented below depict the heat transfer comprehensive index curves for various eccentricities in both modes. Examining Figure 11a, focusing on Mode 1, it is evident that, as eccentricity increases, the comprehensive ( C I ) exhibits a consistent decrease. Moreover, the influence of increased eccentricity on heat transfer efficiency becomes progressively more pronounced over time. This phenomenon can be attributed to the combined effects of heat transfer surface area and distance. When the system’s eccentricity is increased, the heat transfer distance likewise increases, resulting in a diminished heat flow rate. Consequently, the C I decreases with higher eccentricities. Notably, regardless of the specific eccentricity values, the C I consistently reaches its peak within the first second, demonstrating a certain periodicity. Furthermore, it is noteworthy that, as depicted in the preceding discussion concerning the impact of varying rotational speeds on system heat transfer, the C I curves in both Mode 1 and Mode 2 exhibit periodic patterns, particularly prominent in the case of ω = 60 rpm.
In Figure 11b, under Observation Mode 2, the overall trend of the heat transfer comprehensive index aligns with that observed in Mode 1. However, notable distinctions arise when comparing the C I curves for eccentricities of 3 mm, 4 mm, and 5 mm. It is evident that the C I curve for e = 3 mm is notably higher than the curves for e = 4 mm and 5 mm, with the discrepancy progressively widening. This behavior is attributed to the Mode 2 heat transfer process, where heat is transferred from the inner wall of the rotor to the outer wall of the stator. Specifically, when the eccentricity is set to 3 mm, the rotor section traverses the stator section over the shortest distance. Consequently, the minimum separation between the inner rotor wall and the outer stator wall is achieved, facilitating enhanced heat transfer communication and significantly boosting heat transfer efficiency in comparison to the other two eccentricities. Comparing the C I curves of Modes 1 and 2, it is evident that the curve for Mode 1 exhibits a steeper incline than the curve for Mode 2, particularly within the time range of t = 1~4 s. Furthermore, the heat transfer index value in Mode 1 is consistently larger than that in Mode 2, reinforcing the conclusion that the heat transfer efficiency of Mode 1 surpasses that of Mode 2.
Investigating the influence of clearances on system heat transfer is essential. The term “gap” refers to the minimum distance between the rotor and stator sections. Excessive gap sizes can result in material leakage. Consequently, we set the gap (h) at values of 0.2 mm, 0.5 mm, and 0.8 mm to assess its effect on the heat transfer process within the system during the time frame t = 1~4 s. Upon examining the C I diagram presented in Figure 11c for Mode 1, it is evident that the curve associated with a 0.2 mm gap initially experiences a decline, followed by a subsequent increase during the t = 1 s interval. Correspondingly, the convection transfer index is at its peak at the commencement of the rotor section, diminishing when it reaches the central point of the stator section, and surging again as it approaches the lower section of the semicircle. This substantial curve fluctuation indicates that Mode 1 relies on convection heat transfer as its primary mechanism. Convection heat transfer is characterized by its rapid heat transfer capabilities. Swift heat transfer from high-temperature regions to lower-temperature regions results in rapid fluid temperature changes, accompanied by a decrease in fluid temperature uniformity. Comparing the highest C I values within a cycle, it becomes evident that the overall heat transfer comprehensive index does not exhibit significant differences across the three gap sizes. Systems with smaller gaps demonstrate higher heat transfer, albeit with reduced stability. Hence, maintaining the gap within a specific range has a limited impact on the system’s heat transfer efficiency.
Examine Mode 2 as illustrated in Figure 11d. In this mode, heat transfer primarily occurs through diffusion, which is characterized by a relatively slower heat transfer process. Consequently, in Mode 2, the C I curves exhibit similar trends across the three gap sizes. Smaller gaps result in more substantial heat transfer comprehensive index curves. This is attributed to the diffusion-based heat transfer mechanism in Mode 2, which results in less pronounced changes in the heat transfer comprehensive index curves when compared to Mode 1. By comparing the comprehensive heat transfer index values between the two modes and their respective heat transfer rates, it becomes evident that the convective heat transfer in Mode 1 is still more efficient than the diffusion heat transfer observed in Mode 2.

6. Conclusions

This article provides a comprehensive exposition on the internal meshing screw mixing experimental device, elucidating its structure, working principles, and operational processes. Subsequently, the heat transfer mechanism inherent to this device is meticulously investigated, manifesting through the establishment of two distinctive heat transfer modes and the application of three discrete heat transfer characterization methods to assess convective heat transfer efficiency. The investigation extends to an exploration of the influences exerted by rotational speed, eccentricity, and gap dimensions on heat transfer efficiency. Furthermore, the precision of the simulation experiment is methodically validated through actual testing. The rotational speed’s influence on heat transfer efficiency is positively evident, with ω = 60 rpm demonstrating the highest heat transfer efficiency among the three speed parameters. Notably, the heat transfer efficiency of ω = 60 rpm in Mode 1 surpasses that in Mode 2. Increasing eccentricity leads to a decrease in heat transfer efficiency, and this effect becomes progressively more pronounced over time. Regardless of eccentricity variations, the comprehensive heat transfer efficiency reaches its maximum value within one second, displaying a certain periodicity. The heat transfer efficiency curve for Mode 1 exhibits a steeper growth rate over time, underscoring its superior heat transfer efficiency compared to Mode 2. Smaller gaps correspond to larger heat transfer comprehensive index curves. Convective heat transfer in Mode 1 results in significant fluctuations in heat transfer efficiency within each cycle. By comparing the results of the simulation test with those of the physical experiment, it is confirmed that the temperature changes are fundamentally consistent, validating the universality of the simulation results. This study has successfully established a critical relationship between diverse structural configurations, process parameters, and convective heat transfer efficiency within the context of internal meshing screws. These findings not only provide a fundamental framework for enhancing heat transfer efficiency in internal meshing screws but also offer valuable guidance for the design and optimization of internal meshing screw systems. This research has significant implications for the field of polymer engineering and science.

Author Contributions

Resources, Y.H., X.C. and X.L.; methodology, Y.H.; writing—original draft, Y.H.; writing—review and editing, Y.H., F.G. and Y.L.; funding acquisition, F.G.; project administration, F.G.; investigation, G.W., Z.H., N.L., G.L. and Y.L.; supervision, G.W. and Z.H.; data curation, N.L., G.L. and D.M.; software, G.L., X.C. and D.M.; validation, X.C.; visualization, X.L. All authors have read and agreed to the published version of the manuscript.

Funding

This project is supported by the National Natural Science Foundation of China: 32060414, the Natural Science Foundation of Inner Mongolia, China: 2023QN05034, the Natural Science Foundation of The Autonomous Region Military–Civilian Integration Key Research & Soft Science Research Projects of Inner Mongolia: JMZD202201, Scientific Research Project of Universities In Inner Mongolia: NJZY21461. Inner Mongolia Autonomous Region Key R&D and Achievement Transformation Plan: 2023YFDZ0006, Hohhot Science and Technology Planning Project: 2023-gao-6, and the Inner Mongolia Natural Science Foundation: 2022MS06023.

Institutional Review Board Statement

Not applicable.

Informed Consent Statement

Not applicable.

Data Availability Statement

The data are contained within the article.

Conflicts of Interest

The authors declare no conflict of interest.

References

  1. Tofail, S.A.; Koumoulos, E.P.; Bandyopadhyay, A.; Bose, S.; Lisa, O.D.; Charitidis, C. Additive manufacturing: Scientific and technological challenges, market uptake and opportunities. Mater. Today 2018, 21, 22–37. [Google Scholar] [CrossRef]
  2. Arun, K.S.; Bhandari, R.; Aherwar, A.; Rimašauskienė, R.; Camelia, P. A study of advancement in application opportunities of aluminum metal matrix composites. Mater. Today Proc. 2020, 26, 2419–2424. [Google Scholar]
  3. Evode, N.; Qamar, S.A.; Bilal, M.; Barceló, D.; Iqbal, H.N. Plastic waste and its management strategies for environmental sustainability. Case Stud. Chem. Environ. Eng. 2021, 4, 100142. [Google Scholar] [CrossRef]
  4. Karkala, S.; Ramachandran, R. Investigating the effects of material properties on the mixing dynamics of cohesive particles in a twin screw mixer using a discrete element method approach. Powder Technol. 2022, 409, 117762. [Google Scholar] [CrossRef]
  5. Ren, A.; Koleng, J.J.; Costello, M.; Spahn, J.E.; Smyth, H.D.; Zhang, F. Twin-Screw Continuous Mixing Can Produce Dry Powder Inhalation Mixtures for Pulmonary Delivery. J. Pharm. Sci. 2023, 112, 272–281. [Google Scholar] [CrossRef] [PubMed]
  6. Kotamarthy, L.; Ramachandran, R. Mechanistic understanding of the effects of process and design parameters on the mixing dynamics in continuous twin-screw granulation. Powder Technol. 2021, 390, 73–85. [Google Scholar] [CrossRef]
  7. Qu, J.P.; Chen, J.J.; Liu, H.Y.; Zhang, G.Z.; Ying, X.C.; He, H.Z. Recent Advances in Volume Stretching Deformation Processing and Forming Methods. Polym. Bull. 2013, 9, 9–17. [Google Scholar]
  8. Gupta, S.; Vanapalli, S. Microfluidic shear rheology and wall-slip of viscoelastic fluids using holography-based flow kinematics. Phys. Fluids 2020, 32, 012006. [Google Scholar] [CrossRef]
  9. Venerus, D.C. A novel and noninvasive approach to study the shear rheology of complex fluid interfaces. J. Rheol. 2023, 67, 923–933. [Google Scholar] [CrossRef]
  10. Matsumiya, Y.; Watanabe, H. Non-Universal Features in Uniaxially Extensional Rheology of Linear Polymer Melts and Concentrated Solutions: A Review. Prog. Polym. Sci. 2021, 112, 101325. [Google Scholar] [CrossRef]
  11. Gamonpilas, C.; Kongjaroen, A.; Methacanon, P. The importance of shear and extensional rheology and tribology as the design tools for developing food thickeners for dysphagia management. Food Hydrocolloids 2023, 140, 108603. [Google Scholar] [CrossRef]
  12. Sefiane, K.; Koşar, A. Prospects of heat transfer approaches to dissipate high heat fluxes: Opportunities and challenges. Appl. Therm. Eng. 2022, 215, 118990. [Google Scholar] [CrossRef]
  13. Stehlík, P.; Jegla, Z.; Kilkovský, B. Possibilities of intensifying heat transfer through finned surfaces in heat exchangers for high temperature applications. Appl. Therm. Eng. 2014, 70, 1283–1287. [Google Scholar] [CrossRef]
  14. Ali, S.A. Design and dynamic simulation of a photovoltaic thermal-organic Rankine cycle considering heat transfer between components. Energy Convers. Manag. 2020, 225, 113435. [Google Scholar]
  15. Natesan, K.; Karinka, S. A comprehensive review of heat transfer enhancement of heat exchanger, heat pipe and electronic components using graphene. Case Stud. Therm. Eng. 2023, 45, 102874. [Google Scholar] [CrossRef]
  16. Dović, D.; Horvat, I.; Filipović, P. Impact of velocities and geometry on flow components and heat transfer in plate heat exchangers. Case Stud. Therm. Eng. 2021, 197, 117371. [Google Scholar] [CrossRef]
  17. Lewandowski, A.; Wilczyński, K. Modeling of Twin Screw Extrusion of Polymeric Materials. Polymers 2022, 14, 274. [Google Scholar] [CrossRef] [PubMed]
  18. Estrada, O.; Ortiz, J.C.; Hernández, A.; López, I.; Chejne, F.; María, D.N. Experimental study of energy performance of grooved feed and grooved plasticating single screw extrusion processes in terms of SEC, theoretical maximum energy efficiency and relative energy efficiency. Energy 2020, 194, 116879. [Google Scholar] [CrossRef]
  19. Marschik, C.; Roland, W.; Osswald, T.A. Melt Conveying in Single-Screw Extruders: Modeling and Simulation. Polymers 2022, 14, 875. [Google Scholar] [CrossRef]
  20. Eitzlmayr, A.; Koscher, G.; Reynolds, G.; Huang, Z.Y.; Booth, J.; Shering, P.; Khinast, J. Mechanistic modeling of modular co-rotating twin-screw extruders. Int. J. Pharm. 2014, 474, 157–176. [Google Scholar] [CrossRef]
  21. Andrea, L.G.; Fiorio, R.; Erkoç, M.; Cardon, L.; D’hooge, D.R. Theoretical Evaluation of the Melting Efficiency for the Single-Screw Micro-Extrusion Process: The Case of 3D Printing of ABS. Processes 2020, 8, 1522. [Google Scholar]
  22. Chang, Y. Study on Visualization Twin-Screw Extrusion and Plasticizing Quality of Simulation Material for Energetic Materials; BUCT: Beijing, China, 2023; p. 001338. [Google Scholar]
  23. García-León, R.A.; Afanador-García, N.; Gómez-Camperos, J.A. Numerical Study of Heat Transfer and Speed Air Flow on Performance of an Auto-Ventilated Disc Brake. Fluids 2021, 6, 160. [Google Scholar] [CrossRef]
  24. Zeng, X.X.; Yu, H.; Hw, T.B.; Mao, N. A Numerical Study on Heat Transfer Characteristics of a Novel Rectangular Grooved Microchannel with Al2O3/Water Nanofluids. Energies 2022, 15, 7187. [Google Scholar] [CrossRef]
  25. Kim, M.H.; Pettersen, J.; Bullard, C.W. Fundamental process and system design issues in CO2 vapor compression systems. Prog. Energy Combust. Sci. 2004, 30, 119–174. [Google Scholar] [CrossRef]
  26. Barr, R.A. Extruder screw with improved energy efficient melting. US Patent 2003, 7, 29. [Google Scholar]
  27. Fei, T.; Yin, L.; Xin, C.L.; He, Y.D. Heat Transfer Model of Cooling Single-Screw Polymer Melt. J. Beijing Univ. Chem. Technol. 2021, 48, 50–58. [Google Scholar]
  28. Jian, R.R.; Xie, P.Y.; Ding, Y.M.; Yang, W.M. Application of Field Synergy Theory in Polymer Processing. Plastics 2019, 48, 8–11. [Google Scholar]
  29. Rauwendaal, C. Heat transfer in twin screw compounding extruders. AIP Conf. Proc. AIP Publ. 2016, 1779, 030014. [Google Scholar]
  30. Liu, P.; Peng, X.B.; Song, Y.T. Subcooled water flow boiling heat transfer in screw cooling tubes under one-sided heating conditions. Appl. Therm. Eng. 2017, 113, 621–631. [Google Scholar] [CrossRef]
  31. Kamal, S.D.; Fazilati, M.A.; Hajatzadeh, A. Surface Scraped Heat Exchanger for cooling Newtonian fluids and enhancing its heat transfer characteristics, a review and a numerical approach. Appl. Therm. Eng. 2015, 87, 56–65. [Google Scholar]
  32. Wen, Q.Y.; Zhi, R.P.; Wu, Y.T.; Lei, B.; Liu, S.W.; Shen, L.L. Performance optimization of a heat pump integrated with a single-screw refrigeration compressor with liquid refrigerant injection. Energy 2020, 207, 118197. [Google Scholar] [CrossRef]
  33. Kang, B.H. Study on the Solid Conveying Process and Characteristics of a Single-Screw Eccentric Rotating Extruder; SCUT: Guangzhou, China, 2020; p. 000248. [Google Scholar]
  34. Zhang, H.H. Preparation and Structural Properties Study of PVDF-Based Composite Materials under Volume Stretching Rheological Action; SCUT: Guangzhou, China, 2021; p. 004999. [Google Scholar]
  35. Peng, J.G.; Shao, S.S.; Shao, S.A.; Shi, L.; Huang, Q.M. Inertial Force Analysis of a Four-Cylinder Gasoline Engine Designed Based on the Epitrochoid Principle. Small Intern. Combust Engines Veh. Technol. 2023, 52, 18–23+27. [Google Scholar]
  36. Fan, D.J. Numerical Simulation and Experimental Study on the Flow Field and Mixing Performance of an Eccentric Rotating Extruder; SCUT: Guangzhou, China, 2019; p. 003079. [Google Scholar]
  37. Qu, J.P.; Wu, T. Innovation in Materials Development with Volume Stretch Rheological Plasticization and Transport Technology. Sci. Technol. Rev. 2020, 8, 54–62. [Google Scholar]
  38. Qu, J.P.; Wu, T. Research Progress in Technological Innovation of Polymer Product Batch Manufacturing and Forming. Mech. Electr. Eng. Technol. 2018, 47, 1–6. [Google Scholar]
  39. Tong, Y.R. Study on the Mechanism of CPVC and PVC Twin-Screw Eccentric Rotational Plasticizing Extruder; SCUT: Guangzhou, China, 2021; p. 001099. [Google Scholar]
  40. Kamal, E.O.; Yves, L.G. Alternate rotating walls for thermal chaotic mixing. Int. J. Heat Mass Transfer. 2010, 53, 123–134. [Google Scholar]
  41. Jaluria, Y. Chapter One–Heat and Mass Transfer in Materials Processing and Manufacturing. Adv. Heat Transfer. 2016, 48, 1–94. [Google Scholar]
  42. Xie, P.Y.; Zhang, X.B. Study on the influence of periodic contraction and expansion flow disturbance on convection heat transfer. Int. Commun. Heat Mass Transfer. 2022, 138, 106384. [Google Scholar] [CrossRef]
  43. Zontul, H.; Şahin, B. Experimental investigation of convective heat transfer performance and hydrodynamics of pulsating flow through the rectangular grooved channel. Exp. Therm. Fluid Sci. 2023, 141, 110796. [Google Scholar] [CrossRef]
  44. Gao, J.; Hu, Z.H.; Yang, Q.G.; Liang, X.; Wu, H.W. Fluid flow and heat transfer in microchannel heat sinks: Modelling review and recent progress. Therm. Sci. Eng. Prog. 2022, 29, 101203. [Google Scholar] [CrossRef]
Figure 1. Schematic diagram of the plane principle of the mixed conveying section.
Applsci 14 00220 g001
Figure 2. Schematic diagram of experimental equipment.
Applsci 14 00220 g002
Figure 3. Cross-section diagram of each part of the internal meshing screw mixing section: (a) schematic diagram of the internal meshing screw mixing section structure; (b) compression section A cross-section; (c) cross-section of reflux section; and (d) cross-section of compressed section B.
Applsci 14 00220 g003
Figure 4. Schematic diagram of experimental instruments: (a) schematic diagram of axial and radial temperature measurement; (b) schematic diagram of experimental instrument points; (c) digital viscometer; (d) silicone rubber heating plate; (e) electric heating digital display constant temperature water bath; and (f) oil plug.
Applsci 14 00220 g004
Figure 5. Grid operation cloud diagram of the cross-section of the internal meshing screw mixing section.
Applsci 14 00220 g005
Figure 6. Temperature changes in experimental and simulation points.
Applsci 14 00220 g006
Figure 7. Grid independence verification.
Applsci 14 00220 g007
Figure 8. Temperature variation cloud maps in two modes: (a) Mode 1 temperature change cloud chart; and (b) Mode 2 temperature change cloud chart.
Applsci 14 00220 g008
Figure 9. Heat transfer index curves under two modes: (a) average temperature and temperature uniformity curves in two modes; and (b) heat transfer comprehensive index curves under two modes.
Applsci 14 00220 g009
Figure 10. Comprehensive heat transfer index curves at different speeds in two modes: (a) average temperature and temperature uniformity curves of Mode 1 at different rotational speeds; (b) comprehensive index curve of heat transfer in Mode 1 at different speeds; (c) average temperature and temperature uniformity curves of Mode 2 at different rotational speeds; and (d) comprehensive index curve of heat transfer in Mode 2 at different speeds.
Applsci 14 00220 g010
Figure 11. Heat transfer comprehensive index curves for different structural parameters under two modes: (a) comprehensive heat transfer index curve of Mode 1 under different eccentricity; (b) comprehensive heat transfer index curve of Mode 2 under different eccentricity; (c) comprehensive heat transfer index curve of Mode 1 under different clearances; and (d) comprehensive heat transfer index curve of Mode 2 under different clearances.
Applsci 14 00220 g011aApplsci 14 00220 g011b
Table 1. Experimental instruments.
Experimental Instrument NameModelEffect
Silicone rubber heating plate130 mm × 280 mm external digital displayProvide stable heat source
Unilid contact thermometerU T320DContinuously detect temperature changes at the temperature measurement point
High-density fiberglass insulation cotton0.5 m × 1 mMake the outer wall of the stator an insulating wall
Lichen digital display rotational viscometerN DJ-8STest the viscosity of experimental materials
Table 2. The trajectory equation and velocity equation of each point on the rotor.
PointParameter ValueTrajectory EquationVelocity Equation
O1-- x B = e sin ( π 2 + ω t ) = e cos ω t (3) V x B = e ω cos ω t (7)
y B = e sin ( π 2 + ω t ) = e cos ω t (4) V y B = e ω sin ω t (8)
O2LAB = e
φ B A = π 2
x A = 0
y A = 2 e cos ω t
(5) V x A = 0
V y A = 2 e ω sin ω t
(9)
OLBC = e
φ B C = π 2
x C = 2 e sin ω t
y C = 0
(6) V x C = 2 e ω cos ω t
V y C = 0
(10)
Table 3. Parameter settings for dynamic mesh models.
GridNumber of GridsGrid Quality RangeMinimum Grid SizeLocal Encryption SizeOperation Hours
coarse mesh10,2890.67, 0.981 mm0.1 mm12 h
medium grid23,8670.68, 0.980.5 mm0.05 mm16 h
fine mesh196,5150.54, 0.970.1 mm0.01 mm24 h
Disclaimer/Publisher’s Note: The statements, opinions and data contained in all publications are solely those of the individual author(s) and contributor(s) and not of MDPI and/or the editor(s). MDPI and/or the editor(s) disclaim responsibility for any injury to people or property resulting from any ideas, methods, instructions or products referred to in the content.

