Article

Using Big Data Analytics and Heatmap Matrix Visualization to Enhance Cryptocurrency Trading Decisions

1
Department of Management Sciences, Tamkang University, New Taipei City 251301, Taiwan
2
Graduate Institute of Information Management, National Taipei University, New Taipei City 237303, Taiwan
3
Department of Accounting, Chung Yuan Christian University, Taoyuan 320314, Taiwan
*
Author to whom correspondence should be addressed.
Appl. Sci. 2024, 14(1), 154; https://doi.org/10.3390/app14010154
Submission received: 12 November 2023 / Revised: 19 December 2023 / Accepted: 21 December 2023 / Published: 23 December 2023
(This article belongs to the Section Computing and Artificial Intelligence)

Abstract

:
Using the Bollinger Bands trading strategy (BBTS), investors are advised to buy (and then sell) Bitcoin and Ethereum spot prices in response to BBTS’s oversold (overbought) signals. As a result of analyzing whether investors would profit from round-turn trading of these two spot prices, this study may reveal the following remarkable outcomes and investment strategies. This study first demonstrated that using our novel design with a heatmap matrix would result in multiple higher returns, all of which were greater than the highest return using the conventional design. We contend that such an impressive finding could be the result of big data analytics and the adaptability of BBTS in our new design. Second, because cryptocurrency spot prices are relatively volatile, such indices may experience a significant rebound from oversold to overbought BBTS signals, resulting in the potential for much higher returns. Third, if history repeats itself, our findings might enhance the profitability of trading these two spots. As such, this study extracts the diverse trading performance of multiple BB trading rules, uses big data analytics to observe and evaluate many outcomes via heatmap visualization, and applies such knowledge to investment practice, which may contribute to the literature. Consequently, this study may cast light on the significance of decision-making through the utilization of big data analytics and heatmap visualization.

1. Introduction

Share prices may be difficult to forecast given that current information would completely reflect the efficient market theory [1,2]. However, disposition effects [3,4], the overreaction hypothesis [5,6], and even herding behaviors challenge this viewpoint [7,8]. Moreover, market participants may overreact to news releases owing to their overconfidence [9,10,11].
For example, some investors may forecast stock prices by considering various technical trading rules, such as contrarian strategies for stochastic oscillator indicators (SOI) trading rules owing to the overreaction hypothesis [12,13,14], or momentum strategies for moving average (MA) trading rules [15,16] because of trend-following concerns [17,18,19]. Thus, despite the ongoing debate over their profitability, technical trading rules are popular among practitioners [20,21,22].
Although trading strategies and technical trading rules, momentum strategies implied by moving average (MA) and candlestick trading rules [23,24,25], as well as contrarian strategies implied by stochastic oscillator indicators (SOI) and relative strength index (RSI) trading rules [26,27,28], have received considerable attention in the literature and in practice. In other words, there are lots of trading rules employed in financial markets, and we argue that these trading rules, such as moving average, relative strength index, Bollinger Bands, etc., may have their merits; otherwise, these trading rules may not be employed in the investment practice.
In this study, we selected the Bollinger Bands trading strategy over others since Bollinger Bands provides a unique advantage by dynamically adapting to market volatility, offering a robust framework for identifying potential price reversals [29,30]. Their flexibility and proven effectiveness make them a superior choice compared to static trading rules, enhancing adaptability to evolving market conditions and even optimizing trading opportunities [31,32]. However, exploration of the Bollinger Bands trading strategy (BBTS) remains limited. Bitcoin and Ethereum (hereinafter referred to as ETH) are well-known blockchain-based cryptocurrencies [33,34,35,36] that have received immense attention worldwide [3,37,38,39,40].
As such, this study aims to examine the efficacy of the Bollinger Bands Trading Strategy (BBTS) in the Bitcoin and Ethereum markets. Specific research objectives include evaluating BBTS’s performance in different market conditions over the data period (i.e., from 2015–2022; eight-year data period), analyzing its performance, and assessing its potential as a reliable trading tool for these cryptocurrencies [26,41]. The study seeks to contribute extensive insights into the BBTS application, enhancing transparency and understanding of its impact on cryptocurrency trading strategies. Consequently, this study uses Bitcoin and Ethereum spots, two of the most popular cryptocurrencies as our examined objectives to study whether investors using the BBTS would profit from trading these two spots.
In addition, cryptocurrency prices, including those of Bitcoin and Ethereum, known for volatility [42,43], create a unique landscape for potential gains [44]. Embracing the fluctuations, they are not setbacks but opportunities for significant rebounds [45]. The relevant research shows that these cryptocurrencies have the resilience to bounce back, making the dynamic nature of the market a compelling space for investors seeking substantial returns [46,47]. As such, market participants may seize the moment, ride the waves, and let the volatility pave the way to financial opportunities.
This study aims to explore whether investors would profit from BB round-turn trading (hereafter referred to as trading) in these two spots (i.e., Bitcoin and ETH spots). Following BBTS, investors are suggested to buy (sell) financial instruments (i.e., stocks and bonds) as oversold (overbought) signals emitted by the BBTS (i.e., penetrating lower (upper) Bollinger Bands) would be regarded as buying (selling) signals. As such, based on contrarian strategies implied by the BBTS as mentioned above, round-turn Bollinger Bands (BB) trading is defined as buying a cryptocurrency spot when a buy signal is issued (i.e., penetrating lower Bollinger Band) and after selling the cryptocurrency spot when an overbought signal is issued (i.e., penetrating upper Bollinger Band). We also further explore whether using our novel research design (i.e., utilizing the insights provided by a heatmap matrix) would result in greater returns across multiple outcomes in comparison to the conventional research design (i.e., searching for one of the trading rules that would have better performance than other trading rules among limited outcomes).
This study can contribute to the existing literature in several ways. First, we investigate whether market participants would profit from trading these two most popular spots (i.e., Bitcoin and Ethereum spots) via the BBTS, which is understudied in the existing literature. Second, given that either spot prices or futures prices are likely to rebound after price overreactions, we can conclude that trading these two spots would generate profits, even substantial profits, which have rarely been reported in relevant studies. Third, we assert that using our new design (i.e., the wisdom of a heatmap matrix) would yield higher returns in some areas, all of which are higher than the highest return obtained using the conventional design in this study. We believe that these findings are owed to big data analytics and the flexibility of BBTS, both of which are taken into account by our new design. Fourth, given the relatively high volatility of cryptocurrency spot prices, investors trading cryptocurrency spots may cause even higher spot prices to rebound, generating even higher profits by using the BBTS. Thus, if history repeats itself, this study can encourage some investors to trade these two cryptocurrency spots, as these traders may generate the profits shown in this study.

2. Literature Review

2.1. Bollinger Bands Trading Strategy

Concerning Bollinger Bands Trading Strategy (BBTS), one of the popular contrarian technical trading strategies employed in this study, we then introduce that the Bollinger Bands are defined as an X-standard deviation (2-standard deviation in general) above and below the n-day MA (20-day MA in general) of historical closing prices [48,49]. Furthermore, BBTS should use contrarian strategies following price overshooting (i.e., penetrating lower (higher) Bollinger bands deemed as price overshooting). When the low (upper) Bollinger Bands are penetrated, it signals a higher likelihood of price overshooting and an oncoming trend reversal, indicating a buy (sell) signal.

2.2. Market Efficiency

To familiarize ourselves with relevant research, we examine the relevant literature related to market efficiency and inefficiency, herding behaviors and momentum strategies, price overreaction, and contrarian strategies, as well as technical analysis and technical trading rules. Similarly, Schwert [50]) contended that anomalies appear inconsistent with the efficient market hypothesis (EMH), implying that market inefficiency persists in the underlying asset-pricing model [51]. However, in terms of market efficiency, share prices appear difficult to forecast because all available information, based on the efficient market hypothesis (EMH), is fully reflected [1,2]. As such, based on EMH, we may infer whether investors buy financial instruments as buy signals are emitted and then sell financial instruments as sell signals are emitted following BBTS strategies that might not generate profit by proposing H1.
H1: 
According to the market efficiency hypothesis, investors who utilize BBTS would be unable to achieve advantageous outcomes.

2.3. Herding Behavior and Momentum Strategies

Regarding herding behaviors, Griffin, Harris, and Topaloglu [52] found that positive net institutional trading following past excessive intra-day stock returns can largely explain strong contemporaneous daily patterns. Bekiros et al. [53] reported that herding behavior exhibits time-varying dynamic trading patterns that may be explained by overconfidence. Herding behaviors imply that momentum strategies are appropriate when herding behavior exists in financial markets [53,54,55,56,57]. Concerning momentum strategies, Elsayed et al. [37] investigated currency momentum strategies traded on the Chinese Yuan and discovered that momentum strategies can be profitable when combined with a cross-trading strategy. Narayan and Phan [58] provided ample evidence that momentum strategies work for Islamic stocks and discovered that market risk factors, such as excess market returns, value, size, and macroeconomic risk, are critical in explaining profits for investors. Ni, Liao, and Huang [8] demonstrated that because individual investors account for 80% of the trading volume on Chinese stock exchanges, investors may employ momentum strategies for trading stocks. Recently, King and Koutmos [59] demonstrated that, although some cryptocurrency markets exhibit herding or trend chasing, others exhibit contrarian-type behavior. Wang and Hu [51] also revealed that herding behaviors positively influence stock risk premiums.
Furthermore, the following studies might be conducted while delving into the world of cryptocurrency; Bouri et al. [60], for instance, unravel the enigmas surrounding cryptocurrency herding and impart knowledge that impacts portfolio construction, risk assessment, and trading strategies. The impact of COVID-19 on Bitcoin herding is examined by Mandaci and Cagli [61], who doubt the established market efficiency hypothesis. Mnif and Jarboui [62] introduce a groundbreaking examination of Bitcoin’s response to crises, providing insights into the phenomenon of herding behavior. In their study, Aslam et al. [63] delve into the intricate realm of cryptocurrency inefficiencies, uncovering a dynamic market characterized by herd mentality in times of turmoil. In their seminal work, Cheah and Fry [64] illuminate the speculative speculations surrounding Bitcoin by presenting empirical evidence that challenges widely accepted notions regarding the denominators of the currency. Participating in these studies will therefore facilitate comprehension of the intricacies inherent in the domain of cryptocurrencies.
In terms of price overreaction, Chopra, Lakonishok, and Ritter [65] showed that the overreaction effect is frequently larger for smaller enterprises than for larger firms, particularly when it comes to earnings announcements. Piccoli and Chaudhury [66] uncovered that overreactions are much stronger when investor sentiment is low rather than high because the contrast is stronger in low-sentiment environments, leading to stronger overreactions. Borgards and Czudaj [67] investigated the prevalence of overreactions in cryptocurrency markets and found evidence that price overreactions are common in the cryptocurrency market, strongly supporting the overreaction hypothesis. However, based on the study of Chordia and Subrahmanyam [68], liquidity stimulates arbitrage activity, which not only reduces stock price overreaction but also improves market efficiency. Moreover, individual investors may pursue high-priced stocks, whereas institutional investors may reduce their shareholdings because of stock price overreaction [3,69].
H2: 
Due to the presence of herding behaviors in cryptocurrency markets, investors utilizing BBTS might not achieve advantageous outcomes.

2.4. Overreaction and Contrarian Strategies

Regarding contrarian strategies, De Haan and Kakes [70] showed that three institutional investors in the Netherlands, namely pension funds, life insurers, and non-life insurers, are contrarian traders (i.e., they buy past losers and sell past winners). Wen, Zou, and Wang [71] demonstrated that institutional investors are more likely to practice contrarian trading behaviors in up markets. Jackson and Ladley [72] also revealed that investors employing technical trading strategies would generate profits by identifying and exploiting patterns in market prices, especially for contrarian traders. Moreover, Chen et al. [73] not only found evidence of herding behavior in the Chinese market but also showed that the degree of herding behavior is positively correlated with the profits of contrarian trading strategies. Nnadi and Tanna [74] unveiled that the contrarian profits in South Africa and China are caused by relatively high loser returns. Day et al. [27] found that based on energy and clean energy ETFs, which may have opposite share price performances, investors following contrarian strategies may reap profits by investing in the energy ETF while the green energy ETF reached a relatively high price. However, Forbes et al. [75] argued that although numerous studies unveil evidence for the profitability of contrarian trading strategies, the strategies are implemented only for years in which the mean return of stocks in the buy portfolio exceeds that of the sell portfolio, thereby making them doubt the reliability of contrarian strategies.
Contrarian strategies implied by stochastic oscillator indicators (SOI) and relative strength index (RSI) trading rules have received considerable attention in the literature and practice. Regarding BBTS, the profitability of employing the BBTS may come from the contrarian wisdom of the BBTS [49,76]; short-term contrarian profits obtained by adopting the BBTS would persist even after adjusting for market frictions [12]; and foreign investors using contrarian strategies suggested by the BBTS [77]. These findings also show that, based on contrarian strategies, investors may consider the BBTS when trading securities, including their spots and futures. However, Fang et al. [49] indicated that if investors take transaction costs into account, making profits by using contrarian strategies following the BBTS may be difficult. Ni et al. [78] also suggested that investors should employ momentum strategies instead of contrarian strategies while hitting upper BBs.
H3: 
As a result of the overreaction that is prevalent in cryptocurrency markets, investors who employ BBTS would achieve advantageous outcomes.
Furthermore, there are two exit ways for employing BBTS contrarian strategies. One is to exit as selling signals are emitted by following BBTS; the other is to exit after holding a fixed period. The wisdom is similar to momentum MA trading rules, including the trading rules of variable lag length MA (VMA) and fixed lag length MA (FMA), since the latter is to exit after holding a fixed period and the former is to exit as selling signals emitted by MA trading rules. As such, this study may investigate whether the performance for exiting the market after trading selling signals emitted would be better than that for exiting the market for holding a fixed period by setting the following hypothesis. However, since there is no uniramous fixed period, we then use 60 days as exit after referring to the average duration day and the maximum MA day employed in diverse BBTS.
H4: 
When utilizing the BBTS, the performance of exiting the market in response to the selling signals generated by the BBTS outperforms the approach of exiting the market after holding a fixed period, such as 60 days.
As such, we may encounter a research gap since the profitability of BBTS on cryptocurrency spots via heatmap visualization has received little attention in the existing literature. We hope to fill a research void and contribute to the current literature by determining whether market participants would acquire an adequate return from trading cryptocurrency spots via the BBTS regarding the aforementioned hypotheses.

3. Data and Methodology
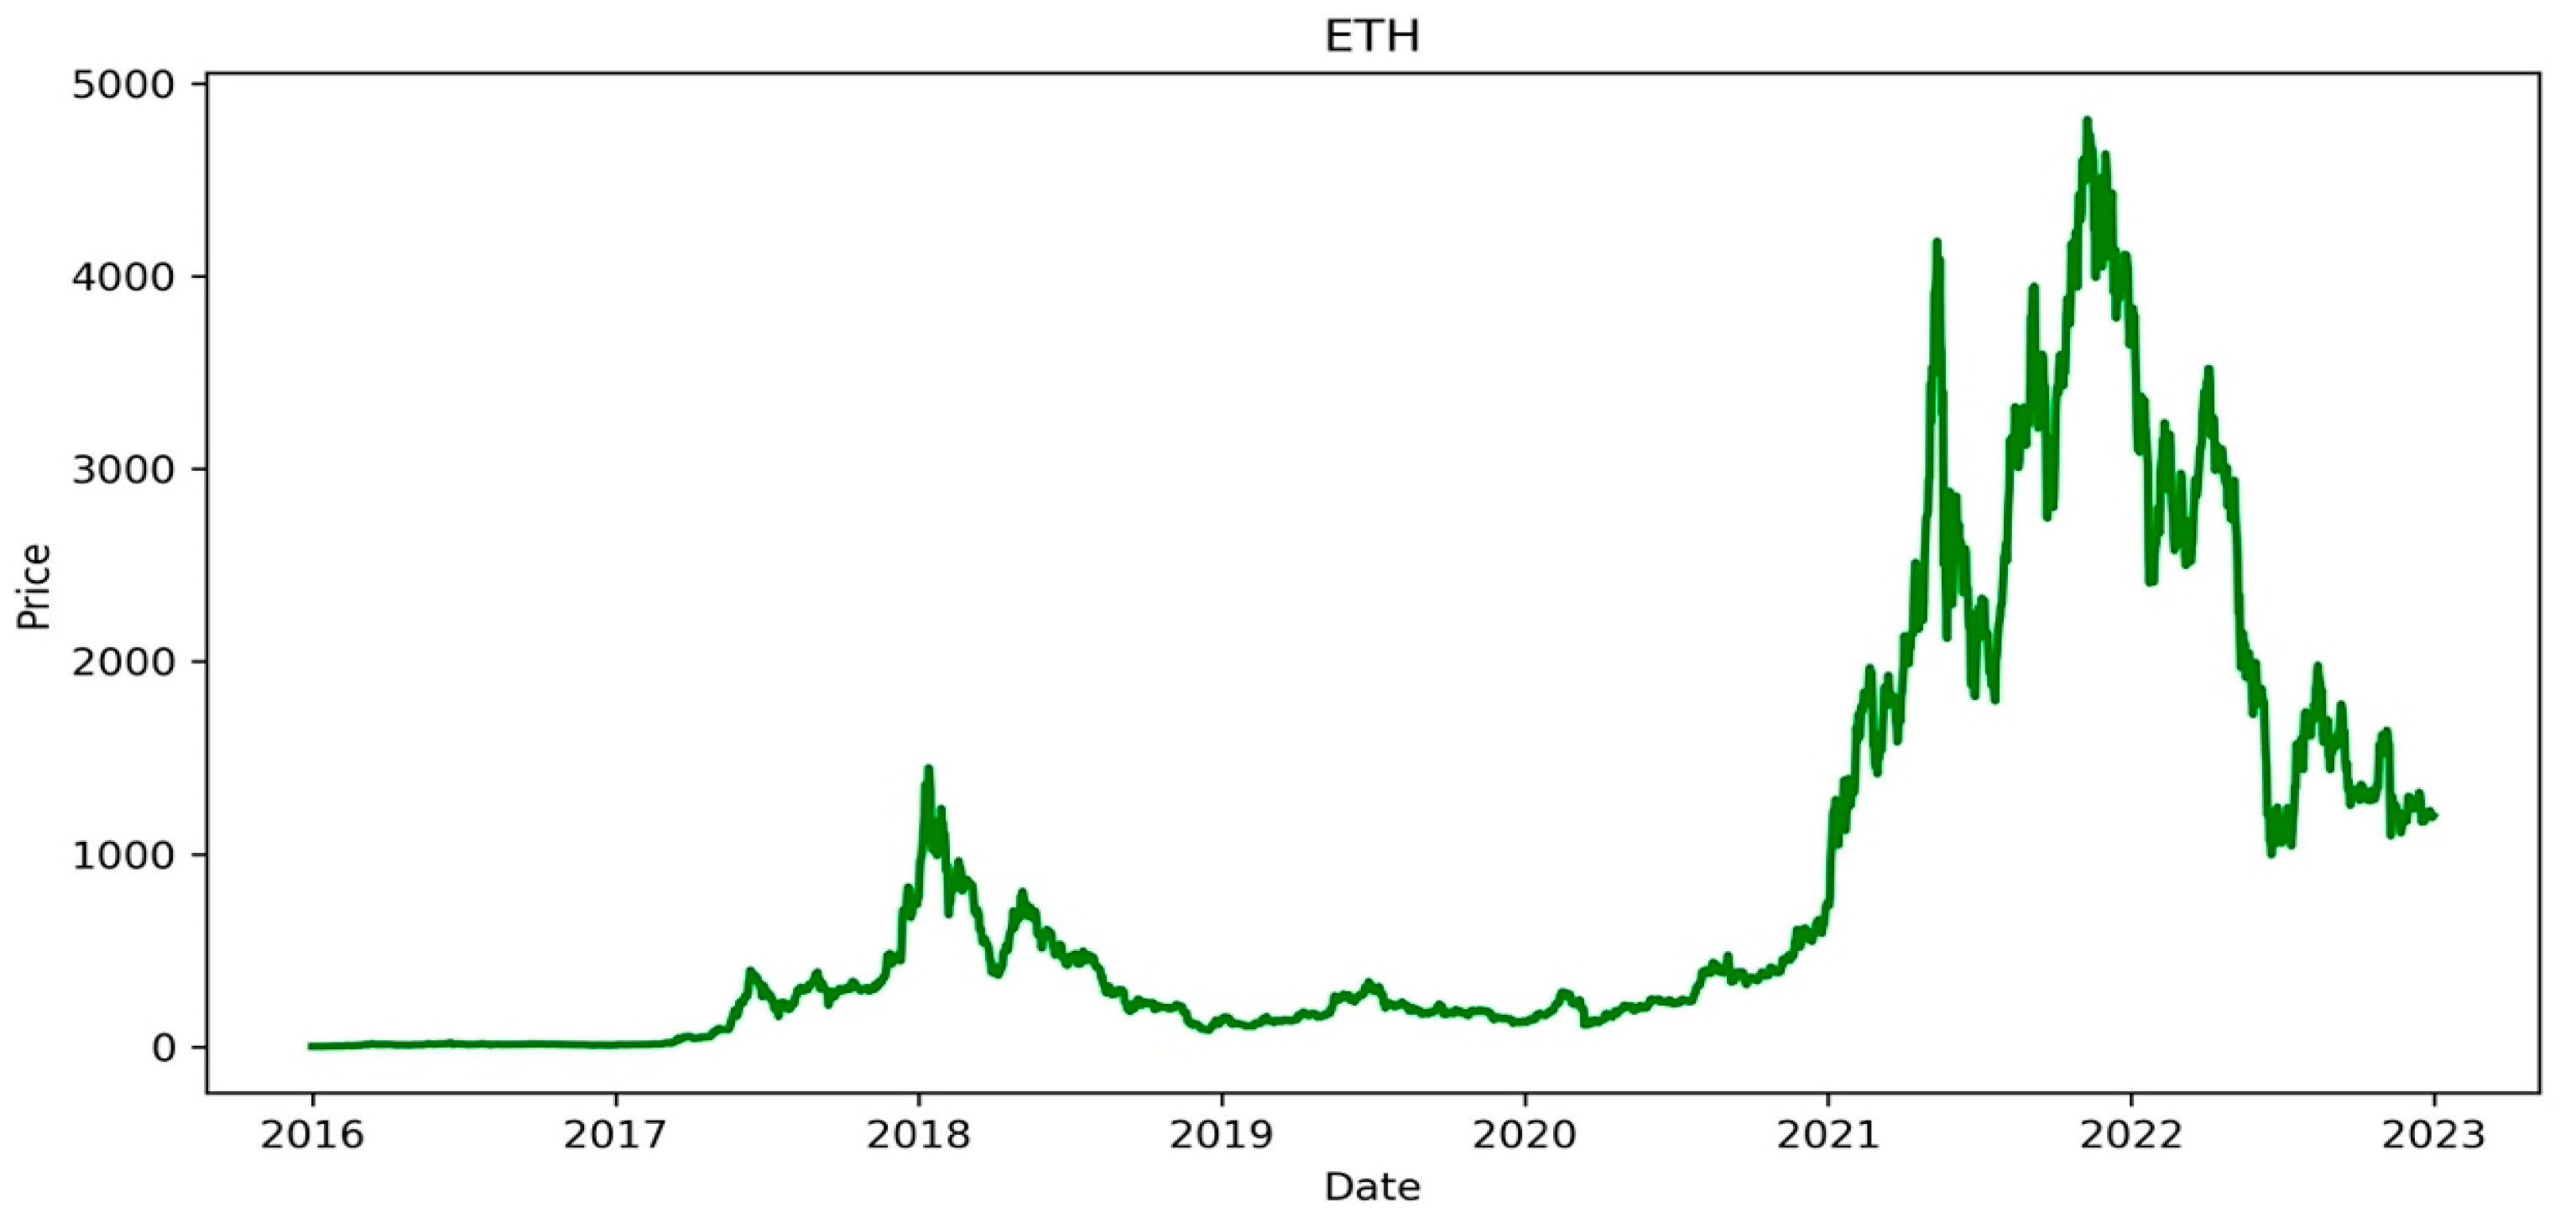
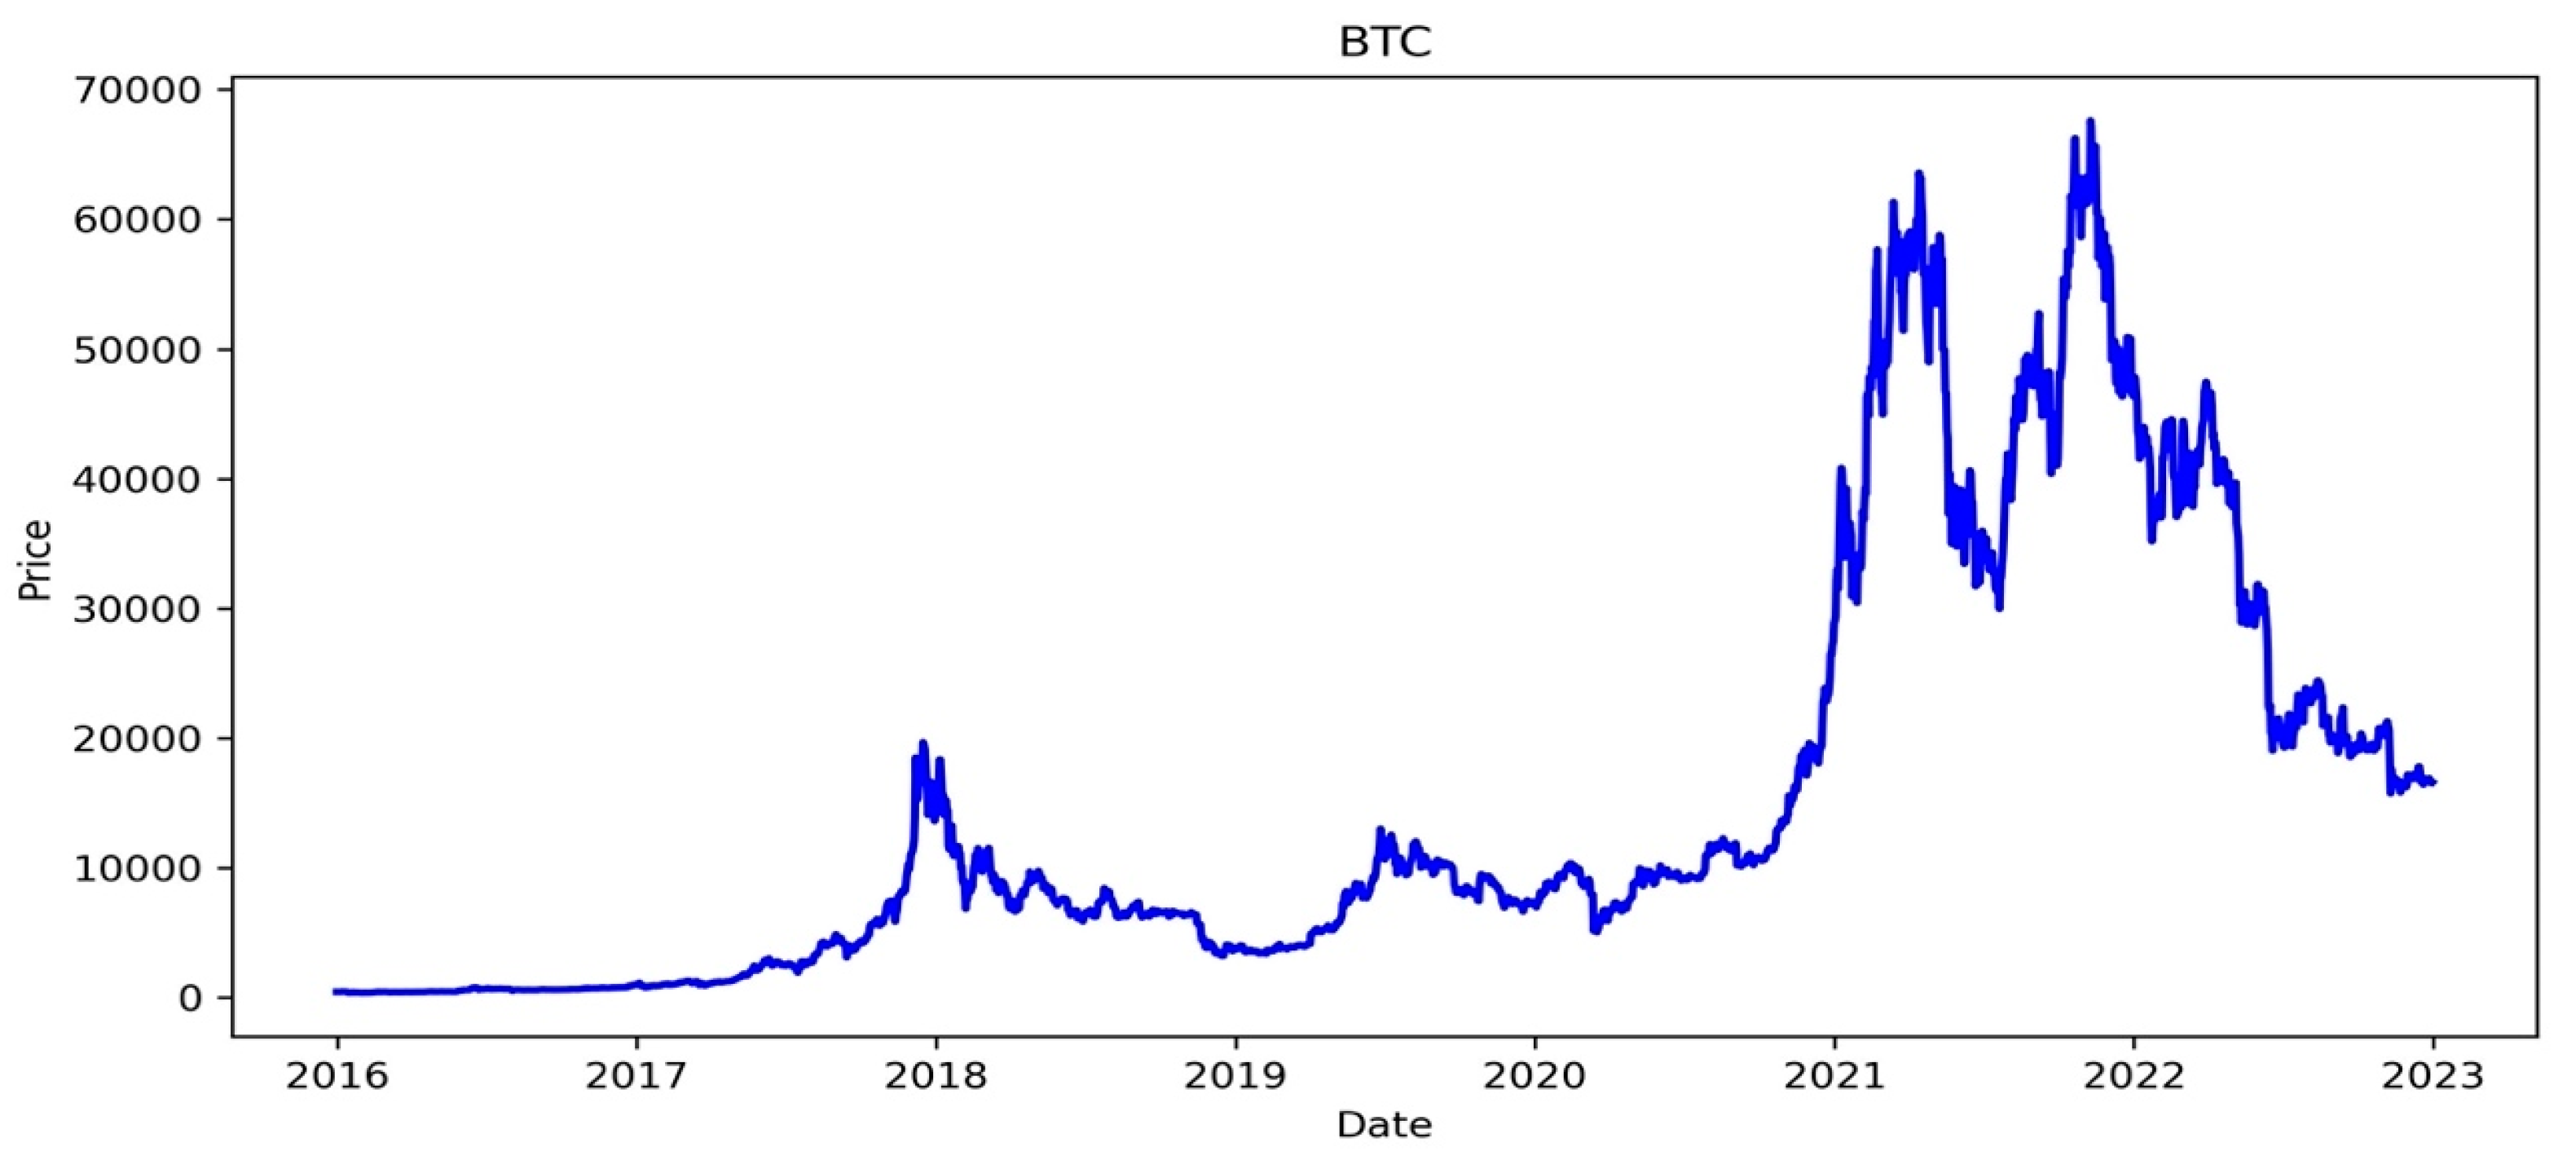
3.1. Data

We utilize the daily data on Bitcoin and ETH spots from Bitmex Public Historical Data (https://public.bitmex.com/?prefix=data/trade/ (accessed on 8 September 2023)) for this study from 2016 to 2022. To investigate whether investors could generate returns by trading these two spots based on the BBTS, we analyze the aforementioned phenomena and test the aforementioned hypotheses.

3.2. Cumulative Holding Returns and Average Holding Return

First, the trading signals emitted by diverse BBTS (i.e., investors are advised to buy and, subsequently, sell both spots as the BBTS emits oversold (overbought) signals) must be grasped. As such, according to the BBTS, investors buy these two spots at a closing price that penetrates lower Bollinger Bands and subsequently sell them at a closing price that penetrates upper Bollinger Bands. As such, HRi could be measured by Equation (1), shown below.
HRi = (Si/Bi) − 1
where Si = the closing cryptocurrency spot price for trade i on the selling day, and Bi = the closing cryptocurrency spot price for trade i on the buying day.
Furthermore, the cumulative holding returns (CHR) are calculated by summing up HRi from i = 1 (first trade) to N (last trade), as shown below.
CHR = i = 1 N H R i
where i = 1 to N (total number of trades).
Given that the data period 2016–2020 (time series data) is used, investors might not be able to start the second trader unless they finish the first trade. Thus, the HRi from i = 1 (first trade) to N (last trade) must be summed up. Thus, the CHR shown above is measured. Then, the average holding period return (AHR) shown below is measured as well. Thereafter, AHR is calculated as follows:
AHR = (CHR/N)
where CHR = cumulative holding returns, and N = total number of trades.
Whether investors trading these two cryptocurrency spots (Bitcoin and Ethereum spots) would profit is investigated by calculating the HRi using Equation (1), the CHR using Equation (2), and the AHR using Equation (3).
Furthermore, based on the default BBTS, Bollinger Bands are set to be two standard deviations (SD) above or below the 20-day MA. As for our conventional design, we have six BBTS (i.e., 2 × 3 = 6) by combining different standard deviations (i.e., one and two SDs) and moving average periods (i.e., 10-day, 20-day, and 60-day MAs). However, regarding our new design, various BBTSs are used, as shown in BBTS (n1, n2), where n1 (i.e., moving average lengths) ranges from 5 days to 60 days and its interval is 5 days and n2 (i.e., standard deviations) ranges from 0.25 SD to 2.5 SDs and its interval is 0.25 SD.
Given that numerous BBTS are employed for two cryptocurrency spots in this study, the closing price of buying day and that of selling day for different BBTSs concerning different parameters for MA lengths and SDs is obtained. However, the holding period return for the second trade after finishing the first trade is not obtained. Afterward, CHR is cumulated; then, the AHR is derived for each cell in the heatmap matrix. Given the numerous cells in the heatmap matrix, these above measurements might not be an easy task, which is somewhat similar to big data analytics.

4. Empirical Results and Analyses

4.1. Descriptive Statistics

Table 1 exhibits that the difference between the maximum and minimum values for these two cryptocurrency spot prices is quite large, particularly for the ETH spot price (i.e., the minimum is 0.94 and the maximum is 4815). The phenomena show that the movement of both spot prices is rather volatile, as evidenced by the high SDs for these two spot prices in Table 1.
In addition, the cryptocurrency spot data are displayed in Figure 1 and Figure 2, which depict the movement of the Bitcoin and Ethereum spot prices, respectively. Figure 1 and Figure 2 show that both cryptocurrency spot prices have substantial volatility, with rapid rises and falls over the last two years.

4.2. Results for Exits following BBTS Viewed by the Conventional Design

By employing daily data of these two cryptocurrency spot prices over the data period 2016–2022, the CHR, number of trades, and AHR for trading these two spots are measured based on diverse BBTSs. Then, CHR (%), number of trades, AHR (%), average duration day, and maximum duration day for trading Bitcoin spot (ETH spot) are presented in Panel A (Panel B) of Table 2 utilizing 6 BBTSs (i.e., six combinations with two different SDs and three different MA periods).
Table 2 shows that when trading the Bitcoin spot and ETH spot using the BBTS with default parameters, the AHRs (i.e., 19.98% and 50.52%) are impressive for investors. Furthermore, when the BBTS is adjusted to the 60-day MA rather than the 20-day MA, the AHRs are even more impressive for investors (i.e., 52.12% and 77.03%) for trading Bitcoin spot using BBTS (60, 2) and ETH spot using BBTS (60, 1). Even when the 10-day MA is used instead of the 20-day MA for the BBTS, the AHRs remain satisfied for investors (i.e., 13.51% using BBTS (10, 2) for the Bitcoin spot and 33.07% using BBTS (10, 2) for the ETH spot).
In Panel A of Table 2, the AHRs for various cases are compared, indicating that AHR may increase as the SD increases from one SD to two SD for the Bitcoin spot using these BBTSs. However, in Panel B of Table, this study finds that the above findings might not be disclosed in BBTS (60, 2) for trading ETH spots. We, therefore, might not conclude that increasing SD would enhance AHR for trading these spots. Additionally, in Equation (1), the holding return (HR) on trading these cryptocurrency spots (i.e., Bitcoin and ETH spots) is calculated as (Bi/Si) − 1.
While the research design described above (referred to as the conventional design in this study) produces acceptable outcomes, more favorable results can be obtained by integrating the insights of a heatmap matrix (referred to as the new design in this study), as illustrated below.

4.3. Results for Exits following BBTS Viewed by a Heatmap Matrix

Following our new design, investors enter the market in reaction to buying signals given by the BBTS and subsequently measure the performance of leaving the market in response to selling signals generated by the BBTS. Table 3 (Table 4) exhibits the AHR results of a 12 by 10 heatmap matrix generated by employing numerous BBTSs whose parameters for MA lengths range from 5 days to 60 days with a 5-day interval and for SDs ranging from 0.25 SD to 2.5 SDs with a 2.5 SD interval for trading Bitcoin spot (ETH spot). Moreover, several AHRs in red in Table 3 (Table 4) are larger than the 52.12% (77.03%) return of the conventional design for trading Bitcoin spot (ETH spot) in Panel A (Panel B) of Table 2.
As shown in Table 3 (Table 4), our new design not only provides market participants with additional information to generate a greater number of AHRs compared to the conventional design but also several AHRs displayed in a heatmap diagram are significantly higher than the highest return in Table 2. (i.e., the conventional design). We infer that our impressive findings are the consequence of big data analytics and the flexibility benefits of BBTS, all of which are taken into consideration by our new design because conventional results may provide limited information for market participants to generate profits.

4.4. Results for Exits after Holding a Fixed Period Viewed by a Heatmap Matrix

In contrast to exiting the market in response to a selling signal, we evaluate the performance of exiting the market after holding for a specified period, such as 60 days in this section, by applying the wisdom of VMA and FMA used for the MA trading rule. As such, a process is implemented to establish a fixed holding period, as opposed to a variable holding period that is determined by existing markets as selling signals are emitted (i.e., closing the position upon reaching upper BBs using the BBTS).
However, a consistent fixed term does not exist; rather, we employ a 60-day exit strategy based on the maximum MA day and average duration day utilized in different BBTS. Consequently, a holding period of 60 days is chosen as our fixed period. The aggregate outcomes of the two heatmap matrices for Bitcoin spot and ETH spot are then presented in Table 5 and Table 6. Following this, a comparison is made between the results presented in Table 3, Table 4, Table 5 and Table 6.
Following that, the highest AHR in red is seen in Table 5 (Table 6), with a return of 29.51% (31.73%), which is much lower than the 52.77% (417.53%) of the conventional design for trading Bitcoin spot (ETH spot) presented in Panel A (Panel B) of Table 2. Furthermore, the maximum AHR reported in Table 5 and Table 6 is only 31.73%. Thus, when comparing the results of Table 3 and Table 4 to those of Table 5 and Table 6, the later results fall short of the former.
Thus, using the BBTS (i.e., when the BBTS emits oversold (overbought) signals, investors are encouraged to first buy (and then sell) both spots) may be beneficial for trading such cryptocurrency spots, as satisfactory returns are shown in Table 3 and Table 4. However, when investors buy cryptocurrency spots as a result of a BBTS oversold signal and subsequently sell them at a fixed time (e.g., 60 days), they may not obtain the desired outcomes, as presented in Table 5 and Table 6. Furthermore, even when the set holding periods are extended to 90 and 120 days (because there are many tables in this study, we then explain the results rather than adding more tables to save space) as exits, the results are still inferior to those shown in Table 3 and Table 4. This implies that selling cryptocurrency spots as selling signals would yield larger returns than selecting a fixed time frame as an exit.

5. Discussion

In light of the earlier discussion, we have put forth various hypotheses as displayed in Section 2, and we will further ascertain the acceptance or rejection of these hypotheses based on the findings we have disclosed in Section 4. Concerning H1, we show that investors who implement BBTS may achieve advantageous outcomes, as our results are shown in Section 4, including the results shown in Table 2, Table 3, Table 4, Table 5 and Table 6, with particular emphasis on the red cells in Table 3 and Table 4. As a result, we may reject H1. Our findings suggest that implementing the BBTS could lead to favorable outcomes in trading cryptocurrencies [48], implying that technical analysis could be useful in trading cryptocurrencies [34,79]. Similarly, Day et al. [80] analyze Bitcoin futures with VMA rules, offering a heatmap for effective strategies, potentially enhancing profits, and unveiling novel investment insights, suggesting that when trading cryptocurrencies, technical analysis could be considered.
Regarding H2 and H3, we investigate whether implementing BBTS would or would not result in advantageous results due to the presence of herding behaviors (market overreaction). Our results in Table 4 show that, as a result of oversold trading signals given by BBTS, investors may achieve advantageous outcomes by rejecting H2 (accepting H3). Our findings indicate that investors using BBTS would be more effective if cryptocurrency markets experienced overreaction rather than herding behavior. Our revealed results indicate that investors using contrarian strategies (e.g., buying bitcoin and ETH spots as oversold signals emitted BBTS) might achieve advantageous outcomes instead of using momentum strategies (e.g., selling bitcoin and ETH spots as oversold signals emitted BBTS). That is, adopting contrarian strategies would be more effective than adopting momentum strategies in this study, which is consistent with adopting contrarian strategies being effective for trading in cryptocurrency markets [67,81,82] rather than adopting momentum strategies being effective for trading in cryptocurrency markets [83,84].
Moreover, we show that investors adopting BBTS would produce an advantageous outcome after examining our hypotheses H2 and H3. In addition to BBTS, Oyewola et al. [85] proposed a hybrid walk-forward ensemble optimization technique for predicting daily cryptocurrency prices, outperforming classical statistical and machine/deep learning models in accuracy, and Azamjon et al. [86] investigated Bitcoin volatility, predicting trends using on-chain data and whale-alert tweets. Q-learning produces accurate predictions, providing useful information for informed Bitcoin investment decisions and risk management. These studies offer novel approaches for forecasting cryptocurrency movement and potentially profiting from cryptocurrency trading.
Furthermore, there are two ways to exit the market following BBTS: the first is to exit once BBTS emits selling signals, and the second is to exit after holding for a specific period. However, since there is no uniramous fixed period, we then use 60 days as exit after referring to the average duration day and the maximum MA day employed in diverse BBTS. Following that, we test H4 by examining whether exiting the market once BBTS triggers selling signals would outperform exiting the market after holding a special period (e.g., 60 days). Comparably, the heatmap matrix results shown in Table 3 and Table 4 are better than those shown in Table 5 and Table 6, indicating that better performance is shown in following BBTS as exiting the market as the trading signal emitted by BBTS instead of exiting the market after holding a special period, thus accepting H4. Such findings are somewhat similar in that the results using variable moving average (VMA) trading regulation are better than those using fixed moving average (FMA) trading regulation in the relevant studies [87,88]. Instead of cryptocurrency markets, Chen et al. [89] apply VMA trading rules to US stock markets, showing that the NASDAQ 100 index outperforms the DJ30 index, providing useful information for those who purchase stocks that track the NASDAQ 100 and DJ30 (i.e., index ETF traders).

6. Conclusions

Given that the BBTS is frequently used to predict the movement of spot prices as well as the trend of spot price movements for these two cryptocurrencies (Bitcoin and ETH), we investigate whether investors can profit by trading these two cryptocurrency spots based on the BBTS (i.e., buying these two spots as these two spot prices penetrating the lower Bollinger Bands and after selling these two spots as penetrating the upper Bollinger Bands). The results show that investors can search for a significant average holding return (AHR) in the heatmap matrix using our new design. Moreover, using our new design would result in higher AHRs in the red area, all of which are higher than the highest return in blue derived from the conventional design in this study. Given that the majority of the AHRs in both heatmap matrices are positive, it implies that contrarian trading strategies are appropriate for trading these two cryptocurrency spots following the BBTS.
Thus, this study can contribute to the existing literature in several ways. First, we investigate whether investors would profit from trading either Bitcoin spot or ETH spot, two of the most popular cryptocurrency spots, using the BBTS, one of the most popular trading strategies in trading spot and futures (e.g., index, commodity, and cryptocurrency spots and futures), which are rarely addressed in the existing literature. Second, given that rebounding cryptocurrency spot prices may occur after spot price overreaction following the BBTS, we argue that owing to the relatively high volatilities of cryptocurrency spot prices, investors trading these two cryptocurrency spots may induce even higher spot prices rebounded from oversold signals to overbought signals emitted by BBTS, thus likely generating even higher profits compared to trading stocks using the BBTS, which may result from the higher volatiles of cryptocurrency spot prices. Third, using our new design would generate higher returns in some areas in red that are all higher than the highest return in blue derived from the conventional design in this study. We believe that our impressive findings are the result of big data analytics and the flexibility of BBTS, both of which are taken into account by our new design. Fourth, our new design will be considered by some investors because, if history repeats itself, our findings may inspire investors to trade cryptocurrency spots owing to the positive and impressive results obtained by implementing the new design proposed in this study.
Furthermore, we contend that the findings of this study may have the following valuable implications for market participants: first, by using the BBTS, investors can profit (as shown by positive AHPs in Table 2), even significantly (as shown by red cells in Table 3 and Table 4), from trading cryptocurrency spot, implying that the BBTS may be appropriate for investors trading cryptocurrency spot. Second, by using historical data, investors may obtain various profitable outcomes by employing the BBTS with different SDs and different-day MAs, implying that investors can analyze these potential outcomes with big data analytics in advance, which may be beneficial to market participants in exploiting higher profits following the BBTS. Third, this study can provide valuable information for increasing profitability when trading cryptocurrency spots because proper preparation is required for increasing profitability and even lowering risks when trading such contracts. Third, this study can provide valuable information for increasing profitability when trading cryptocurrency spot contracts because proper preparation is required for increasing profitability and even lowering risks when trading these cryptocurrencies.
This paper describes a study on the Bollinger Bands trading strategy (BBTS) as applied to Bitcoin and Ethereum spots. Regardless of the study’s potential contributions, some limitations can exist. To begin, relying on historical data and assuming that past performance predicts future results may increase uncertainty as market conditions might change. Second, the study acknowledges the volatility of the cryptocurrency spot, which could represent a risk to investors, particularly those unfamiliar with these assets’ intrinsic unpredictability. Finally, while the unique approach using a heatmap matrix yields promising results, the generalizability of such findings to a wide range of market conditions remains to be determined. As such, future research may further explore the following issues: first, we can investigate whether our findings differed across cryptocurrency spot markets and even future markets. Second, to use BBTS’s contrarian wisdom, we can compare profitability by using other technical indicators that employ contrarian wisdom, such as SOI and RSI. Third, the aforementioned issues should be investigated using intraday data because many investors trading a variety of cryptocurrency spots may not prefer holding for a long period owing to the relatively higher leverage risk of trading these spots. Fourth, we can still obtain additional results with big data concerns by using more diverse SDs and different-day MAs in this study, which may be more beneficial to investors trading these two cryptocurrency spots. Last but not least, in this study, we investigate the investment performance of investors who buy such spots at a closing price that penetrates lower Bollinger Bands and then sell them at a closing price that penetrates upper Bollinger Bands only. We would further evaluate the performance of investors who short-sell cryptocurrency spots at a closing price that penetrates higher Bollinger Bands and then buy them back at a closing price that penetrates lower Bollinger Bands.

Author Contributions

Author Contributions: Conceptualization, Y.N., P.C. and M.-Y.D.; Methodology, Y.N., P.C. and M.-Y.D.: Software, M.-Y.D. and Y.C.; Investigation, Y.N., P.C. and Y.C.; Validation, P.C. and Y.C.; Formal analysis Y.N. and M.-Y.D.; Writing—original draft, Y.N., P.C. and Y.C. All authors have read and agreed to the published version of the manuscript.

Funding

Min-Yuh Day has really appreciated the financial support from the Ministry of Science and Technology (MOST), Taiwan (110-2410-H-305-013-MY2) and National Taipei University (NTPU), Taiwan (112-NTPU-ORDA-F-003 and 112-NTPU-ORDA-F-004). Yensen Ni has really appreciated the financial support from the National Science and Technology Council, Taiwan (NSTC 112-2410-H-032-047).

Institutional Review Board Statement

Not applicable.

Informed Consent Statement

Not applicable.

Data Availability Statement

The datasets used and/or analyzed during the current study are available from the first author on reasonable request at [email protected]. The data are not publicly available due to privacy.

Conflicts of Interest

The authors declare no conflict of interest.

References

  1. Fama, E.F. Efficient capital markets: A review of theory and empirical work. J. Financ. 1970, 25, 383–417. [Google Scholar] [CrossRef]
  2. Fama, E.F. Efficient capital markets: II. J. Financ. 1991, 46, 1575–1617. [Google Scholar] [CrossRef]
  3. Chen, W.; Xu, H.; Jia, L.; Gao, Y. Machine learning model for Bitcoin exchange rate prediction using economic and technology determinants. Int. J. Forecast. 2021, 37, 28–43. [Google Scholar] [CrossRef]
  4. Kahneman, D.; Tversky, A. Prospect theory: An analysis of decision under risk. Econometrica 1979, 47, 363–391. [Google Scholar] [CrossRef]
  5. Agosin, M.R.; Huaita, F. Overreaction in capital flows to emerging markets: Booms and sudden stops. J. Int. Money Financ. 2012, 31, 1140–1155. [Google Scholar] [CrossRef]
  6. De Bondt, W.F.; Thaler, R. Does the stock market overreact? J. Financ. 1985, 40, 793–805. [Google Scholar] [CrossRef]
  7. Christoffersen, J.; Stæhr, S. Individual risk tolerance and herding behaviors in financial forecasts. Eur. Financ. Manag. 2019, 25, 1348–1377. [Google Scholar] [CrossRef]
  8. Ni, Y.; Liao, Y.C.; Huang, P. MA trading rules, herding behaviors, and stock market overreaction. Int. Rev. Econ. Financ. 2015, 39, 253–265. [Google Scholar] [CrossRef]
  9. Chuang, W.I.; Lee, B.S. An empirical evaluation of the overconfidence hypothesis. J. Bank. Financ. 2006, 30, 2489–2515. [Google Scholar] [CrossRef]
  10. Daniel, K.; Hirshleifer, D.; Subrahmanyam, A. Investor psychology and security market under- and overreactions. J. Financ. 1998, 53, 1839–1885. [Google Scholar] [CrossRef]
  11. Saedi, R.; Rezaein, V. The effect of the manager’s excessive self-confidence on stock returns and unsystematic stock risk given the dual role of managing director: Evidence from Tehran Stock Exchange. Financ. Res. J. 2019, 21, 79–100. [Google Scholar]
  12. Antoniou, A.; Galariotis, E.C.; Spyrou, S.I. Contrarian profits and the overreaction hypothesis: The case of the Athens stock exchange. Eur. Financ. Manag. 2005, 11, 71–98. [Google Scholar] [CrossRef]
  13. George, T.J.; Hwang, C.Y. Long-term return reversals: Overreaction or taxes? J. Financ. 2007, 62, 2865–2896. [Google Scholar] [CrossRef]
  14. Vidal-García, J.; Vidal, M.; Boubaker, S.; Hassan, M. The efficiency of mutual funds. Ann. Oper. Res. 2018, 267, 555–584. [Google Scholar] [CrossRef]
  15. Chen, J.C.; Zhou, Y.; Wang, X. Profitability of simple stationary technical trading rules with high-frequency data of Chinese Index Futures. Phys. A Stat. Mech. Appl. 2018, 492, 1664–1678. [Google Scholar] [CrossRef]
  16. Leung, J.M.J.; Chong, T.T.L. An empirical comparison of moving average envelopes and Bollinger Bands. Appl. Econ. Lett. 2003, 10, 339–341. [Google Scholar] [CrossRef]
  17. Day, M.Y.; Ni, Y.; Huang, P. Trading as sharp movements in oil prices and technical trading signals emitted with big data concerns. Phys. A Stat. Mech. Appl. 2019, 525, 349–372. [Google Scholar] [CrossRef]
  18. Hu, Y.; Sun, X.; Nie, X.; Li, Y.; Liu, L. An enhanced LSTM for trend following of time series. IEEE Access 2019, 7, 34020–34030. [Google Scholar] [CrossRef]
  19. Zakamulin, V.; Giner, J. Trend following with momentum versus moving averages: A tale of differences. Quant. Financ. 2020, 20, 985–1007. [Google Scholar] [CrossRef]
  20. Deng, S.; Yu, H.; Wei, C.; Yang, T.; Tatsuro, S. The profitability of Ichimoku Kinkohyo based trading rules in stock markets and FX markets. Int. J. Financ. Econ. 2021, 26, 5321–5336. [Google Scholar] [CrossRef]
  21. Lucke, B. Are technical trading rules profitable? Evidence for head-and-shoulder rules. Appl. Econ. 2003, 35, 33–40. [Google Scholar] [CrossRef]
  22. Spelta, A.; Pecora, N.; Flori, A.; Giudici, P. The impact of the SARS-CoV-2 pandemic on financial markets: A seismologic approach. Ann. Oper. Res. 2023, 330, 639–664. [Google Scholar] [CrossRef] [PubMed]
  23. Chen, K.H.; Su, X.Q.; Lin, L.F.; Shih, Y.C. Profitability of moving-average technical analysis over the firm life cycle: Evidence from Taiwan. Pac.-Basin Financ. J. 2021, 69, 101633. [Google Scholar] [CrossRef]
  24. Chu, J.; Chan, S.; Zhang, Y. High frequency momentum trading with cryptocurrencies. Res. Int. Bus. Financ. 2020, 52, 101176. [Google Scholar] [CrossRef]
  25. Cooper, I.; Mitrache, A.; Priestley, R. A global macroeconomic risk model for value, momentum, and other asset classes. J. Financ. Quant. Anal. 2022, 57, 1–30. [Google Scholar] [CrossRef]
  26. Chen, C.H.; Lai, W.H.; Hung, S.T.; Hong, T.P. An advanced optimization approach for long-short pairs trading strategy based on correlation coefficients and bollinger bands. Appl. Sci. 2022, 12, 1052. [Google Scholar] [CrossRef]
  27. Day, M.Y.; Ni, Y.; Hsu, C.; Huang, P. Do Investment Strategies Matter for Trading Global Clean Energy and Global Energy ETFs? Energies 2022, 15, 3328. [Google Scholar] [CrossRef]
  28. Kim, K.; Ryu, D. Does sentiment determine investor trading behaviour? Appl. Econ. Lett. 2021, 28, 811–816. [Google Scholar] [CrossRef]
  29. Pagliaro, A. Forecasting Significant Stock Market Price Changes Using Machine Learning: Extra Trees Classifier Leads. Electronics 2023, 12, 4551. [Google Scholar] [CrossRef]
  30. Yu, S.; Yang, S.B.; Yoon, S.H. The Design of an Intelligent Lightweight Stock Trading System Using Deep Learning Models: Employing Technical Analysis Methods. Systems 2023, 11, 470. [Google Scholar] [CrossRef]
  31. Jin, X. Evaluating the predictive power of intraday technical trading in China’s crude oil market. J. Forecast. 2022, 41, 1416–1432. [Google Scholar] [CrossRef]
  32. Mishra, A.K.; Umrao, B.K.; Yadav, D.K. A survey on optimal utilization of preemptible VM instances in cloud computing. J. Supercomput. 2018, 74, 5980–6032. [Google Scholar] [CrossRef]
  33. Catania, L.; Grassi, S. Forecasting cryptocurrency volatility. Int. J. Forecast. 2022, 38, 878–894. [Google Scholar] [CrossRef]
  34. Kim, Y.; Byun, Y.C. Ultra-Short-Term Continuous Time Series Prediction of Blockchain-Based Cryptocurrency Using LSTM in the Big Data Era. Appl. Sci. 2022, 12, 11080. [Google Scholar] [CrossRef]
  35. Kou, G.; Olgu Akdeniz, Ö.; Dinçer, H.; Yüksel, S. Fintech investments in European banks: A hybrid IT2 fuzzy multidimensional decision-making approach. Financ. Innov. 2021, 7, 39. [Google Scholar] [CrossRef]
  36. Lee, N.Y. Hierarchical Multi-Blockchain System for Parallel Computation in Cryptocurrency Transfers and Smart Contracts. Appl. Sci. 2021, 11, 10173. [Google Scholar] [CrossRef]
  37. Elsayed, A.H.; Gozgor, G.; Lau, C.K.M. Causality and dynamic spillovers among cryptocurrencies and currency markets. Int. J. Financ. Econ. 2022, 27, 2026–2040. [Google Scholar] [CrossRef]
  38. Ilk, N.; Shang, G.Z.; Fan, S.K.; Zhao, J.L. Stability of Transaction Fees in Bitcoin: A Supply and Demand Perspective. MIS Q. 2021, 45, 563–592. [Google Scholar] [CrossRef]
  39. Khan, D.; Jung, L.T.; Hashmani, M.A. Systematic literature review of challenges in blockchain scalability. Appl. Sci. 2021, 11, 9372. [Google Scholar] [CrossRef]
  40. Mattke, J.; Maier, C.; Reis, L.; Weitzel, T. Bitcoin investment: A mixed methods study of investment motivations. Eur. J. Inf. Syst. 2021, 30, 261–285. [Google Scholar] [CrossRef]
  41. Chiu, C.L.; Ni, Y.; Hu, H.C.; Day, M.Y.; Chen, Y. Enhancing Crypto Success via Heatmap Visualization of Big Data Analytics for Numerous Variable Moving Average Strategies. Appl. Sci. 2023, 13, 12805. [Google Scholar] [CrossRef]
  42. Al Guindy, M. Cryptocurrency price volatility and investor attention. Int. Rev. Econ. Financ. 2021, 76, 556–570. [Google Scholar] [CrossRef]
  43. Woebbeking, F. Cryptocurrency volatility markets. Digit. Financ. 2021, 3, 273–298. [Google Scholar] [CrossRef]
  44. Bakry, W.; Rashid, A.; Al-Mohamad, S.; El-Kanj, N. Bitcoin and portfolio diversification: A portfolio optimization approach. J. Risk Financ. Manag. 2021, 14, 282. [Google Scholar] [CrossRef]
  45. Celeste, V.; Corbet, S.; Gurdgiev, C. Fractal dynamics and wavelet analysis: Deep volatility and return properties of Bitcoin, Ethereum and Ripple. Q. Rev. Econ. Financ. 2020, 76, 310–324. [Google Scholar] [CrossRef]
  46. Okorie, D.I.; Lin, B. Cryptocurrency spectrum and 2020 pandemic: Contagion analysis. Int. Rev. Econ. Financ. 2023, 84, 29–38. [Google Scholar] [CrossRef]
  47. Yarovaya, L.; Matkovskyy, R.; Jalan, A. The effects of a “black swan” event (COVID-19) on herding behavior in cryptocurrency markets. J. Int. Financ. Mark. Inst. Money 2021, 75, 101321. [Google Scholar] [CrossRef]
  48. Day, M.Y.; Cheng, Y.; Huang, P.; Ni, Y. The profitability of Bollinger Bands trading bitcoin futures. Appl. Econ. Lett. 2023, 30, 1437–1443. [Google Scholar] [CrossRef]
  49. Fang, J.; Jacobsen, B.; Qin, Y. Popularity versus profitability: Evidence from Bollinger bands. J. Portf. Manag. 2017, 43, 152–159. [Google Scholar] [CrossRef]
  50. Schwert, G.W. Anomalies and market efficiency. Handb. Econ. Financ. 2003, 1, 939–974. [Google Scholar]
  51. Wang, H.; Hu, D. Heterogeneous beliefs with herding behaviors and asset pricing in two goods world. N. Am. J. Econ. Financ. 2021, 57, 101434. [Google Scholar] [CrossRef]
  52. Griffin, J.M.; Harris, J.H.; Topaloglu, S. The dynamics of institutional and individual trading. J. Financ. 2003, 58, 2285–2320. [Google Scholar] [CrossRef]
  53. Bekiros, S.; Jlassi, M.; Lucey, B.; Naoui, K.; Uddin, G.S. Herding behavior, market sentiment and volatility: Will the bubble resume? N. Am. J. Econ. Financ. 2017, 42, 107–131. [Google Scholar] [CrossRef]
  54. Cheng, W.H.; Ni, Y.; Ho, T.H.; Chiang, C.J.; Huang, P.; Cheng, Y. Are the shareholding and trading behaviors of diverse investors affected by the relaxation of day trading? PLoS ONE 2021, 16, e0250121. [Google Scholar] [CrossRef]
  55. Nofsinger, J.R.; Sias, R.W. Herding and feedback trading by institutional and individual investors. J. Financ. 1999, 54, 2263–2295. [Google Scholar] [CrossRef]
  56. Ossareh, A.; Pourjafar, M.S.; Kopczewski, T. Cognitive Biases on the Iran Stock Exchange: Unsupervised Learning Approach to Examining Feature Bundles in Investors’ Portfolios. Appl. Sci. 2021, 11, 10916. [Google Scholar] [CrossRef]
  57. Stavroyiannis, S.; Babalos, V. Herding behavior in cryptocurrencies revisited: Novel evidence from a TVP model. J. Behav. Exp. Financ. 2019, 22, 57–63. [Google Scholar] [CrossRef]
  58. Narayan, P.K.; Phan, D.H.B. Momentum strategies for Islamic stocks. Pac.-Basin Financ. J. 2017, 42, 96–112. [Google Scholar] [CrossRef]
  59. King, T.; Koutmos, D. Herding and feedback trading in cryptocurrency markets. Ann. Oper. Res. 2021, 300, 79–96. [Google Scholar] [CrossRef] [PubMed]
  60. Bouri, E.; Gupta, R.; Roubaud, D. Herding behaviour in cryptocurrencies. Financ. Res. Lett. 2019, 29, 216–221. [Google Scholar] [CrossRef]
  61. Mandaci, P.E.; Cagli, E.C. Herding intensity and volatility in cryptocurrency markets during the COVID-19. Financ. Res. Lett. 2022, 46, 102382. [Google Scholar] [CrossRef]
  62. Mnif, E.; Jarboui, A. COVID-19, bitcoin market efficiency, herd behaviour. Rev. Behav. Financ. 2021, 13, 69–84. [Google Scholar] [CrossRef]
  63. Aslam, F.; Memon, B.A.; Hunjra, A.I.; Bouri, E. The dynamics of market efficiency of major cryptocurrencies. Glob. Financ. J. 2023, 58, 100899. [Google Scholar] [CrossRef]
  64. Cheah, E.T.; Fry, J. Speculative bubbles in Bitcoin markets? An empirical investigation into the fundamental value of Bitcoin. Econ. Lett. 2015, 130, 32–36. [Google Scholar] [CrossRef]
  65. Chopra, N.; Lakonishok, J.; Ritter, J.R. Measuring abnormal performance: Do stocks overreact? J. Financ. Econ. 1992, 31, 235–268. [Google Scholar] [CrossRef]
  66. Piccoli, P.; Chaudhury, M. Overreaction to extreme market events and investor sentiment. Appl. Econ. Lett. 2018, 25, 115–118. [Google Scholar] [CrossRef]
  67. Borgards, O.; Czudaj, R.L. The prevalence of price overreactions in the cryptocurrency market. J. Int. Financ. Mark. Inst. Money 2020, 65, 101194. [Google Scholar] [CrossRef]
  68. Chordia, T.; Roll, R.; Subrahmanyam, A. Liquidity and market efficiency. J. Financ. Econ. 2008, 87, 249–268. [Google Scholar]
  69. Ni, Y.; Cheng, Y.; Liao, Y.; Huang, P. Does board structure affect stock price overshooting informativeness measured by stochastic oscillator indicators? Int. J. Financ. Econ. 2022, 27, 2290–2302. [Google Scholar] [CrossRef]
  70. De Haan, L.; Kakes, J. Momentum or contrarian investment strategies: Evidence from Dutch institutional investors. J. Bank. Financ. 2011, 35, 2245–2251. [Google Scholar] [CrossRef]
  71. Wen, F.; Zou, Q.; Wang, X. The contrarian strategy of institutional investors in Chinese stock market. Financ. Res. Lett. 2021, 41, 101845. [Google Scholar] [CrossRef]
  72. Jackson, A.; Ladley, D. Market ecologies: The effect of information on the interaction and profitability of technical trading strategies. Int. Rev. Financ. Anal. 2016, 47, 270–280. [Google Scholar] [CrossRef]
  73. Chen, Q.; Hua, X.; Jiang, Y. Contrarian strategy and herding behaviour in the Chinese stock market. Eur. J. Financ. 2018, 24, 1552–1568. [Google Scholar] [CrossRef]
  74. Nnadi, M.; Tanna, S. Accounting analyses of momentum and contrarian strategies in emerging markets. Asia-Pac. J. Account. Econ. 2019, 26, 457–477. [Google Scholar] [CrossRef]
  75. Forbes, W.; Kiselev, E.; Skerratt, L. The stability and downside risk to contrarian profits: Evidence from the S&P 500. Int. J. Financ. Econ. 2021, 28, 733–750. [Google Scholar]
  76. Lento, C.; Gradojevic, N.; Wright, C.S. Investment information content in Bollinger Bands? Appl. Financ. Econ. Lett. 2007, 3, 263–267. [Google Scholar] [CrossRef]
  77. Chen, Y.F.; Yang, S.Y.; Lin, F.L. Foreign institutional industrial herding in Taiwan stock market. Manag. Financ. 2012, 38, 325–340. [Google Scholar]
  78. Ni, Y.; Day, M.Y.; Huang, P.; Yu, S.R. The profitability of Bollinger Bands: Evidence from the constituent stocks of Taiwan 50. Phys. A Stat. Mech. Appl. 2020, 551, 124144. [Google Scholar] [CrossRef]
  79. Gradojevic, N.; Kukolj, D.; Adcock, R.; Djakovic, V. Forecasting Bitcoin with technical analysis: A not-so-random forest? Int. J. Forecast. 2023, 39, 1–17. [Google Scholar] [CrossRef]
  80. Day, M.Y.; Ni, Y.; Hsu, C.; Huang, P. Visualizing profitability: A heatmap approach to evaluate Bitcoin futures trading using VMA trading rules. Heliyon 2023, 9, e21376. [Google Scholar] [CrossRef]
  81. Caporale, G.M.; Plastun, A. Price overreactions in the cryptocurrency market. J. Econ. Stud. 2019, 46, 1137–1155. [Google Scholar] [CrossRef]
  82. Schaub, M. Outlier Events in Major Cryptocurrency Markets: Is There Evidence of Overreaction? J. Wealth Manag. 2022, 24, 142–148. [Google Scholar] [CrossRef]
  83. Sadaqat, M.; Butt, H.A. Stop-loss rules and momentum payoffs in cryptocurrencies. J. Behav. Exp. Financ. 2023, 39, 100833. [Google Scholar] [CrossRef]
  84. Shen, D.; Urquhart, A.; Wang, P. Bitcoin intraday time series momentum. Financ. Rev. 2022, 57, 319–344. [Google Scholar] [CrossRef]
  85. Oyewola, D.O.; Dada, E.G.; Ndunagu, J.N. A novel hybrid walk-forward ensemble optimization for time series cryptocurrency prediction. Heliyon 2022, 8, e11862. [Google Scholar] [CrossRef] [PubMed]
  86. Azamjon, M.; Sattarov, O.; Cho, J. Forecasting Bitcoin Volatility through On-Chain and Whale-Alert Tweet Analysis using the Q-Learning Algorithm. IEEE Access 2023, 11, 108092–108103. [Google Scholar] [CrossRef]
  87. Ahmed, S.; Grobys, K.; Sapkota, N. Profitability of technical trading rules among cryptocurrencies with privacy function. Financ. Res. Lett. 2020, 35, 101495. [Google Scholar] [CrossRef]
  88. Ni, Y.S.; Lee, J.T.; Liao, Y.C. Do variable length moving average trading rules matter during a financial crisis period? Appl. Econ. Lett. 2013, 20, 135–141. [Google Scholar] [CrossRef]
  89. Chen, Y.; Huang, P.; Day, M.Y.; Ni, Y.; Liang, M.C. Using Heatmap Visualization to assess the performance of the DJ30 and NASDAQ100 Indices under diverse VMA trading rules. PLoS ONE 2023, 18, e0284918. [Google Scholar] [CrossRef]
Figure 1. The trend of the Bitcoin price from 2016 to 2022.
Applsci 14 00154 g001
Figure 2. The trend of the ETH price from 2016 to 2022.
Applsci 14 00154 g002
Table 1. Descriptive statistics. This table reports the mean, standard deviation (SD), coefficient of variance (CV), medians, minimum, and maximum for two cryptocurrency spot prices (Bitcoin and Ethereum spot prices) from 2016 to 2022.
CryptocurrenciesSampleMeanSDCVMedianMinimumMaximum
Bitcoin spot price255715,183.9316,630.05109.52%8631.25364.3567,617.02
ETH spot price2557853.041122.11131.54%292.210.944815.00
Table 2. CHR and AHR of trading Bitcoin and ETH spots from 2016 to 2022. The CHRs, number of trades, AHRs, average duration days, and maximum duration days are calculated for six different BBTS combinations involving two different SDs and three different MA periods.
(1)(2)(3)(4)(5)
BBTSCHR (%)No. of TradesAHR (%)Average
Duration Day
Maximum
Duration Day
Panel A Bitcoin spot
(20, 2)959.17%4819.98%52231
(20, 1)129.50%149.25%32108
(60, 2)1322.86%2455.12%96426
(60, 1)771.10%3025.70%52205
(10, 2)824.26%6113.51%42170
(10, 1)489.91%2072.37%1380
Panel B ETH spot
(20, 2)3031.25%6050.52%41217
(20, 1)0.49%140.03%2054
(60, 2)3.61%60.60%2688
(60, 1)1463.59%1977.03%56263
(10, 2)1523.52%6025.39%39174
(10, 1)1154.74%1975.86%1376
Note: CHR: Cumulative Holding Return; AHR: Average Holding Return; BBTS (20, 2): The BBTS uses 20-day MA and 2 SDs. The AHRs in blue indicate the highest AHP for Bitcoin and ETH, respectively.
Table 3. Heatmap Matrix results of trading Bitcoin spots based on the BBTS. This table shows the AHR results using BBTS (n1, n2), where n1 (moving average lengths) ranges from 5 to 60 days with a 5-day interval and n2 (standard deviations) ranges from 0.25 SD to 2.5 SDs with a 0.25 SD interval. Additionally, each cell in the heatmap matrix presents AHR derived using one of the BBTS (n1, n2). The red cells display AHRs greater than 55.12%, the highest AHR in the conventional design.
6012.67%11.25%18.06%25.70%21.69%25.59%49.80%55.12%125.94%156.78%
5512.83%−0.27%11.30%16.84%17.92%25.11%38.31%52.36%74.62%92.49%
5013.05%10.74%0.07%−14.07%15.00%29.98%33.25%50.30%80.48%101.03%
4513.18%1.72%−9.51%−0.19%2.65%19.00%33.69%38.50%58.82%63.12%
409.73%13.32%16.45%12.77%−6.96%2.46%23.47%32.86%11.41%53.56%
358.26%13.86%13.82%26.33%12.49%13.69%16.21%1.21%29.87%47.17%
307.60%8.74%9.17%15.11%11.21%14.23%16.92%20.09%25.04%36.02%
256.45%0.78%6.17%7.73%14.28%18.39%16.92%17.13%26.23%33.80%
204.76%4.40%4.50%9.25%11.52%13.43%11.57%19.98%23.82%31.06%
153.98%2.86%3.97%4.90%9.18%10.58%12.39%14.73%21.19%35.89%
102.04%2.62%3.19%2.37%3.01%3.23%7.86%13.51%24.85%91.12%
51.08%1.71%2.27%3.52%1.14%2.75%29.34%0.00%0.00%0.00%
n1/n20.250.50.7511.251.51.7522.252.5
Note: The first column refers to n1 from the 5-day MA at the bottom to the 60-day MA at the top, and the last row refers to n2 from 0.25 SD at the leftmost to 2.5 SDs at the rightmost. AHPs in red are all higher than the highest AHP shown in Panel A of Table 2.
Table 4. Heatmap Matrix results of trading an ETH spot based on the BBTS. This table shows the AHR results using BBTS (n1, n2), where n1 (moving average lengths) ranges from 5 to 60 days with a 5-day interval and n2 (standard deviations) ranges from 0.25 SD to 2.5 SDs with a 0.25 SD interval. Additionally, each cell in the heatmap matrix presents AHR derived using one of the BBTS (n1, n2). The red cells display AHRs greater than 77.03%, the highest AHR in the conventional design.
6048.52%57.67%44.53%77.03%3.80%7.20%197.31%0.60%400.02%656.28%
5539.23%196.84%57.97%65.10%50.92%83.93%264.16%248.52%460.36%615.39%
5033.49%41.41%51.51%42.97%62.28%140.13%70.95%272.99%490.51%614.45%
4578.73%52.97%48.44%59.64%164.94%45.16%81.89%97.08%681.80%482.87%
40−6.26%49.89%89.70%89.07%46.07%40.59%88.32%97.66%228.88%313.26%
35−13.20%−12.48%−4.38%42.84%48.60%35.60%4.19%132.51%132.89%165.49%
3029.88%37.35%167.14%38.50%0.18%110.56%50.20%89.98%115.26%127.43%
2518.12%−7.13%1.99%35.66%36.54%48.69%42.99%265.66%8.39%121.88%
209.91%29.40%−0.14%0.03%2.09%2.42%37.37%50.52%3.64%161.84%
151.37%8.01%8.31%12.06%26.24%19.50%1.66%59.26%80.64%605.42%
104.37%5.05%5.47%5.86%8.20%23.02%14.33%25.39%74.65%367.47%
544.99%46.11%46.11%3.83%3.68%7.90%82.83%0.00%0.00%0.00%
n1/n20.250.50.7511.251.51.7522.252.5
Note: The first column refers to n1 from the 5-day MA at the bottom to the 60-day MA at the top, and the last row refers to n2 from 0.25 SD at the leftmost to 2.5 SDs at the rightmost. AHPs in red are all higher than the highest AHP shown in Panel B of Table 2.
Table 5. Heatmap Matrix results of trading Bitcoin spots with exits after holding a fixed period. This table shows the AHR results using BBTS (n1, n2), where n1 (moving average lengths) ranges from 5 to 60 days with a 5-day interval and n2 (standard deviations) ranges from 0.25 SD to 2.5 SDs with a 0.25 SD interval. Additionally, each cell in the heatmap matrix displays AHR obtained from one of the BBTS (n1, n2) with exits of 60 days for trading Bitcoin spots.
6021.87%0.21%18.51%38.11%9.90%6.02%7.36%7.36%7.36%7.36%
5522.37%0.21%0.21%26.30%18.51%3.88%7.36%7.36%7.36%7.36%
5022.03%29.58%0.21%28.09%0.21%7.38%18.51%7.36%7.36%7.36%
4523.87%25.31%25.60%0.21%0.21%7.38%18.51%7.36%7.36%7.36%
4023.30%22.74%26.15%0.21%1.81%0.21%0.21%18.51%18.51%18.51%
357.71%28.56%25.13%11.91%14.78%0.21%0.21%0.21%0.21%0.21%
307.18%7.78%22.79%24.68%20.86%13.43%13.43%0.21%0.21%0.21%
254.82%6.86%5.47%20.50%24.05%33.60%13.43%13.43%0.21%0.21%
204.60%3.34%5.42%5.84%21.02%28.69%29.51%24.74%0.21%0.21%
153.33%3.77%3.02%4.60%6.26%10.63%10.23%24.83%14.92%20.86%
103.03%2.96%3.08%3.17%4.57%4.97%6.05%7.71%14.28%12.25%
51.77%1.99%2.00%2.10%2.75%4.80%15.26%0.00%0.00%0.00%
n1/n20.250.50.7511.251.51.7522.252.5
Note: The first column refers to n1 from the 5-day MA at the bottom to the 60-day MA at the top, and the last row refers to n2 from 0.25 SD at the leftmost to 2.5 SDs at the rightmost. The AHP in blue is the highest AHP in this table.
Table 6. Heatmap Matrix results of trading ETH spot with exits after holding a fixed period. This table shows the AHR results using BBTS (n1, n2), where n1 (moving average lengths) ranges from 5 to 60 days with a 5-day interval and n2 (standard deviations) ranges from 0.25 SD to 2.5 SDs with a 0.25 SD interval. Additionally, each cell in the heatmap matrix displays AHR obtained from one of the BBTS (n1, n2) with exits of 60 days for trading ETH spots.
600.47%1.32%8.67%10.18%10.67%17.58%4.92%6.46%2.60%8.15%
55−0.03%10.52%4.69%7.85%9.66%15.78%4.35%0.34%2.60%8.15%
50−0.04%3.41%0.83%8.82%11.54%8.51%3.92%0.65%2.27%8.15%
4511.58%3.85%4.51%7.04%10.35%7.68%14.22%6.46%7.90%15.05%
402.93%3.11%6.05%7.14%14.30%7.73%9.79%19.49%20.79%31.73%
352.54%0.91%7.20%2.33%6.04%9.21%11.67%16.70%20.61%26.84%
302.67%4.21%5.64%3.84%4.55%9.91%11.55%16.00%20.61%29.41%
254.05%4.56%2.41%3.31%6.29%10.24%8.32%12.19%15.82%23.22%
202.14%2.02%3.22%4.51%5.08%5.33%6.68%10.68%12.58%24.29%
156.33%7.02%3.44%5.39%5.27%4.22%8.13%12.28%3.71%2.61%
105.48%5.62%5.77%6.45%2.20%2.56%3.20%7.88%4.86%−9.79%
53.85%3.87%3.68%3.93%5.34%8.15%−27.09%0.00%0.00%0.00%
n1/n20.250.50.7511.251.51.7522.252.5
Note: The first column refers to n1 from the 5-day MA at the bottom to the 60-day MA at the top, and the last row refers to n2 from 0.25 SD at the leftmost to 2.5 SDs at the rightmost. The AHP in blue is the highest AHP in this table.
Disclaimer/Publisher’s Note: The statements, opinions and data contained in all publications are solely those of the individual author(s) and contributor(s) and not of MDPI and/or the editor(s). MDPI and/or the editor(s) disclaim responsibility for any injury to people or property resulting from any ideas, methods, instructions or products referred to in the content.

