
Experimental Studies of the Impact of the Geometric Dimensions of the Outlet Opening on the Effectiveness of Positive Pressure Ventilation in a Multi-Storey Building—Flow Characteristics


Abstract
1. Introduction
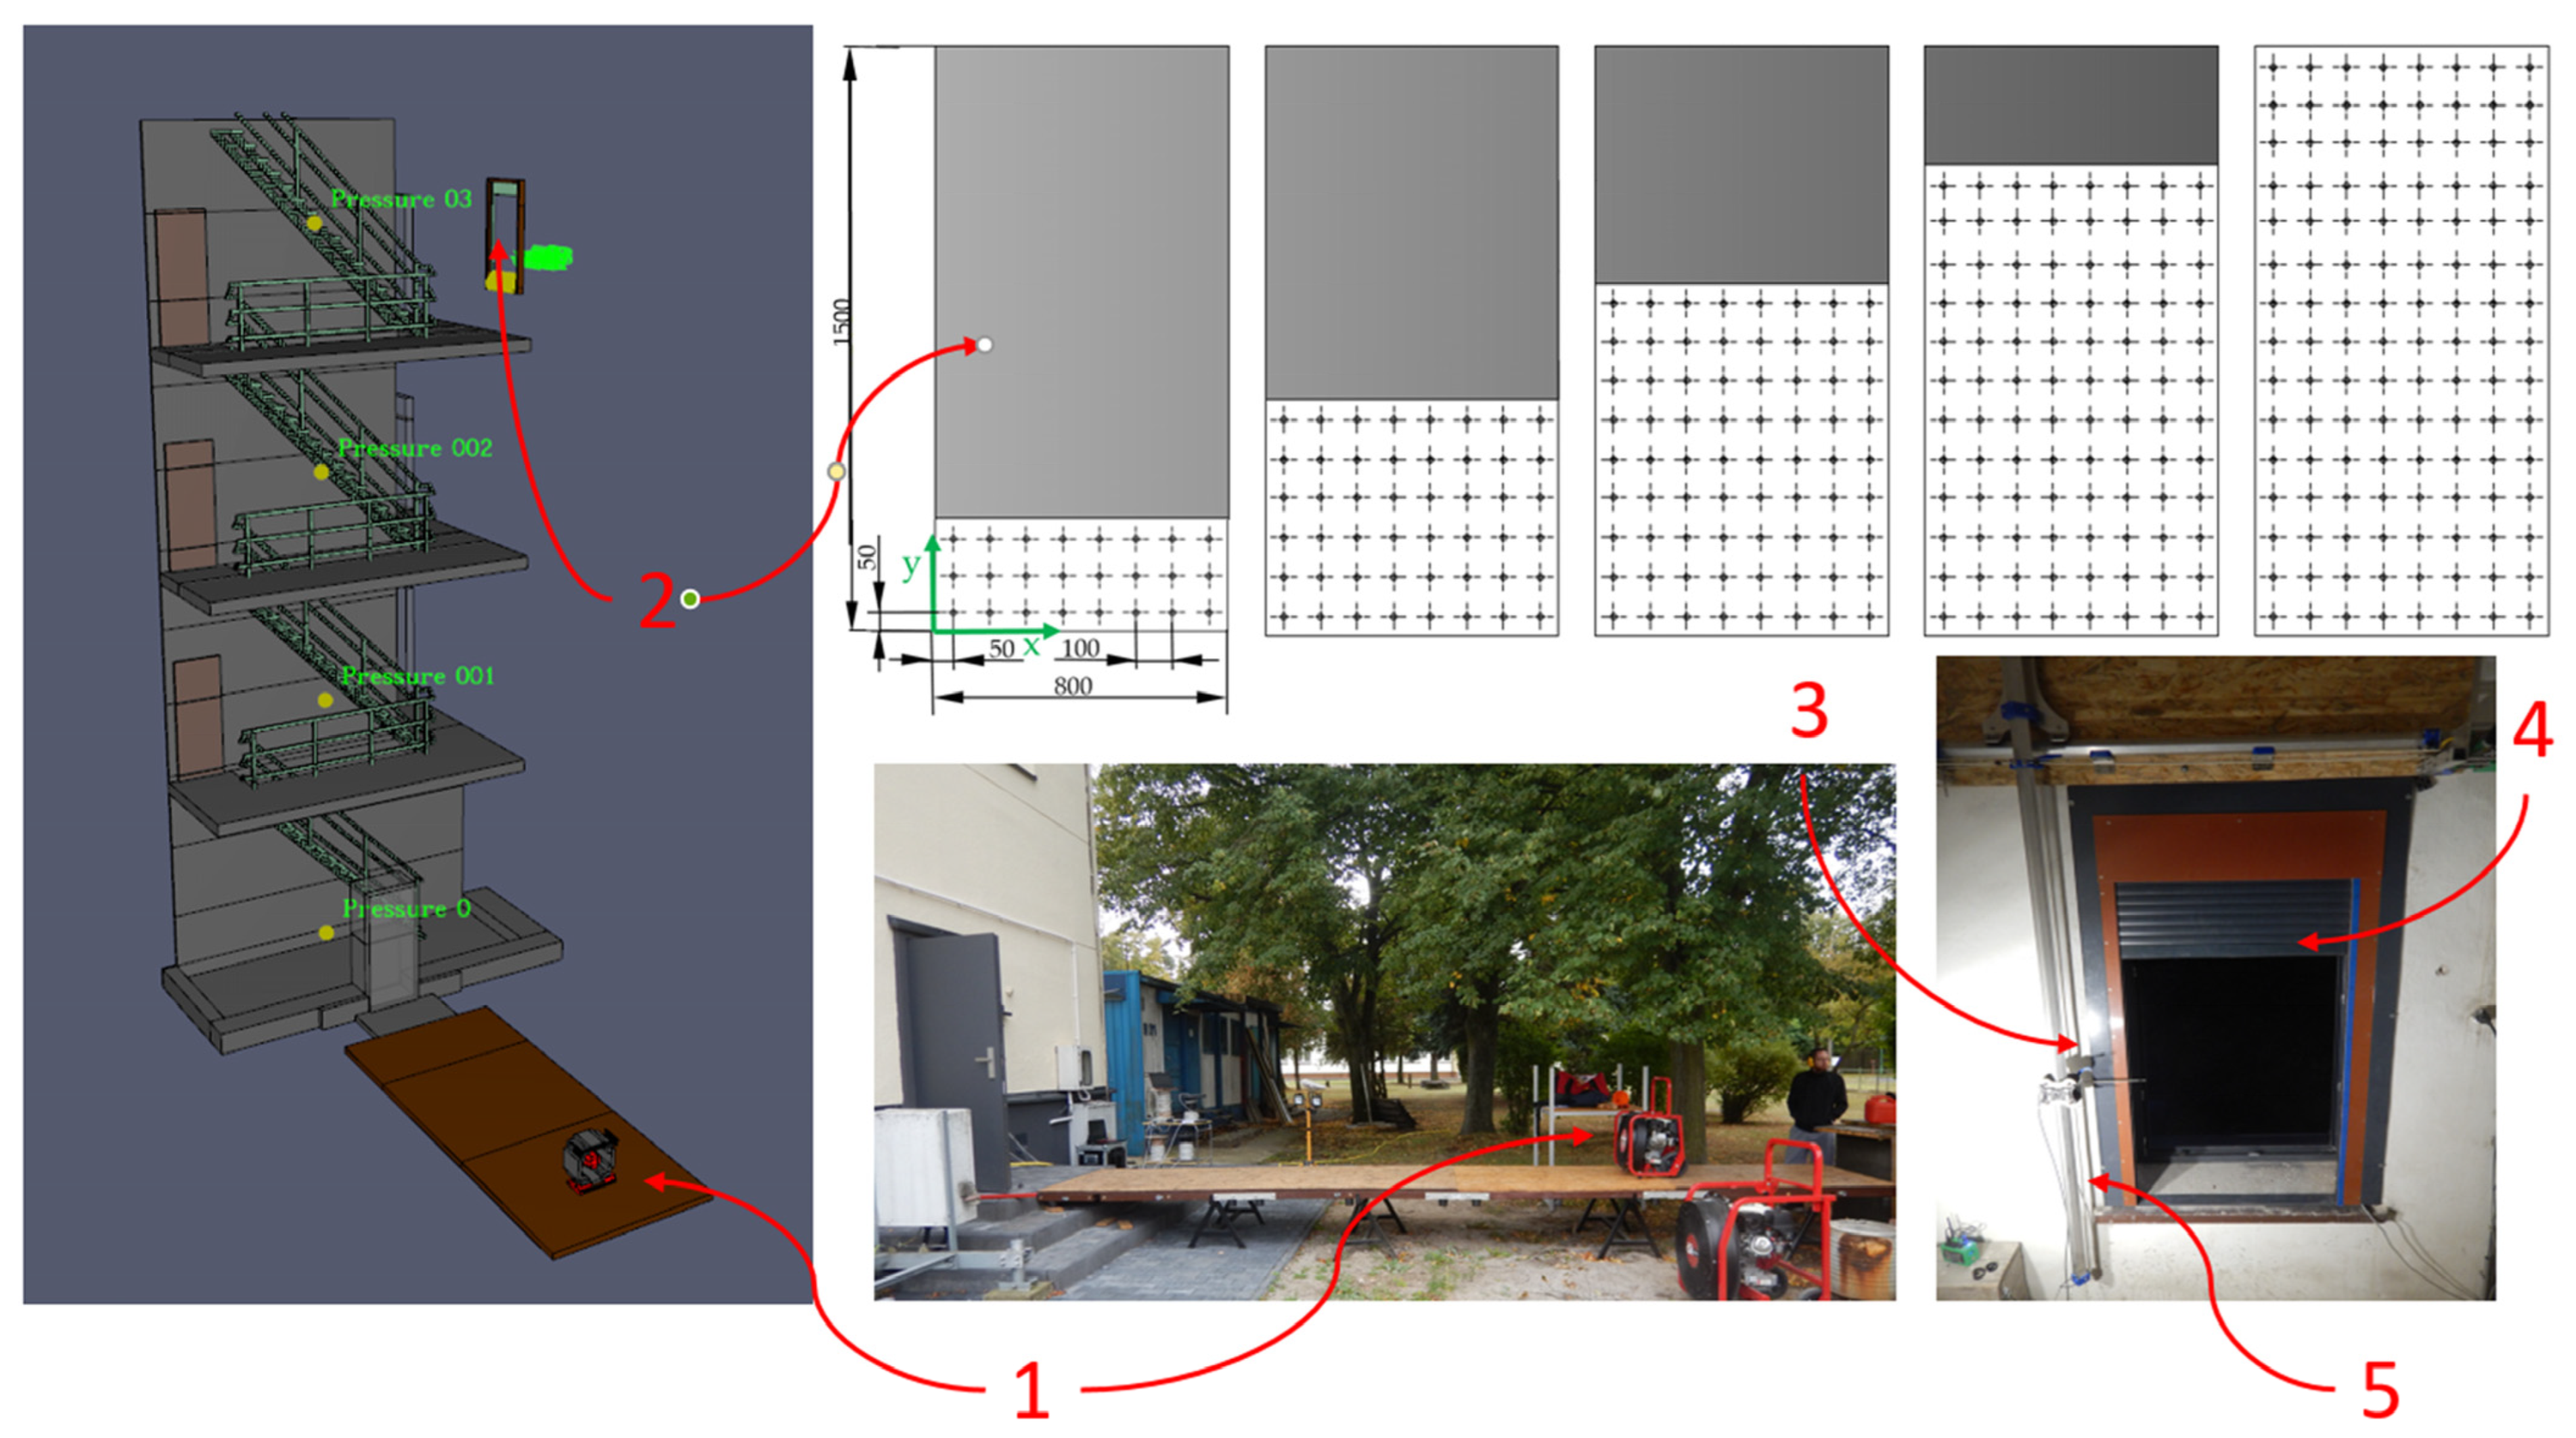
2. Materials and Methods
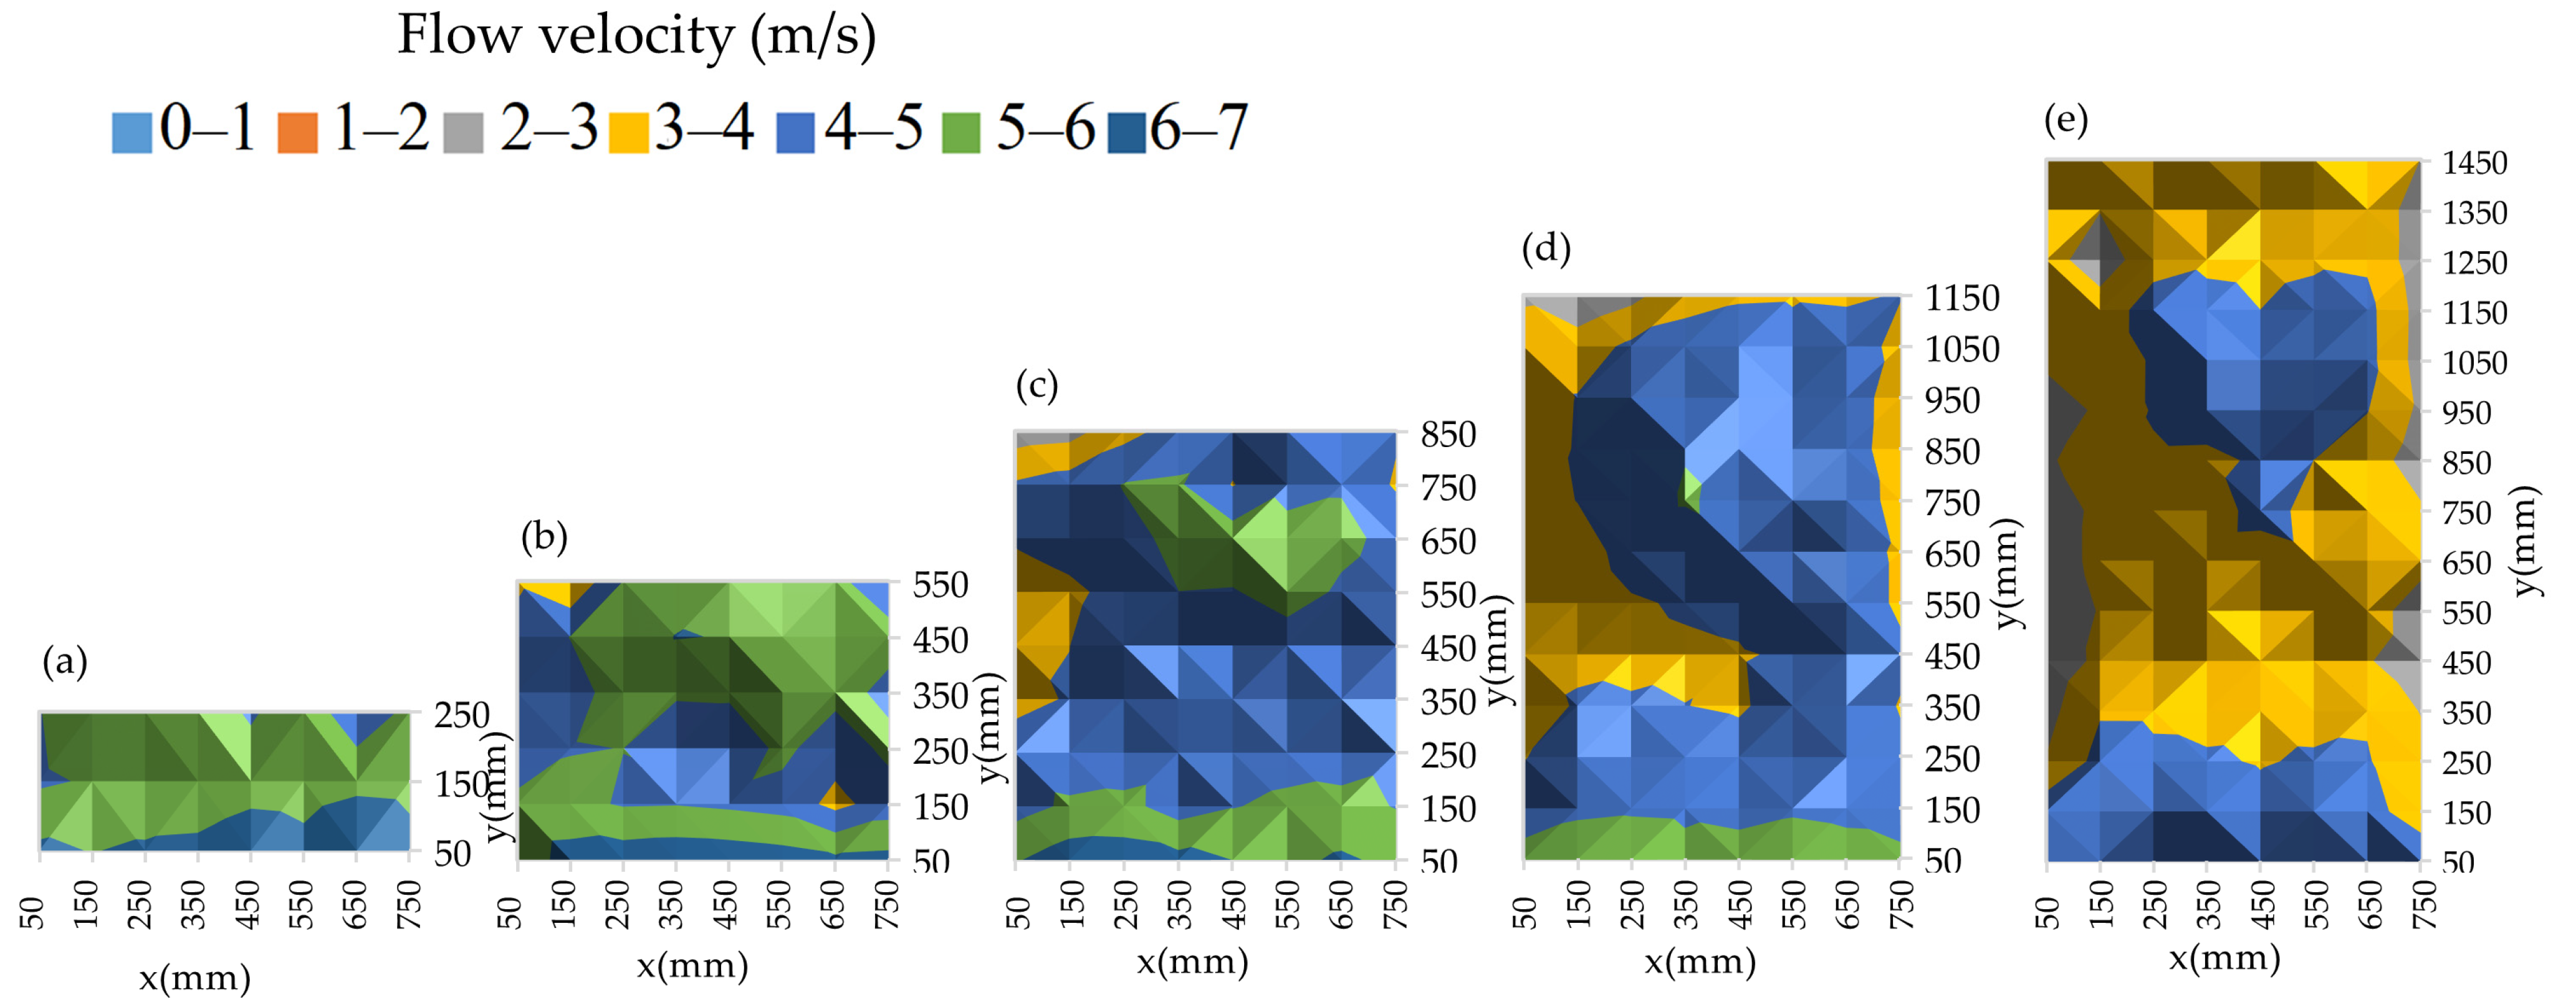
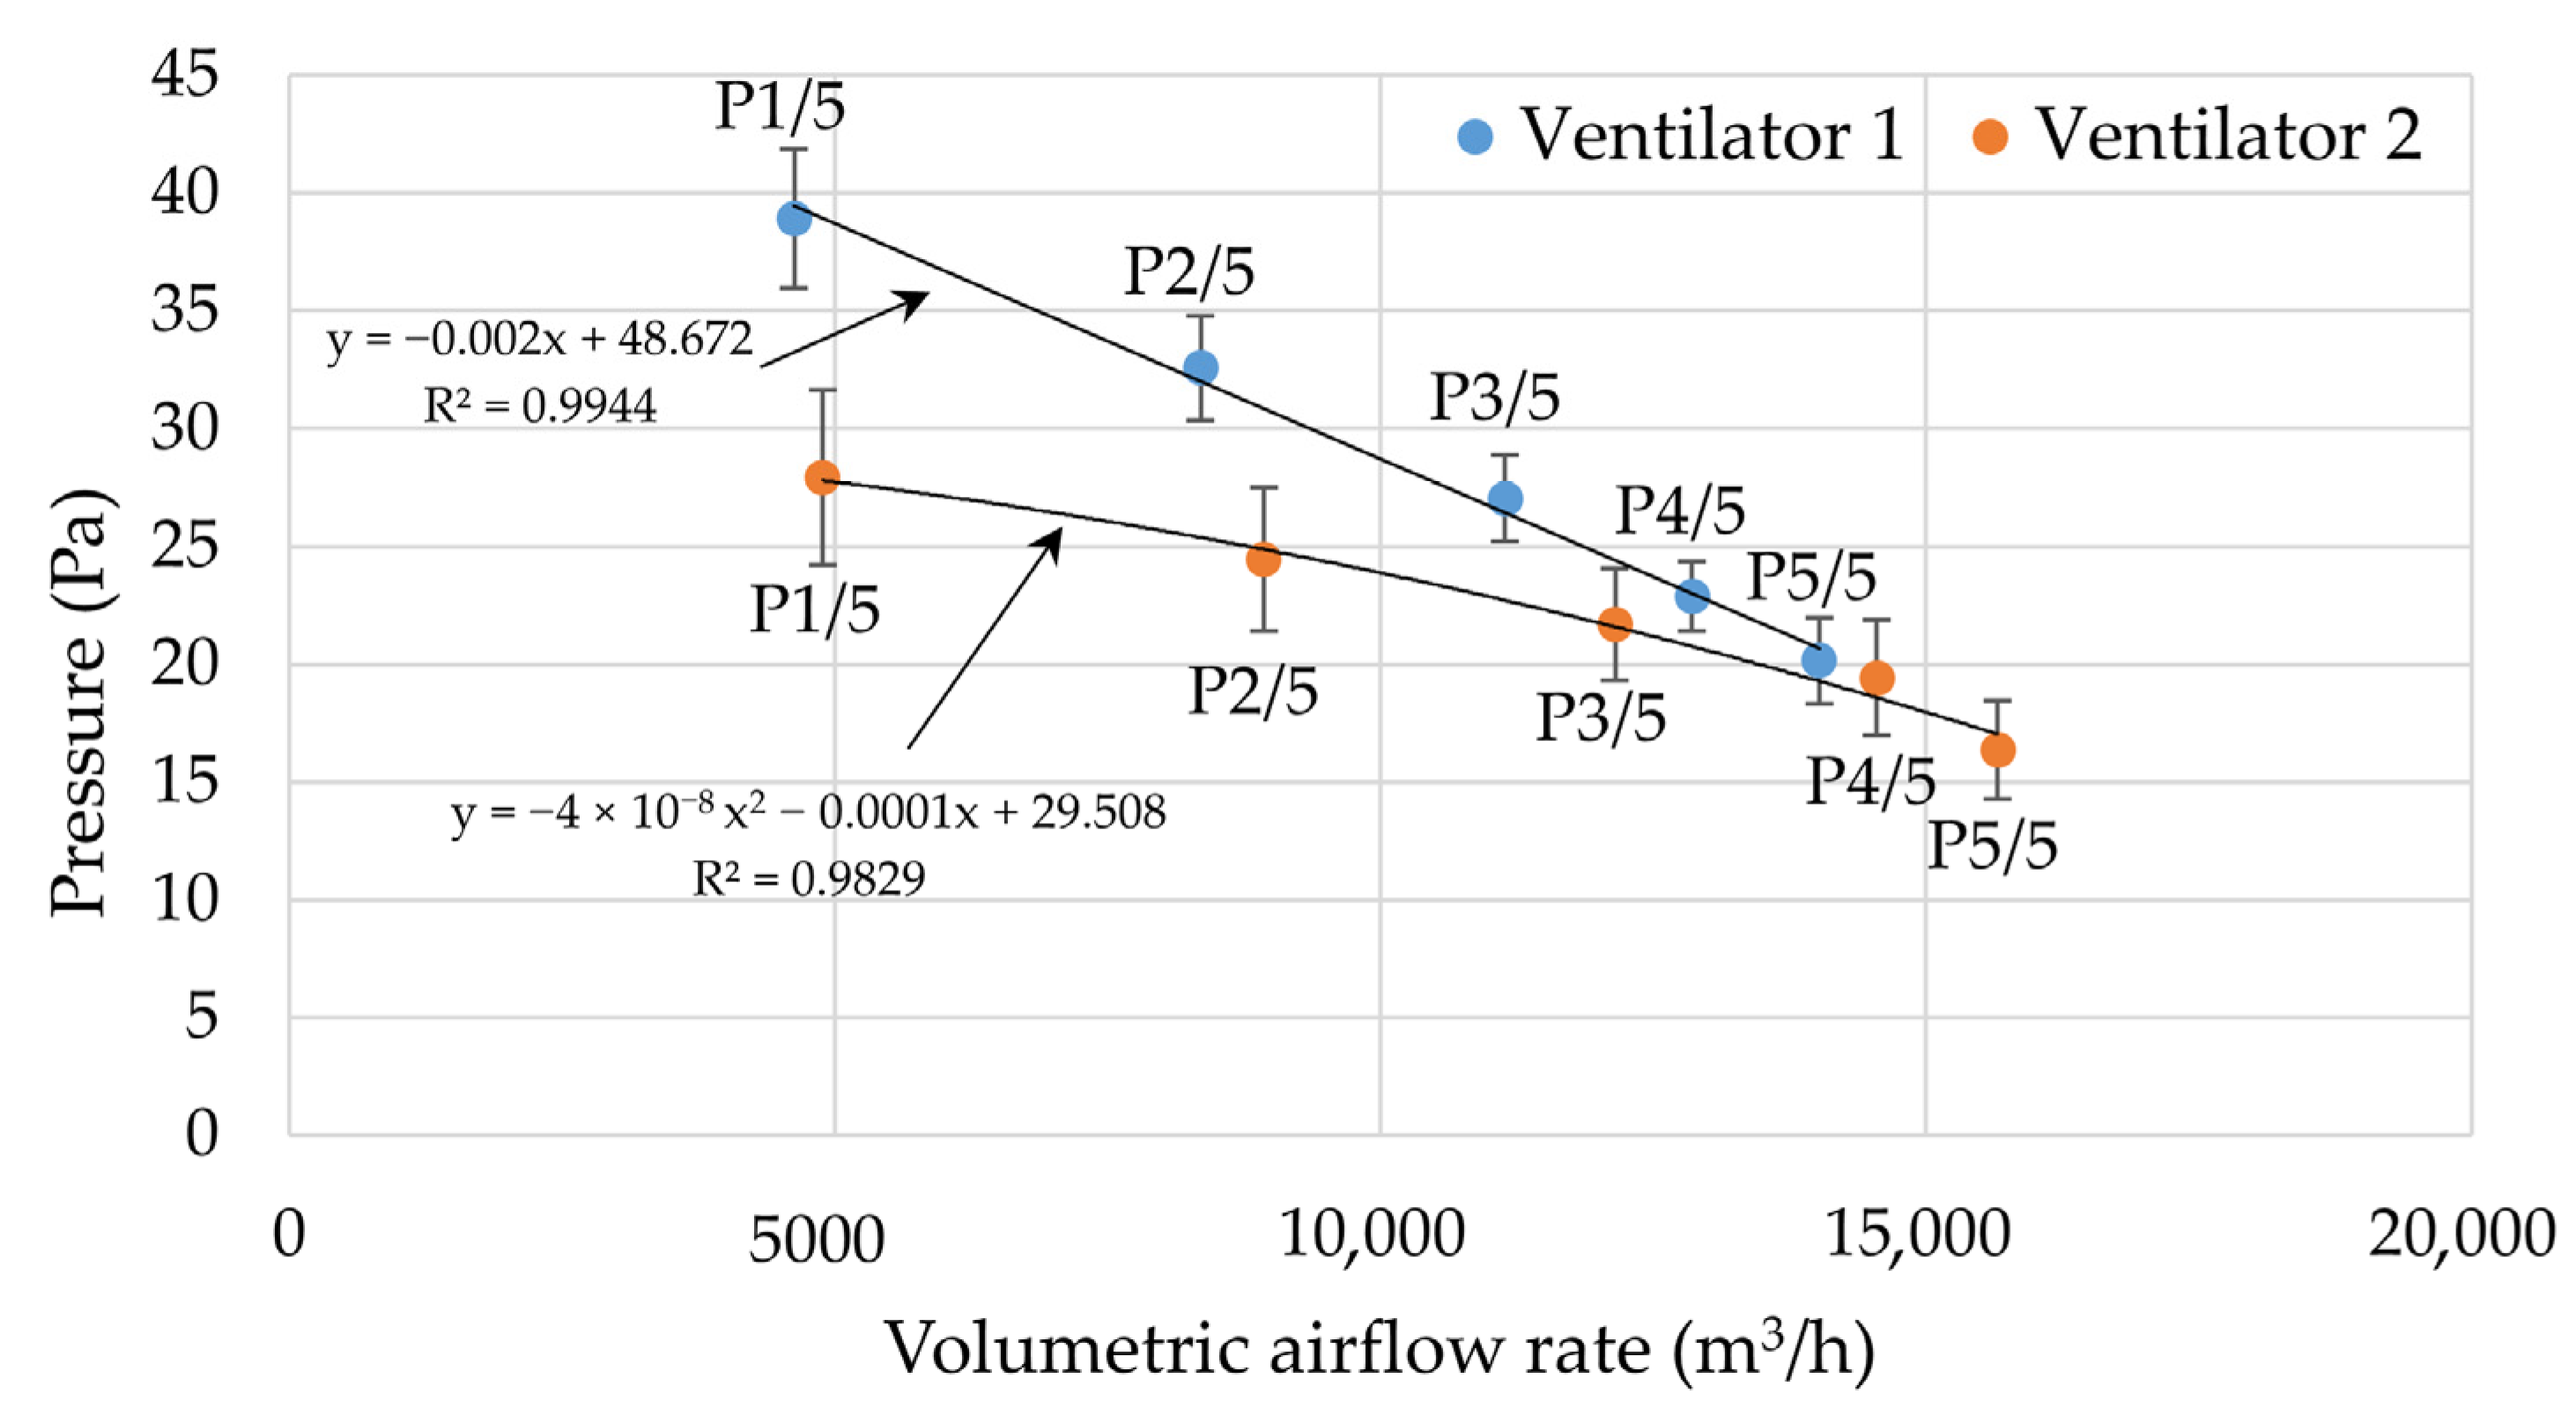
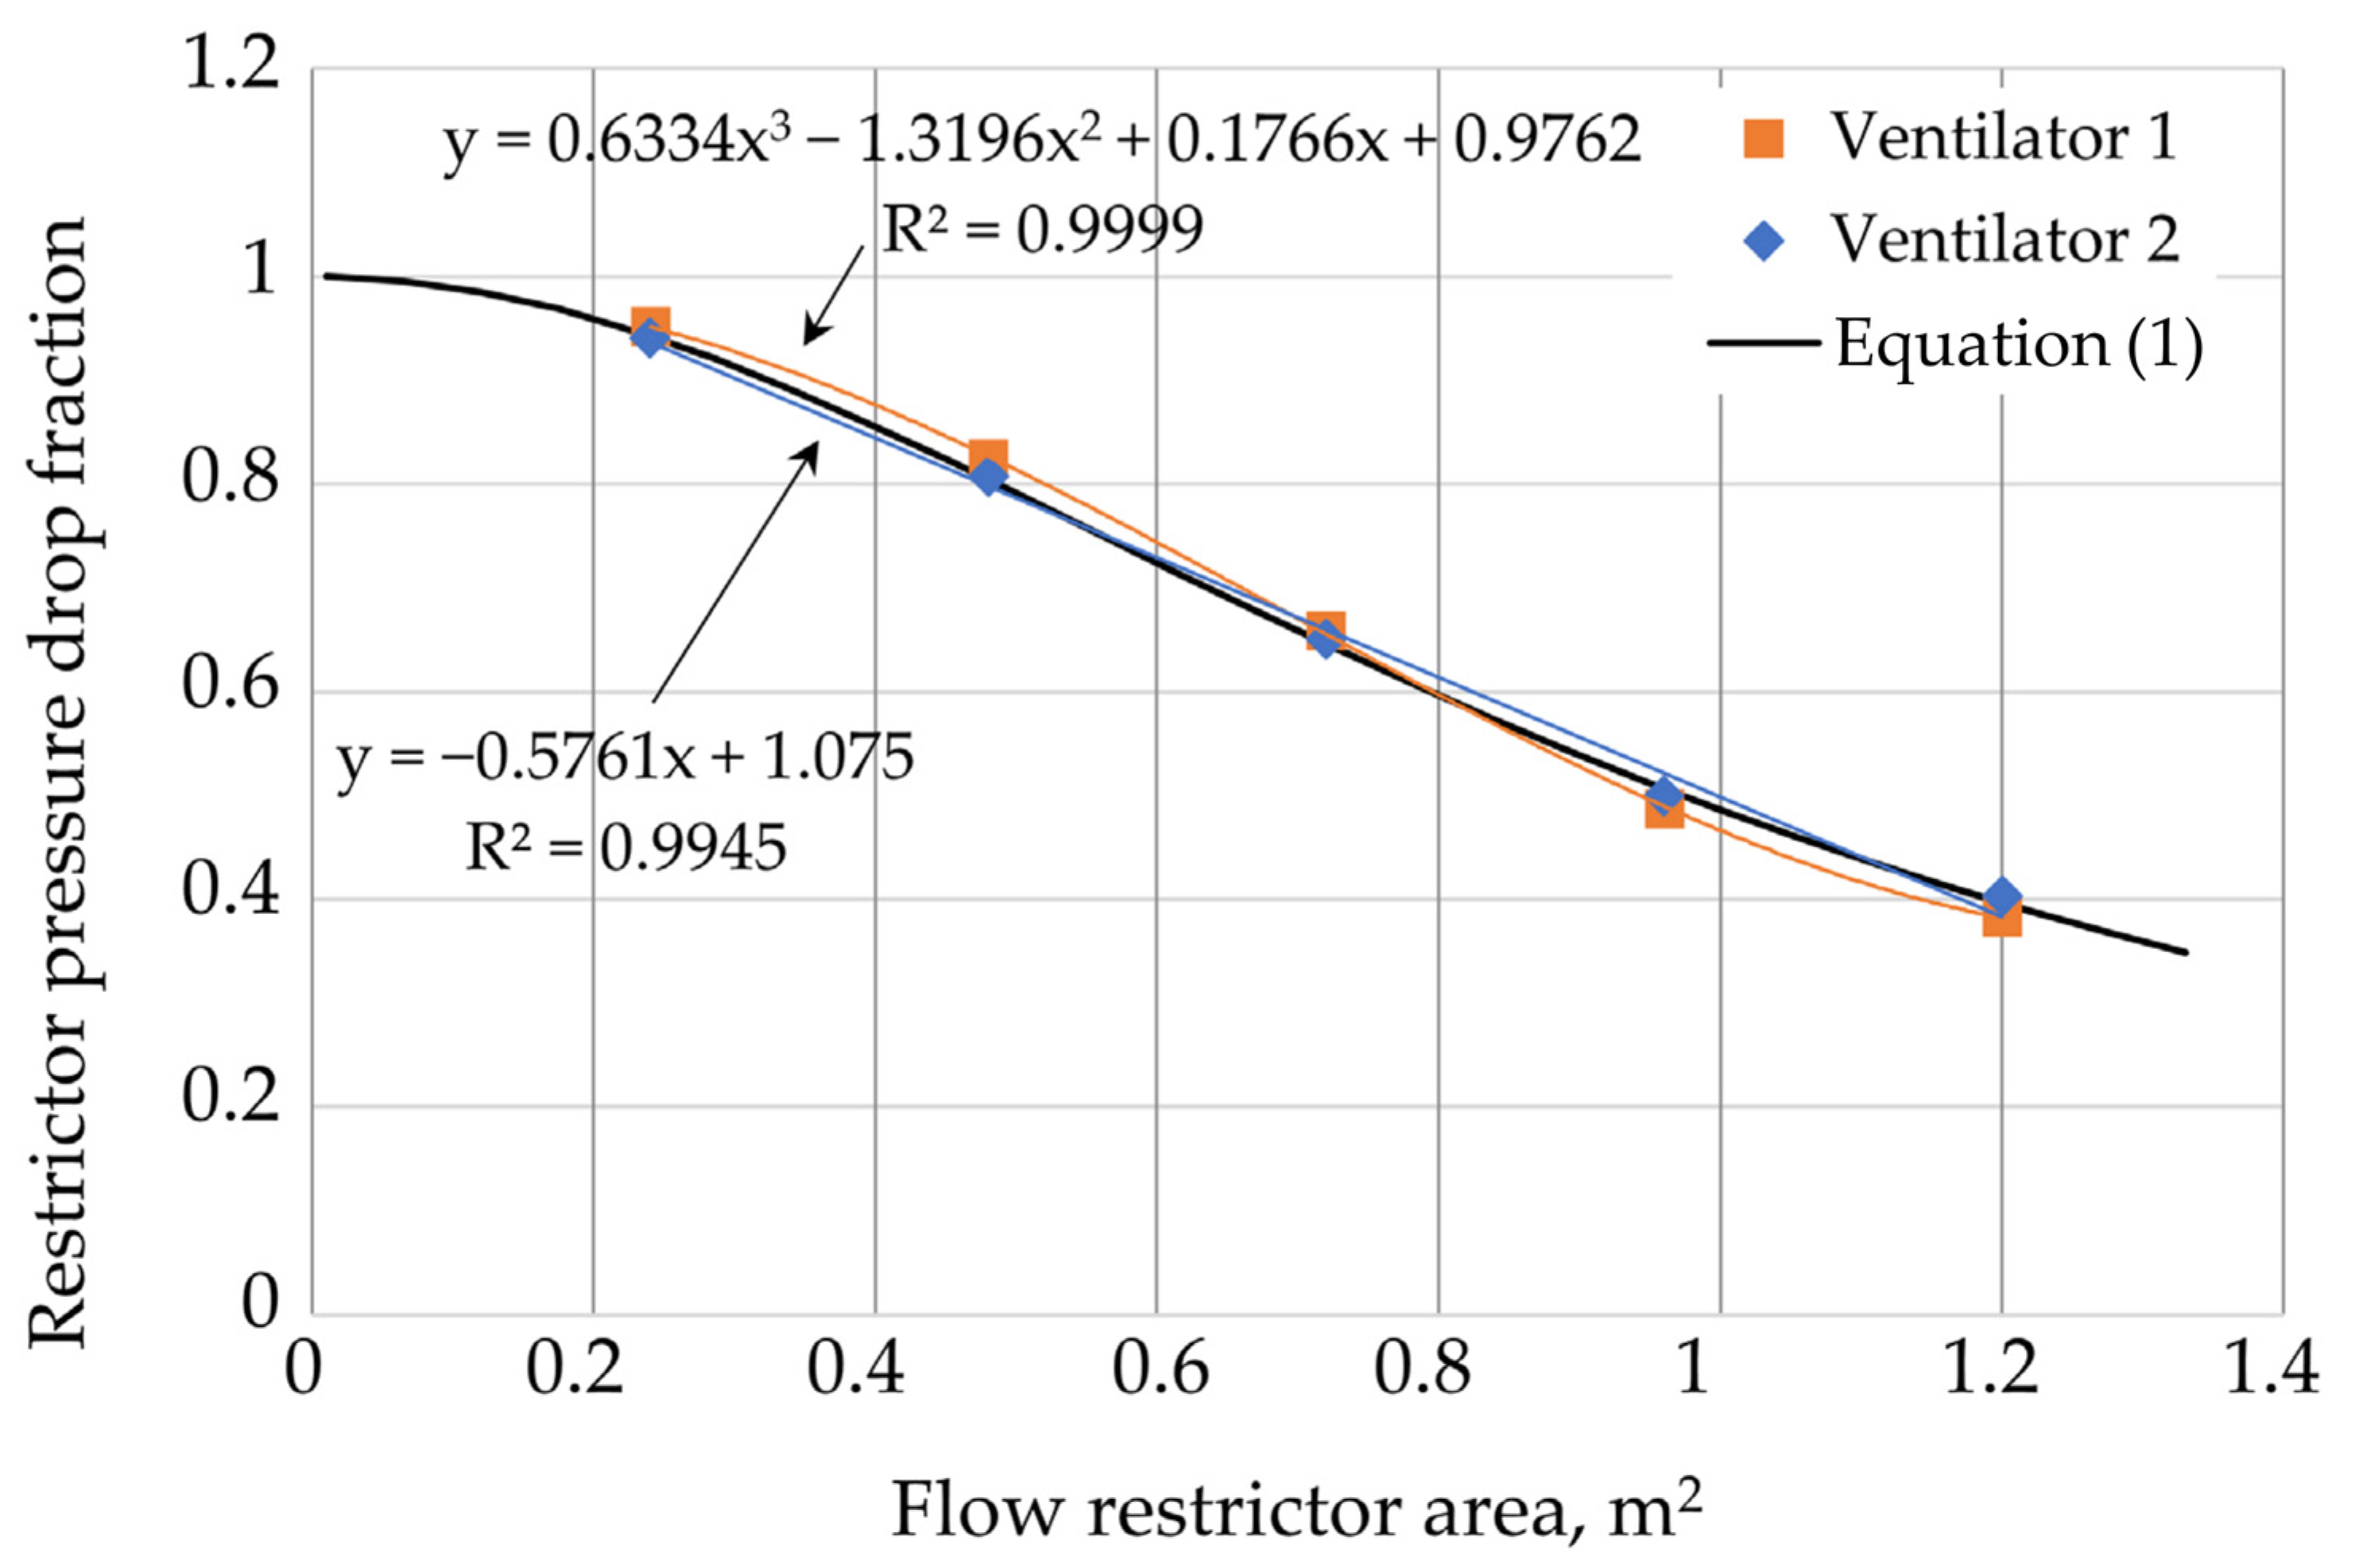
3. Results and Discussion
- – Ar—area of outlet restrictor,
- – Ac—areas of consecutive restrictions along the flowpath—here taken as three consecutive openings between staircase storeys with 2.4 m2 each,
- – Cd—relative discharge coefficient, a dimensionless parameter describing how much less effective is the restriction area Aç compared to the outlet restrictor because of secondary losses in the building.
4. Conclusions
- The analysis performed in the article can provide design guidelines for architects on the selection of roof openings, inside stairwells of residential buildings, which are built into the interior of the building, not adjacent to the façade walls (without access to windows). Moreover, the performed research may allow updates to be made to the rescue procedures in fire protection units, in terms of the selection of the size of the discharge opening for the adopted tactical rescue intention.
- The performed tests confirmed that the change in the area of the outlet opening inside the ventilated volume is an important parameter determining the effectiveness of the implemented ventilation. Depending on the fire conditions in the facility and the tactical rescue intention of the commander of the operation, the level of opening of the outlet opening should be adjusted. If it is necessary to provide evacuation conditions in the escape route (for example, in a multi-story facility) and if the products of thermal decomposition disperse inside such a facility, then it will be desirable to make the outlet opening as large as possible.
Author Contributions
Funding
Institutional Review Board Statement
Informed Consent Statement
Data Availability Statement
Conflicts of Interest
Appendix A

| Distance of the Fan from the Door Opening: 1 m The Inclination Angle of the Fan Impeller Relative to the Ground: 17° | ||||||||||||||||||
|---|---|---|---|---|---|---|---|---|---|---|---|---|---|---|---|---|---|---|
| Stage P1/5 | x (mm) | |||||||||||||||||
| 50 | 150 | 250 | 350 | 450 | 550 | 650 | 750 | |||||||||||
| AVG | SD | AVG | SD | AVG | SD | AVG | SD | AVG | SD | AVG | SD | AVG | SD | AVG | SD | |||
| y (mm) | 50 | 4.89 | 0.19 | 5.58 | 0.11 | 6.07 | 0.08 | 6.10 | 0.14 | 6.09 | 0.09 | 5.26 | 0.16 | 5.50 | 0.21 | 5.47 | 0.16 | |
| 150 | 5.39 | 0.06 | 5.33 | 0.09 | 5.12 | 0.07 | 5.07 | 0.12 | 5.01 | 0.11 | 4.80 | 0.11 | 4.67 | 0.16 | 4.52 | 0.11 | ||
| 250 | 5.16 | 0.03 | 5.40 | 0.11 | 5.53 | 0.19 | 6.07 | 0.12 | 6.06 | 0.12 | 5.93 | 0.15 | 4.84 | 0.44 | 4.60 | 0.13 | ||
| Stage P2/5 | x (mm) | |||||||||||||||||
| 50 | 150 | 250 | 350 | 450 | 550 | 650 | 750 | |||||||||||
| AVG | SD | AVG | SD | AVG | SD | AVG | SD | AVG | SD | AVG | SD | AVG | SD | AVG | SD | |||
| y (mm) | 50 | 5.49 | 0.10 | 5.68 | 0.11 | 5.95 | 0.12 | 5.94 | 0.10 | 5.91 | 0.23 | 6.04 | 0.12 | 6.23 | 0.14 | 5.90 | 0.06 | |
| 150 | 4.80 | 0.12 | 4.71 | 0.09 | 4.97 | 0.08 | 4.61 | 0.15 | 4.47 | 0.14 | 4.39 | 0.09 | 4.39 | 0.18 | 4.82 | 0.14 | ||
| 250 | 4.76 | 0.12 | 4.96 | 0.12 | 4.85 | 0.10 | 4.55 | 0.10 | 4.25 | 0.13 | 4.64 | 0.07 | 4.31 | 0.13 | 4.09 | 0.24 | ||
| 350 | 5.02 | 0.11 | 4.91 | 0.06 | 5.01 | 0.09 | 4.78 | 0.06 | 4.69 | 0.11 | 4.74 | 0.17 | 4.09 | 0.18 | 3.85 | 0.18 | ||
| 450 | 4.79 | 0.09 | 4.95 | 0.12 | 5.11 | 0.14 | 5.44 | 0.19 | 5.41 | 0.10 | 5.01 | 0.05 | 4.64 | 0.13 | 4.06 | 0.21 | ||
| 550 | 4.69 | 0.07 | 4.28 | 0.17 | 4.70 | 0.11 | 4.89 | 0.13 | 4.91 | 0.25 | 4.27 | 0.77 | 3.58 | 0.46 | 3.50 | 0.19 | ||
| Stage P3/5 | x (mm) | |||||||||||||||||
| 50 | 150 | 250 | 350 | 450 | 550 | 650 | 750 | |||||||||||
| AVG | SD | AVG | SD | AVG | SD | AVG | SD | AVG | SD | AVG | SD | AVG | SD | AVG | SD | |||
| y (mm) | 50 | 5.01 | 0.12 | 5.35 | 0.07 | 5.09 | 0.11 | 5.27 | 0.10 | 5.65 | 0.07 | 5.73 | 0.17 | 5.25 | 0.16 | 5.13 | 0.14 | |
| 150 | 4.41 | 0.06 | 4.62 | 0.07 | 4.69 | 0.07 | 4.53 | 0.14 | 4.32 | 0.11 | 4.39 | 0.14 | 4.65 | 0.13 | 3.93 | 0.21 | ||
| 250 | 4.22 | 0.11 | 4.52 | 0.07 | 4.32 | 0.07 | 4.17 | 0.08 | 4.13 | 0.10 | 3.95 | 0.11 | 4.21 | 0.08 | 3.71 | 0.23 | ||
| 350 | 4.19 | 0.15 | 4.31 | 0.08 | 4.41 | 0.13 | 4.13 | 0.18 | 4.10 | 0.10 | 3.87 | 0.16 | 3.71 | 0.12 | 3.23 | 0.41 | ||
| 450 | 4.26 | 0.11 | 4.33 | 0.10 | 4.41 | 0.15 | 4.04 | 0.18 | 4.13 | 0.12 | 4.15 | 0.18 | 3.77 | 0.12 | 3.34 | 0.48 | ||
| 550 | 4.06 | 0.18 | 4.57 | 0.14 | 4.77 | 0.21 | 4.94 | 0.34 | 4.56 | 0.14 | 4.51 | 0.13 | 3.76 | 0.15 | 3.73 | 0.07 | ||
| 650 | 4.32 | 0.07 | 4.56 | 0.06 | 4.79 | 0.19 | 4.89 | 0.17 | 4.78 | 0.15 | 4.45 | 0.14 | 4.03 | 0.12 | 3.75 | 0.18 | ||
| 750 | 4.46 | 0.23 | 4.37 | 0.09 | 4.54 | 0.13 | 4.47 | 0.14 | 4.38 | 0.18 | 4.40 | 0.20 | 3.87 | 0.21 | 3.47 | 0.21 | ||
| 850 | 3.99 | 0.07 | 4.13 | 0.08 | 4.10 | 0.11 | 4.12 | 0.14 | 3.97 | 0.29 | 3.29 | 0.50 | 2.81 | 0.61 | 2.99 | 0.47 | ||
| Stage P4/5 | x (mm) | |||||||||||||||||
| 50 | 150 | 250 | 350 | 450 | 550 | 650 | 750 | |||||||||||
| AVG | SD | AVG | SD | AVG | SD | AVG | SD | AVG | SD | AVG | SD | AVG | SD | AVG | SD | |||
| y (mm) | 50 | 4.54 | 0.06 | 4.90 | 0.08 | 4.69 | 0.14 | 4.52 | 0.30 | 4.70 | 0.15 | 4.95 | 0.13 | 4.92 | 0.32 | 4.95 | 0.06 | |
| 150 | 3.76 | 0.12 | 4.33 | 0.0 | 4.27 | 0.09 | 4.16 | 0.12 | 4.23 | 0.13 | 4.22 | 0.16 | 4.43 | 0.06 | 3.76 | 0.11 | ||
| 250 | 3.53 | 0.22 | 4.12 | 0.04 | 3.90 | 0.07 | 3.86 | 0.07 | 3.82 | 0.13 | 3.92 | 0.13 | 3.80 | 0.19 | 3.15 | 0.16 | ||
| 350 | 3.16 | 0.23 | 3.84 | 0.08 | 3.86 | 0.12 | 3.60 | 0.13 | 3.50 | 0.06 | 3.50 | 0.16 | 3.44 | 0.09 | 2.47 | 0.19 | ||
| 450 | 3.54 | 0.09 | 3.86 | 0.11 | 3.72 | 0.11 | 3.24 | 0.13 | 3.56 | 0.07 | 3.55 | 0.10 | 3.36 | 0.13 | 2.41 | 0.40 | ||
| 550 | 3.21 | 0.28 | 3.91 | 0.17 | 3.89 | 0.10 | 3.58 | 0.09 | 3.43 | 0.11 | 3.48 | 0.20 | 3.16 | 0.14 | 2.43 | 0.45 | ||
| 650 | 3.44 | 0.14 | 4.10 | 0.12 | 4.03 | 0.13 | 4.10 | 0.19 | 3.94 | 0.20 | 3.76 | 0.09 | 3.58 | 0.13 | 2.91 | 0.33 | ||
| 750 | 3.16 | 0.23 | 3.75 | 0.08 | 4.19 | 0.26 | 4.50 | 0.23 | 4.06 | 0.17 | 3.79 | 0.11 | 3.42 | 0.14 | 2.91 | 0.13 | ||
| 850 | 3.16 | 0.36 | 3.89 | 0.09 | 4.17 | 0.07 | 4.70 | 0.24 | 4.04 | 0.14 | 3.93 | 0.15 | 3.53 | 0.14 | 3.26 | 0.21 | ||
| 950 | 3.20 | 0.21 | 4.13 | 0.12 | 3.93 | 0.17 | 4.05 | 0.16 | 4.21 | 0.21 | 3.87 | 0.09 | 3.53 | 0.13 | 3.28 | 0.15 | ||
| 1050 | 3.44 | 0.26 | 3.91 | 0.07 | 3.60 | 0.10 | 3.64 | 0.13 | 3.52 | 0.13 | 3.01 | 0.25 | 3.13 | 0.35 | 3.26 | 0.26 | ||
| 1150 | 3.81 | 0.16 | 3.52 | 0.09 | 3.44 | 0.13 | 3.51 | 0.24 | 2.98 | 0.31 | 3.14 | 0.11 | 2.91 | 0.46 | 2.62 | 0.52 | ||
| Stage P5/5 | x (mm) | |||||||||||||||||
| 50 | 150 | 250 | 350 | 450 | 550 | 650 | 750 | |||||||||||
| AVG | SD | AVG | SD | AVG | SD | AVG | SD | AVG | SD | AVG | SD | AVG | SD | AVG | SD | |||
| y (mm) | 50 | 4.10 | 0.13 | 4.29 | 0.18 | 3.92 | 0.30 | 3.75 | 0.32 | 3.36 | 0.29 | 3.41 | 0.51 | 4.12 | 0.40 | 4.29 | 0.18 | |
| 150 | 2.68 | 0.18 | 3.55 | 0.07 | 3.69 | 0.10 | 3.93 | 0.08 | 3.80 | 0.09 | 3.99 | 0.09 | 3.90 | 0.12 | 3.19 | 0.19 | ||
| 250 | 3.02 | 0.26 | 3.64 | 0.08 | 3.61 | 0.05 | 3.61 | 0.10 | 3.53 | 0.06 | 3.71 | 0.17 | 3.83 | 0.13 | 2.97 | 0.37 | ||
| 350 | 2.68 | 0.22 | 3.52 | 0.06 | 3.43 | 0.10 | 3.34 | 0.12 | 3.24 | 0.12 | 3.23 | 0.15 | 3.46 | 0.08 | 2.85 | 0.19 | ||
| 450 | 2.93 | 0.31 | 3.40 | 0.08 | 3.33 | 0.14 | 3.15 | 0.08 | 3.20 | 0.12 | 3.15 | 0.08 | 3.26 | 0.13 | 2.48 | 0.24 | ||
| 550 | 2.60 | 0.28 | 3.04 | 0.16 | 3.21 | 0.06 | 3.10 | 0.10 | 3.09 | 0.08 | 3.29 | 0.14 | 3.34 | 0.12 | 2.31 | 0.14 | ||
| 650 | 2.82 | 0.31 | 3.41 | 0.10 | 3.37 | 0.12 | 3.29 | 0.13 | 3.29 | 0.11 | 3.17 | 0.06 | 3.10 | 0.13 | 1.94 | 0.13 | ||
| 750 | 2.87 | 0.17 | 3.56 | 0.09 | 3.46 | 0.09 | 3.36 | 0.16 | 3.24 | 0.09 | 3.15 | 0.14 | 2.93 | 0.05 | 2.42 | 0.11 | ||
| 850 | 2.45 | 0.34 | 3.44 | 0.10 | 3.49 | 0.14 | 3.45 | 0.19 | 3.74 | 0.17 | 3.45 | 0.04 | 3.06 | 0.29 | 2.59 | 0.15 | ||
| 950 | 2.10 | 0.37 | 3.40 | 0.13 | 3.69 | 0.12 | 3.94 | 0.26 | 3.76 | 0.32 | 3.65 | 0.12 | 2.96 | 0.14 | 2.65 | 0.13 | ||
| 1050 | 1.97 | 0.30 | 3.45 | 0.11 | 3.46 | 0.05 | 3.82 | 0.14 | 3.77 | 0.19 | 3.68 | 0.14 | 3.30 | 0.11 | 2.77 | 0.20 | ||
| 1150 | 1.59 | 0.14 | 3.24 | 0.16 | 3.64 | 0.09 | 3.15 | 0.17 | 3.24 | 0.13 | 3.33 | 0.16 | 2.84 | 0.16 | 2.87 | 0.12 | ||
| 1250 | 1.93 | 0.31 | 3.25 | 0.16 | 3.21 | 0.16 | 3.30 | 0.14 | 3.40 | 0.08 | 3.33 | 0.12 | 2.77 | 0.18 | 2.47 | 0.21 | ||
| 1350 | 2.39 | 0.23 | 3.50 | 0.09 | 3.75 | 0.13 | 3.75 | 0.07 | 3.33 | 0.08 | 3.49 | 0.17 | 3.06 | 0.10 | 2.67 | 0.14 | ||
| 1450 | 3.06 | 0.24 | 3.73 | 0.11 | 3.43 | 0.10 | 3.22 | 0.28 | 3.31 | 0.55 | 3.56 | 0.18 | 2.96 | 0.27 | 2.76 | 0.25 | ||
| Distance of the Fan from the Door Opening: 5 m The Inclination Angle of the Fan Impeller Relative to the Ground: 6° | |||||||||||||||||
|---|---|---|---|---|---|---|---|---|---|---|---|---|---|---|---|---|---|
| Stage P1/5 | x (mm) | ||||||||||||||||
| 50 | 150 | 250 | 350 | 450 | 550 | 650 | 750 | ||||||||||
| AVG | SD | AVG | SD | AVG | SD | AVG | SD | AVG | SD | AVG | SD | AVG | SD | AVG | SD | ||
| y (mm) | 50 | 6.32 | 0.20 | 6.81 | 0.12 | 6.29 | 0.15 | 6.58 | 0.24 | 6.23 | 0.18 | 6.18 | 0.17 | 5.96 | 0.14 | 6.22 | 0.14 |
| 150 | 5.72 | 0.10 | 5.78 | 0.10 | 5.56 | 0.17 | 5.62 | 0.13 | 5.35 | 0.10 | 5.04 | 0.23 | 5.10 | 0.14 | 4.85 | 0.18 | |
| 250 | 5.27 | 0.14 | 4.20 | 0.78 | 5.74 | 0.24 | 4.85 | 0.63 | 5.68 | 0.13 | 5.71 | 0.30 | 5.70 | 0.42 | 4.96 | 0.14 | |
| Stage P2/5 | x (mm) | ||||||||||||||||
| 50 | 150 | 250 | 350 | 450 | 550 | 650 | 750 | ||||||||||
| AVG | SD | AVG | SD | AVG | SD | AVG | SD | AVG | SD | AVG | SD | AVG | SD | AVG | SD | ||
| y (mm) | 50 | 6.31 | 0.09 | 6.22 | 0.12 | 6.49 | 0.23 | 6.65 | 0.14 | 6.71 | 0.16 | 6.59 | 0.17 | 6.44 | 0.69 | 5.30 | 0.59 |
| 150 | 4.48 | 0.69 | 3.71 | 0.26 | 4.62 | 0.15 | 4.82 | 0.43 | 4.95 | 0.23 | 4.92 | 0.11 | 5.25 | 0.11 | 5.17 | 0.18 | |
| 250 | 5.24 | 0.14 | 4.41 | 0.68 | 5.24 | 0.14 | 4.31 | 0.40 | 4.34 | 0.56 | 5.01 | 0.13 | 4.96 | 0.31 | 4.52 | 0.09 | |
| 350 | 4.80 | 0.28 | 5.29 | 0.19 | 5.58 | 0.20 | 5.16 | 0.13 | 5.12 | 0.20 | 5.31 | 0.08 | 4.73 | 0.17 | 4.34 | 0.14 | |
| 450 | 5.28 | 0.09 | 5.27 | 0.10 | 5.68 | 0.18 | 5.96 | 0.13 | 6.04 | 0.13 | 5.40 | 0.14 | 5.02 | 0.11 | 4.31 | 0.30 | |
| 550 | 4.49 | 0.18 | 5.17 | 0.10 | 5.41 | 0.14 | 5.76 | 0.14 | 5.37 | 0.40 | 5.00 | 0.23 | 3.06 | 0.28 | 3.84 | 0.29 | |
| Stage P3/5 | x (mm) | ||||||||||||||||
| 50 | 150 | 250 | 350 | 450 | 550 | 650 | 750 | ||||||||||
| AVG | SD | AVG | SD | AVG | SD | AVG | SD | AVG | SD | AVG | SD | AVG | SD | AVG | SD | ||
| y (mm) | 50 | 5.78 | 0.10 | 6.14 | 0.17 | 5.77 | 0.18 | 6.00 | 0.23 | 6.33 | 0.22 | 6.51 | 0.10 | 6.56 | 0.10 | 5.91 | 0.12 |
| 150 | 4.96 | 0.11 | 5.33 | 0.07 | 5.20 | 0.15 | 4.96 | 0.22 | 4.53 | 0.29 | 5.31 | 0.21 | 5.16 | 0.21 | 4.61 | 0.15 | |
| 250 | 4.76 | 0.13 | 4.49 | 0.30 | 4.63 | 0.10 | 4.52 | 0.16 | 4.54 | 0.17 | 4.27 | 0.13 | 4.37 | 0.07 | 4.55 | 0.13 | |
| 350 | 4.53 | 0.30 | 4.79 | 0.17 | 4.54 | 0.32 | 4.64 | 0.09 | 4.52 | 0.07 | 4.34 | 0.16 | 4.08 | 0.14 | 3.67 | 0.27 | |
| 450 | 4.57 | 0.26 | 4.19 | 0.34 | 4.67 | 0.42 | 4.03 | 0.12 | 4.28 | 0.83 | 4.68 | 0.11 | 3.99 | 0.25 | 3.85 | 0.34 | |
| 550 | 4.70 | 0.18 | 4.91 | 0.20 | 5.30 | 0.23 | 4.95 | 0.10 | 4.99 | 0.20 | 4.36 | 0.17 | 3.79 | 0.31 | 3.38 | 0.74 | |
| 650 | 4.82 | 0.17 | 5.16 | 0.10 | 5.16 | 0.15 | 5.50 | 0.20 | 5.14 | 0.10 | 4.83 | 0.15 | 4.47 | 0.08 | 4.14 | 0.14 | |
| 750 | 3.88 | 0.65 | 4.95 | 0.18 | 4.85 | 0.18 | 3.95 | 0.57 | 5.13 | 0.18 | 5.03 | 0.11 | 4.51 | 0.42 | 4.12 | 0.23 | |
| 850 | 4.13 | 0.37 | 4.27 | 0.22 | 4.93 | 0.16 | 4.55 | 0.19 | 4.39 | 0.35 | 3.66 | 0.39 | 2.60 | 0.61 | 2.45 | 0.51 | |
| Stage P4/5 | x (mm) | ||||||||||||||||
| 50 | 150 | 250 | 350 | 450 | 550 | 650 | 750 | ||||||||||
| AVG | SD | AVG | SD | AVG | SD | AVG | SD | AVG | SD | AVG | SD | AVG | SD | AVG | SD | ||
| y (mm) | 50 | 5.39 | 0.08 | 5.42 | 0.10 | 5.63 | 0.22 | 5.50 | 0.14 | 5.30 | 0.25 | 5.74 | 0.21 | 5.86 | 0.20 | 5.62 | 0.26 |
| 150 | 4.26 | 0.24 | 4.74 | 0.09 | 4.87 | 0.10 | 4.64 | 0.15 | 4.81 | 0.07 | 4.86 | 0.08 | 4.74 | 0.18 | 4.10 | 0.20 | |
| 250 | 4.11 | 0.15 | 4.55 | 0.05 | 4.34 | 0.07 | 4.22 | 0.09 | 4.35 | 0.15 | 4.27 | 0.18 | 4.38 | 0.19 | 3.96 | 0.20 | |
| 350 | 3.97 | 0.20 | 4.39 | 0.08 | 4.24 | 0.07 | 3.93 | 0.09 | 4.01 | 0.11 | 4.08 | 0.20 | 4.18 | 0.29 | 2.99 | 0.26 | |
| 450 | 4.14 | 0.10 | 4.25 | 0.09 | 4.06 | 0.12 | 3.96 | 0.09 | 3.89 | 0.10 | 3.81 | 0.13 | 3.67 | 0.15 | 3.36 | 0.18 | |
| 550 | 3.88 | 0.25 | 4.44 | 0.11 | 4.35 | 0.15 | 4.12 | 0.12 | 4.08 | 0.09 | 3.92 | 0.09 | 3.44 | 0.18 | 3.01 | 0.29 | |
| 650 | 3.88 | 0.31 | 4.35 | 0.10 | 4.40 | 0.12 | 4.74 | 0.22 | 4.31 | 0.11 | 4.33 | 0.11 | 3.60 | 0.20 | 3.19 | 0.26 | |
| 750 | 3.67 | 0.24 | 4.56 | 0.05 | 4.73 | 0.16 | 4.73 | 0.22 | 5.10 | 0.28 | 4.36 | 0.14 | 4.02 | 0.14 | 3.59 | 0.17 | |
| 850 | 3.39 | 0.23 | 4.54 | 0.16 | 4.57 | 0.10 | 4.79 | 0.18 | 4.95 | 0.31 | 4.41 | 0.20 | 4.09 | 0.12 | 3.33 | 0.17 | |
| 950 | 3.48 | 0.33 | 4.55 | 0.08 | 4.42 | 0.12 | 4.63 | 0.22 | 4.50 | 0.30 | 4.47 | 0.10 | 4.05 | 0.10 | 3.02 | 0.38 | |
| 1050 | 3.77 | 0.19 | 4.43 | 0.15 | 4.23 | 0.09 | 4.47 | 0.11 | 4.36 | 0.17 | 4.19 | 0.16 | 3.51 | 0.36 | 3.42 | 0.23 | |
| 1150 | 4.04 | 0.08 | 3.87 | 0.14 | 3.93 | 0.10 | 3.90 | 0.21 | 3.70 | 0.28 | 2.69 | 0.66 | 2.15 | 0.72 | 2.87 | 0.25 | |
| Stage P5/5 | x (mm) | ||||||||||||||||
| 50 | 150 | 250 | 350 | 450 | 550 | 650 | 750 | ||||||||||
| AVG | SD | AVG | SD | AVG | SD | AVG | SD | AVG | SD | AVG | SD | AVG | SD | AVG | SD | ||
| y (mm) | 50 | 4.40 | 0.07 | 4.20 | 0.12 | 4.22 | 0.17 | 4.25 | 0.28 | 4.09 | 0.07 | 4.13 | 0.24 | 4.36 | 0.28 | 4.58 | 0.22 |
| 150 | 3.70 | 0.18 | 4.20 | 0.05 | 4.40 | 0.14 | 4.23 | 0.06 | 4.51 | 0.12 | 4.36 | 0.19 | 4.37 | 0.12 | 4.63 | 0.14 | |
| 250 | 3.38 | 0.32 | 4.06 | 0.07 | 4.08 | 0.10 | 3.95 | 0.07 | 4.09 | 0.09 | 4.10 | 0.18 | 4.32 | 0.19 | 3.05 | 0.26 | |
| 350 | 2.95 | 0.43 | 3.91 | 0.11 | 3.79 | 0.08 | 3.81 | 0.16 | 3.78 | 0.14 | 3.92 | 0.17 | 3.92 | 0.08 | 2.68 | 0.35 | |
| 450 | 2.31 | 0.54 | 3.09 | 0.13 | 3.20 | 0.15 | 3.55 | 0.08 | 3.50 | 0.10 | 3.30 | 0.24 | 3.21 | 0.26 | 2.37 | 0.20 | |
| 550 | 2.29 | 0.63 | 3.65 | 0.12 | 3.42 | 0.08 | 3.36 | 0.13 | 3.54 | 0.10 | 3.27 | 0.13 | 3.05 | 0.26 | 2.40 | 0.26 | |
| 650 | 3.47 | 0.21 | 3.78 | 0.09 | 3.83 | 0.13 | 3.59 | 0.06 | 3.63 | 0.13 | 3.31 | 0.11 | 3.24 | 0.17 | 2.52 | 0.26 | |
| 750 | 3.13 | 0.24 | 3.83 | 0.08 | 3.79 | 0.18 | 4.28 | 0.34 | 3.61 | 0.10 | 3.47 | 0.09 | 3.24 | 0.17 | 2.43 | 0.24 | |
| 850 | 2.48 | 0.64 | 3.50 | 0.31 | 4.00 | 0.26 | 4.09 | 0.25 | 3.85 | 0.09 | 3.87 | 0.16 | 3.48 | 0.23 | 2.88 | 0.16 | |
| 950 | 2.81 | 0.19 | 4.04 | 0.10 | 4.22 | 0.11 | 4.22 | 0.37 | 4.32 | 0.14 | 4.09 | 0.16 | 3.18 | 0.23 | 2.39 | 0.25 | |
| 1050 | 2.59 | 0.33 | 4.31 | 0.22 | 4.30 | 0.13 | 4.22 | 0.16 | 4.33 | 0.20 | 4.08 | 0.1 | 3.53 | 0.21 | 3.22 | 0.13 | |
| 1150 | 2.62 | 0.27 | 4.29 | 0.09 | 4.15 | 0.16 | 4.00 | 0.21 | 4.16 | 0.16 | 4.39 | 0.15 | 3.53 | 0.25 | 3.26 | 0.20 | |
| 1250 | 2.41 | 0.33 | 3.85 | 0.17 | 3.93 | 0.12 | 3.87 | 0.12 | 3.91 | 0.12 | 3.69 | 0.12 | 2.38 | 0.39 | 3.47 | 0.18 | |
| 1350 | 2.38 | 0.19 | 3.88 | 0.09 | 3.85 | 0.10 | 3.79 | 0.18 | 3.40 | 0.20 | 3.41 | 0.57 | 3.04 | 0.30 | 3.11 | 0.45 | |
| 1450 | 2.98 | 0.11 | 3.72 | 0.18 | 3.98 | 0.11 | 3.91 | 0.20 | 3.94 | 0.32 | 3.54 | 0.36 | 3.66 | 0.36 | 3.35 | 0.11 | |
| Ventilator 1 | |||||||||
|---|---|---|---|---|---|---|---|---|---|
| Stage (Opening Level) | Storey | Average (Pa) | |||||||
| I | II | III | IV | ||||||
| AVG | SD | AVG | SD | AVG | SD | AVG | SD | ||
| P1/5 | 39.72 | 3,02 | 39.44 | 2.99 | 38.74 | 2.94 | 37.81 | 2.84 | 38.93 |
| P2/5 | 35.32 | 2.46 | 34.13 | 2.29 | 31.75 | 2.13 | 29.12 | 1.95 | 32.58 |
| P3/5 | 31.94 | 2.12 | 29.64 | 1.95 | 25.51 | 1.75 | 21.06 | 1.57 | 27.04 |
| P4/5 | 29.87 | 1.93 | 26.5 | 1.61 | 20.58 | 1.37 | 14.56 | 1.07 | 22.88 |
| P5/5 | 28.15 | 2.28 | 24.15 | 1.81 | 17.53 | 1.65 | 10.78 | 1.63 | 20.15 |
| Ventilator 2 | |||||||||
|---|---|---|---|---|---|---|---|---|---|
| Stage (Opening Level) | Story | Average [Pa] | |||||||
| I | II | III | IV | ||||||
| AVG | SD | AVG | SD | AVG | SD | AVG | SD | ||
| P1/5 | 28.81 | 3.87 | 28.18 | 3.77 | 27.68 | 3.67 | 27.09 | 3.52 | 27.94 |
| P2/5 | 26.83 | 3.41 | 25.59 | 3.22 | 23.72 | 2.94 | 21.67 | 2.62 | 24.45 |
| P3/5 | 25.88 | 2.81 | 23.69 | 2.56 | 20.37 | 2.23 | 16.83 | 1.88 | 21.69 |
| P4/5 | 25.29 | 3.05 | 22.25 | 2.69 | 17.53 | 2.23 | 12.64 | 1.8 | 19.43 |
| P5/5 | 22.81 | 2.39 | 19.24 | 2.11 | 14.28 | 1.92 | 9.19 | 1.98 | 16.38 |
| Volumetric Airflow Rate [m3/h] | ||||
|---|---|---|---|---|
| Stage (Opening Level) | Ventilator 1 | Ventilator 2 | ||
| AVG | SD | AVG | SD | |
| P1/5 | 4624.17 | 116.70 | 4884.66 | 190.20 |
| P2/5 | 8352.17 | 257.77 | 8929.08 | 411.81 |
| P3/5 | 11,142.00 | 418.48 | 12,149.28 | 596.15 |
| P4/5 | 12,854.76 | 566.21 | 14,548.14 | 611.63 |
| P5/5 | 14,020.92 | 702.19 | 15,656.33 | 838.66 |
References
- Kaczmarzyk, P.; Klapsa, W.; Janik, P.; Krawiec, P. Identification and Evaluation of Technical and Operational Parameters of Mobile Positive Pressure Ventilation Fans Used during Rescue Operations. Saf. Fire Technol. 2021, 58, 74–91. [Google Scholar] [CrossRef]
- Panindre, P.; Mousavi, N.S.; Kumar, S. Improvement of Positive Pressure Ventilation by optimizing stairwell door opening area. Fire Saf. J. 2017, 92, 195–198. [Google Scholar] [CrossRef]
- Kaczmarzyk, P.; Noske, R.; Janik, P.; Krawiec, P. Experimental Study of Flow Characteristics of Mobile Fans under Real Operating Conditions (Case Study). Saf. Fire Technol. 2022, 60, 104–117. [Google Scholar] [CrossRef]
- Lambert, K.; Merci, B. Experimental study on the use of positive pressure ventilation for fire service interventions in buildings with staircases. Fire Technol. 2014, 50, 1517–1534. [Google Scholar] [CrossRef]
- Kaczmarzyk, P.; Janik, P.; Krawiec, P.; Klapsa, W.; Noske, R. Measurement of air stream velocity profiles, generated by fire protection units mobile fans. J. Int. Sci. Publ. Ecol. Saf. 2022, 16, 42–50. [Google Scholar]
- Bamberger, K.; Carolus, T.; Belz, J.; Nelles, O. Development, validation, and application of an optimization scheme for impellers of centrifugal fans using computational fluid dynamics-trained metamodels. J. Turbomach. 2020, 142, 111005. [Google Scholar] [CrossRef]
- Brandstetter, C.; Pages, V.; Duquesne, P.; Paoletti, B.; Aubert, S.; Ottavy, X. Project PHARE-2—A high-speed UHBR fan test facility for a new open-test case. J. Turbomach. 2019, 141, 101004. [Google Scholar] [CrossRef]
- Chlebnikovas, A.; Selech, J.; Kilikevičius, A.; Przystupa, K.; Matijošius, J.; Vaišis, V. Modeling of two-phase flow parameters of a multi-channel cylindrical cyclone. Energies 2022, 15, 4690. [Google Scholar] [CrossRef]
- Szpica, D.; Mieczkowski, G.; Borawski, A.; Leisis, V.; Diliunas, S.; Pilkaite, T. The computational fluid dynamics (CFD) analysis of the pressure sensor used in pulse-operated low-pressure gas-phase solenoid valve measurements. Sensors 2021, 21, 8287. [Google Scholar] [CrossRef] [PubMed]
- Warguła, Ł.; Kaczmarzyk, P. Legal Regulations of Restrictions of Air Pollution Made by Mobile Positive Pressure Fans—The Case Study for Europe: A Review. Energies 2022, 15, 7672. [Google Scholar] [CrossRef]
- Kaczmarzyk, P.; Warguła, Ł.; Janik, P.; Krawiec, P. Influence of Measurement Methodologies for the Volumetric Air Flow Rate of Mobile Positive Pressure Fans on Drive Unit Performance. Energies 2022, 15, 3953. [Google Scholar] [CrossRef]
- PN-EN 5801:2017-12; Wentylatory—Badanie Właściwości Użytkowych z Zastosowaniem Stanowisk Znormalizowanych. Polski Komitet Normalizacyjny: Warsaw, Poland, 2017.
- ANSI/AMCA Standard 240-15; Laboratory Methods of Testing Positive Pressure Ventilators for Aerodynamic Performance Raing. ANSI: Washington, DC, USA, 2015.
- Krawiec, P.; Warguła, Ł.; Czarnecka-Komorowska, D.; Janik, P.; Dziechciarz, A.; Kaczmarzyk, P. Chemical compounds released by combustion of polymer composites flat belts. Sci. Rep. 2021, 11, 8269. [Google Scholar] [CrossRef] [PubMed]
- Rabajczyk, A.; Zielecka, M.; Małozięć, D. Hazards resulting from the burning wood impregnated with selected chemical compounds. Appl. Sci. 2020, 10, 6093. [Google Scholar] [CrossRef]
- Król, M. Numerical studies on the wind effects on natural smoke venting of atria. Int. J. Vent. 2016, 15, 67–78. [Google Scholar] [CrossRef]
- Qin, T.X.; Guo, Y.C.; Chan, C.K.; Lin, W.Y. Numerical investigation of smoke exhaust mechanism in a gymnasium under fire scenarios. Build. Environ. 2006, 41, 1203–1213. [Google Scholar] [CrossRef]
- Kaczmarzyk, P.; Janik, P.; Klapsa, W.; Bugaj, G. Possibilities of Using Mobile Fans and the Parameters Conditioning the Effectiveness of Tactical Mechanical Ventilation. Saf. Fire Technol. 2022, 59, 58–82. [Google Scholar] [CrossRef]
- Fritsche, M.; Epple, P.; Delgado, A. Development of a Measurement Method for the Classification and Performance Evaluation of Positive Pressure Ventilation (PPV) Fans. In Fluids Engineering Division Summer Meeting; American Society of Mechanical Engineers: New York, NY, USA, 2018; Volume 51579, p. V003T12A021. [Google Scholar]
- Cimolino, U.; Emrich, C.; Svensson, S. Taktische Ventilation: Be-und Entlüftungssysteme im Einsatz; Ecomed-Storck GmbH: Hamburg, Germany, 2012. [Google Scholar]
- ISO 5221:1984; Air Distribution and Air Diffusion—Rules to Methods of Measuring air Flow Rate in an Air Handling Duct. ISO: Geneva, Switzerland, 1984.
- Łapicz, M.; Makowski, R.; Jędrzejas, J. Increased effectiveness of firefighting during internal fires with the use of positive pressure attack. In MATEC Web of Conferences; EDP Sciences: Les Ulis, France, 2018; Volume 247, p. 00036. [Google Scholar]
- Kuti, R.; Zolyomi, G.; Kegyes-Brassai, O.K. Assessing the impact of positive pressure ventilation on the building fire–A case study. GEOMATE J. 2018, 15, 16–21. [Google Scholar] [CrossRef]
- Horová, K.; Jána, T.; Wald, F. Temperature heterogeneity during travelling fire on experimental building. Adv. Eng. Softw. 2013, 62, 119–130. [Google Scholar] [CrossRef]
- Kolev, Z.; Kadirova, S. Numerical Modelling of Heat Transfer in Convector’s Pipes by ABAQUS. IOP Conf. Ser. Mater. Sci. Eng. 2019, 595, 012006. [Google Scholar] [CrossRef]
- Kolev, Z.; Kadirova, S. Numerical Modeling of the Thermal Conduction Process in Water-Air Convector’s Fins. E3S Web Conf. 2020, 180, 01009. [Google Scholar] [CrossRef]
- Kreith, F. (Ed.) Fluid Mechanics; CRC Press: Boca Raton, FL, USA, 1999. [Google Scholar]


Disclaimer/Publisher’s Note: The statements, opinions and data contained in all publications are solely those of the individual author(s) and contributor(s) and not of MDPI and/or the editor(s). MDPI and/or the editor(s) disclaim responsibility for any injury to people or property resulting from any ideas, methods, instructions or products referred to in the content. |
© 2023 by the authors. Licensee MDPI, Basel, Switzerland. This article is an open access article distributed under the terms and conditions of the Creative Commons Attribution (CC BY) license (https://creativecommons.org/licenses/by/4.0/).
Share and Cite
Kaczmarzyk, P.; Janik, P.; Małozięć, D.; Klapsa, W.; Warguła, Ł. Experimental Studies of the Impact of the Geometric Dimensions of the Outlet Opening on the Effectiveness of Positive Pressure Ventilation in a Multi-Storey Building—Flow Characteristics. Appl. Sci. 2023, 13, 5714. https://doi.org/10.3390/app13095714
Kaczmarzyk P, Janik P, Małozięć D, Klapsa W, Warguła Ł. Experimental Studies of the Impact of the Geometric Dimensions of the Outlet Opening on the Effectiveness of Positive Pressure Ventilation in a Multi-Storey Building—Flow Characteristics. Applied Sciences. 2023; 13(9):5714. https://doi.org/10.3390/app13095714
Chicago/Turabian StyleKaczmarzyk, Piotr, Paweł Janik, Daniel Małozięć, Wojciech Klapsa, and Łukasz Warguła. 2023. "Experimental Studies of the Impact of the Geometric Dimensions of the Outlet Opening on the Effectiveness of Positive Pressure Ventilation in a Multi-Storey Building—Flow Characteristics" Applied Sciences 13, no. 9: 5714. https://doi.org/10.3390/app13095714
APA StyleKaczmarzyk, P., Janik, P., Małozięć, D., Klapsa, W., & Warguła, Ł. (2023). Experimental Studies of the Impact of the Geometric Dimensions of the Outlet Opening on the Effectiveness of Positive Pressure Ventilation in a Multi-Storey Building—Flow Characteristics. Applied Sciences, 13(9), 5714. https://doi.org/10.3390/app13095714