Abstract
The coastal zone area of Qionghai City is one of the important coastal zones in the South China Sea, and its water environment has been affected by human activities such as urbanization and industrialization. In order to protect the water resources and ecological environment of this area, the water chemistry characteristics of the main watersheds and their causes in the coastal zone area of eastern Hainan Island were investigated to provide a scientific basis for environmental protection and sustainable development. In this study, the characteristics and sources of water chemical ion components were analyzed using a Piper trilinear diagram, Gibbs diagram, and correlation analysis with the coastal zone area of Qionghai city as the research object. The results show the following: (1) the dominant cation of water chemistry in the coastal zone of Qionghai City is Na+ with a mean value of 35.001 mg·L−1, and the dominant anion is Cl− with a mean value of 30.69 mg·L−1; (2) the dominant cation content in the coastal zone of Qionghai City is Na+ > Ca2+ > Mg2+ > K+, and the dominant anion content is Cl− > SO42− > HCO3− > CO32−; (3) at the five collection sites in the study area, the ion concentrations showed different trends, with the highest ion concentration in the water samples collected from aquaculture ponds, and the main water chemistry type was Na-Cl; the lowest ion concentration was in the water samples collected from the rivers, and the main type of water chemistry was Ca·Mg-HCO3. The source of water chemistry ions in the study area mainly included seawater, rock weathering, atmospheric precipitation, and evaporation concentration. The results of this study can provide a scientific basis for the development, utilization, and management of local water resources and provide basic data for environmental protection and sustainable development.
1. Introduction
In recent years, water quality studies for the coastal zone area of Qionghai City have gradually increased, including the monitoring and analysis of seawater, river water, lake water, and other water bodies. Some bays and estuaries in the region have water pollution problems, mainly from agricultural, industrial, and urban sewage sources. Water chemistry plays an important role in ecological environmental protection, water resource utilization, water pollution control, and water safety assurance. The water chemistry of watersheds can reflect the effects of rock weathering, atmospheric deposition, and human activities in the watershed [1]. By analyzing the characteristics and spatial and temporal changes in river water chemistry, the basic processes that proceed from water chemistry component formation could be effectively discerned [2]. In addition, the analysis of the water chemistry characteristics of coastal zone water bodies is a very critical part of the evaluation of the quality of water resources in the basin, which has non-negligible value for the scientific development and natural protection of water resources in the basin [3]. The water chemistry composition characteristics of watershed water bodies are mainly influenced by physical geography [4]; however, more and more studies show that the water chemistry composition of watershed waters is also influenced by human activities and has become an important issue affecting human survival and social development [4,5,6].
For the above-mentioned studies, many results have been achieved both in China and abroad, and research methods tend to be diversified [7,8]. Since the middle of the 20th century, a large amount of theoretical knowledge and a great number of technical means have been used to study the characteristics and evolution of the chemistry in both surface water and groundwater. Among them, there are many mathematical methods to deal with water quality data, generally including cluster analysis, principal component analysis, correlation analysis, factor analysis, etc. [9,10]. Based on the analysis of water quality data and the further use of piper trilinear plots [11], Gibbs [12], the water quality simulation method, the isotope analysis method [13,14], etc., investigations into the ion chemical characteristics of rivers and the influence of major weathering processes in watersheds have been undertaken [15]. Following this, the GIS visualization function appeared as a clear display of water quality results [16]. Gibbs’ analysis of the water chemistry components of various global water bodies (precipitation, seawater, lakes, and rivers) suggests that rock weathering, atmospheric precipitation input, and evapotranspiration–crystallization are the three major controlling factors of global surface water chemistry components [12]. Kattan’s analysis of the water chemistry of the Euphrates River in Syria showed that the ionic fraction in the river was influenced by the dissolution of rock weathering, water temperature, and evaporation [17]. Different study areas were located in different environmental contexts, including a variety of factors such as geological formations, climate, and human activities. These factors affect the ion concentrations and chemical composition of water bodies, resulting in significant differences in the water chemistry characteristics of different regions. Therefore, when conducting water resources management and environmental protection, the influence of these factors needs to be fully considered when developing management measures that are appropriate for the region [18,19,20].
Qionghai City, located on the east coast of Hainan Island, is a coastal city with rich coastal ecological resources. The quality of the water environment in the area is important for maintaining the local ecological environment and developing tourism [21]. Water chemistry is the study of the distribution, transformation, and transport patterns of substances such as dissolved inorganic compounds, organic matter, and biological elements in water bodies and their impact on the ecological environment.
Therefore, what type of water chemistry is found in Qionghai City? Additionally, what are the sources of water chemistry ions? In this paper, the main water chemistry indicators, including the total dissolved solids (TDS), pH value, and anion and cation concentration, are analyzed to reveal the chemical composition of the area’s water bodies, aiming to provide a scientific basis for environmental protection and sustainable development in the region.
2. Materials and Methods
2.1. Study Area Overview
Qionghai City is located in the center of the eastern Hainan Province [22], located at 110°07′~110°41′ E, 18°59′~19°29′ N, east of the South China Sea, west of Tunchang County and Qiongzhong County, north of Dingan County and Wenchang City, and south of Wanning City, with a total area of 1692 km2. Qionghai City belongs to the tropical monsoon and marine humid climate zone, which is greatly influenced by monsoons, abundant light, high temperatures, rain, frequent typhoons, four indistinct seasons, and distinct dry and rainy seasons. The average annual rainfall is 2072 mm, the average annual sunshine is 2155 h, the average annual temperature is 24 °C, and there is no frost and snow all year round. There are many rivers in this territory, abundant water resources, and the total water resources of Qionghai City reach 2.216 billion m3, ranking third in Hainan Province, with available water resources at 8.40 million m3 (37.9% of the total water resources). In 2020, the regional GDP reached CNY 112.98 billion, an increase of 3.1% year on year. At the same time, Qionghai City completed the preliminary results of the “Qionghai City Coastal Zone Protection and Utilization Comprehensive Plan”, which aimed to strengthen the protection of environmental resources and the development and utilization management of the coastal zone.
2.2. Sample Collection and Determination
The water quality of civil wells, reservoirs, aquaculture ponds, rivers, and canals is a key area for water quality in Qionghai City. The specificity of Qionghai City needs to be considered in order to consider the evolution of water chemistry in the coastal zone area of Qionghai City in an integrated way. A total of 177 samples were collected from civil wells, reservoirs, aquaculture ponds, rivers, and canals in Qionghai between May and June 2022. A total of 5 samples were sent for testing, and the distribution of the sampling sites is shown in Figure 1. Water samples were generally collected below 10 cm from the water surface and then filtered through a 0.45 μm filter membrane, and those for cation (Ca2+, Mg+, K+, and Na+) analysis were acidified with nitric acid at a pH < 2, and those for anion analysis (Cl−, CO32−, HCO3−, and SO42, the anion samples (Cl−, CO32−, HCO3−, and SO42−)) were not added with the reagents; the samples were sealed with paraffin and stored away from light. The samples were sent to the laboratory of the China Geological Survey Haikou Marine Geological Survey Center for the determination of K+ and Na+ by flame emission spectrometry, Ca2+ and Mg2+ by disodium ethylenediaminetetraacetate titration, Cl− and SO42− by ion chromatography, and HCO3− and CO32− by the hydrochloric acid volumetric method. The test results met the quality requirements.
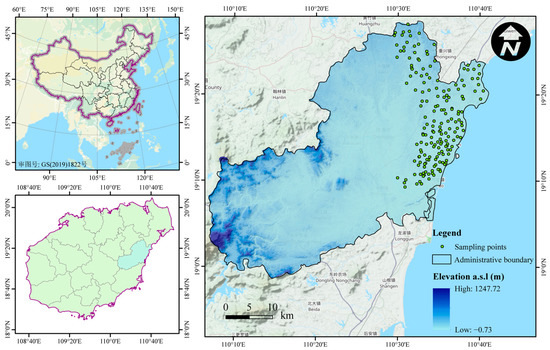
Figure 1.
Schematic diagram of the distribution of sampling points of water bodies along Qionghai’s coasts.
2.3. Analytical Methods and Quality Assurance
In this paper, the water chemistry data were counted by Excel and mathematical statistics, Pearson correlation analysis, Piper’s trilinear diagram, and Gibbs diagram were used to analyze the water chemistry characteristics and control factors in combination with hydrogeological conditions in the study area. Among them, Piper trilinear plots and Gibbs plots were developed using Origin 2020, and inter-ion correlations were analyzed using SPSS 22 statistics.
The Pearson correlation coefficient, also known as the product difference correlation coefficient, is a statistical indicator that expresses the degree and direction of linear correlation between the two variables. The correlation coefficient of a sample is denoted by the symbol r and is calculated by the following formula [23,24]:
where denotes the off-average sum of squares for X; denotes the off-average sum of squares for Y; denotes the off-average sum of squares for X and Y; Pearson’s correlation coefficient is a dimensionless statistical indicator with a range of −1 ≤ r ≤ 1. A correlation coefficient less than 0 is a negative correlation, greater than 0 is a positive correlation, and equal to 0 indicates no correlation.
The larger the absolute value of the correlation coefficient, the closer the correlation between the two variables. To determine whether there is a linear relationship, the researcher needs to look at the scatter plot of the two variables; if the scatter plot is roughly a straight line, it indicates a linear relationship, and if it is not a straight line, there is no linear relationship.
The cluster analysis K-means algorithm, also known as the K-means clustering algorithm, is a widely used clustering algorithm that is the basis for other clustering algorithms [25,26]. Assuming that the input samples are S = X1, X2, ···, Xm, the algorithm steps are as follows: (1) select the initial k category centers μ1, μ2, … μk; (2) for each sample Xi, mark it as the closest category to the category center (distance can be calculated using Euclidean distance); (3) update each category center to the mean of all samples belonging to that category; (4) repeat the last two steps until the centroid is unchanged or a predetermined number of iterations is reached, and the algorithm terminates.
The objective function of the K-means algorithm is the within-cluster sum of squared errors (SSE), also known as cluster inertia.
where if belongs to cluster j. Otherwise, it is 0.
3. Results
3.1. Basic Physical and Chemical Properties of Water Bodies
The minimum, maximum, mean, and standard deviation of each indicator of the analyzed water samples in terms of the results are shown in Table 1. The content of the dominant cations in the water in the study area showed Na+ > Ca2+ > Mg2+ > K+ and the average concentration of the dominant cation Na+ was 34.432 mg·L−1. The dominant anion content showed Cl− > SO42− > HCO3− > CO32−, and the average concentrations of the dominant anions Cl−, SO42−, and HCO3− were 30.69 mg·L−1, 18.49 mg·L−1, and 15.40 mg·L−1, respectively. The mean equivalent concentration of Cl− accounted for 46% of the total anions, and the mean equivalent concentration of SO42− accounted for 28% of the total anions. The coefficient of variation could characterize the stability of ionic components, and the larger the coefficient of variation, the more susceptible the ionic component was to the influence of the external environment.

Table 1.
Analysis results of major ion components in the Qionghai coastal basin.
3.2. Spatial Variation Characteristics of Major Ion Components
The trend of all types of ion concentrations is given in Figure 2. The trend of all ion concentrations is the trend of water chemical ions. Figure 2 shows the temporal trends of the water chemical ion fraction content in the coastal zone area of Qionghai City, and it was found that the overall trend showed the ion concentration to gradually decrease. The trends of different ions also showed their different characteristics, and ion concentrations were affected by many disturbing factors due to the different environments and conditions in which different collection sites were located.
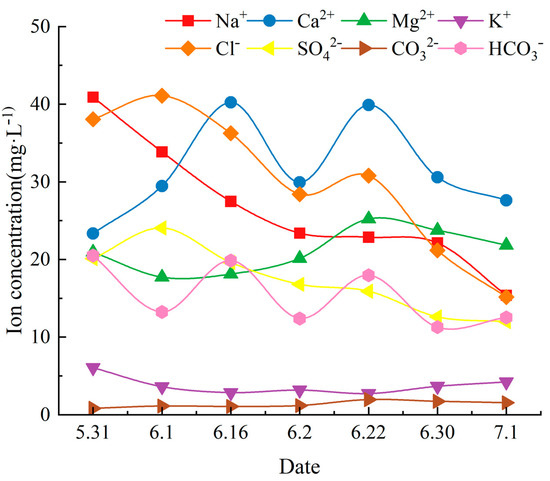
Figure 2.
Spatial variation characteristics of water chemical ion component content in Qionghai coastal water.
The spatial distribution map shows (Figure 3) that the ionic concentration content of the cation Na+ was higher at 40.90 mg·L−1, while the anion Cl− had the highest ionic concentration content of 41.10 mg·L−1. Among the selected collection sites, the water column ion concentration was highest in the aquaculture ponds and lowest in the rivers. In general, the trend of ion concentration was the result of the combined influence of many factors.
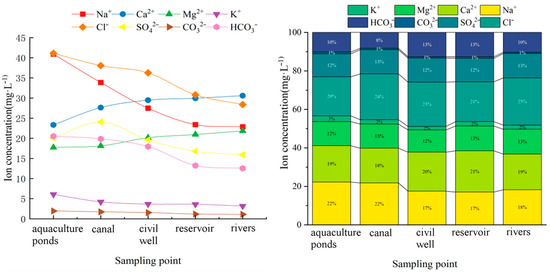
Figure 3.
Spatially variable characteristics of the average concentration of major ions on the Wanning coast.
Through the mathematical and statistical analysis of the water chemistry indexes of water bodies in the coastal zone of Qionghai City, we could obtain a preliminary understanding of the enrichment degree and the changing pattern of the water chemistry of water bodies in the study area [27]. Figure 4 shows that the average pH value of water bodies in the area was 6.93, with a coefficient of variation of 14%. In addition, the concentration of total dissolved substance (TDS) values showed a gradual decrease and varied between 12 and 852 mg·L−1, with an average value of 203.6 mg·L−1.
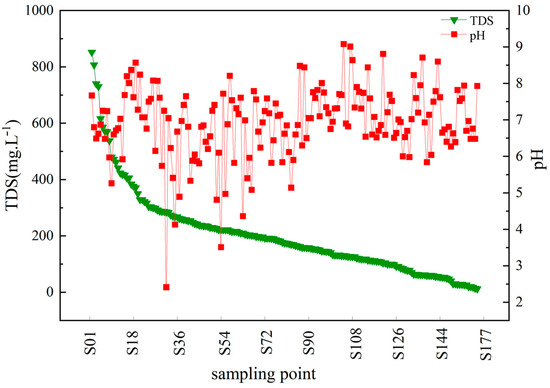
Figure 4.
Trends of chemical TDS and pH in Qionghai coastal water (TDS: total dissolved solids; pH: Pondus Hydrogenii).
3.3. Water Chemistry Type
The Piper trilinear diagram is a graphical method used to describe the chemical components of water. By analyzing the distribution and combination type of ion content in the Piper trilinear map, the water chemistry type and water quality characteristics of the surface water could be reflected [28,29]. The Piper trilinear diagram of the major ions in the surface water of the coastal zone area of Qionghai City is shown in Figure 5. From the figure, the main water chemistry type of surface water in the aquaculture ponds was the Na-Cl type, which accounted for the largest proportion; this was followed by the Ca-Mg-Cl type water, while the SO4 type water accounted for a smaller proportion. The main water chemistry type of the canal was the Na−Ca−Cl type, the main water chemistry type of the civil well was the Ca·Mg-Cl type, the main water chemistry type of the reservoir was the Ca-Mg-SO4 type, and the main water chemistry type of the river was the Ca·Mg-HCO3 type. The surface water in the area of the aquaculture ponds was mainly influenced by seawater, which had a high content of Na and Cl, while the content of other ions was relatively low, so the ion content in the surface water could also be dominated by Na+ and Cl−. In addition, the high content of Na also reflected the high salinity of groundwater in the area, and there could be some degree of seawater intrusion. Finally, we also drew an ilr-ion plot (Figure 5f) of all five types [30].
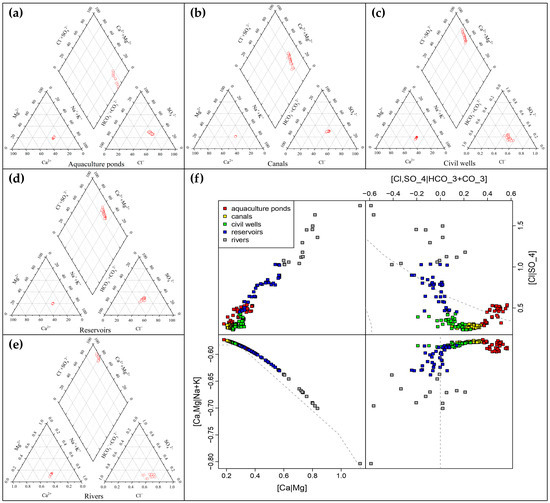
Figure 5.
Major ions of water chemistry in Qionghai: (a) Piper trilinear diagram of the aquaculture ponds; (b) Piper trilinear diagram of the canals; (c) Piper trilinear diagram of the civil wells; (d) Piper trilinear diagram of the reservoirs; (e) Piper trilinear diagram of the civil rivers; (f) Ilr-ion plot of all 5 types.
3.4. Analysis of Major Ion Sources and Control Factors
The Gibbs diagram is a graphical method that can describe the source of water chemical components. By analyzing the distribution of each ion in the Gibbs diagram, it is possible to qualitatively determine the influence of factors such as atmospheric rainfall, rock weathering, and evaporation concentration on the source of ions in the surface water [31]. In the Gibbs plot of the coastal zone area of Qionghai City (Figure 6), it can be seen that the cation Na+/(Na+ + Ca2+) was mainly between 8% and 60%, and the anion Cl−/(Cl− + HCO3−) was mainly between 9% and 50%. This indicates that the main sources of ions in surface water in the region are atmospheric precipitation and seawater, while the contribution of rock weathering is small. In this region, the influence of seawater was high, so the proportion of Na+/(Na+ + Ca2+) was relatively high, while the influence of evaporation concentration was relatively small, so the proportion of Cl−/(Cl− + HCO3−) was also not high.
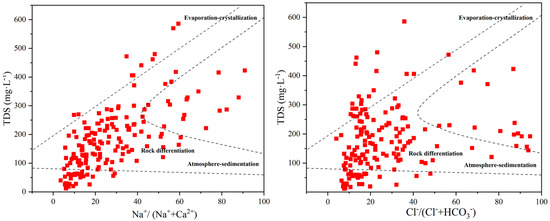
Figure 6.
Qionghai Coastal Water Quality Gibbs Chart.
According to the results of the Pearson correlation coefficient analysis in Table 2, it can be seen that there was a significant correlation (p < 0.05) between TDS and Na+, Ca2+, Cl−, and SO42− in the surface water of the coastal zone of Qionghai City, indicating that there is a significant linear relationship between the content of these ions in surface water and the content of the total dissolved solids (TDS). Thus, both Na+ and Cl− are major contributors of ions to the water of this region. In addition, there was a significant correlation between Na+ and Cl−, suggesting that these two ions have the same source and may be influenced by seawater. In addition, Table 2 showed a significance of 0.14 between Ca2+ and HCO3−, probably because Ca2+ was derived from rock weathering processes, while HCO3− was mainly derived from atmospheric precipitation and evaporative concentration. It can be further speculated that the sources of surface water ions in the coastal zone of Qionghai City are mainly seawater, rock weathering, atmospheric precipitation, and evaporation concentration, and other factors [32,33,34,35,36].

Table 2.
Correlations between conventional indicators.
4. Discussion
This study provides an in-depth analysis of the water chemistry characteristics of the main watersheds in the coastal zone area of Qionghai City and their causes. Using Piper’s trilinear diagram, Gibbs diagram, and correlation analysis, this study drew significant conclusions about the water chemistry characteristics and sources in this region. The results show that the characteristics of water chemistry ion fractions in this region were similar to many other coastal zone regions.
Firstly, the dominant cation was Na+, and the dominant anion was Cl−, which is consistent with the characteristics of being located in the coastal zone area. Secondly, the content of dominant cations showed Na+ > Ca2+ > Mg2+ > K+, while the content of dominant anions was Cl− > SO42− > HCO3− > CO32−, and these results indicate that the influence of seawater was very significant in this region. In addition, the ion concentrations showed different trends in the water samples from different collection points, mainly because of the different sources of water and environmental factors.
For example, the highest ion concentration in the water samples collected from the farming ponds, and the main water chemistry type, was Na−Cl, which might be related to the development of the surrounding farming industry, seawater backflow, and other factors. Therefore, measures must be taken to limit the scale of the farming industry and reduce the phenomenon of seawater backflow to reduce the risk of water pollution. On the contrary, the water samples collected in the river had the lowest ion concentration and the main water chemistry type was the Ca·Mg-HCO3 type; this is because water bodies in the area may be affected by factors such as rock weathering and atmospheric precipitation.
Yang et al. [37] studied the water chemistry characteristics of the southwest coastal zone area of Hainan Province and found that Na+ and Cl− were the main water chemistry ions and that water bodies in the area were influenced by human activities, with agricultural activities contributing more to NO3− and SO42− ions in the water bodies. In addition, Xi et al. [38] studied the water chemistry of groundwater in the east coastal zone area of Hainan Island and found that Ca2+ and Mg2+ were the main cations, HCO3− and Cl− were the main anions, and the water chemistry of the area was influenced by different hydrogeological conditions and human activities. These findings are consistent with the results of this paper.
The results of this study also indicate that the sources of water chemical ions in the region resulted from various factors such as seawater, rock weathering, atmospheric precipitation, and evapotranspiration concentration effects. This conclusion provides a scientific basis for the development, utilization, and management of local water resources, which could help to protect water resources and the ecological environment of the region and promote the sustainable development of the area.
However, due to the limited scope of this study, other possible factors were not explored in depth. Our future study will further expand this topic, collecting more water quality samples in Qionghai to explore the details and characteristics and possible spatial and temporal variability of the sources of water chemistry ions in the region.
5. Conclusions
Based on the analysis of the chemical composition of surface water in the coastal areas of Qionghai, this study found significant variations in the ion concentrations and chemical types among different sampling sites. The dominant cations followed the order of Na+ > Ca2+ > Mg2+ > K+, while the dominant anions were Cl− > SO42− > HCO3− > CO32−. Specifically, the water chemistry in aquaculture farms was dominated by the Na−Cl type, while the main chemical types in canals, wells, reservoirs, and rivers were Na·Ca-Cl, Ca·Mg-Cl, Ca-Mg-SO4, and Ca·Mg−HCO3, respectively.
Furthermore, significant correlations were observed between TDS and the major ions Na+, Ca2+, Cl−, SO42−, and HCO3−, indicating their contribution to the overall water chemistry of the region. The correlation between Na+ and Cl− suggests that they have a common source that is possibly influenced by seawater. Additionally, the correlation between Ca2+ and HCO3− may be related to different geological processes. Human activities and natural factors can influence water chemistry characteristics, as demonstrated in the coastal areas of Qionghai. Thus, long-term monitoring is needed in future studies to ensure the protection of natural water quality. Moreover, surface water and groundwater are often closely related, and further research is required to investigate their interactions in the coastal areas of Qionghai.
Author Contributions
Conceptualization, J.J. and X.G.; data curation, G.F.; methodology, P.J.; project administration, J.J. and Z.C.; resources, Z.C.; software, Y.F.; supervision, X.G. and C.S.; validation, J.J. and C.S.; writing—original draft, J.J. and G.F.; writing—review and editing, J.J. and X.G. All authors have read and agreed to the published version of the manuscript.
Funding
This research was funded by the Comprehensive Survey of Natural Resources in Haichengwen Coastal Zone: DD20230414, and the Natural Science Foundation of Jiangxi, China, grant number 20224BAB203034.
Institutional Review Board Statement
Not applicable.
Informed Consent Statement
Not applicable.
Data Availability Statement
Publicly available datasets were analyzed in this study. These data can be found here: https://www.gscloud.cn (accessed on 28 February 2023). The data are not publicly available as the project is not yet completed.
Acknowledgments
This study used data sampled from field experiments, which were obtained and provided to us by Chunwu Cao. The format of the manuscript was revised by Yanwei Song. The graphical production (visualization) of the manuscript was carried out by Yang Wang. Zhiguo Chen also provided some corrections to the manuscript. We would like to express our gratitude to them. Likewise, we are grateful to the editors and reviewers who revised the manuscript for processing.
Conflicts of Interest
The authors declare no conflict of interest.
References
- Heydarizad, M.; Gimeno, L.; Amiri, S.; Minaei, M.; Mohammadabadi, H.G. A Comprehensive Overview of the Hydrochemical Characteristics of Precipitation across the Middle East. Water 2022, 14, 2657. [Google Scholar] [CrossRef]
- Zhang, Z. The Study of Hydrochemical Characteristicsand lon Sources of Precipitation and Riverwater in Mountainous Areas in the UpperReaches of the Shiyang River. Master’s Thesis, Northwest Normal University, Lanzhou, China, 2021. [Google Scholar]
- Huang, Q.B.; Qin, X.Q.; Liu, P.Y.; Lan, F.N.; Zhang, L.K.; Su, C.T. Major lonic Features and Their Controlling Factors in the Upper-Middle Reaches of Wujiang River. Environ. Sci. 2016, 37, 1779–1787. [Google Scholar] [CrossRef]
- Wang, M.; Yang, L.; Li, J.; Liang, Q. Hydrochemical Characteristics and Controlling Factors of Surface Water in Upper Nujiang River, Qinghai-Tibet Plateau. Minerals 2022, 12, 490. [Google Scholar] [CrossRef]
- Guo, Y.W.; Tian, F.Q.; Hu, H.C.; Liu, Y.P.; Zhao, S.H. Characteristics and Significance of Stable lsotopes and Hydrochemistry inSurface Water and Groundwater in Nanxiaohegou Basin. Environ. Sci. 2020, 41, 682–690. [Google Scholar] [CrossRef]
- Shen, B.B.; Wu, J.L.; Zhan, S.; Jin, M.; Saparov, A.S.; Abuduwaili, J. Spatial variations and controls on the hydrochemistry of surface waters across the Ili-Balkhash Basin, arid Central Asia. J. Hydrol. 2021, 600, 126565. [Google Scholar] [CrossRef]
- Lima, V.P.; de Lima, R.A.F.; Joner, F.; Siddique, I.; Raes, N.; Ter Steege, H. Climate change threatens native potential agroforestry plant species in Brazil. Sci. Rep. 2022, 12, 2267. [Google Scholar] [CrossRef]
- Ye, H.; Gan, J.; Li, G.; Hu, J.; Su, L.; Wu, J.; Wang, S. Temporal and Spatial Distributions and Controlling Factors of Hydrochemistry at WuyishanNational Park Water Body. Fujan J. Agric. Sci. 2022, 37, 1362–1370. [Google Scholar] [CrossRef]
- Zhang, J.; Zhu, B. Hydrochemical characteristics and influencing factors in Northern Xinjiang: Research progress and overview. Geogr. Res. 2022, 41, 1437–1458. [Google Scholar]
- Jiang, L.G.; Yao, Z.J.; Liu, Z.F.; Wang, R.; Wu, S.S. Hydrochemistry and its controlling factors of rivers in the source region of the Yangtze River on the Tibetan Plateau. J. Geochem. Explor. 2015, 155, 76–83. [Google Scholar] [CrossRef]
- Mahloch, J.L. Graphical interpretation of water quality data. Water Air Soil Pollut. 1974, 3, 217–236. [Google Scholar] [CrossRef]
- Gibbs, R.J. Mechanisms Controlling World Water Chemistry. Science 1970, 170, 1088–1090. [Google Scholar] [CrossRef]
- Jia, Y.F.; Guo, H.M.; Xi, B.D.; Jiang, Y.H.; Zhang, Z.; Yuan, R.X.; Yi, W.X.; Xue, X.L. Sources of groundwater salinity and potential impact on arsenic mobility in the western Hetao Basin, Inner Mongolia. Sci. Total Environ. 2017, 601, 691–702. [Google Scholar] [CrossRef] [PubMed]
- Liu, F.; Wang, S.; Wang, L.S.; Shi, L.M.; Song, X.F.; Yeh, T.C.J.; Zhen, P.N. Coupling hydrochemistry and stable isotopes to identify the major factors affecting groundwater geochemical evolution in the Heilongdong Spring Basin, North China. J. Geochem. Explor. 2019, 205, 106352. [Google Scholar] [CrossRef]
- Zou, J.; Liu, F.; Zhang, K. Hydrochemical characteristics and formation mechanism of shallow groundwater in typicawater-receiving areas of the South-to-North Water Diversion Project. China Environ. Sci. 2022, 42, 2260–2268. [Google Scholar] [CrossRef]
- Xiaobo, L.; Hng, L.; Baoping, Y.; Xincun, Z. Hydrochemical characteristics and formation mechanism of water source area in Jiuxian County, Tai’an City. J. Environ. Eng. Technol. 2023, 15, 1–13. [Google Scholar]
- Kattan, Z. Chemical and isotopic characteristics of the Euphrates River water, Syria: Factors controlling its geochemistry. Environ. Earth Sci. 2015, 73, 4763–4778. [Google Scholar] [CrossRef]
- Okosa, I.; Ndukwu, M.C.; Horsfall, I.T.; Igbojionu, D.O. The combined effect of water management and environmental control on the planting of two varieties of garden egg in a partially shaded greenhouse: An energy and yield indicator analysis. Energy Nexus 2022, 7, 100132. [Google Scholar] [CrossRef]
- Papas, M. Supporting Sustainable Water Management: Insights from Australia’s Reform Journey and Future Directions for the Murray–Darling Basin. Water 2018, 10, 1649. [Google Scholar] [CrossRef]
- Zhang, P.; Cui, X.; Gao, Y.; Mo, J.; Chen, D. Research on Water Environment Situation and Regulation Progress of Urban Lakes. IOP Conf. Ser. Earth Environ. Sci. 2021, 826, 012020. [Google Scholar]
- Xiumei, H. Study on Coupling Development of RuralTourism and Local Urbanization in Oionghai. Master’s Thesis, Fujian Normal University, Fujian, China, 2017. [Google Scholar]
- Cheng, Y.; Zhai, M.; Wang, Y.; Zhang, J. Development Model and Driving Forces of New Urbanization in Hainan Province: Qionghai City as a Case. Sci. Geogr. Sin. 2019, 39, 1902–1909. [Google Scholar] [CrossRef]
- Li, Z.; Yang, Y.; Li, L.; Wang, D. A weighted Pearson correlation coefficient based multi-fault comprehensive diagnosis for battery circuits. J. Energy Storage 2023, 60, 106584. [Google Scholar] [CrossRef]
- Pawan; Rohtash, D. Electroencephalogram channel selection based on pearson correlation coefficient for motor imagery-brain-computer interface. Meas. Sens. 2023, 25, 100616. [Google Scholar] [CrossRef]
- Li, X.; Meng, X.; Ji, X.; Zhou, J.; Pan, C.; Gao, N. Zoning technology for the management of ecological and clean small-watersheds via k-means clustering and entropy-weighted TOPSIS: A case study in Beijing. J. Clean. Prod. 2023, 397, 136449. [Google Scholar] [CrossRef]
- Izzati, M.T.N.; Aini, A.M.N.; Shahnorbanun, S. Identification of Student Behavioral Patterns in Higher Education Using K-Means Clustering and Support Vector Machine. Appl. Sci. 2023, 13, 3267. [Google Scholar]
- Guo, X.; Wang, X.; Shi, X.; Yu, H.; Huirong, Z.; Fang, Z. Hydrochemical characteristics and sources of chemical constituents in groundwater in Hunchun River Basin, Northeast China. Arab. J. Geosci. 2022, 15, 694. [Google Scholar] [CrossRef]
- Wei, H.; Wu, J.K.; Shen, Y.P.; Zhang, W.; Liu, S.W.; Zhou, J.X. Hydrochemical Characteristics of Snow Meltwater and River Water During Snow-meltinoPeriod in the Headwaters of the Ertis River, Xinjiang. Environ. Sci. 2016, 37, 1345–1352. [Google Scholar] [CrossRef]
- Liu, F.; Li, Z.; Hao, J.; Liang, P.; Wang, F.; Zhang, H. Study on the hydrochemical and stable isotope characteristics at theheadwaters of the Irtysh River in spring. Arid. Land Geogr. 2020, 42, 234–242. [Google Scholar]
- Shelton, J.L.; Engle, M.A.; Buccianti, A.; Blondes, M.S. The isometric log-ratio (ilr)-ion plot: A proposed alternative to the Piper diagram. J. Geochem. Explor. 2018, 190, 130–141. [Google Scholar] [CrossRef]
- Wen, Y.; Qiu, J.; Cheng, S.; Xu, C.; Gao, X. Hydrochemical Evolution Mechanisms of Shallow Groundwater and Its Quality Assessment in the Estuarine Coastal Zone: A Case Study of Qidong, China. Int. J. Environ. Res. Public Health 2020, 17, 3382. [Google Scholar] [CrossRef]
- Zhang, Y.; Xu, M.; Li, X.; Qi, J.; Zhang, Q.; Guo, J.; Yu, L.; Zhao, R. Hydrochemical Characteristics and Multivariate Statistical Analysis of Natural Water System: A Case Study in Kangding County, Southwestern China. Water 2018, 10, 80. [Google Scholar] [CrossRef]
- Xiao, J.; Jin, Z.; Zhang, F. Geochemical controls on fluoride concentrations in natural waters from the middle Loess Plateau, China. J. Geochem. Explor. 2015, 159, 252–261. [Google Scholar] [CrossRef]
- Cui, Y.H.; Wang, J.; Liu, Y.C.; Hao, S.; Gao, X. Hydro-chemical Characteristics and lon Origin Analysis of Surface Groundwater at the ShengjinLake and Yangtze River Interface. Environ. Sci. 2021, 42, 3223–3231. [Google Scholar] [CrossRef]
- Yongjun, Z.; Yuhui, Y.; Yicheng, H.; Xiancheng, F.; Jingyan, Y. Temporal and spatial variation characteristics of Hydrochemistry and irrigation adaptabilityevaluation in Kashi River Basin, Xinjiang. Arid. Land Geogr. 2022, 13, 1–15. [Google Scholar]
- An, S.K.; Jiang, C.L.; Zhang, W.X.; Chen, X.; Zheng, L.G. Influencing factors of the hydrochemical characteristics of surface water and shallow groundwater in the subsidence area of the Huainan Coalfield. Arab. J. Geosci. 2020, 13, 191. [Google Scholar] [CrossRef]
- Yang, K.; Liu, W.-Q.; Xu, X.-Y.; Chen, G.-Q.; Liu, Y.-J.; Fu, T.-F.; Wang, C.-J.; Fu, Y.-X. Evaluation of seawater intrusion in typical coastal zones of Hainan Province. Mar. Sci. 2019, 43, 57–63. [Google Scholar]
- Xi, L.; Chen, K.; Huang, X.; Gan, H.; Xia, Z.; Tan, X. Hydrogeochemistry and origin of groundwater in the south coast of Hainan. Geol. Bull. China 2021, 40, 350–363. [Google Scholar]
Disclaimer/Publisher’s Note: The statements, opinions and data contained in all publications are solely those of the individual author(s) and contributor(s) and not of MDPI and/or the editor(s). MDPI and/or the editor(s) disclaim responsibility for any injury to people or property resulting from any ideas, methods, instructions or products referred to in the content. |
© 2023 by the authors. Licensee MDPI, Basel, Switzerland. This article is an open access article distributed under the terms and conditions of the Creative Commons Attribution (CC BY) license (https://creativecommons.org/licenses/by/4.0/).