
Thermal Deformation Stability Optimization Design and Experiment of the Satellite Bus to Control the Laser Communication Load’s Acquisition Time

Abstract
:1. Introduction
2. The Impact of Satellite Bus Thermal Deformation on the Laser Communication Load Acquisition Time
3. Control of Thermal Deformation Optimization Strategy
3.1. Orbital Temperature Distribution
3.1.1. Heat Dissipation Surface Analysis
3.1.2. Analysis of Temperature Distribution
3.2. Thermal Deformation of Satellite Bus
3.3. Multi-Objective Optimization Design
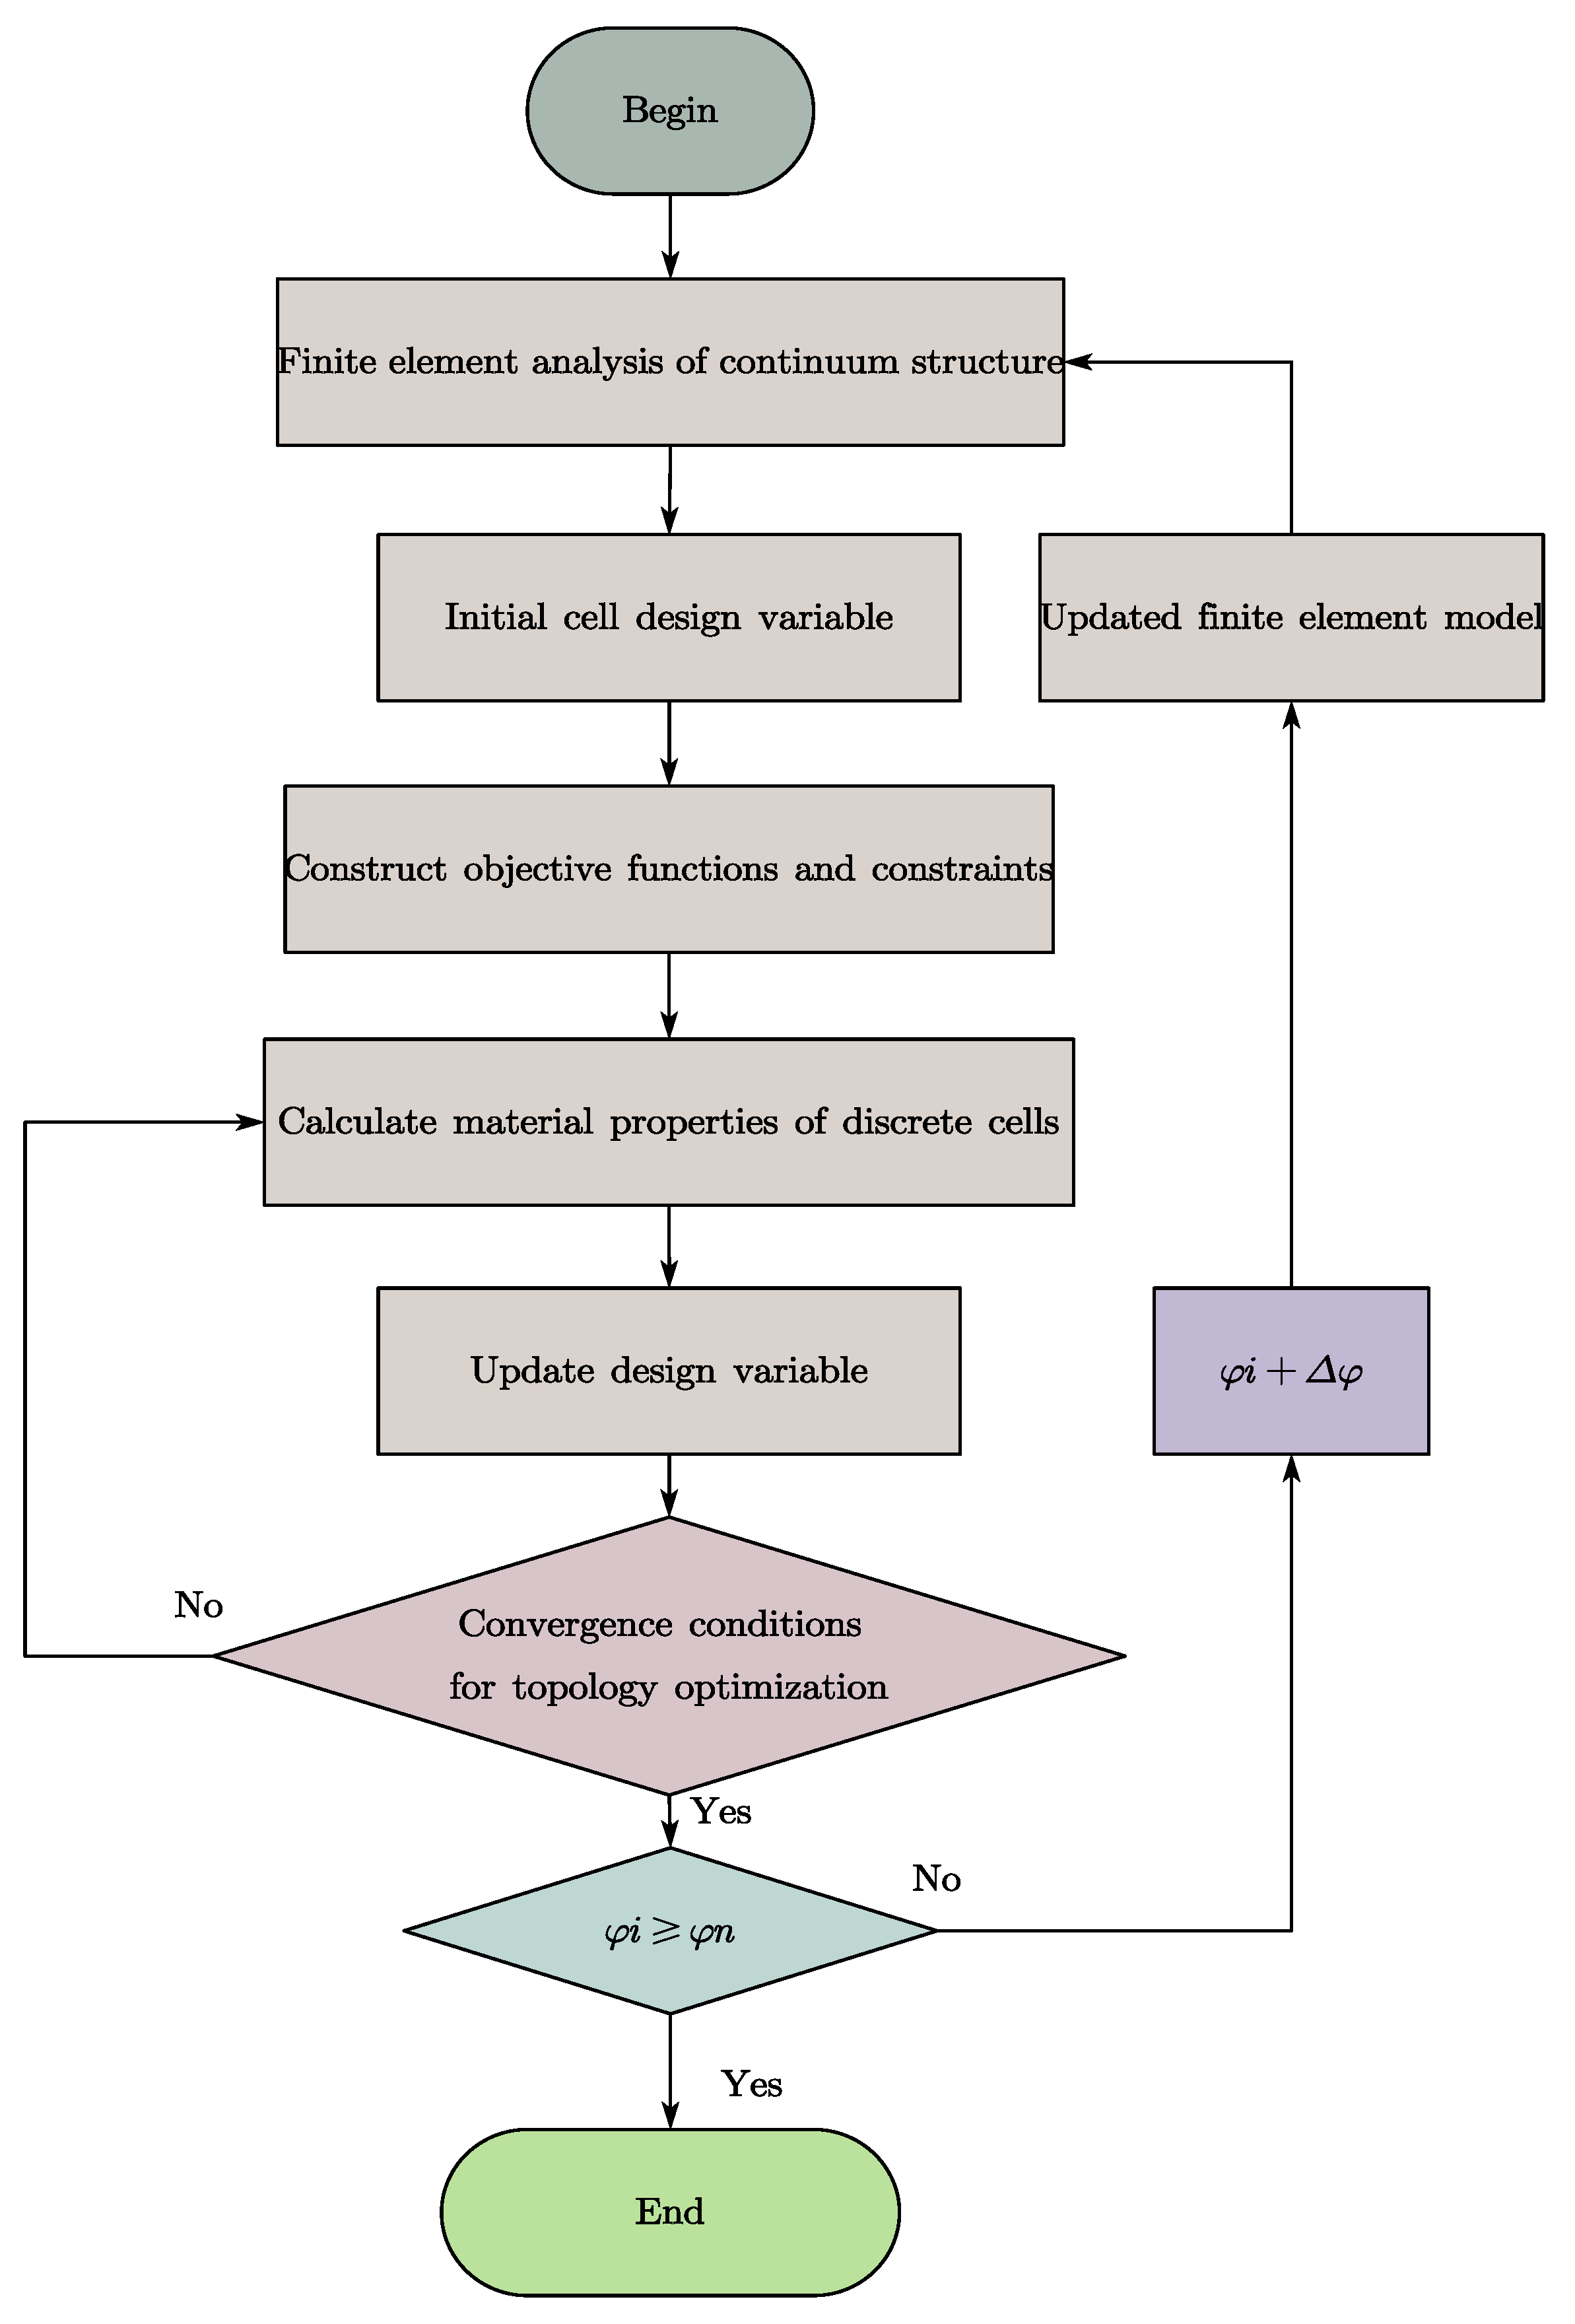
3.3.1. The Overall Optimized Design Idea
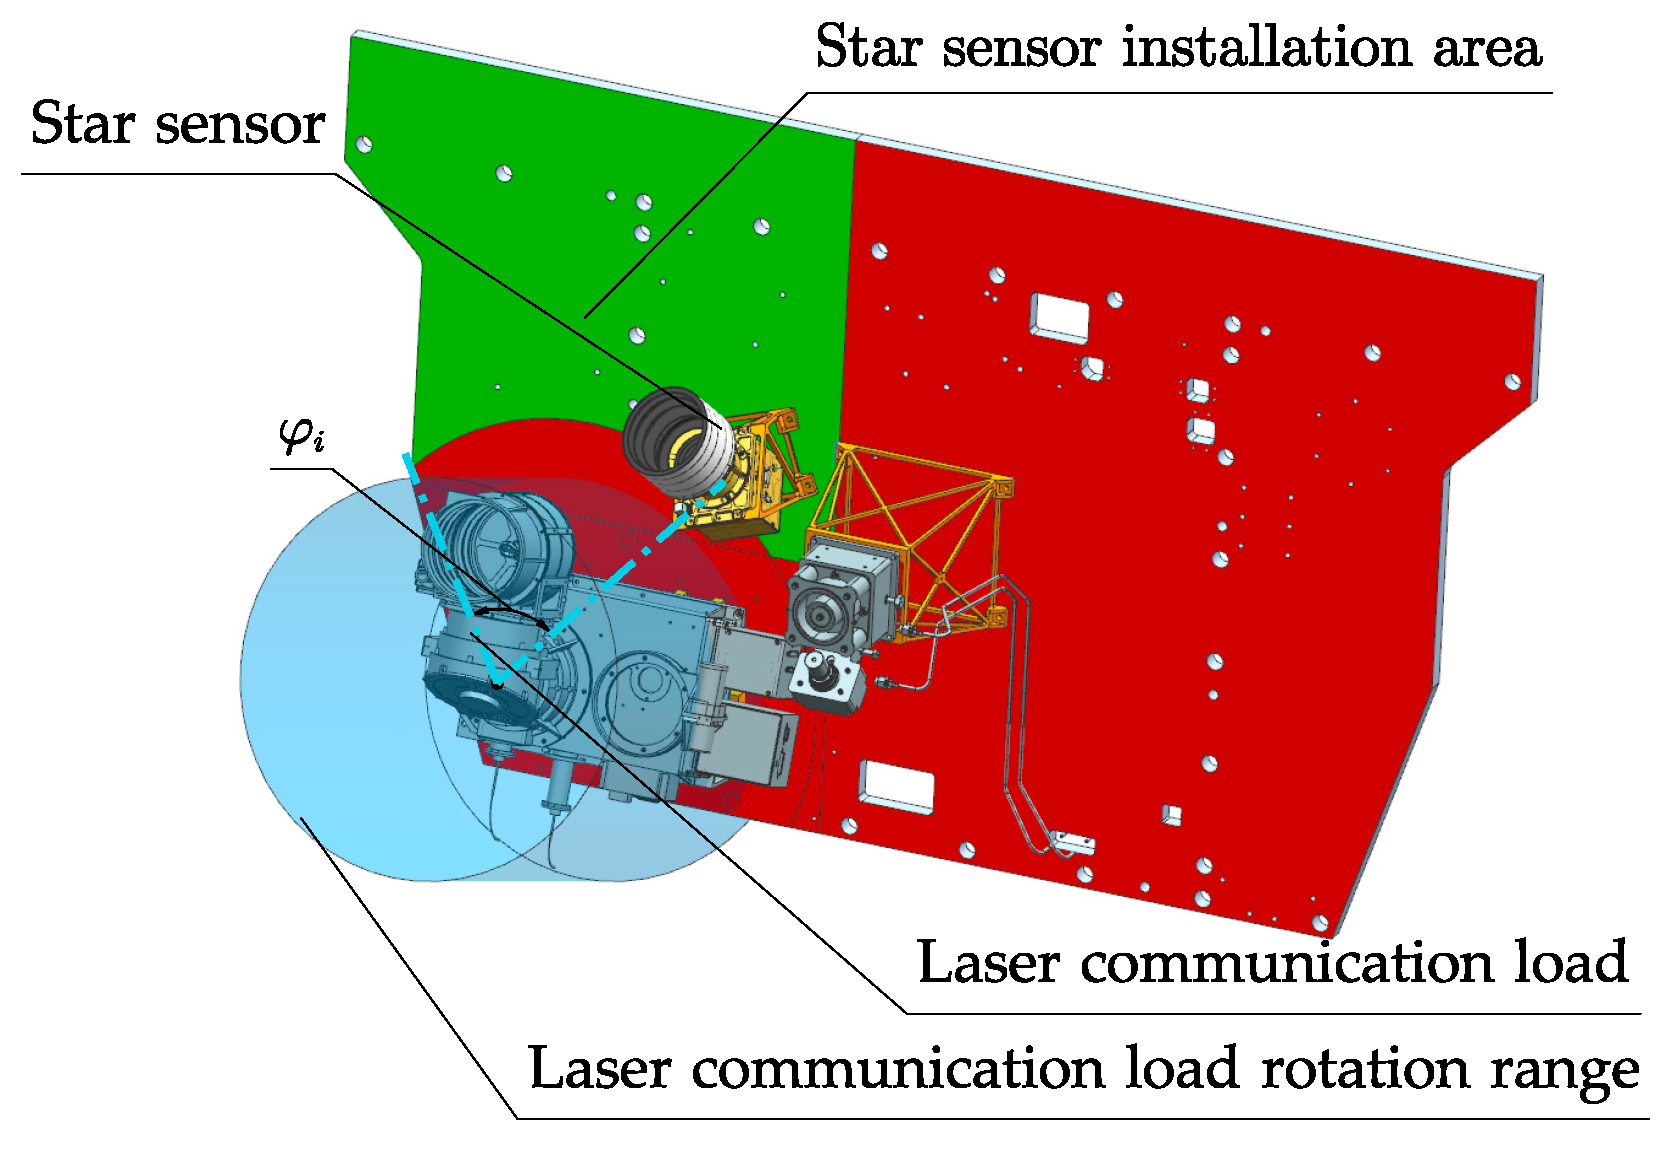
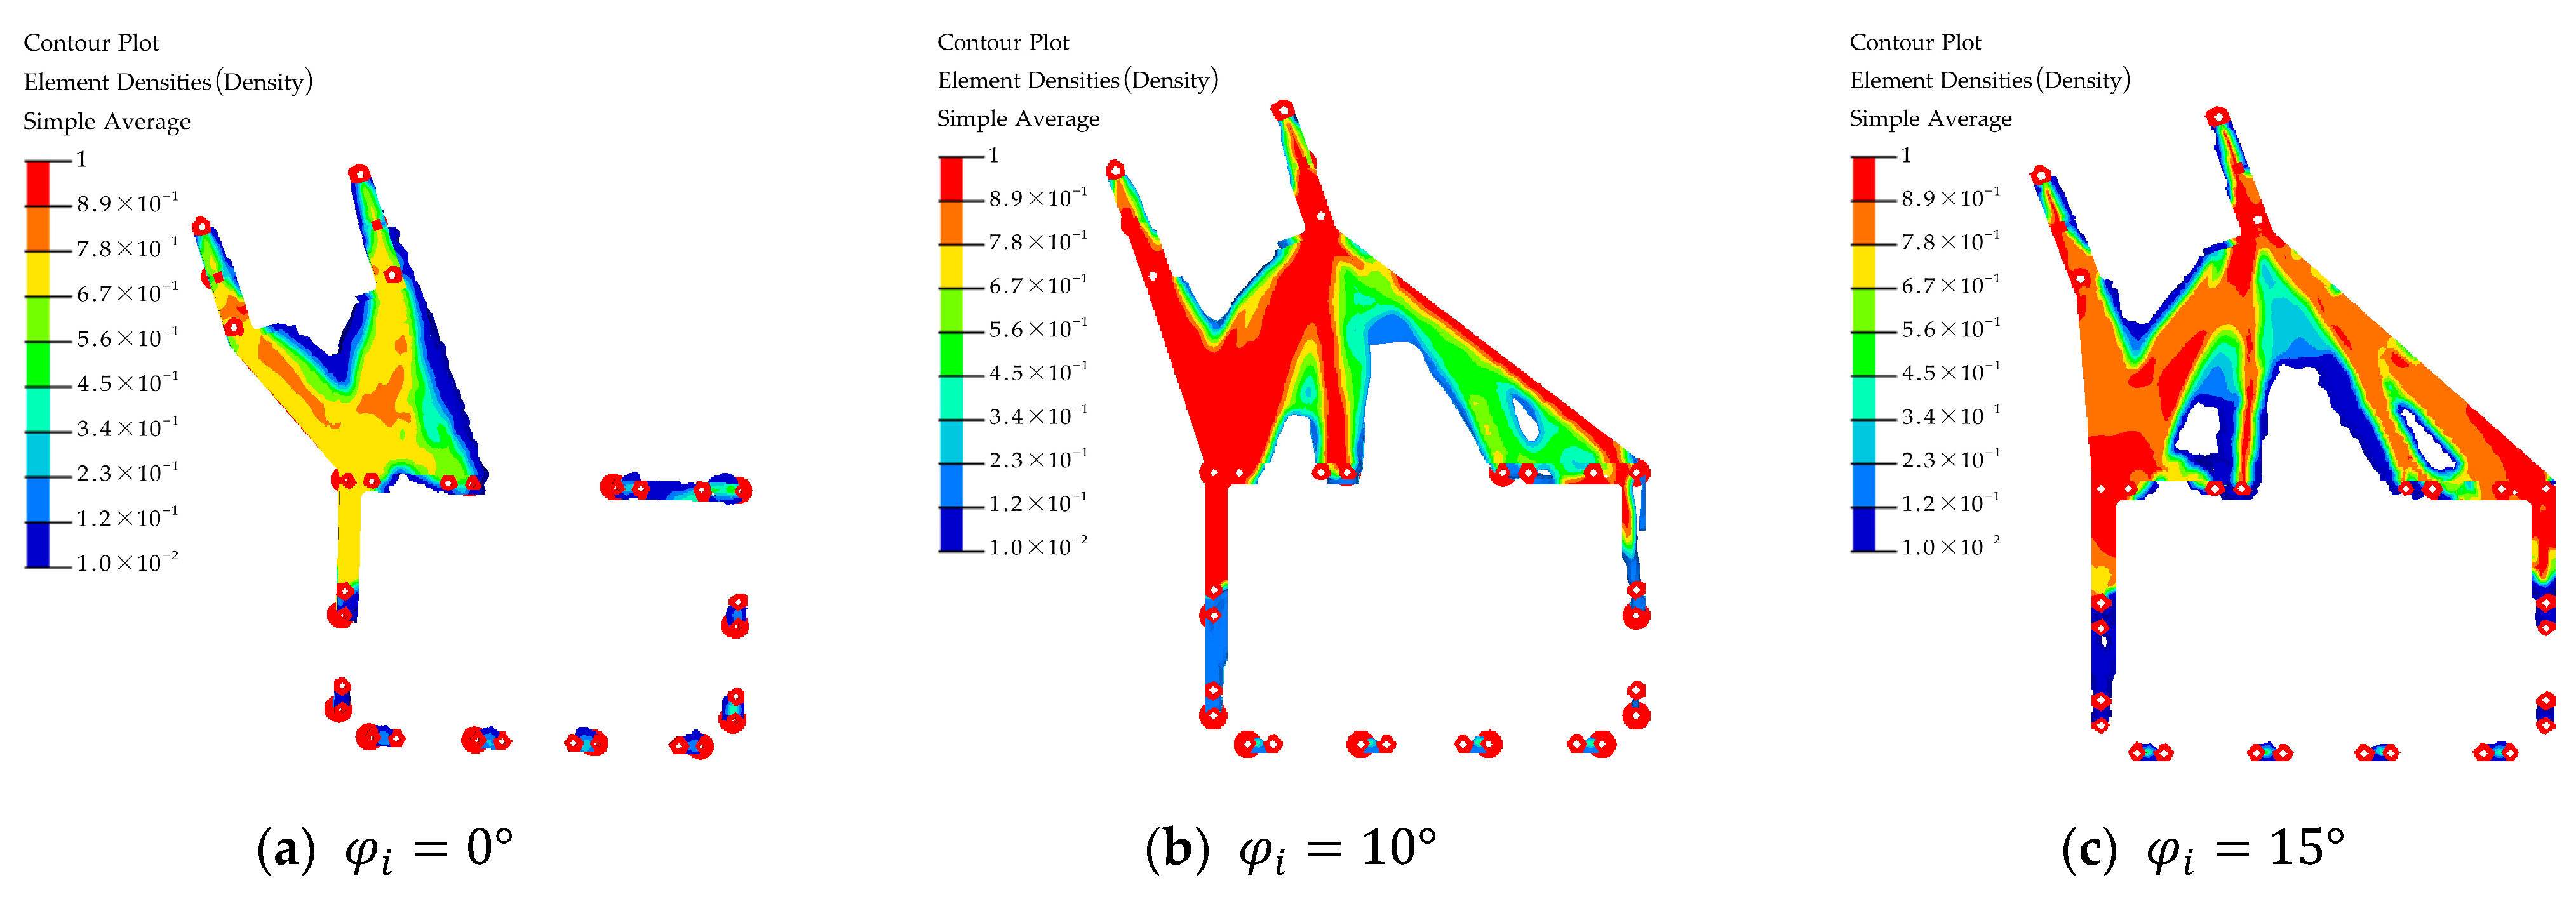
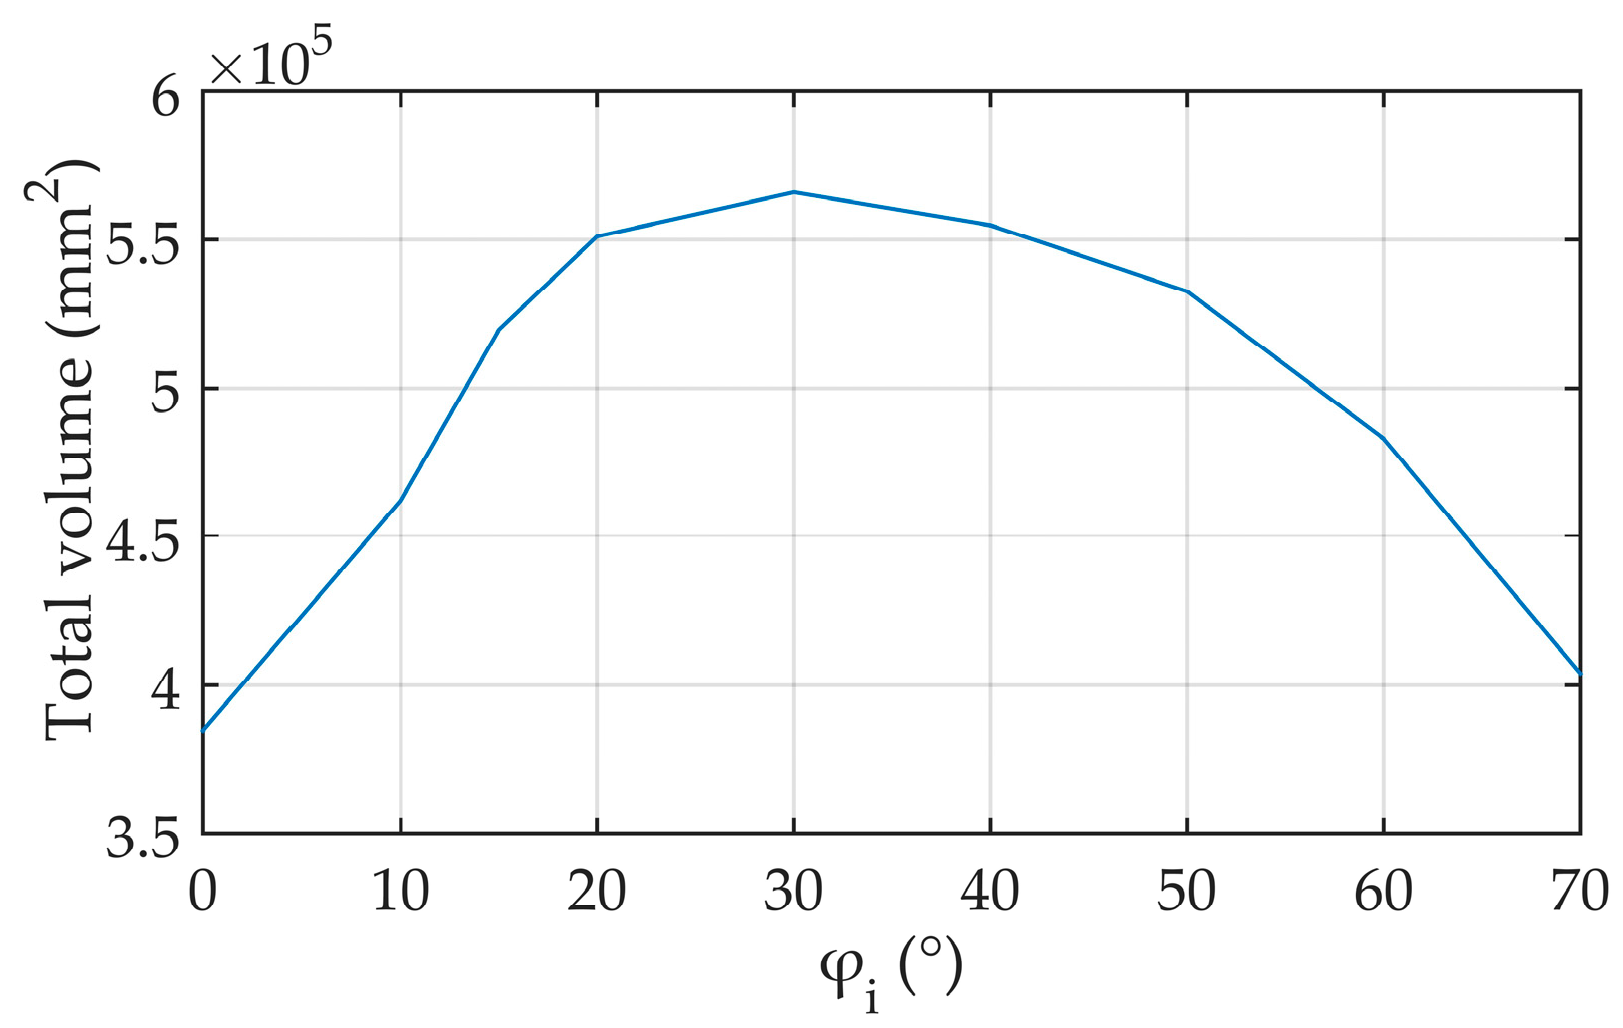
3.3.2. Multi-Objective Optimization Design of Reference Support
3.4. Thermal Deformation Analysis after Optimization
3.4.1. Support Temperature Control Design
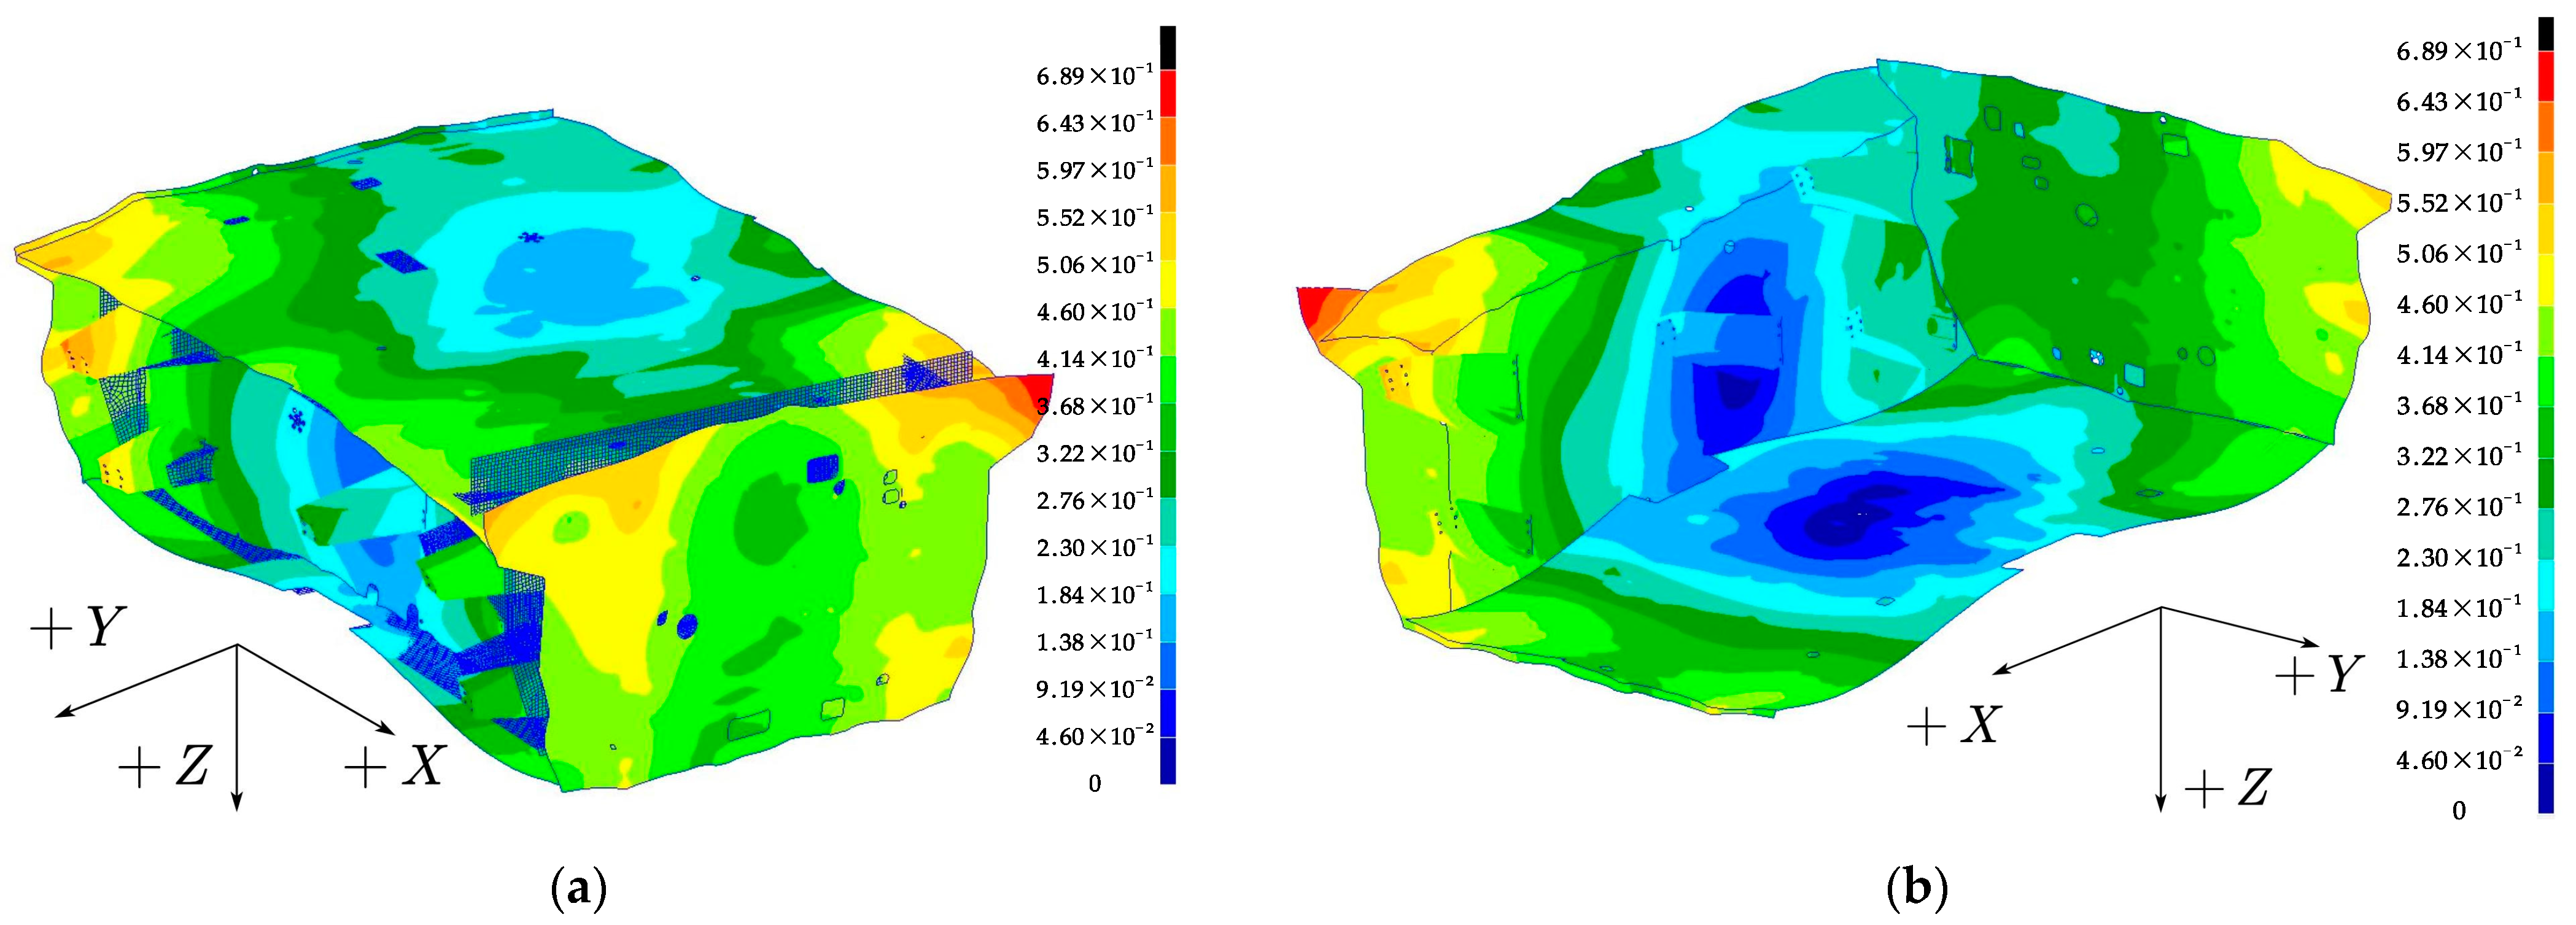
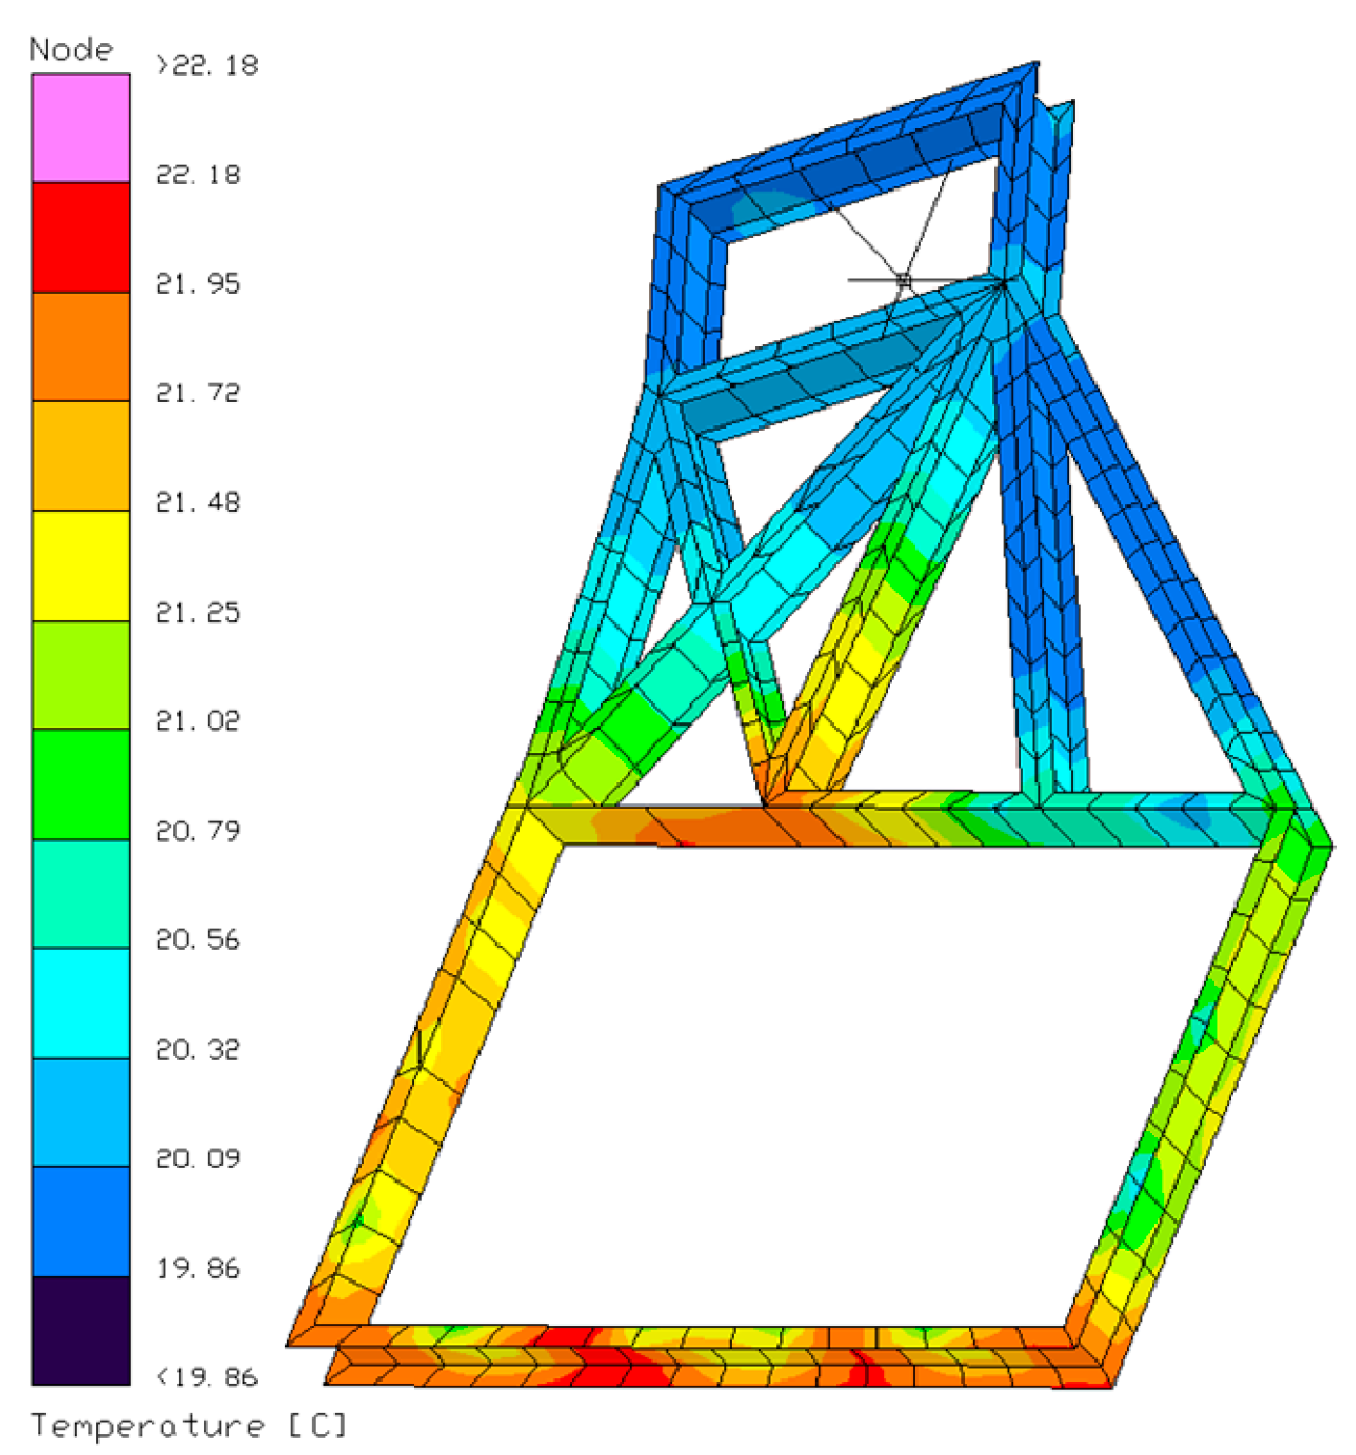
3.4.2. Thermal Deformation Analysis Results
4. Tests
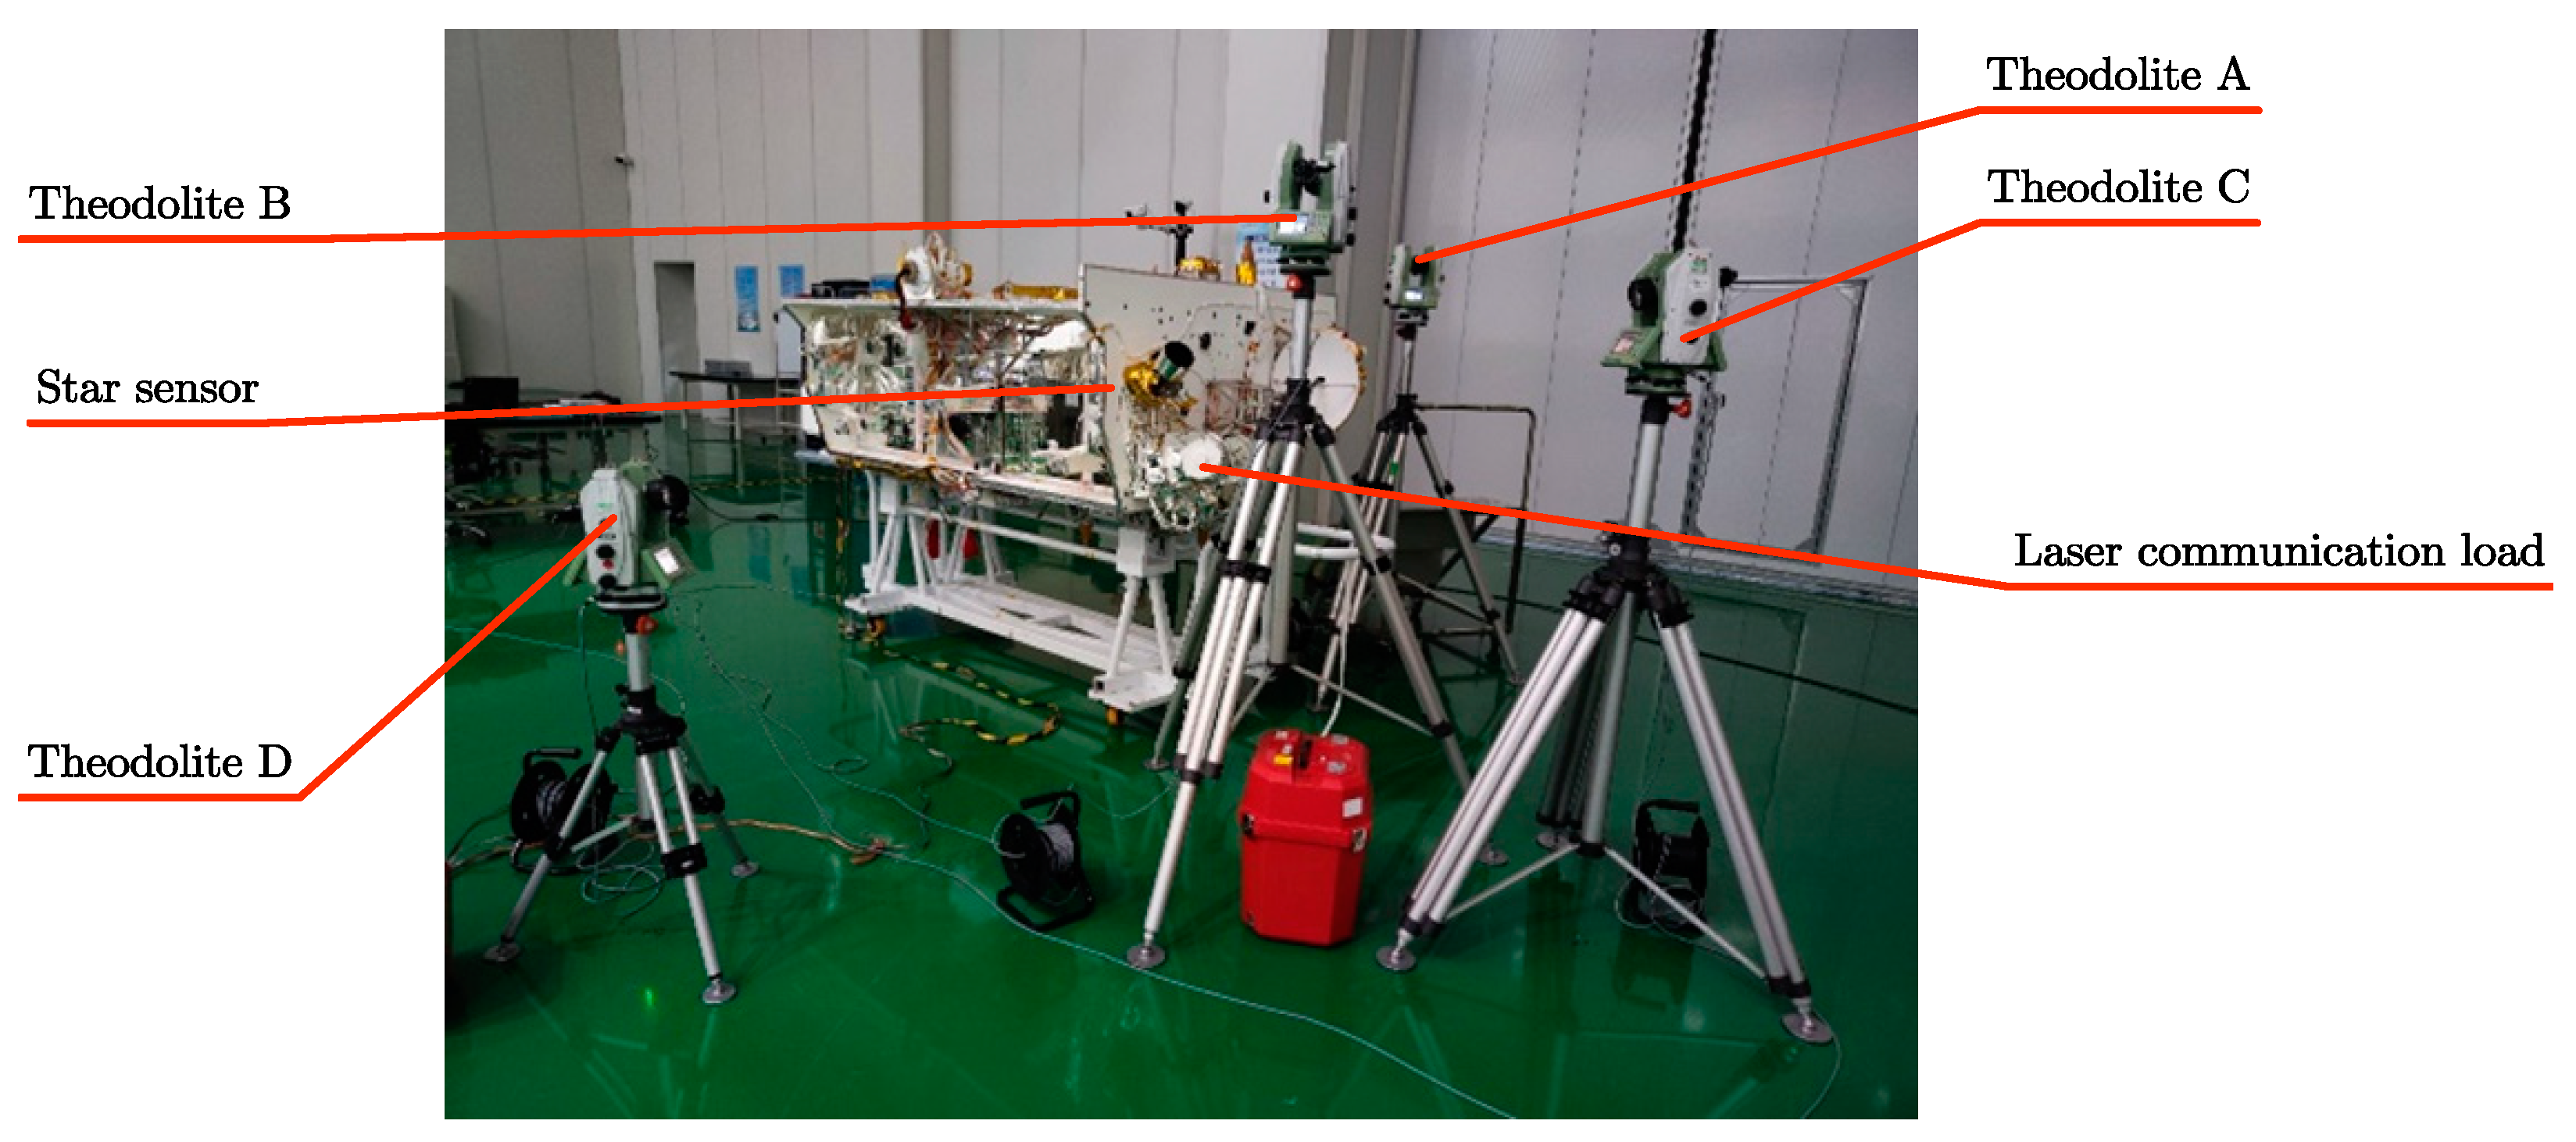
4.1. Ground Tests
4.2. In-Orbit Tests
5. Conclusions
Author Contributions
Funding
Institutional Review Board Statement
Informed Consent Statement
Data Availability Statement
Conflicts of Interest
References
- Garlinska, M.; Pregowska, A.; Masztalerz, K.; Osial, M. From Mirrors to Free-Space Optical Communication—Historical Aspects in Data Transmission. Future Internet 2020, 12, 179. [Google Scholar] [CrossRef]
- Sinha, S.; Kumar, C.; Armghan, A.; Singh, M.; Alsharari, M.; Aliqab, K. Capacity Enhancement Analysis of an OAM-OFDM-SMM Multiplexed Free Space Communication System in Atmospheric Turbulence. Appl. Sci. 2023, 13, 3897. [Google Scholar] [CrossRef]
- Garlinska, M.; Pregowska, A.; Gutowska, I.; Osial, M.; Szczepanski, J. Experimental Study of the Free Space Optics Communication System Operating in the 8–12 Μm Spectral Range. Electronics 2021, 10, 875. [Google Scholar] [CrossRef]
- Demers, F.; Yanikomeroglu, H.; St-Hilaire, M. A Survey of Opportunities for Free Space Optics in next Generation Cellular Networks. In Proceedings of the 2011 9th Annual Communication Networks and Services Research Conference, CNSR 2011, Ottawa, ON, Canada, 2–5 May 2011; pp. 210–216. [Google Scholar]
- Chaudhry, A.U.; Yanikomeroglu, H. Laser Intersatellite Links in a Starlink Constellation: A Classification and Analysis. IEEE Veh. Technol. Mag. 2021, 16, 48–56. [Google Scholar] [CrossRef]
- Chaudhry, A.U.; Yanikomeroglu, H. Free Space Optics for Next-Generation Satellite Networks. IEEE Consum. Electron. Mag. 2021, 10, 21–31. [Google Scholar] [CrossRef]
- Carrasco-Casado, A.; Shiratama, K.; Kolev, D.; Trinh, P.V.; Ishola, F.; Fuse, T.; Toyoshima, M. Development and Space-Qualification of a Miniaturized CubeSat’s 2-W EDFA for Space Laser Communications. Electronics 2022, 11, 2468. [Google Scholar] [CrossRef]
- Toyoshima, M.; Takayama, Y.; Takahashi, T.; Suzuki, K.; Kimura, S.; Takizawa, K.; Kuri, T.; Klaus, W.; Toyoda, M.; Kunimori, H.; et al. Ground-To-Satellite Laser Communication Experiments. IEEE Aerosp. Electron. Syst. Mag. 2008, 23, 10–18. [Google Scholar] [CrossRef]
- Naghshvarianjahromi, M.; Kumar, S.; Deen, M.J. Free Space Ground to Satellite Optical Communications Using Kramers–Kronig Transceiver in the Presence of Atmospheric Turbulence. Sensors 2022, 22, 3435. [Google Scholar] [CrossRef]
- Wang, J.; Lv, J.; Zhao, G.; Wang, G. Free-Space Laser Communication System with Rapid Acquisition Based on Astronomical Telescopes. Opt. Express 2015, 23, 20655. [Google Scholar] [CrossRef]
- Wang, J.; Kahn, J.M.; Lau, K.Y. Minimization of Acquisition Time in Short-Range Free-Space Optical Communication. Appl. Opt. 2002, 41, 7592–7602. [Google Scholar] [CrossRef]
- Nielsen, T.T. Pointing, Acquisition and Tracking System for the Free Space Laser Communication System, SILEX. In Proceedings of the Free-Space Laser Communication Technologies VII. SPIE: Bellingham, WA, USA, 1995; Volume 2381, pp. 194–205. [Google Scholar]
- Bradford, W.H.; Delliponti, A.; Formel, R. Utilizing Additive Manufacturing of Semi-Crystalline Thermoplastics and Topology Optimized Generative Designs for Complex Small Satellite Bus Geometries. In Proceedings of the 36th Annual Small Satellite Conference, Logan, UT, USA, 6–11 August 2022. [Google Scholar]
- Ibrahim, S.A.; Yamaguchi, E. Thermally Induced Dynamics of Deployable Solar Panels of Nanosatellite. Aircr. Eng. Aerosp. Technol. 2019, 91, 1039–1050. [Google Scholar] [CrossRef]
- Lu, Q.; Xu, Q.; Yin, Y.; Luo, W.; Qian, Z.; Bai, G. Design and Verification of GF-7 Satellite Configuration Based on Common Reference Payload. Spacecr. Eng. 2020, 29, 31–36. [Google Scholar]
- Safarabadi, M.; Izi, H.; Haghshenas, J.; Kelardeh, H.K. Design of Micro-Vibration Isolation System for a Remote-Sensing Satellite Payload Using Viscoelastic Materials. Eng. Solid Mech. 2020, 8, 69–76. [Google Scholar] [CrossRef]
- Zhu, J.; Zhou, H.; Wang, C.; Zhou, L.; Yuan, S.; Zhang, W. A Review of Topology Optimization for Additive Manufacturing: Status and Challenges. Chin. J. Aeronaut. 2021, 34, 91–110. [Google Scholar] [CrossRef]
- Wu, J.; Sigmund, O.; Groen, J.P. Topology Optimization of Multi-Scale Structures: A Review. Struct. Multidiscip. Optim. 2021, 63, 1455–1480. [Google Scholar]
- Zhu, B.; Zhang, X.; Zhang, H.; Liang, J.; Zang, H.; Li, H.; Wang, R. Design of Compliant Mechanisms Using Continuum Topology Optimization: A Review. Mech. Mach. Theory 2020, 143, 103622. [Google Scholar]
- Marbel, R.; Yozevitch, R.; Grinshpoun, T.; Ben-Moshe, B. Dynamic Network Formation for FSO Satellite Communication. Appl. Sci. 2022, 12, 738. [Google Scholar] [CrossRef]
- Jin, J.; Tian, F.; Yang, Z.; Di, H.; Li, G. A Disruption Tolerant Distributed Routing Algorithm in LEO Satellite Networks. Appl. Sci. 2022, 12, 3802. [Google Scholar] [CrossRef]
- Yu, J.; Guan, Y.; Zhang, D.; Chen, S.; Zhao, C.; Zhang, L. Simulation and Experimental Research on the Disturbance Behavior of a Sun-Tracking Solar Array Driven by a Stepping Motor. Appl. Sci. 2021, 11, 9076. [Google Scholar] [CrossRef]
- Scheinfeild, M.; Kopeika, N.S.; Shlomi, A. Acquisition Time Calculation and Influence of Vibrations for Micro Satellite Laser Communication in Space. In Proceedings of the Acquisition, Tracking, and Pointing XV; SPIE: Bellingham, WA, USA, 2001; Volume 4365. [Google Scholar]
- Li, X.; Yu, S.; Ma, J.; Tan, L. Analytical Expression and Optimization of Spatial Acquisition for Intersatellite Optical Communications. Opt. Express 2011, 19, 2381–2390. [Google Scholar] [CrossRef]
- Bianchi, G.; Aglietti, G.S.; Richardson, G. Development of Efficient and Cost-Effective Spacecraft Structures Based on Honeycomb Panel Assemblies. In Proceedings of the 2010 IEEE Aerospace Conference, Big Sky, MT, USA, 6–13 March 2010. [Google Scholar]
- Mason, J.P.; Lamprecht, B.; Woods, T.N.; Downs, C. CubeSat On-Orbit Temperature Comparison to Thermal-Balance-Tuned-Model Predictions. J. Thermophys. Heat Transf. 2018, 32, 237–255. [Google Scholar] [CrossRef]
- Escobar, E.; Diaz, M.; Zagal, J.C. Evolutionary Design of a Satellite Thermal Control System: Real Experiments for a CubeSat Mission. Appl. Eng. 2016, 105, 490–500. [Google Scholar] [CrossRef]
- Zhao, J.; Yoon, H.; Youn, B.D. An Efficient Concurrent Topology Optimization Approach for Frequency Response Problems. Comput Methods Appl. Mech. Eng. 2019, 347, 700–734. [Google Scholar] [CrossRef]


| ID | Parameters | Specifications |
|---|---|---|
| 1 | Mode | Full-duplex |
| 2 | Transmission rate @ 5000 km | 1.25 Gbps |
| 3 | Transmission rate @ 3000 km | 2.5 Gbps |
| 4 | Sensitivity | ≤−40 dBm@1.25 Gbps, ≤−37 dBm@2.5 Gbps |
| 5 | Error rate | ≤1 × 10⁻⁷ (After decoding) |
| 6 | Tracking range | 200–4500 km |
| 7 | Precise tracking accuracy | ≤5 μrad |
| ID | Source of Error | Type of Error | Error Magnitude/Mrad |
|---|---|---|---|
| 1 | Satellite bus | Orbit prediction error | 0.05 |
| 2 | Satellite attitude measurement error | 0.35 | |
| 3 | Satellite dynamic deformation error | 0.3 | |
| 4 | Laser communication load | Pointing mirror open loop control error | 0.5 |
| 5 | Coarse tracking error | 0.1 | |
| 6 | Accuracy of laser solution | 0.2 | |
| Synthesis error | 1.5 | ||
| β | Earth Infrared Incident Heat Flux on a Honeycomb Plate (W/m2) | |||||
|---|---|---|---|---|---|---|
| +X | −X | +Y | −Y | +Z | −Z | |
| −90~88° | 51.5 | 51.5 | 34.7 | 35.1 | 191.0 | 0.0 |
| +X KS-ZA@20 °C | −X KS-ZA@20 °C | +Y OSR@20 °C | −Y OSR@20 °C | +Z KS-ZA@20 °C | −Z OSR@20 °C | |
|---|---|---|---|---|---|---|
| Minimum average heat dissipation capacity (W/m2) | 285.8 | 285.8 | 275.1 | 274.4 | 173.9 | 298.5 |
| Structural Plate Name | Honeycomb Core Specification (mm) | Honeycomb Core Thickness (mm) | Skin Material | Skin Thickness (mm) | Overall Dimensions of the Honeycomb Panel (mm) |
|---|---|---|---|---|---|
| +X | 3 × 0.05 | 19.1 | 2A12 | 0.3 | 1440 × 835 × 19.7 |
| −X | 3 × 0.05/5 × 0.03 | 19.1 | 2A12 | 0.3 | 1440 × 725 × 19.7 |
| +Y | 3 × 0.05/5 × 0.03 | 24.1 | 2A12 | 0.3 | 1950 × 665 × 24.7 |
| −Y | 3 × 0.05/5 × 0.03 | 24.1 | 2A12 | 0.3 | 1950 × 665 × 24.7 |
| +Z | 3 × 0.05/4 × 0.04 | 29.1 | 2A12 | 0.3 | 1950 × 1040 × 30.1 |
| −Z | 3 × 0.05/4 × 0.04 | 24.1 | 2A12 | 0.5 | 1950 × 1440 × 25.1 |
| ID | Equipment Name | Maximum Power/W | High Temperature Condition/W | Low Temperature Condition/W |
|---|---|---|---|---|
| 1 | Ka band phased array transmitting antenna | 250 | 250 | 0 |
| 2 | Ka band phased array transceiver antenna 1 | 314.3 | 314.3 | 0 |
| 3 | Ka band phased array transceiver antenna 2 | 314.3 | 314.3 | 0 |
| 4 | Combined processing load | 409 | 409 | 0 |
| 5 | Terahertz test load | 184.4 | 0 | 0 |
| 6 | Laser communication load 1 | 53 | 53 | 53 |
| 7 | Laser communication load 2 | 53 | 53 | 53 |
| 8 | Other loads | 423.2 | 392.2 | 7 |
| 9 | electric propulsion | 527 | 0 | 0 |
| 10 | Platform power consumption | 270.2 | 253.4 | 161.4 |
| 11 | Heating belt compensates power consumption | / | 0 | 613.2 |
| Total | 2798.4 | 2039.2 | 887.6 |
| Variable Name | Optimized Result /mm | Volume Sensitivity dV/dt (mm2) | First-Order Modal Sensitivity df1/dt (Hz/mm) | Maximum Displacement Sensitivity ddj/dt (10−4) |
|---|---|---|---|---|
| A1 | 14.8 | 89,647.6 | 7.5 | 3.6 |
| A2 | 2 | 135,084.5 | 10.1 | −4.9 |
| A3 | 8 | 15,352.6 | 1.2 | 1.9 |
| A4 | 0.6 | 56,244.6 | 1.4 | −5.1 |
| B1 | 14.8 | 89,647.6 | 7.5 | 3.6 |
| B2 | 2 | 135,084.5 | 10.1 | −4.9 |
| B3 | 8 | 21,319.4 | 0.4 | 1.6 |
| B4 | 0.6 | 82,682.9 | 1.9 | 0.6 |
| C1 | 14.8 | 89,647.6 | 7.5 | 3.6 |
| C2 | 2 | 135,084.5 | 10.1 | −4.9 |
| C3 | 16 | 49,120.6 | 12.8 | −2.1 |
| C4 | 0.6 | 75,005.2 | 6.7 | −1.9 |
| Heating Belts ID | Size/mm | Electrical Resistance/Ω |
|---|---|---|
| H1 | 70 × 18 | 34 |
| H2 | 70 × 18 | 34 |
| H3 | 70 × 18 | 34 |
| H4 | 45 × 18 | 21.9 |
| H5 | 70 × 18 | 34 |
| H6 | 70 × 18 | 34 |
| H7 | 70 × 18 | 34 |
| H8 | 70 × 18 | 34 |
| H9 | 70 × 18 | 34 |
| H10 | 25 × 18 | 12 |
| H11 | 45 × 18 | 21.9 |
| H12 | 25 × 18 | 12 |
| H13 | 35 × 18 | 17 |
| H14 | 35 × 18 | 17 |
| H15 | 35 × 18 | 17 |
| H16 | 35 × 18 | 17 |
| H17 | 35 × 18 | 17 |
| H18 | 35 × 18 | 17 |
| H19 | 25 × 18 | 12 |
| H20 | 25 × 18 | 12 |
| H21 | 45 × 18 | 21.9 |
| H22 | 35 × 18 | 17 |
| H23 | 70 × 18 | 34 |
| Equipment | ID | Coordinates after Thermal Deformation of the Installation Points of Star Sensor and Laser Communication Loads/mm | ||
|---|---|---|---|---|
| X | Y | Z | ||
| Star sensor | 1 | 498.022332 | 590.592472 | 616.777184 |
| 2 | −195.021749 | −310.980372 | −237.124945 | |
| 3 | −3988.873092 | −3988.875943 | −3988.895106 | |
| 4 | 498.022332 | 590.592472 | 616.777184 | |
| Laser communication load | 5 | 555.885593 | 299.889329 | 578.953251 |
| 6 | −654.633767 | −654.700147 | −466.758511 | |
| 7 | −3988.799787 | −3988.715247 | −3988.846126 | |
| 8 | 555.885593 | 299.889329 | 578.953251 | |
| Parameter | |||
|---|---|---|---|
| Star sensor | −3988.777117 | −0.000264139 | −0.000186277 |
| Laser communication load | −3988.750815 | −0.000330447 | −0.000205741 |
| ID | Satellite Equipment | Test Scheme 1/°C | Test Scheme 2/°C | Test Scheme 3/°C |
|---|---|---|---|---|
| 1 | +Y lithium battery | 31.15 | 30.68 | 33.97 |
| 2 | −Z Microwave transceiver channel | 41.34 | 40.14 | 48.03 |
| 3 | −X power amplifier | 52.63 | 51.32 | 55.28 |
| 4 | Measurement and control transponder | 41.75 | 40.85 | 44.62 |
| 5 | Measurement and control random access terminal | 44.69 | 43.72 | 47.39 |
| 6 | Electric push controller | 39.40 | 39.51 | 48.53 |
| 7 | Central computer | 42.58 | 41.22 | 50.40 |
| 8 | Fiber-optic gyroscope | 40.17 | 38.84 | 44.92 |
| 9 | Flywheel 1 | 39.81 | 38.28 | 45.60 |
| 10 | High stability clock source | 46.24 | 45.15 | 49.79 |
| 11 | Interplanetary link channel | 44.04 | 42.57 | 46.18 |
| 12 | Power controller | 43.60 | 42.50 | 49.49 |
| 13 | Laser communication load electronics box | 40.97 | 40.09 | 43.61 |
| 14 | Phased array transceiver antenna 1 | 44.99 | 41.26 | 56.00 |
| 15 | Phased array transceiver antenna 2 | 46.35 | 45.87 | 57.97 |
| Test Scheme | Laser Communication Load Prism (°) | Variation (″) | |||||||
|---|---|---|---|---|---|---|---|---|---|
| The Satellite Is Not Powered up (20 °C) | The Satellite Is Heated | ||||||||
| X | Y | Z | X | Y | Z | ||||
| Star-sensor prism | Test scheme 1 | X | 57.45941 | 104.70392 | 36.49674 | 57.48653 | 104.69043 | 36.46410 | 117.74 |
| Y | 92.57665 | 19.33458 | 70.85150 | 92.59326 | 19.32406 | 70.86453 | 75.42 | ||
| Z | 147.33186 | 102.27354 | 60.25443 | 147.35727 | 102.27365 | 60.28129 | 97.40 | ||
| Test scheme 2 | X | 56.44269 | 104.43308 | 37.32726 | 56.44544 | 104.43352 | 37.32485 | 9.90 | |
| Y | 93.42561 | 19.96337 | 70.35752 | 93.42671 | 19.96400 | 70.35709 | 4.28 | ||
| Z | 146.22100 | 103.49310 | 59.69107 | 146.22360 | 103.49353 | 59.69405 | 10.72 | ||
| Test scheme 3 | X | 56.44269 | 104.43308 | 37.32726 | 56.44623 | 104.42694 | 37.32080 | 27.74 | |
| Y | 93.42561 | 19.96337 | 70.35752 | 93.43385 | 19.96175 | 70.36072 | 31.60 | ||
| Z | 146.22100 | 103.49310 | 59.69107 | 146.22347 | 103.49733 | 59.69590 | 21.66 | ||
| ID | Test Time | Scanning Mode | Capture Time /s | |
|---|---|---|---|---|
| Low-Orbit Communications Test Satellite 03 | Low-Orbit Communications Test Satellite 04 | |||
| 1 | 20 July 2022 | Scan | Gaze | 35 |
| 2 | 21 July 2022 | Scan | Gaze | 45 |
| 3 | 22 July 2022 | Gaze | Scan | 87 |
| 4 | 22 July 2022 | Gaze | Scan | 42 |
| 5 | 25 July 2022 | Scan | Gaze | 16 |
| 6 | 25 July 2022 | Scan | Gaze | 28 |
| 7 | 25 July 2022 | Scan | Gaze | 28 |
| 8 | 25 July 2022 | Gaze | Scan | 16 |
| 9 | 25 July 2022 | Gaze | Scan | 14 |
| 10 | 25 July 2022 | Gaze | Scan | 18 |
| 11 | 25 July 2022 | Scan | Gaze | 26 |
| 12 | 25 July 2022 | Gaze | Scan | 18 |
| 13 | 26 July 2022 | Scan | Gaze | 28 |
| 14 | 27 July 2022 | Scan | Gaze | 29 |
Disclaimer/Publisher’s Note: The statements, opinions and data contained in all publications are solely those of the individual author(s) and contributor(s) and not of MDPI and/or the editor(s). MDPI and/or the editor(s) disclaim responsibility for any injury to people or property resulting from any ideas, methods, instructions or products referred to in the content. |
© 2023 by the authors. Licensee MDPI, Basel, Switzerland. This article is an open access article distributed under the terms and conditions of the Creative Commons Attribution (CC BY) license (https://creativecommons.org/licenses/by/4.0/).
Share and Cite
Shi, Y.; Chen, S.; Yu, M.; Wu, Y.; Yu, J.; Zhang, L. Thermal Deformation Stability Optimization Design and Experiment of the Satellite Bus to Control the Laser Communication Load’s Acquisition Time. Appl. Sci. 2023, 13, 5502. https://doi.org/10.3390/app13095502
Shi Y, Chen S, Yu M, Wu Y, Yu J, Zhang L. Thermal Deformation Stability Optimization Design and Experiment of the Satellite Bus to Control the Laser Communication Load’s Acquisition Time. Applied Sciences. 2023; 13(9):5502. https://doi.org/10.3390/app13095502
Chicago/Turabian StyleShi, Yousheng, Shanbo Chen, Meng Yu, You Wu, Jisong Yu, and Lei Zhang. 2023. "Thermal Deformation Stability Optimization Design and Experiment of the Satellite Bus to Control the Laser Communication Load’s Acquisition Time" Applied Sciences 13, no. 9: 5502. https://doi.org/10.3390/app13095502
APA StyleShi, Y., Chen, S., Yu, M., Wu, Y., Yu, J., & Zhang, L. (2023). Thermal Deformation Stability Optimization Design and Experiment of the Satellite Bus to Control the Laser Communication Load’s Acquisition Time. Applied Sciences, 13(9), 5502. https://doi.org/10.3390/app13095502