Article

PhotoMatch: An Open-Source Tool for Multi-View and Multi-Modal Feature-Based Image Matching

by
Esteban Ruiz de Oña
1,
Inés Barbero-García
1,
Diego González-Aguilera
1,*,
Fabio Remondino
2,
Pablo Rodríguez-Gonzálvez
3 and
David Hernández-López
4
1
Cartographic and Terrain Engineering Department, Higher Polytechnic School of Ávila, University of Salamanca, 05003 Ávila, Spain
2
3D Optical Metrology (3DOM) Unit, Bruno Kessler Foundation (FBK), 38121 Trento, Italy
3
Department of Mining Technology, Topography and Structures, Universidad de León, 24071 Ponferrada, Spain
4
Institute for Regional Development (IDR), University of Castilla-La Mancha, 13001 Albacete, Spain
*
Author to whom correspondence should be addressed.
Appl. Sci. 2023, 13(9), 5467; https://doi.org/10.3390/app13095467
Submission received: 3 March 2023 / Revised: 24 April 2023 / Accepted: 26 April 2023 / Published: 27 April 2023
(This article belongs to the Special Issue Digital Image Processing: Advanced Technologies and Applications)

Abstract

:
The accurate and reliable extraction and matching of distinctive features (keypoints) in multi-view and multi-modal datasets is still an open research topic in the photogrammetric and computer vision communities. However, one of the main milestones is selecting which method is a suitable choice for specific applications. This encourages us to develop an educational tool that encloses different hand-crafted and learning-based feature-extraction methods. This article presents PhotoMatch, a didactical, open-source tool for multi-view and multi-modal feature-based image matching. The software includes a wide range of state-of-the-art methodologies for preprocessing, feature extraction and matching, including deep learning detectors and descriptors. It also provides tools for a detailed assessment and comparison of the different approaches, allowing the user to select the best combination of methods for each specific multi-view and multi-modal dataset. The first version of the tool was awarded by the ISPRS (ISPRS Scientific Initiatives, 2019). A set of thirteen case studies, including six multi-view and six multi-modal image datasets, is processed by following different methodologies, and the results provided by the software are analysed to show the capabilities of the tool. The PhotoMatch Installer and the source code are freely available.

1. Introduction

Feature-based image matching is a process that provides a correspondence between two or more images connecting basically local image features. The development of automatic and accurate image-matching processes has been a traditional problem in the field of photogrammetry and computer vision [1]. At present, modern camera orientation techniques such as Structure from Motion (SfM) or Visual Simultaneous Localization and Mapping (VSLAM) also rely on the extraction of accurate and reliable homologous points between images. Particularly, these correspondence points between images are normally used within the image orientation and self-calibration process, exploiting globally inherent geometric constraints in an optimization scheme known as bundle adjustment. Image matching can be used for object recognition and tracking, including some specifically hand-crafted features [2,3] and, more recently, deep learning approaches [4,5,6,7].
The spread of smartphones with powerful cameras, as well as the development of automatic tools for the creation of 3D models from a set of images, has led to the democratization and popularization of photogrammetry and computer vision. At first, photogrammetry was applied only by experts with good knowledge and expertise and using very specialized equipment. At present, techniques such as SfM, together with multi-view stereo (MVS), allow for the creation of 3D models by end-users without specific knowledge [8,9,10,11,12]. The creation of 3D models from images acquired by non-experts also presents a challenge for image matching, since the basic rules and protocols for imagery acquisition are often not fulfilled [13]. These amateur users will often acquire images with low overlap, at different scales and perspectives, or even with large differences in lighting or other radiometric conditions.
Although modern matching techniques cope with images with radiometric and geometric variations, the image matching process is especially challenging in the case of multi-modal images. Multi-modal image matching is performed between images coming from different sensors or different acquisition techniques and those with significant and nonlinear radiometric distortions. The differences can be due to the use of different sensors (e.g., multispectral, thermal, depth cameras), differences in data types (e.g., drawings vs. photography, vector vs. raster), or different illumination conditions (e.g., day/night images). Multi-modal matching is a critical task for a wide range of applications, such as medicine [14], cultural heritage documentation [15], multitemporal monitoring [16] or person re-identification [17,18], among others.
Image matching algorithms can be classified in two large groups: (i) traditional hand-crafted methods, and (ii) learning-based methods. The latter group utilises artificial intelligence for the development of new detectors and descriptors learned from the data [19]. While the hand-crafted feature-extraction methods are well-established in photogrammetric processes, they are not able to overcome important geometric, radiometric and spectral changes.
The number of artificial intelligence algorithms that can be used for image matching is rapidly growing. As a consequence, the selection of a suitable combination of detector, descriptor and matching function for a specific case is a complex task [20]. A detailed study must be conducted for each type of data to select the best algorithm from the increasing number of available options. Additionally, it is important not to overlook the manual configuration of certain input parameters, which can be highly theoretical and difficult for end-users to understand. Configuring each option is a time-consuming process, especially when including deep learning methodologies and training processes. Furthermore, there is a lack of tools that facilitate the processing, comparison, and assessment of the different feature-based image matching methodologies.
The purpose of the present study is to try and contribute to the scientific community in this gap. Here, we introduce PhotoMatch, an educational and open-source tool for multi-modal and multi-view feature-based image matching. The tool allows for the use of a wide range of algorithms for keypoint detection, description, and matching. It also provides a method for evaluating and comparing the obtained results among different approaches in a didactic way, including the ability to provide reference data for the evaluation of the tested methodologies. In [21], a first version of the PhotoMatch tool was presented and awarded by ISPRS (ISPRS Scientific Initiatives, 2019). This article presents a new version of the PhotoMatch tool, which includes several improvements and consolidated learning-based methods.
The standard methodology for hand-crafted methods consists of feature detection, feature description, and matching:
  • Detectors identify distinctive features (keypoints), localizing meaningful and salient regions of the image, and extracting these regions as patches. These patches are generally normalized in order to achieve invariance to geometric and radiometric transformations. These keypoints are represented by their point representatives, such as the centre of gravity or other distinctive points.
  • Descriptors analyse the neighbourhood of the keypoints and create a 2D vector of information based on the different mathematical properties of the point and its neighbourhood. Usually, distance is used to establish the candidate correspondences.
  • Matching identifies homologous keypoints between images using the information provided by the descriptors. The most common matching methods are brute-force and Flann [22], and robust matching by means of spatial global or local constraints, such as those provided by epipolar geometry [23] and RANdom SAmple Consensus (RANSAC) [21,22,23,24].
A wide range of detectors and descriptors has been developed in the last decades [25] SIFT [26], and its last version RootSIFT [27], which introduces a slight variation in the descriptor computation; SURF [28]; or MSD [29]. These are just a few examples of the large number of detectors and descriptors available in the scientific community. SIFT has monopolised feature-based matching in the last two decades. SIFT matching relies on keypoints, whose associated patches are normalized to become invariant to scale and rotation changes. Nevertheless, although SIFT is still valid and able to obtain robust results in the SfM pipelines, it is not invariant to considerable scale and rotation changes, and even less invariant to radiometric and/or spectral changes.
Deep learning detectors and descriptors have emerged in recent years as a promising alternative to hand-crafted methods, especially for multi-modal matching [14]. Although learning-based methods are often seen as a replacement of hand-crafted methods, they still face an important number of challenges. In particular, acquiring sufficient data to effectively train and evaluate deep learning algorithms can be challenging in many application fields. Furthermore, the variability in the types of multi-modal combinations complicates the development of tools that can be simultaneously utilized across a wide range of applications [14,30].
The challenge of acquiring the data required for training is being overcome by the development of unsupervised learning approaches. For image matching, unsupervised learning approaches include techniques such as the use of video, where the temporal coherence between frames can be used for model training [31]. Nevertheless, these approaches require a high amount of video data, which are not always available for other applications, such as medical imaging.
In certain complex scenarios, or when dealing with multi-modal datasets, learning-based methods might outperform hand-crafted methods. A high number of deep learning algorithms have been presented for keypoints’ detection and description, many of them focused on specific applications [20,30,32,33], and many are fully available and tested. For instance, in the last Image Matching Challenge (IMC) (Image Matching Challenge—2022 edition) [34], the best-performing algorithms were ASpanFormer [35], and combinations of SuperGlue [36], SuperPoint [37], LoFTR [38], DKM [39] and DISK [40]. Although the datasets of IMC included images with different positions, cameras, illumination or even filters, they did not include multimodal datasets (i.e., a combination of different sensors or combination of images coming from different wavelenghts). A comparison and evaluation of the best IMC algorithms was also carried out by other authors [41], using multi-view imagery and applied to cultural heritage. However, the obtained results did not show a clear winner, with some algorithms performing better than others under specific conditions. Trying to find specific multi-modal image matching contributions, other authors used TILDE [42], SuperPoint [37], and LF-Net [33]. More recently, an outstanding turning point was the “detect-and-describe” approach, D2-Net, network [43], and the repeatable and reliable detector and descriptor R2D2 [44], which represents a step forward in photogrammetry and computer vision.
Being aware of the pros and cons of the existing learning-based methods, these two methods, D2-Net and R2D2, were included in PhotoMatch.
This paper has been structured as follows: after this introduction, the tool, PhotoMatch, is described in Section 2. Section 3 outlines and analyzes the main results focused on multi-view and multi-modal images. Section 4 is devoted to highlighting the main conclusions and future perspectives.

2. PhotoMatch

PhotoMatch is an educational and open-source tool developed in C++ and Qt, which was awarded by the ISPRS through a Scientific Initiative [45]. It is available at https://github.com/TIDOP-USAL/PhotoMatch/releases (accessed on 20 February 2023). The tool follows a pipeline of six steps: (i) project and session definition, (ii) pre-processing, (iii) feature extraction, (iv) feature matching, (v) quality control, and (vi) export (Figure 1).

2.1. Project and Session Definition

This first step allows for the creation of a new project and uploading of the images. Each project can consist of one or several sessions, enabling a comparative assessment of the results. The tool accepts common image formats and an unlimited number of images.

2.2. Image Pre-Processing

Image pre-processing is stated as a fundamental step prior to feature extraction. The goal is to improve the radiometric content of the images, and thus to facilitate the subsequent feature extraction and matching process. This pre-processing is especially useful in cases with unfavourable texture images [46].
PhotoMatch offers different approaches to image pre-processing (Figure 1), including decolorization [47], Adaptive ContrastEnhancement Based on modified Sigmoid Function (ACEBSF) [48], Dynamic Histogram Equalization (DHE) [49], Parametric-Oriented Histogram Equalization (POHE) [50], Recursively Separated and Weighted Histogram Equalization (RSWHE) [51], and Wallis Filtering [52]. Pre-processing is highly recommended to obtain better results in the successive steps.

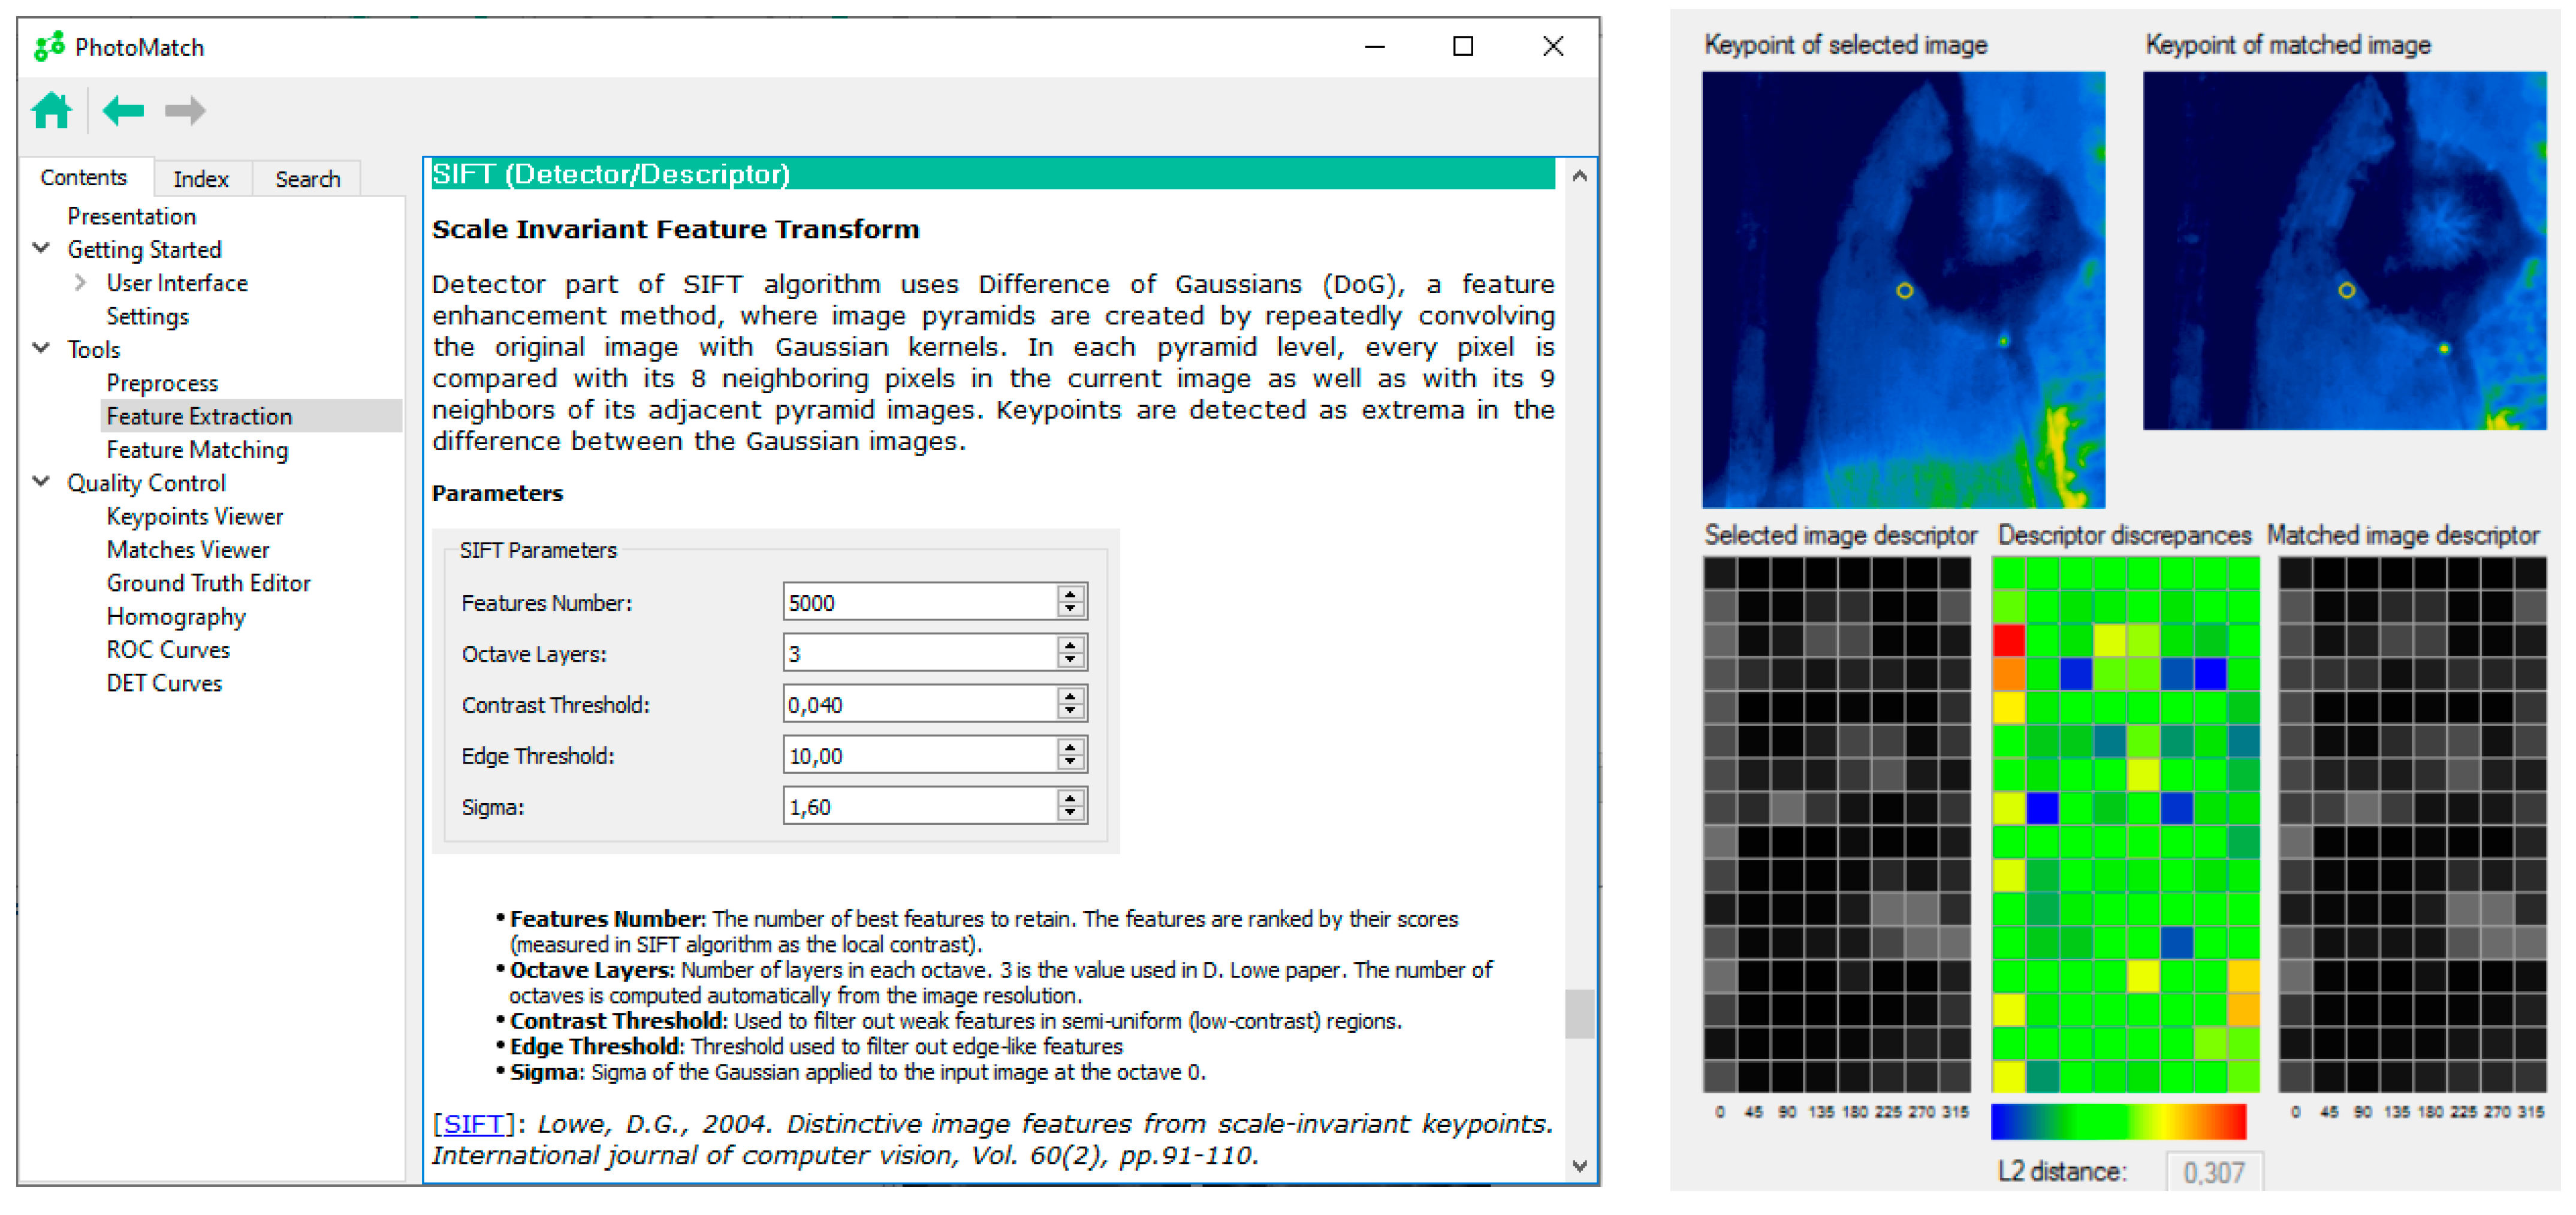
2.3. Feature Extraction

The feature extraction includes the detection and description of keypoints. The tool includes several alternatives that can be classified as hand-crafted or learning-based feature-extraction methods (Figure 1).
A total of 20 different hand-crafted methods were implemented. These include: SURF [28], SIFT [26], AKAZE [53] or MSD [29]. Most of the hand-crafted algorithms include a detector and a descriptor, which can be combined (e.g., SURF detector and SIFT descriptor). Different advanced parameters can be tuned, providing educational support for each available algorithm. An example of the MSD and SIFT options is provided in Figure 2b.
In addition, the Affine SIFT (ASIFT) [54] algorithm is also available. This algorithm computes a fully affine invariant matching. It is specifically designed to deal with images that present considerable geometric variations in terms of scale and perspective. The algorithm simulates all possible views by modifying the longitude and latitude of the camera orientation parameters. The ASIFT algorithm can also be used, in combination with other similarity invariant-matching methods such as SURF, BRISK [55] or AKAZE.
Regarding the learning-based methods, two deep learning detectors/descriptors were incorporated in PhotoMatch: D2-Net [43] and R2D2 [44]. This selection was made based on their outstanding performance, and considering that these algorithms are freely available and use pretrained models, so they are not designed for a specific type of data.
D2-Net uses a single convolutional neural network for simultaneous feature description and detection. Instead of carrying out the detection of low-level image structures, the process is carried out after the computation of the feature maps, when more reliable information is available. This has been assessed on multi-modal datasets, where it has proven to perform well for the matching of features under challenging illumination or weather conditions.
R2D2 also simultaneously acts as a keypoint detector and descriptor. This includes a local predictor of discriminativeness during learning, to avoid areas with salient features but where accurate matching is not possible due to repetitiveness (e.g., sea waves or canopy). It has been proven to perform especially well for the matching of day and night images.
The included deep learning algorithms were incorporated within PhotoMatch with pretrained models, while the selection of different pretrained models is also an option.

2.4. Matching

The matching process consists of finding the right correspondence between previously detected keypoints. PhotoMatch includes Brute-force and FLANN [22] as classical matching methods, while Robust Matching (RM) and Grid-based Motion Statistics (GMS) [56] are also possible matching strategies. The available descriptors distances are L1, L2, and Hamming Norm [57]. Then, the matching process is filtered using different methods. Homography [37], or Fundamental Matrix [58] can be combined with different computational methods, including RANSAC, all points, Least Median of Squares (LMedS), and Spearman’s RHO Correlation Coefficient (Figure 2c).

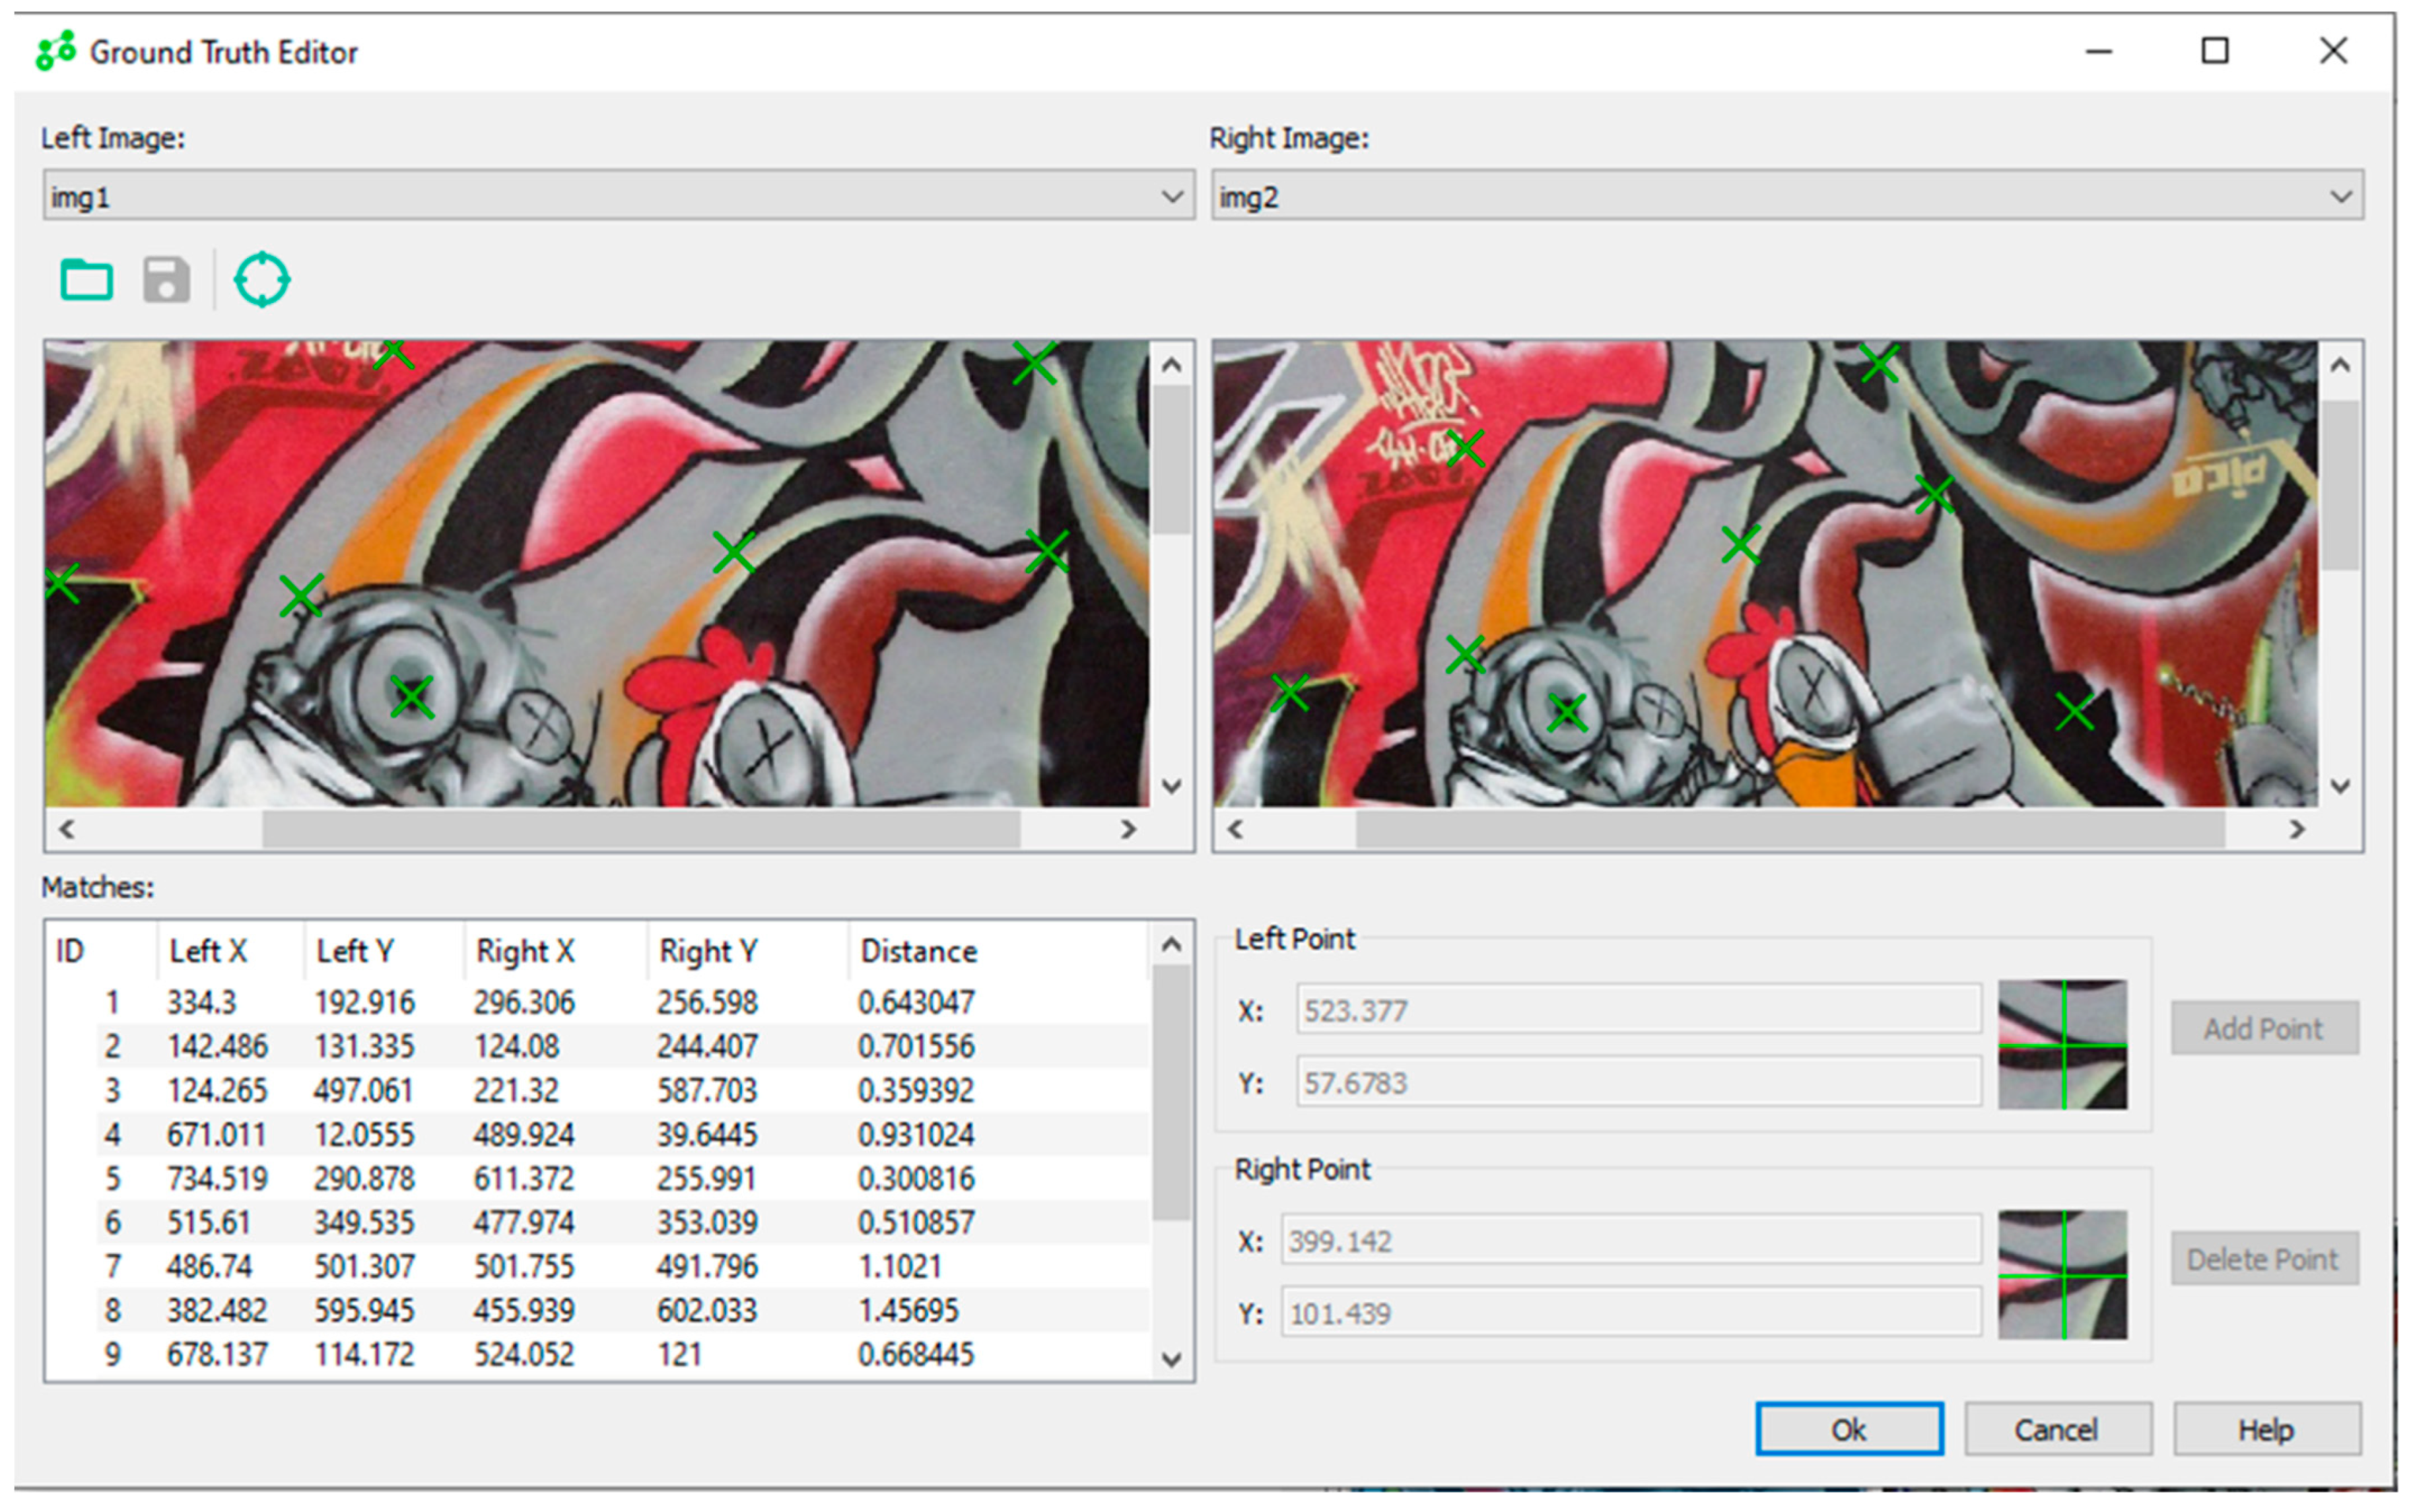
2.5. Assessment of Results

The main limitation in the analysis of feature-based image matching results is the unavailability of reliable reference data. To overcome this issue, PhotoMatch includes a reference data editor (as shown in Figure 3) that allows for the end-user to manually and accurately introduce a set of matching points. These points are later used to assess different feature-based matching algorithms.
Once the reference matchings are defined, PhotoMatch calculates and graphically represents the Receiver Operating Characteristic (ROC) curve and the Detection Error Trade-off (DET) curve, which illustrate the error in feature-based image matching. PhotoMatch offers the option to choose between homography or a fundamental matrix to compute these errors. Homography should be used when all points in the image are on the same plane, while the fundamental matrix should be selected when the points are not co-planar.
Furthermore, PhotoMatch provides a user-friendly visualization of the matchings (as shown in Figure 4), allowing for a better interpretation of the results.

2.6. Export

Finally, PhotoMatch allows for the exportation of the extracted keypoints and matchings in different formats, including XML and YML for OpenCV and plain text. This allows for end-users to import and use these observations in other tools for image triangulation (bundle adjustment) or photogrammetric reconstruction. This also allows for a more detailed assessment of the results to be carried out, or for the combination of the algorithms presented in PhotoMatch and other approaches.

2.7. Educational Information

PhotoMatch includes educational information with a short introduction to the different algorithms. The scientific references are also included in a more detailed explanation of the process (Figure 4). In this way, the idea is to provide researchers, students, and even end-users, with the information needed to select the optimal parameters and combinations for each algorithm. This also contributes to making PhotoMatch an educational and research resource, far from being a black-box tool. Last but not least, thanks to its exportation capabilities, PhotoMatch offers a solution for SfM tools that cannot correctly solve the matching and, thus, the orientation of the images.

3. Experimental Results and Discussion

Six multi-view and six multi-modal case studies with different characteristics were selected and analysed to show the PhotoMatch capabilities. Different feature detectors, descriptors and matching were used for each dataset and the obtained results were compared and assessed.

3.1. Multi-View

The selected multi-view datasets are related to the close-range photogrammetric applications. Due to the widespread adoption of SfM and MVS tools for 3D modeling, feature-based image matching has become a critical process. As end-users increasingly apply photogrammetry, this method must overcome more challenging conditions than traditional aerial photogrammetry, such as larger geometric and radiometric differences.
To this end, we selected six multi-view datasets, each composed of four images. Four sets of images were obtained from the ETH3D benchmark (https://www.eth3d.net/datasets, accessed on 11 November 2022) and comprised the images of a façade (Figure 5a), a forest (Figure 5b), a playground (Figure 5c) and a boulder (Figure 5d). The façade dataset is characterised by low overlap and repetitive features; the forest dataset is characterised by low resolution and unfavourable lighting conditions; for the playground dataset, the viewpoints between images have large differences; the boulder dataset also has a low overlap, but distinctive features that should help to solve the feature-based image matching.
The last two multi-view datasets were obtained from the public benchmark VGG Oxford (Visual Geometry Group—University of Oxford, accessed on 11 November 2022). The images cover a planar wall covered by graffiti. For one of the datasets, the images have good overlap and low geometric differences (Figure 5e). For the last dataset (Figure 5f), two of the images are synthetically derived from the other two and enclose considerable geometric differences, substantially hampering the matching process, even for a human operator.

3.2. Multi-Modal

Considering the increasing popularity of sensors and cameras, the multi-modal matching of images is a growing demand in many applications. We selected some of the most common examples: the combination of thermal and visible imagery for a building (Figure 6a); scanning electron microscopy (SEM) images, including a backscattered electrons and secondary electron images of a mineral surface (Figure 6b); the combination of visible and range imagery from a laser scanner (Figure 6c); the combination of visible and thermal for aerial imagery (Figure 6d); satellite imagery with different wavelengths, where two images were synthetically derived by applying geometric and radiometric distortions to the other two images (Figure 6e); Magnetic Resonance Imaging (MRI) with different visualization parameters, used to highlight different tissues and synthetically derived images (Figure 6f).
For the first case (Figure 6a), the matching was carried out for a visible and a thermal image of a building for its energetic inspection. The second case (Figure 6b) is composed of two SEM images: an imaging technique used to analyse the surface of a sample at very high magnifications, used in various scientific fields such as materials science, geology, archaeology and biology to gain insight into the structure and composition of a sample. The third case (Figure 6c) corresponds to a visible and a range image of a heritage building for its 3D reconstruction and texture mapping. The resulting matching can be used to improve the registration between the camera (visible) and the laser (range), and then to map the high-resolution texture coming from the visible imagery into the 3D point cloud coming from the laser scanner. The fourth case (Figure 6d) combines visible and thermal aerial images of a city area using a drone; this type of aerial image can be used for the estimation of land surface temperature or for the study and mitigation of urban heat islands, among other applications. The fifth case (Figure 6e) is composed of two satellite images taken with different sensors and the other two are synthetically derived from the original ones; in this case, the registration is important for automatic georeferencing. The sixth case (Figure 6f) is also composed of four images: two of them are medical resonance images taken using different parameters and the other two are synthetically derived images. Synthetic images represent possible processing and acquisition modifications by the application of geometric (rotation, scale, perspective) and radiometric (brightness, hue and addition of random noise) changes.
The first (Figure 6a) and third (Figure 6c) multi-modal image pairs contain non-coplanar points; therefore, the evaluation of the matches needs to be carried out using the fundamental matrix. For the rest of the multimodal datasets, the points in the images could be considered totally coplanar, with homography being the best method for their assessment.

3.3. Feature-Based Image Matching Strategies

The process carried out for each dataset consists of three steps: (i) pre-processing, (ii) feature extraction and (iii) matching (Figure 2).
All images were pre-processed by applying decolorization (Figure 2a). Pre-processing is reported as a fundamental step by different authors [21,59]. Decolorization is the simplest pre-processing algorithm provided by PhotoMatch and is commonly used prior to image matching [60].
For the feature extraction step (Figure 2b), many algorithms are provided by PhotoMatch, while a selection of the most representative ones was tested. To this end, hand-crafted methods were identified based on the best results obtained in previous tests [21]. The following combinations of detector and descriptor were assessed: SIFT + SIFT, SURF + SURF, SURF + SIFT, MSD + SIFT and ASIFT. In addition, both deep learning algorithms included in PhotoMatch, R2D2 and D2-Net, were also tested.
For hand-crafted algorithms, the following parameters were selected in PhotoMatch: the maximum number of features was set to 5000; for MSD, the threshold saliency was set to 650, and the number of selected points (KNN) was set to 1. The saliency threshold is linked to the level of dissimilarity between neighboring pixels and should be higher for images with a higher level of detail. KNN refers to the number of salience points considered; in this case, only the points with higher saliency were selected. The reason for selecting these parameters was based on their good performance after different tests, especially for the case of multi-modal images [21].
For the learning-based algorithms, the input parameters were based on choosing among the different pretrained models. Alternatives were tested, and the best pretrained models were chosen. For R2D2, the pretrained model ‘r2d2_WASF_N16′ was used, while for D2-Net, the pretrained model ‘d2_tf’ was selected. The choice of these models was based on information provided by the developers of each tool. However, since the models were trained using different datasets, different models may have different outcomes. Therefore, it is recommended to test various options for each specific application.
The selected matching approach (Figure 2c) was the same for all algorithms, since its accuracy and reliability was tested in previous studies [21]. It consisted of FLANN and Robust Matching, supported by ratio test, cross-checking and geometric test (fundamental matrix or homography computed by RANSAC). The RANSAC filtering was carried out using a Lowe ratio test with a value of 2 [61], a distance threshold of 10, and 2000 maximum trials. The homography and fundamental matrices were used to achieve self-supervised validation while supporting the relative orientation backbone. The value of the Lowe ratio test refers to the minimum distance between the two best matches for each keypoint; if the distance is below the threshold, the matches are considered too similar and the keypoint is removed. The distance threshold in RANSAC filtering is used to distinguish inliers from outliers; a higher value would be needed if the dataset is composed of matches with a relatively high error, while more precise algorithms would benefit from lower values. The maximum number of trials controls the trade-off between computational complexity and accuracy.
Detailed information on the different parameters for each algorithm is presented in the help section of the tool (Figure 4).

3.4. Assessment

PhotoMatch provides a reference data editor (Figure 3) that allows for the end-user to select the reference keypoints with subpixel accuracy and compute the error for each point using the homography or fundamental matrix adjustment. Using this reference data editor, each imagery dataset was registered using a set of at least 12 manually selected keypoints and their corresponding matchings. The maximum error for these points was below one pixel for all image pairs.
Once the reference keypoints and matchings are defined, PhotoMatch computes the homography or fundamental matrix transformation between each pair of images. After the keypoints are extracted by each algorithm (detector and descriptor), their coordinates are evaluated through comparison with the reference coordinates obtained via homography, or by computing the distance between each point and the line determined by the collinearity condition in the case of a fundamental matrix transformation (Table 1 and Table 2).

3.5. Results

The multi-view and multi-modal datasets were assessed separately. For each dataset, the number of correct matches, percentage of correct matches, and mean error of the matches for the different methodologies (hand-crafted vs. learning-based) are presented. The threshold established for a correct matching was set to 10 px, which is relatively high for precise photogrammetry applications, but can provide a better insight into the approcimate matching ability of the algorithms.

3.5.1. Multi-View

The results for each case and image matching are outlined in Table 1.
For the first four multi-view datasets (Figure 5a–d), all of them corresponding to non-planar environments, R2D2 was the best algorithm in terms of accuracy, while ASIFT was able to obtain a higher number of matches with a lower accuracy. The exception was the boulder multi-view dataset (Figure 5d), where ASIFT achieved the highest accuracy, as the environment does not represent important challenges for matching. For the façade’s multi-view dataset (Figure 5a), none of the algorithms (hand-crafted and learning-based) were able to obtain acceptable results as a consequence of the low overlap and repetitive features. Only R2D2 provided the best result, with 52.5% of correct matches (Table 1).
The fifth multi-view dataset (Figure 5e) represents a favourable photogrammetric acquisition with high overlap and low geometric differences. In this case, the hand-crafted algorithms outperform learning-based algorithms, in terms of both accuracy and the number of correct matches (Table 1).
For the last multi-view dataset (Figure 5f), with images with considerable geometric differences covering a wall, ASIFT was the only hand-crafted algorithm capable of computing a high number of accurate matches. Neither the other hand-crafted algorithms, nor the learning-based algorithms, provided acceptable results (Table 1).
Although the performance of hand-crafted methods is guaranteed for multi-view datasets with high overlap and favourable conditions, for challenging environments (i.e., important geometric variations) the image matching is not always successful. The experimental results show that some learning-based algorithms, such as R2D2, are capable of outperforming classical, hand-crafted methods for challenging datasets with low overlap and low-resolution images. Due to its capacity to avoid areas with low reliability, R2D2 outperforms the accuracy of other algorithms for the facade and forest dataset, which are characterized by repetitive features (i.e., windows and canopy). However, ASIFT, which is specifically designed to deal with large perspective distortions, was the only algorithm capable of registering the images in the graffiti dataset with high geometric differences (Figure 5f). This is probably due to the lack of training of the chosen matching learning algorithms for this particular case. It is also worth noting that ASIFT is a technique that simulates different affine distortions to the images, and a similar technique can work with different detectors and descriptors, so the combination of ASFIT and learning-based algorithms would be possible.
In order to evaluate this tool in comparison to other commercial and open-source software, a 3D reconstruction for each multi-view dataset was carried out using Agisoft Metashape 2.0.1 and GRAPHOS [1]. Acceptable results were obtained only for the fifth multi-view dataset (Graffiti with low differences, Figure 5e), while both software failed to compute a 3D reconstruction for the rest of the datasets.

3.5.2. Multi-Modal

The results of the multi-modal dataset are outlined in Table 2. The learning-based algorithms outperform the hand-crafted based algorithms for every dataset. D2-Net is the best-performing algorithm for every case, with the exception of the visible thermal aerial, where R2D2 obtains the highest accuracy. For the visible-range dataset, no acceptable results were obtained using any of the tested algorithms. For the visible-thermal dataset, the mean error was above the threshold, even for the D2-Net algorithm.
The hand-crafted algorithms performed much worse than learning-based algorithms. They were capable of obtaining a mean error below the threshold of ten pixels in only one case (SURF + SIFT for the magnetic resonance dataset).
Learning-based algorithms are shown to be a suitable approach for multimodal image matching for different datasets and applications. An algorithm such as D2-Net has been able to achieve good results for the majority of the presented datasets. Nevertheless, the difference in results for different types of images encourages the study and comparison of different approaches and parameters for any specific application requiring multimodal image matching.
The final matchings obtained for the two best-performing algorithms for each multi-modal dataset can be analysed in Figure 7.
The combination of different hand-crafted algorithms could be useful for some types of multi-modal data [21]. Nevertheless, some learning-based algorithms greatly outperform hand-crafted methods in multi-modal cases, being able to obtain acceptable results when hand-crafted algorithms fail.
In general, the experimental results presented in this paper demonstrate the great variability of results for different approaches and with different case studies. This highlights the importance of offering an educational and open-source tool, PhotoMatch, to compare and assess different algorithms through an experimental evaluation of learning-based and hand-crafted algorithms to better understand their performance across a wide range of scenarios.

4. Conclusions

A growing number of detectors, descriptors, and matching algorithms are available to extract and match keypoints between images. The most important distinction can be made between hand-crafted and learning-based feature-extraction methods. Some of these algorithms for keypoint extraction and matching are well-known and available in different libraries, such as OpenCV, or integrated into SfM tools. Other algorithms require expertise in dealing with source code and programming, and sometimes the use of external libraries. All of them are too abstract to be understood by end-users, requiring the setup of advanced parameters.
Despite the large quantity of available options provided in the scientific community, there are no educational and open-source multi-view and multi-modal image-matching tools to date, which allow for a comparative assessment of hand-crafted and learning-based algorithms.
In real-world problems (e.g., 3D reconstruction, image registration for the analysis of different wavelengths, SLAM or digital correlations between 3D and 2D data for applications such as material deformation analysis), selecting the best-matching algorithm and optimal parameters for a specific application is a time-consuming process requiring very specialised knowledge and is not integrated into the existing tools. This situation can easily lead to the adoption of not-optimal solutions and certainly hampers the adoption of new methodologies.
PhotoMatch provides a solution to this bottleneck, integrating hand-crafted and learning-based algorithms for comparing and assessing feature-based image matching, with special attention to multi-view and multi-modal imagery. PhotoMatch allows for students, researchers, and other end-users to compare and assess different matching methodologies through an educational and friendly environment, and thus to find the best algorithms for different applications. The different case studies exhibit the capabilities of PhotoMatch and its possibility to offer an accurate and reliable input for image orientation and 3D reconstruction. The results also highlight how different combinations of algorithms and setup parameters can lead to significant changes in the validity of the results.
Of course, PhotoMatch was conceived to support future developments, so future work will include the addition of new deep learning algorithms [36,40,61], as well as new detectors and descriptors [62,63,64]. These additions will be added to new release versions or presented as plugins. This will allow PhotoMatch to present a wider array of algorithm combinations for the assessment of the different approaches, while maintaining its educational goal and ease of use.

Author Contributions

Conceptualization, D.G.-A., F.R., P.R.-G. and D.H.-L.; methodology, E.R.d.O. and I.B.-G.; software, E.R.d.O.; validation, I.B.-G.; investigation, D.G.-A., F.R., P.R.-G. and D.H.-L.; writing—original draft preparation, I.B.-G.; writing—review and editing, E.R.d.O., I.B.-G., D.G.-A., F.R. and P.R.-G.; supervision, D.G.-A. All authors have read and agreed to the published version of the manuscript.

Funding

This research received no external funding.

Institutional Review Board Statement

Not applicable.

Informed Consent Statement

Not applicable.

Data Availability Statement

The PhotoMatch Installer and the source code are available on https://github.com/TIDOP-USAL/PhotoMatch/releases.

Conflicts of Interest

The authors declare no conflict of interest.

References

  1. Gonzalez-Aguilera, D.; López-Fernández, L.; Rodriguez-Gonzalvez, P.; Hernandez-Lopez, D.; Guerrero, D.; Remondino, F.; Menna, F.; Nocerino, E.; Toschi, I.; Ballabeni, A.; et al. GRAPHOS—Open-Source Software for Photogrammetric Applications. Photogramm. Rec. 2018, 33, 11–29. [Google Scholar] [CrossRef]
  2. Dai-Hong, J.; Lei, D.; Dan, L.; San-You, Z. Moving-Object Tracking Algorithm Based on PCA-SIFT and Optimization for Underground Coal Mines. IEEE Access 2019, 7, 35556–35563. [Google Scholar] [CrossRef]
  3. Dalal, N.; Triggs, B. Histograms of Oriented Gradients for Human Detection. In Proceedings of the 2005 IEEE Computer Society Conference on Computer Vision and Pattern Recognition (CVPR’05), San Diego, CA, USA, 20–25 June 2005; Volume 1, pp. 886–893. [Google Scholar]
  4. Fiaz, M.; Mahmood, A.; Javed, S.; Jung, S.K. Handcrafted and Deep Trackers: Recent Visual Object Tracking Approaches and Trends. ACM Comput. Surv. 2020, 52, 1–44. [Google Scholar] [CrossRef]
  5. Luo, W.; Xing, J.; Milan, A.; Zhang, X.; Liu, W.; Kim, T.-K. Multiple Object Tracking: A Literature Review. Artif. Intell. 2021, 293, 103448. [Google Scholar] [CrossRef]
  6. Pal, S.K.; Pramanik, A.; Maiti, J.; Mitra, P. Deep Learning in Multi-Object Detection and Tracking: State of the Art. Appl. Intell. 2021, 51, 6400–6429. [Google Scholar] [CrossRef]
  7. Wohlhart, P.; Lepetit, V. Learning Descriptors for Object Recognition and 3D Pose Estimation. In Proceedings of the 2015 IEEE Conference on Computer Vision and Pattern Recognition (CVPR), Boston, MA, USA, 7–12 June 2015; pp. 3109–3118. [Google Scholar]
  8. Granshaw, S.I. Editorial: Imaging Technology 1430–2015: Old Masters to Mass Photogrammetry. Photogramm. Rec. 2015, 30, 255–260. [Google Scholar] [CrossRef]
  9. Morales, A.; González-Aguilera, D.; Gutiérrez, M.A.; López, I. Energy Analysis of Road Accidents Based on Close-Range Photogrammetry. Remote Sens. 2015, 7, 15161–15178. [Google Scholar] [CrossRef]
  10. Nocerino, E.; Lago, F.; Morabito, D.; Remondino, F.; Porzi, L.; Poiesi, F.; Rota Bulo, S.; Chippendale, P.; Locher, A.; Havlena, M.; et al. A Smartphone-Based 3D Pipeline for the Creative Industry—The Replicate EU Project. Int. Arch. Photogramm. Remote Sens. Spatial Inf. Sci. 2017, XLII-2-W3, 535–541. [Google Scholar] [CrossRef]
  11. Ortiz-Sanz, J.; Gil-Docampo, M.; Rego-Sanmartín, T.; Arza-García, M.; Tucci, G. A PBeL for Training Non-Experts in Mobile-Based Photogrammetry and Accurate 3-D Recording of Small-Size/Non-Complex Objects. Measurement 2021, 178, 109338. [Google Scholar] [CrossRef]
  12. Remondino, F.; Nocerino, E.; Toschi, I.; Menna, F. A Critical Review of Automated Photogrammetric Processing of Large Datasets. Int. Arch. Photogramm. Remote Sens. Spatial Inf. Sci. 2017, XLII-2-W5, 591–599. [Google Scholar] [CrossRef]
  13. Rahaman, H.; Champion, E. To 3D or Not 3D: Choosing a Photogrammetry Workflow for Cultural Heritage Groups. Heritage 2019, 2, 1835–1851. [Google Scholar] [CrossRef]
  14. Jiang, X.; Ma, J.; Xiao, G.; Shao, Z.; Guo, X. A Review of Multimodal Image Matching: Methods and Applications. Inf. Fusion 2021, 73, 22–71. [Google Scholar] [CrossRef]
  15. Pamart, A.; Morlet, F.; De Luca, L.; Veron, P. A Robust and Versatile Pipeline for Automatic Photogrammetric-Based Registration of Multimodal Cultural Heritage Documentation. Remote Sens. 2020, 12, 2051. [Google Scholar] [CrossRef]
  16. Wei, Z.; Han, Y.; Li, M.; Yang, K.; Yang, Y.; Luo, Y.; Ong, S.-H. A Small UAV Based Multi-Temporal Image Registration for Dynamic Agricultural Terrace Monitoring. Remote Sens. 2017, 9, 904. [Google Scholar] [CrossRef]
  17. Kang, J.K.; Hoang, T.M.; Park, K.R. Person Re-Identification Between Visible and Thermal Camera Images Based on Deep Residual CNN Using Single Input. IEEE Access 2019, 7, 57972–57984. [Google Scholar] [CrossRef]
  18. Kniaz, V.V.; Knyaz, V.A.; Hladuvka, J.; Kropatsch, W.G.; Mizginov, V. ThermalGAN: Multimodal Color-to-Thermal Image Translation for Person Re-Identification in Multispectral Dataset; Springer: Cham, Switzerland, 2018; pp. 606–624. [Google Scholar]
  19. Remondino, F.; Menna, F.; Morelli, L. Evaluating Hand-Crafted and Learning-Based Features for Photogrammetric Applications. Int. Arch. Photogramm. Remote Sens. Spat. Inf. Sci. 2021, XLIII-B2-2021, 549–556. [Google Scholar] [CrossRef]
  20. Ma, J.; Jiang, X.; Fan, A.; Jiang, J.; Yan, J. Image Matching from Handcrafted to Deep Features: A Survey. Int. J. Comput. Vis. 2021, 129, 23–79. [Google Scholar] [CrossRef]
  21. González-Aguilera, D.; Ruiz De Oña, E.; López-Fernandez, L.; Farella, E.M.; Stathopoulou, E.K.; Toschi, I.; Remondino, F.; Rodríguez-Gonzálvez, P.; Hernández-López, D.; Fusiello, A.; et al. PHOTOMATCH: An Open-Source Multi-View and Multi-Modal Feature Matching Tool for Photogrammetric Applications. Int. Arch. Photogramm. Remote Sens. Spat. Inf. Sci.-ISPRS Arch. 2020, 43, 213–219. [Google Scholar] [CrossRef]
  22. Muja, M.; Lowe, D.G. Flann, Fast Library for Approximate Nearest Neighbors. In International Conference on Computer Vision Theory and Applications (VISAPP’09); INSTICC Press: Setúbal, Portugal, 2009; Volume 3. [Google Scholar]
  23. Hartley, R.; Zisserman, A. Multiple View Geometry in Computer Vision; Cambridge University Press: Cambridge, UK, 2003; ISBN 978-0-521-54051-3. [Google Scholar]
  24. Zitová, B.; Flusser, J. Image Registration Methods: A Survey. Image Vis. Comput. 2003, 21, 977–1000. [Google Scholar] [CrossRef]
  25. Chen, L.; Rottensteiner, F.; Heipke, C. Feature Detection and Description for Image Matching: From Hand-Crafted Design to Deep Learning. Geo-Spat. Inf. Sci. 2021, 24, 58–74. [Google Scholar] [CrossRef]
  26. Lowe, D.G. Distinctive Image Features from Scale-Invariant Keypoints. Int. J. Comput. Vis. 2004, 60, 91–110. [Google Scholar] [CrossRef]
  27. Arandjelović, R.; Zisserman, A. Three Things Everyone Should Know to Improve Object Retrieval. In Proceedings of the 2012 IEEE Conference on Computer Vision and Pattern Recognition, Providence, RI, USA, 16–21 June 2012; pp. 2911–2918. [Google Scholar]
  28. Bay, H.; Tuytelaars, T.; Van Gool, L. SURF: Speeded up Robust Features. In Lecture Notes in Computer Science; Springer: Berlin/Heidelberg, Germany, 2006; Volume 3951, pp. 404–417. [Google Scholar] [CrossRef]
  29. Tombari, F.; Di Stefano, L. Interest Points via Maximal Self-Dissimilarities. In Lecture Notes in Computer Science; Springer: Cham, Switzerland, 2015; Volume 9004, pp. 586–600. [Google Scholar] [CrossRef]
  30. Yu, K.; Zheng, X.; Duan, Y.; Fang, B.; An, P.; Ma, J. NCFT: Automatic Matching of Multimodal Image Based on Nonlinear Consistent Feature Transform. IEEE Geosci. Remote Sens. Lett. 2022, 19, 1–5. [Google Scholar] [CrossRef]
  31. Long, G.; Kneip, L.; Alvarez, J.M.; Li, H.; Zhang, X.; Yu, Q. Learning Image Matching by Simply Watching Video. In Proceedings of the Computer Vision—ECCV 2016, Amsterdam, The Netherlands, 11–14 October 2016; Leibe, B., Matas, J., Sebe, N., Welling, M., Eds.; Springer International Publishing: Cham, Switzerland, 2016; pp. 434–450. [Google Scholar]
  32. Christiansen, P.H.; Kragh, M.F.; Brodskiy, Y.; Karstoft, H. UnsuperPoint: End-to-End Unsupervised Interest Point Detector and Descriptor. arXiv 2019, arXiv:1907.04011. [Google Scholar]
  33. Ono, Y.; Trulls, E.; Fua, P.; Moo Yi, K. LF-Net: Learning Local Features from Images. In Proceedings of the 32nd International Conference on Neural Information Processing Systems, Montréal, QC, Canada, 3–8 December 2018. [Google Scholar]
  34. Image Matching Challenge—2021 Edition. Available online: https://www.cs.ubc.ca/research/image-matching-challenge/current/ (accessed on 11 October 2022).
  35. Chen, H.; Luo, Z.; Zhou, L.; Tian, Y.; Zhen, M.; Fang, T.; Mckinnon, D.; Tsin, Y.; Quan, L. ASpanFormer: Detector-Free Image Matching with Adaptive Span Transformer. In Proceedings of the 17th European Conference, Tel Aviv, Israel, 23 October 2022. [Google Scholar]
  36. Sarlin, P.-E.; DeTone, D.; Malisiewicz, T.; Rabinovich, A. SuperGlue: Learning Feature Matching With Graph Neural Networks. In Proceedings of the 2020 IEEE/CVF Conference on Computer Vision and Pattern Recognition (CVPR), Seattle, WA, USA, 13–19 June 2020; pp. 4938–4947. [Google Scholar]
  37. DeTone, D.; Malisiewicz, T.; Rabinovich, A. SuperPoint: Self-Supervised Interest Point Detection and Description. In Proceedings of the 2018 IEEE/CVF Conference on Computer Vision and Pattern Recognition Workshops (CVPRW), Salt Lake City, UT, USA, 18–22 June 2018; pp. 224–236. [Google Scholar]
  38. Sun, J.; Shen, Z.; Wang, Y.; Bao, H.; Zhou, X. LoFTR: Detector-Free Local Feature Matching With Transformers. In Proceedings of the 2021 IEEE/CVF Conference on Computer Vision and Pattern Recognition (CVPR), Nashville, TN, USA, 20–25 June 2021; pp. 8922–8931. [Google Scholar]
  39. Edstedt, J.; Athanasiadis, I.; Wadenbäck, M.; Felsberg, M. DKM: Dense Kernelized Feature Matching for Geometry Estimation. arXiv 2022, arXiv:2202.00667. [Google Scholar]
  40. Tyszkiewicz, M.; Fua, P.; Trulls, E. DISK: Learning Local Features with Policy Gradient. In Advances in Neural Information Processing Systems; Curran Associates, Inc.: Red Hook, NY, USA, 2020; Volume 33, pp. 14254–14265. [Google Scholar]
  41. Bellavia, F.; Colombo, C.; Morelli, L.; Remondino, F. Challenges in Image Matching for Cultural Heritage: An Overview and Perspective. In Image Analysis and Processing; ICIAP 2022 Workshops; Mazzeo, P.L., Frontoni, E., Sclaroff, S., Distante, C., Eds.; Springer International Publishing: Cham, Switzerland, 2022; pp. 210–222. [Google Scholar]
  42. Verdie, Y.; Yi, K.; Fua, P.; Lepetit, V. TILDE: A Temporally Invariant Learned DEtector. In Proceedings of the IEEE Conference on Computer Vision and Pattern Recognition, Boston, MA, USA, 7–12 June 2015; pp. 5279–5288. [Google Scholar]
  43. Dusmanu, M.; Rocco, I.; Pajdla, T.; Pollefeys, M.; Sivic, J.; Torii, A.; Sattler, T. D2-Net: A Trainable CNN for Joint Description and Detection of Local Features. In Proceedings of the IEEE Computer Society Conference on Computer Vision and Pattern Recognition, Long Beach, CA, USA, 15–20 June 2019; Volume 2019, pp. 8084–8093. [Google Scholar]
  44. Revaud, J.; Weinzaepfel, P.; De Souza, C.; Pion, N.; Csurka, G.; Cabon, Y.; Humenberger, M. R2D2: Repeatable and Reliable Detector and Descriptor. In Proceedings of the Conference on Neural Information Processing Systems (NeurIPS), Vancouver, BC, Canada, 8–14 December 2019; Volume 32. [Google Scholar] [CrossRef]
  45. ISPRS Scientific Initiatives. Available online: https://www.isprs.org/society/si/SI-2019/default.aspx (accessed on 9 August 2022).
  46. Gaiani, M.; Apollonio, F.I.; Ballabeni, A.; Remondino, F. Securing Color Fidelity in 3D Architectural Heritage Scenarios. Sensors 2017, 17, 2437. [Google Scholar] [CrossRef]
  47. Lu, C.; Xu, L.; Jia, J. Contrast Preserving Decolorization with Perception-Based Quality Metrics. Int. J. Comput. Vis. 2014, 110, 222–239. [Google Scholar] [CrossRef]
  48. Lal, S.; Chandra, M. Efficient Algorithm for Contrast Enhancement of Natural Images. Int. Arab J. Inf. Technol. 2014, 11, 95–102. [Google Scholar]
  49. Abdullah-Al-Wadud, M.; Kabir, M.D.H.; Akber Dewan, M.A.; Chae, O. A Dynamic Histogram Equalization for Image Contrast Enhancement. IEEE Trans. Consum. Electron. 2007, 53, 593–600. [Google Scholar] [CrossRef]
  50. Liu, Y.-F.; Guo, J.-M.; Lai, B.-S.; Lee, J.-D. High Efficient Contrast Enhancement Using Parametric Approximation. In Proceedings of the 2013 IEEE International Conference on Acoustics, Speech and Signal Processing, Vancouver, BC, Canada, 26–31 May 2013; pp. 2444–2448. [Google Scholar]
  51. Kim, M.; Chung, M.G. Recursively Separated and Weighted Histogram Equalization for Brightness Preservation and Contrast Enhancement. IEEE Trans. Consum. Electron. 2008, 54, 1389–1397. [Google Scholar] [CrossRef]
  52. Wallis, K.F. Seasonal Adjustment and Relations between Variables. J. Am. Stat. Assoc. 1974, 69, 18–31. [Google Scholar] [CrossRef]
  53. Alcantarilla, P.; Nuevo, J.; Bartoli, A. Fast Explicit Diffusion for Accelerated Features in Nonlinear Scale Spaces. In Proceedings of the British Machine Vision Conference 2013; British Machine Vision Association: Bristol, UK, 2013; pp. 13.1–13.11. [Google Scholar]
  54. Morel, J.-M.; Yu, G. ASIFT: A New Framework for Fully Affine Invariant Image Comparison. SIAM J. Imaging Sci. 2009, 2, 438–469. [Google Scholar] [CrossRef]
  55. Leutenegger, S.; Chli, M.; Siegwart, R.Y. BRISK: Binary Robust Invariant Scalable Keypoints. In Proceedings of the 2011 International Conference on Computer Vision, Barcelona, Spain, 6–13 November 2011; pp. 2548–2555. [Google Scholar]
  56. Bian, J.; Lin, W.-Y.; Matsushita, Y.; Yeung, S.-K.; Nguyen, T.-D.; Cheng, M.-M. GMS: Grid-Based Motion Statistics for Fast, Ultra-Robust Feature Correspondence. In Proceedings of the 2017 IEEE Conference on Computer Vision and Pattern Recognition (CVPR), Honolulu, HI, USA, 21–26 July 2017; pp. 4181–4190. [Google Scholar]
  57. Hamming, R.W. Error Detecting and Error Correcting Codes. Bell Syst. Tech. J. 1950, 29, 147–160. [Google Scholar] [CrossRef]
  58. Poursaeed, O.; Yang, G.; Prakash, A.; Fang, Q.; Jiang, H.; Hariharan, B.; Belongie, S. Deep Fundamental Matrix Estimation without Correspondences. In Proceedings of the Computer Vision—ECCV 2018 Workshops, Munich, Germany, 8–14 September 2018. [Google Scholar]
  59. Aicardi, I.; Nex, F.; Gerke, M.; Lingua, A.M. An Image-Based Approach for the Co-Registration of Multi-Temporal UAV Image Datasets. Remote Sens. 2016, 8, 779. [Google Scholar] [CrossRef]
  60. Ancuti, C.O.; Ancuti, C.; Bekaert, P. Decolorizing Images for Robust Matching. In Proceedings of the 2010 IEEE International Conference on Image Processing, Hong Kong, China, 26–29 September 2010; pp. 149–152. [Google Scholar]
  61. Luo, Z.; Zhou, L.; Bai, X.; Chen, H.; Zhang, J.; Yao, Y.; Li, S.; Fang, T.; Quan, L. ASLFeat: Learning Local Features of Accurate Shape and Localization. In Proceedings of the 2020 IEEE/CVF Conference on Computer Vision and Pattern Recognition (CVPR), Los Alamitos, CA, USA, 13–19 June 2020; pp. 6589–6598. [Google Scholar]
  62. Mishchuk, A.; Mishkin, D.; Radenovic, F.; Matas, J. Working Hard to Know Your Neighbor’ s Margins: Local Descriptor Learning Loss. In Proceedings of the Advances in Neural Information Processing Systems, Long Beach, CA USA, 4–9 December 2017; Volume 30. [Google Scholar]
  63. Truong, P.; Apostolopoulos, S.; Mosinska, A.; Stucky, S.; Ciller, C.; Zanet, S.D. GLAMpoints: Greedily Learned Accurate Match Points. In Proceedings of the 2019 IEEE/CVF International Conference on Computer Vision (ICCV), Seoul, Republic of Korea, 27 October–2 November 2019; pp. 10732–10741. [Google Scholar]
  64. Singh Parihar, U.; Gujarathi, A.; Mehta, K.; Tourani, S.; Garg, S.; Milford, M.; Krishna, K.M. RoRD: Rotation-Robust Descriptors and Orthographic Views for Local Feature Matching. In Proceedings of the 2021 IEEE/RSJ International Conference on Intelligent Robots and Systems (IROS), Prague, Czech Republic, 27 September–1 October 2021; pp. 1593–1600. [Google Scholar]
Figure 1. PhotoMatch pipeline, including a list of available algorithms/options for each step.
Applsci 13 05467 g001
Figure 2. Selection of parameters for preprocessing (a), feature extraction (b) and matching (c) in PhotoMatch. The help menu provides educational support for each advanced parameter.
Applsci 13 05467 g002
Figure 3. Reference data editor in PhotoMatch with subpixel accuracy.
Applsci 13 05467 g003
Figure 4. An example of an educational section in PhotoMatch applied to the SIFT algorithm [26].
Applsci 13 05467 g004
Figure 5. Multi-view datasets: façade (a), forest (b), playground (c), boulder (d), graffiti with small geometric differences (e) and graffiti with large geometric differences (f).
Applsci 13 05467 g005
Figure 6. Multi-modal datasets: visible thermal imagery for a building (a), SEM images of a bone (b), visible range imagery (c), visible thermal aerial imagery (d), satellite imagery with different wavelengths and synthetically derived images (e), magnetic resonance images with different visualization parameters and synthetically derived images (f).
Applsci 13 05467 g006
Figure 7. Matchings resulting in the best-performing algorithms for each multi-modal dataset.
Applsci 13 05467 g007
Table 1. Number of correct matches (CM) with percentage and mean error (ME) (in px) for the different hand-crafted and learning-based algorithms and the six multi-view datasets. The best results are highlighted in bold.
Detector
Descriptor
SIFT +
SIFT
SURF + SURFSURF + SIFTMSD +
SIFT
ASIFTR2D2D2-NET
Facade (Figure 5a)CM24 (27.2%)26 (22.7%)47 (33.7%)19 (34.8%)190 (27.8%)68 (52.5%)27 (32.7%)
ME (px)175.1170.6163.8123.2172.2110.5176.9
Forest (Figure 5b)CM108 (79.4%)89 (71.2%)139 (80.7%)77 (80.6%)1155 (86.4%)187 (94.1%)123 (89.1%)
ME (px)19.221.18.98.713.54.16.3
Playground (Figure 5c)CM8 (36.9%)51 (57.2%)60 (60.7%)30 (65.6%)214 (74.2%)47 (80.5%)49 (69.2%)
ME (px)607.8224.666.540.6137.526.345.9
Boulder (Figure 5d)CM150 (80.1%)261 (83.2%)283 (86.4%)24 (77.8%)551 (98.8%)322 (96.1%)533 (91.4%)
ME (px)50.949.930.3163.512.629.820.3
Graffiti low differences (Figure 5e)CM681 (99.9%)613 (99.4%)602 (96.8%)62 (93.3%)8713 (99.9%)241 (98.4%)165 (94.9%)
ME (px)1.22.43.414.41.32.98.0
Graffiti high differences (Figure 5f)CM91 (94.4%)62 (90.9%)50,5 (87.1%)1 (10.3%)2182 (99.8%)2 (38.7%)2 (30%)
ME (px)17.018.631.7241.01.4151.3171.0
Table 2. Number of correct matches (CM) with percentage and mean error (ME) (in px) for the different hand-crafted and learning-based algorithms in the seven multi-modal datasets. The best results are highlighted in bold.
Detector DescriptorSIFT + SIFTSURF + SURFSURF + SIFTMSD + SIFTASIFTR2D2D2-NET
Visible-Thermal
(Figure 6a)
CM0
(0%)
1
(3,2%)
1
(4,2%)
4
(22,2%)
3
(2,9%)
1
(6,25%)
53
(81,54%)
ME (px)273.7143.8172.263.1202.7184.313.7
SEM
(Figure 6b)
CM0
(0%)
0
(0%)
3
(33.3%)
0
(0%)
6
(28.6%)
5
(62.5%)
16
(76.2%)
ME (px)1470.0983.422.0860.01013.410.76.9
Visible-Range (Figure 6c)CM1
(3,3%)
13
(25%)
154
(53,1%)
3
(23,1%)
47
(32,9%)
5
(31,3%)
77
(77,8%)
ME (px)216.9141.934.4136.1140.888.243.4
Visible-Thermal Aerial
(Figure 6d)
CM0
(0%)
3
(30%)
9
(60%)
0
(0%)
26
(86.7%)
17
(100%)
107
(97.3%)
ME (px)383.9159.215.9259.330.73.94.3
Satellite
(Figure 6e)
CM0
(0%)
0
(0%)
7
(41,17%)
9
(75%)
0
(0%)
6
(75%)
135
(95,7)
ME (px)179.1154.616.511.2178.425.34.7
Magnetic
Resonance
(Figure 6f)
CM0
(0%)
0
(0%)
10
(66.7%)
0
(0%)
0
(0%)
5
(16.4%)
44
(92.6%)
ME (px)194.0151.98.2122.9144.130.25.3
Disclaimer/Publisher’s Note: The statements, opinions and data contained in all publications are solely those of the individual author(s) and contributor(s) and not of MDPI and/or the editor(s). MDPI and/or the editor(s) disclaim responsibility for any injury to people or property resulting from any ideas, methods, instructions or products referred to in the content.

