1. Introduction
Built environment has negative impacts on its surroundings and these impacts encourage climate change. Globally, the building stock is responsible for one-third of the total CO
2 emissions and its share of energy use accounts for 40% of the total [
1]. In the European context, for instance, more than a third of buildings were constructed over 50 years ago. With age such buildings show increasing signs of wear and look less appealing to inhabitants [
1]. Study [
2] findings reveal that the renovation of buildings has a significant potential to mitigate urban-related emissions and achieve sustainability goals. In addition to energy savings, sustainable renovation makes buildings better in terms of their economic, social and environmental qualities [
1]. To achieve sustainability, it is also important to consider renovation technologies in the seismic zones [
3]. For instance, Cao et al. [
4] published a state-of-the-art review of retrofitting technologies. They compared the traditional local retrofitting, seismic isolation retrofitting and external sub-structure retrofitting approaches and concluded that an external sub-structure retrofitting technology has numerous advantages.
Numerous systems and tools have been developed worldwide to assist decision makers in the selection of alternative options and scenarios for renovation. Decision support tools are important as professional building owners can use them to set sustainability goals, at the same time as making sure all objectives are achieved across all phases from the design [
5] and all the way through the construction. These tools support decision makers in the selection of renovation measures for a single building or even a portfolio of buildings. Only some of the decision support systems or tools, however, focus on all three dimensions of sustainability, i.e., environmental, economic and social. Nielsen et al. [
5], for instance, published a review of the literature on decision support for sustainable building renovation in pre-design and design phases. They believe the tools can be classified into six areas, where they help to set sustainability goals, determine criteria weights, diagnose buildings, generate alternative design options, estimate the performance and evaluate the design alternatives. The application of building information modelling (BIM) together with decision support systems can increase the success of sustainable solution implementation [
6] in both small- and large-scale projects [
7]. Indeed, for BIM integration with decision support tools facing some challenges, the risks must be evaluated [
8]. The literature review identified 43 decision support tools. Their analysis revealed that the criteria from all three sustainability categories appear in only 40% of the tools. Among the tools, only 63% include social sustainability criteria, the quality of indoor environment is the main choice, 72% include economic sustainability criteria and 81% include the environmental criteria [
5].
Renovation of buildings has a direct impact on the well-being of inhabitants. It is, therefore, important to ensure that any selected renovation measures are acceptable to the stakeholders. The acceptance level on a large scale depends on emotions and it is difficult to measure. Only a few studies in the reviewed literature analyse the emotional aspects of renovation solutions. Polanska and Richard [
9], for instance, studied the emotions of tenants facing forced renovations in Sweden. Wilson et al. [
10] analysed the behaviour of homeowners and factors that explain why homeowners make a decision to renovate. Brosch [
11] argued that emotions can be drivers of climate change perception and action. None of the studies, however, proposed to include emotion recognition in renovation decision support systems or tools.
None of the currently known decision-making systems or tools integrate emotion recognition into renovation solutions. To close the gap the present study proposes an innovative decision-making framework for sustainable renovation solutions, based on emotion recognition, and uses a case study to illustrate its possible application. The problem of the research is the selection of the most efficient sustainable renovation alternatives, based on sustainability criteria and emotional data.
This research aims to propose a methodology and a system that considers the dimensions of sustainability, including emotions, when stakeholders make decisions on renovation alternatives. Objectives of the research: (1) to develop the methodological framework for the assessment of renovation alternatives based on the multiple-criteria assessment, emotion recognition methods and BIM integration; (2) to develop an intelligent decision support system; (3) to apply the system for selection of the sustainable renovation alternatives for the building in Ukraine; (4) to validate the research results; (5) to distinguish the potential future research directions, including new applications for emotion recognition in sustainable construction and renovation projects.
The methodological framework and the decision support system developed as part of this research can be adopted in all stages of renovation from decision making through investigation and design to construction activities. The results of the study can be useful for practitioners and researchers who investigate emotional satisfaction of stakeholders with renovation solutions.
The rest of this study is organised as follows. A literature review is presented in
Section 2 on the tools, methods and systems available for decision making in the field of sustainable renovation.
Section 3 describes the proposed framework for the selection of renovation solutions, including emotion recognition methods.
Section 4 uses the case study of renovation solutions for a building located in Ukraine to demonstrate how the proposed methodology works and how the decision support information can be integrated with the BIM model.
Section 5 presents a discussion and comparisons with the findings of other authors.
Section 6 draws the final conclusion.
2. Literature Review
Recently, many researchers have analysed various sustainable renovation alternatives. Decision support systems or tools were developed to select the most efficient options (see
Table 1).
The literature review reveals that the available methods and tools for sustainable renovation solutions have different aims. For instance, Ismaeel and Mohamed [
12] published an extensive analysis of indoor air quality and Sick Building Syndrome and proposed a system for decision support in sustainable renovation based on structural equation modelling.
Serrano-Jiménez et al. [
13] proposed a multiple-criteria decision support method for housing renovation to evaluate the economic, environmental, technical and social impacts of various renovation strategies.
Some of the tools were designed to ensure energy efficiency or indoor environment comfort. Sharif et al. [
34], for instance, proposed variational autoencoders to generate whole-building renovation scenarios. Their research considered the Total Energy Consumption (TEC) and the Life Cycle Cost (LCC). Salvadó et al. [
20] developed and tested a multiple-criteria decision support system that assists with the choice of refurbishment technologies by assessing the alternatives for the achievement of Near Zero Energy Building (NZEB) targets. Li et al. [
29] proposed a methodology for decision support in the selection of low-carbon refurbishment solutions for apartment blocks in subtropical cities with CO
2 emissions and energy consumption considered. Pombo et al. [
30] used a multi-criteria approach for residential building retrofitting based on life cycle assessment. Zavadskas et al. [
28] applied multi-attribute decision support for achieving near zero-energy buildings, where indoor conditions and energy consumption were considered. Duah and Syal [
16] developed an intelligent decision support system for energy retrofitting (ERIDSS) to support homeowners. This system integrates expert knowledge with quantitative information obtained by using the Delphi method. It includes five knowledge-based modules covering lighting, energy saving and stand-alone measures, heating, cooling, and air conditioning, thermal envelope, and hot water heating, as well as installation solutions.
Other authors have developed sustainable renovation methodologies that integrate the three most important dimensions of sustainability and usually are based on multiple-criteria assessment methods. Serrano-Jiménez et al. proposed a multiple-criteria decision support method to assist with the selection of sustainable and feasible strategies for housing renovation [
21]. Both methods and systems were tested in Sweden. Amorocho and Hartmann [
14] used pairwise comparison and TOPSIS methods to develop a multiple-criteria framework for decision making related to the renovation of residential buildings. The basis of this framework was a hierarchically structured system of economic, social and environmental criteria; two case studies conducted in Spain and related to a five-story building were used to test the framework.
The simplified ‘holistic sustainability decision-making support framework’ developed by Kamari et al. [
18] can assist in all project stages related to building renovation. This tool helps with auditing and renovation design development, as well as building performance information assessment and communication to relevant stakeholders. It can also be used to discover and check essential specific sustainability criteria for renovation. Authors [
19] developed a renovation domain model to express and capture the essential concepts for various renovation options and proposed an innovative support framework for renovation design. A large case study related to a residential building in Denmark was carried out to test the system. Chiang [
24] proposed an RBRCS, or Residential Building Refurbishment Criteria System, and applied the Fuzzy Delphi method, the analytic hierarchy process and the fuzzy logic theory to evaluate the refurbishment performance. The developed method was illustrated by six practical examples in Taiwan.
Khadra et al. [
25] used multiple-criteria-weighted sum decision support methods to select an optimal sustainable renovation alternative in Sweden. Pannier et al. [
23] integrated energy simulations and multi-objective optimisation and proposed a tool to identify priorities in renovation actions. This tool was used in the context of social housing.
Ma et al. [
15] considered the importance of tacit knowledge and multiple objectives in the renovation process. They proposed an intelligent model for decision making in building retrofitting program planning. The authors looked at a few different data mining approaches with 152 retrofitted buildings as examples, and, using the XGBoost algorithm as a basis, constructed a tacit model for knowledge mining. Another integrated tool was developed by Juan et al. [
17]; their decision support system combines an A* graph search algorithm with genetic algorithms for the assessment of existing conditions in office buildings and the recommendation of a set of sustainable renovation actions.
The integration of Building Information Modelling (BIM) and MCDM can improve information management and the decision-making process, together with sustainability, renovation, supply, safety and construction management. Tan et al. [
6] analyse the improvement of the synergy between BIM and MCDM in practice for better decision making. The classification of property for refurbishment or renovation and the collection of data to cover the gaps of incomplete information for decision support is the main aim for both new and old buildings [
35]. In this case, the assessment platform for the application of BIM methodology together with the evolution of expected costs can help to make the right property management decision.
Some researchers suggested the evaluation of sustainable reconstruction solutions with the application of BIM and the analytic hierarchy process (AHP) method [
36] and others used MCDM methods for demolition solutions [
37]. Another application of the BIM and AHP (analytic hierarchy process) methods was analysed by Jalilzadehazhari et al. [
38] as multi-criteria decision-making methods to save building energy consumption and improve building comfort. Stegnar and Cerovšek [
22], utilised BIM to determine energy efficient solutions for office building renovation. To validate their methodology, they carried out a case study related to a building in Brda, Slovenia. Bigger examples of decision-making solutions integrated with building information modelling for large-scale retrofit projects were analysed in China with the main strategic aim to reduce energy consumption and for sustainable development applications [
7].
The identification of BIM project aims is very important for sustainable and BIM projects to deliver waste-efficient buildings [
8] and can ruin projects or can become a barrier for BIM application, even at the whole-country level, which is why BIM risk evaluation is very important. It is possible to use BIM and design solutions for sustainable construction, together with material management [
39], but the project time and cost risks must be evaluated to foresee decision uncertainties. Sanaz Tabatabaee and other researchers [
40] developed the risk assessment prototype (PRAT) to evaluate the risk of BIM implementation in construction. Construction managers can effectively use this hybrid, comprehensive and efficient risk assessment system based on a pairwise comparison of thirty-two risk factors based on Fuzzy analysis methods.
The building restoration/renovation analysis is not only connected with residential or administrative buildings but also with industrial ones and all types of heritage buildings. Pavlovskis and other researchers analysed the possible and most rational refurbishment solutions [
41] for the industrial building using the Weighted Aggregated Sum Product Assessment with Grey Attributes Scores (WASPAS-G) method and application of 3D model-based BIM methodology together with evaluation of life-cycle alternatives. Some authors emphasize that the biggest challenge in the restoration of heritage and historical buildings is authenticity and the lack of information about it, because the records and information can be lost [
42]. Further renovation or restoration processes can be carried out after enormous efforts to restore data based on ancient construction systems, old materials, architectural solutions and archaeological remnants.
Only a few studies focused on the needs of specific stakeholders in renovation process. Serrano-Jiménez et al. [
13] included social concerns and visual changes in multi-criteria decision support. Amorocho and Hartmann [
14] emphasised the important role stakeholders should play in the process of decision making and revealed the importance of social aspects in sustainable renovation solutions. Kamari et al. [
19] evaluated the degree of privacy, the degree of satisfaction, health and well-being. Serrano-Jiménez et al. [
21] addressed the needs of aging populations. None of the studies considered stakeholders’ emotions towards renovation.
The ability to recognize human emotions can be demonstrated by behaviour, speech, facial expressions and physiological cues [
43,
44]. Many theorists and psychologists have included extra emotions in their lists of fundamental emotions that Ekman’s six [
45] did not include. Some separated emotions into tiny groups [
46,
47,
48,
49], emphasising universal sentiments such as fear or anger (as negative emotions) and happiness or love (as positive emotions) [
50]. In terms of recognising human emotions, there are many varied approaches. Asking the user a question, monitoring implicit parameters, speech recognition, facial expression recognition, vital sign detection and gesture recognition can all be used to identify emotions. Additionally, by combining multi-modal emotional signals, hybrid methods have been proposed that combine two or more of these approaches [
51].
There are numerous techniques for recognising emotions that include audio and video information [
52,
53,
54,
55]. Using data collected from ten people during simulated racing settings, Katsis et al. [
56] built a system that has been preliminarily verified for emotion recognition using an automated approach based on multiple biosignals. Support vector machines (SVMs) and an adaptive neuro-fuzzy inference system (ANFIS) were used for the classification. The total classification rates obtained by tenfold cross validation for the SVM and the ANFIS, respectively, were 79.3% and 76.7%.
Ducange et al. [
57] suggested an effective decision support system for social media listening based on cross-source sentiment analysis models. Sent2affect is a particular form of transfer learning for emotional computing that was introduced by Kratzwald et al. [
58]. The output layer is adjusted in this case to perform the task of emotion recognition after the network has been pre-trained for a different objective (in this example, sentiment analysis). The models were trained with the Adam optimizer, and whenever the validation error increased, the operation was terminated. In order to recognize emotions from EEG signals, Algarni et al. [
59] suggested a deep learning-based method. The suggested method outperformed previous methods in terms of accuracy, achieving average accuracy for valence, arousal, and liking of 99.45%, 96.87%, and 99.68%, respectively. This is regarded as a strong performance for the emotion detection model.
A wide range of industries that base the operation of their hardware and machines, human–robot interaction and marketing on human emotional responses need emotion recognition. Solutions that enhance positive emotions can stimulate sustainable renovation actions, and emotional effects can also influence the feelings and perceptions of stakeholders. In addition to structured qualitative interviews, physiological cues can be used to understand consumer emotions. Construction companies should understand the way people feel and what leads to these specific feelings in order to build an emotional connection between the inhabitant and the product and create consumer demand. A new decision-making framework that captures emotion recognition is, therefore, proposed below.
3. Materials and Methods
The present research proposes a new decision-making framework for sustainable building renovation to support the development of renovation projects and report the results to stakeholders. Among social, economic and environmental criteria the focus is on the emotional and biometric data, which allows the evaluation of stakeholder satisfaction with the proposed renovation alternatives. The framework is shown in
Figure 1.
The proposed framework is based on the multiple-criteria decision making. Multiple-criteria decision making (MCDM) is a branch of operations research [
60]. Since the 1960s MCDM tools were extensively applied to solve problems in various fields such as the selection of materials, manufacturing, building design, construction, renovation and sustainability assessment. MCDM methods help to identify the best-performing alternatives according to a set of pre-defined criteria [
61,
62].
The proposed methodology is further described in detail.
Step 1. In the first step, renovation alternatives for a particular building are developed. In the design process, the sustainability of solutions will be considered, such as the reduction of CO2, appropriate thermal insulation, the use of renewable energy resources, the assurance of indoor and outdoor comfort for occupants, and the reduction of waste.
Step 2. Once the renovation alternatives have been determined, the next step is to determine specific evaluation criteria. As discussed previously in the literature review (see
Section 2), all sustainability dimensions, i.e., environmental, economic and social, will be considered. To make the renovation attractive and acceptable for stakeholders it is also important to measure the emotional and physiological reactions of stakeholders to the proposed renovation alternatives; emotional and biometric criteria are, therefore, included in the analysis.
Step 3. Criteria weights are determined in this step. Various methods can be used for this purpose, such as the Delphi method, expert ranking, and AHP. Stakeholders have to select the most appropriate option.
Step 4. The values of criteria are determined in this step, including emotion recognition. Environmental criteria values are determined by means of real-life measurements. Economic criteria (e.g., cost) are determined by calculations. The way emotional and biometric data are determined is discussed in more detail below.
In present research, for the recognition of emotional states, FaceReader 7.1 with an optional remote photoplethysmography module, the X4M200 breath sensor, the FLIP A35SC infrared camera and the 720p FaceTime HD camera in the MacBook Air 2018 was used. FaceReader is a software that can analyse facial expressions in an automated manner and has been modified to recognise the emotions of participants.
The FaceReader used in this study was validated by Lewinski et al. [
63] utilising two publicly available, impartial datasets on fundamental human emotions and assessing the precision of facial expression recognition. For FaceReader, matching results of 89% were reported in 2005. Lewinski et al.’s evaluation of FaceReader version 6.0 revealed that 88% of the emotional labels in the Warsaw Set of Emotional Facial Expression Pictures (WSEFEP) and Amsterdam Dynamic Facial Expression Set (ADFES) were accurately detected. In total, 85% of human emotions could be detected based on the two datasets’ average Facial Action Coding System (FACS) index of agreement, which was 0.69. The accuracy of fundamental emotion recognition by humans was also calculated by Lewinski et al. [
63] for the two datasets, and it was found to be 87% for ADFES and 82% for WSEFEP. These researchers claim that FaceReader has proven to be a reliable predictor of basic emotional expressions over the past 10 years, and that when combined with FACS coding, it may be equally as reliable. Researchers found that FaceReader 6.0 had an overall accuracy rate of 88% for basic emotions. The FaceReader index of agreement is 0.69 for FACS accuracy [
45]. Similar findings have been described in other studies on the reliability and accuracy of FaceReader, as well as their opinions of the device’s maker, Noldus Information Technology. The FLIR A35SC infrared camera has a thermal sensitivity of 0.05 °C and an accuracy of 2% (FLIR). The manufacturer calibrated and checked the camera, and the calibration certificate attested to the accuracy of the measurements. The metrological verification of thermographic cameras is performed once a year to make sure the error rate stays within the limits given by the manufacturer.
Self-reports were also collected from the participants to compare them with those elicited by viewing the sample data. The basis for this software is AI tools that make it possible to detect human reactions and subjective emotions based on input videos or even images. The outputs of the software are usually a series of quantitative data and charts that can be used to interpret underlying emotional states. These data were collected every second during the experiment. The study used these techniques, as well as XeThru technology [
64] and a model-based face modelling method—the Active Appearance Model. This model describes the location of 500 facial key points and the facial texture of the specific area entangled by these points to synthesise an artificial face model. The Facial Action Coding System, the Method of Automatic Facial Expression Recognition, and the Continuous Calibration and Participant methods found in the FaceReader manual [
65] were also used.
Certain requirements are applicable to each set of the equipment:
Internet speed should be at least 600 MB/s. The download speed should be 50 GB/s. A static external IP address is also required.
Enabled network connection is required.
All optimal sites being analysed should be identified. Depersonalised physiological and emotional states of the participants should be taken from a distance of 50 cm.
The emotion model for the renovation project based on the Russel’s circumplex model is presented in
Figure 2. Emotions are triggered by many factors, such as judging an unexpected situation, making a decision, talking about past emotional experiences or observing another person’s emotional reactions. Friesen and Ekman [
66] proposed the main emotions that are common to all people: happy, sad, angry, fear, surprise and disgust. Physiological arousal and the accompanying cognitions related to cues or situational determinants interact to create emotional experience. Facial expression plays an important role in reflecting the way emotional states change. When a unique facial expression is recognised as a certain emotion, this expression reveals that person’s feelings and provides social information.
In addition to the “neutral” state, used as a reference, the software in its classification also includes the baseline definitions of each individual state (total N = 6) targeting “sad”, “happy”, “disgusted”, “fearful”, “surprised” and “angry”. From a practical point of view, the software offers an instant rating of action units (from 0 to 1) related to all emotions that are detected. By quantifying baseline parameters such as arousal, valence, orientation of head, gaze direction, heart rate variability (skin conductance is analysed remotely for that purpose) and a few more personal details of the participants (such as age, sex, beard, whether the person wears glasses) can also provide useful feedback.
In addition to the analysis of facial emotions, heart rate variability (HRV) was measured. HRV is a method where the emotional state is assessed by looking at the measurement of how the interval between successive heartbeats changes, known as variability). This interval is called the “R-R interval” or “interbeat interval” and is measured in milliseconds (see
Figure 3). The parasympathetic and sympathetic nervous systems, the two branches of the autonomic nervous system, work in synergy to regulate HRV. Parasympathetic nerves slow down the heart rate and sympathetic nerves make the heart beat faster. Stress, physical activities and emotions impact these changes [
67].
HRV also depends on gender and age, smoking, coffee, alcohol, blood pressure and excess weight. Depression, glucose levels and infectious agents also play a role. HRV also depends to a considerable extent on hereditary genes. When heart rate variability is low, the person is relaxed, whereas an elevated HRV is a sign of a possible state of mental stress or frustration. An alternative to HRV based on an electrocardiogram is photoplethysmography, which is available in smart bracelets and smart watches (Apple Watch, Xiaomi Mi Smart Band, Huawei, etc.). The main advantage of HRV based on photoplethysmography is that no special human training is needed. A touch on the active surface of the sensor that lasts a few seconds is usually enough. The photoplethysmography method allows non-contact measurement [
69]. This method has certain advantages that make it a viable potential option in many different applications, such as in the field of IoT and human–machine interaction. In the studied cases, when emotion detection needs to be accurate, other techniques should be used instead of the HRV technique, such as FaceReader. Big data analytics methods are a promising option.
The data on HRV was collected by using wearables (see
Figure 4).
To capture the data, a smartphone and wearable device sensors were used. The data gathered in wearable devices first had to be transferred to a smartphone or computer and only then to its final storage. This transfer was carried out using proprietary solutions. An intermediate smartphone or an app can be used for data transferring from the wearable device to a third-party system.
Link 1. A native smartphone app signed up as an event collector in handheld sensors can gather data from the wearable device, which sends new data at certain time intervals to the smartphone. In the studied cases, this is done via Bluetooth.
Link 2. A built-in smartphone application, which periodically checks for internet connection and feeds data to a server when the connection is detected as available. The data gathered from wearable devices is stored in the smartphone app until an internet connection becomes available.
The following criteria were considered for the selection of wearable devices to be used in research:
The market share of its developer. Simple devices are preferrable because of their availability in the market.
The availability of sensors. Algorithms are designed to function with as few sensors as possible, but some sensors are important in indicator calculations. An accelerometer and a heart rate monitor are, therefore, a minimum set of required sensors.
Data transfer options available in the device. There must be some Application Programming Interface or tool that allows to transfer data stored in the device.
Availability and price. From the perspective of sustainable development, affordable and widely available devices were used in the project.
With these criteria in mind, Apple, Xiaomi and some Android Wear devices (such as Huawei) were selected to be used with certain Mi Fit/IHealth and Google Fit apps. These devices are direct access-enabled and allow the transfer of warehouse data. A special app on a computer (Windows/Mac) or smartphone (Android, iOS or Windows) had to be installed to initiate the transfer and synchronise data. The data available to third parties relates to physical activity: heart rate, sleep patterns, skin temperature, walked distance, calories consumed, number of steps, etc.
Data transfer on wearables—indirect access. One option is to install the Mi Fit app on the wearable device and on the smartphone. The selected wearable devices use available transmission modes to provide data for heart rate and skin temperature calculations in real-time. Our data analysis was carried out on a computer.
In this instance, the heart rate measured during the data-gathering period was used to determine the heart rate variability during the decision making. Heart rate variability is a physiological indicator mostly used in medical settings and is associated with mental, emotional and psychological states. HRV is explained through its link with the autonomic nervous system. The relative influence of two of its branches, the sympathetic nervous system and the parasympathetic nervous system, is displayed in an external file that contains a matrix of alternatives, images of buildings, diagrams, illustrations, etc. Cases where the ratio of sympathetic to parasympathetic activity is higher, for instance, have been linked to elevated mental stress. Since a higher heart rate means that sympathetic activity is higher than parasympathetic activity, such a rate is a signal of higher stress. This research explored HRV and its relationship with economic decisions, and these interpretations are based on the idea of mental stress measurement, which is also seen in the existing literature where economic research uses HRV data [
70]. Specifically, decisional stress and heart rate variability reflect mental stress caused by emotions.
Step 5. All information and criteria related to renovation are stored in a BIM integration subsystem (see
Section 4) for analysis of the BIM model parameters of the building, as well as the updating of data after the analysis procedures and multi-criteria assessment. The last two steps in our methodological framework (see
Figure 1) are not final and can initiate a process return loop to the initial steps for better decisions based on continuous multi-criteria assessment of alternatives.
Multi-criteria assessment of alternatives were done using the COPRAS method [
71].
Figure 5 shows the main steps of the method.
Step 6. The ranking of renovation alternatives according to multiple-criteria assessment results to create a Value Map.
4. Case Study
The methodology presented in the previous section was used to develop an intelligent decision support system, which helps to analyse and select the most appropriate renovation alternatives, based on conflicting criteria.
The site selected for the multi-criteria analysis of sustainable renovation project alternatives was in Ukraine and targeted reconstruction of a non-residential building into a residential building. The building is located at street Nizhniy Val, 31-A in the Podilskyi district of Kyiv, in a dense urban development; an urban structure of the district within the Central historical area. It is in the zone of regulation of category I buildings and in the archaeological protection zone, which is an integral part of the memory of monuments and history of local significance “Historical landscape of the Kyiv mountains and valleys of the Dnieper River”, on the territory of the archaeological monument of local significance “Cultural layer of the Podil IX–XVIII centuries”.
The object of study—reconstruction of three floors of a brick building (out of eight floors) with an unambiguous mountain roof type with metal tiles with the maximum public dimensions in terms of 46,940 × 9400 m, which provides a significant amount, performed by LLC “Engineering and Construction” in 2019 (see
Figure 6). The capital building, built before 1917, with load-bearing living and transverse brick walls, 750 mm thick (external) and 620 mm (internal), overlapping over the coconut floor: monolithic on metal beams, over 1–3 floors wooden on wooden beams. Partitions—brick.
The reconstruction is based on the following documents:
Order of the Kyiv City State Administration No. 506 dated 05/26/2016 on the reconstruction of the building on the street Nizhnyi Val, 31-A;
Urban planning conditions and land development restrictions, issued by the Department of Urban Planning and Architecture of the City of Kyiv dated 24 May 2016 No. 456/16/12/2009-16;
Design task;
Extract from the database of the regular cadastral plan dated 2 June 2015;
Topoplan made by the “Kyivgeoinformatics” Institute;
Pre-project proposals developed by Transproekt CJSC;
Other documents.
The project includes the exterior decoration of the house, installation of metal–plastic windows, ventilation (air conditioners), a water supply system and heating and roof tiles, in accordance with the project task. The project does not include the transfer of any structure located on the design site, as well as the removal of the existing greenery.
The data gathered from this site were used to make comparisons between the results of this study and those of similar studies carried out by other authors. In this case study, pollution, physiological parameters of the crowd by age and gender, emotional (anger, sadness, happiness, etc.) and physiological (HRV) states of the participants were measured from September 2020 to September 2021.
The first step was to develop a neuro decision matrix and obtain the initial data for the correlation analysis where the physiological and emotional states of stakeholders from different groups by age and gender were considered. The three categories of criteria are included in the matrix:
Criteria of an energy-efficient and green construction project.
Criteria of local air pollution (CO, NO
2, PM
10, PM
2.5) and noise levels (see
Table 2).
Criteria of the depersonalised emotional and physiological states of participants gathered in the examined site, including the states of sadness, happiness, fear, anger, disgust, surprise, valence and heart rate variability.
4.1. Evaluation of Emotional States
Six Ukrainian real estate organizations were selected and interviewed to obtain a representative sample of the construction industry. The participants were 10 Ukrainian construction specialists who did not suffer from either cardiovascular or obviously mental pathologies, both males and females (41% and 59%, respectively) with an age range of 30–66 (the average age is 38.5 years), Ukrainian nationality, had at least two years of working experience and represented three main categories of property owners in Ukraine (e.g., small, medium-size and large private companies). However, the main attention was paid to organisations that owned rental offices. In total, participating organisations owned about 371 apartments, which corresponds to more than 2.7 thousand square meters of housing. In addition, two organisations also introduced a large number (about 180) of housing and construction cooperatives of different sizes, which are responsible for facility management, in Ukraine. A housing and building cooperative is a society in which each shareholder is a member and all members of the cooperative carry economic responsibility for buildings and real estate. Therefore, the ten organisations chosen formed a relatively high percentage of the total number of housing units in Ukrainian office buildings.
Virtual experimental analysis was based on the study of human behaviour in reconstruction scenarios considering facial expression analysis. For this, FaceReaderTM automatic facial expression recognition software was used. The participants were seated in a room and the survey was conducted from 8 am to 1 pm. A 720p FaceTime HD camera in the 2018 MacBook Air was used for video recording of emotional expressions. Two dimmable panel lamps of 110 W each were used for optimising lighting conditions. During filming, the participants sat on a chair, and the camera was located at a distance of 50 cm from them. The procedure of the experiment was as follows: the participant viewed a set of images of a building, illustrations, diagrams, a matrix of alternatives, etc. Participants had to make some decisions about certain situations in which some offers they could accept or reject. In addition, the participants were told that the proposed solutions related to the following different contexts: economic aspects, simplicity of the construction process, durability of materials, the guarantee period and aesthetic appearance. The participants were instructed to verbalise their feelings in qualitative interviews. Only one participant could take part in the experiment at a time. The duration of the experiment was analysed and recorded using FaceReader to obtain numerical values. The maximum numerical value for each emotion and each participant was extracted to determine emotional differences from renovation projects.
A total of 226,810 valid samples were collected after excluding invalid ones, with 22,890 data in total (249,700 data of viewing the samples by 10 experts). Data on physiological and emotional states, arousal and valence of experts were accumulated. Happiness, sadness, anger and other states were evaluated with points from 0 to 1. The emotion with the highest rating is dominant (see
Table 3).
Measurements were carried out to compare the effect the neutral and six primary emotions of the participants made on the alternatives for the renovation project.
Figure 7 presents the results of facial emotion recognition.
Once every participant’s highest value of each emotion was captured, the data on emotions were imported to run their analysis. The data were compared to identify the source of emotional differences. Sample results on emotional states related to the proposed alternative window options are provided below.
Happiness. The values of happiness have noticeable changes in the facial expression recognition result. The comparisons in
Table 4 show that the participants feel happier with the parameter of noise pollution compared with the number of glazed panes or the number of sealing circuits.
Sadness. The subjects did not have notable changes in sad emotion while viewing the alternative options of windows (see
Table 5).
Anger. The results show that the emotion of anger had low values during the experiment (see
Table 6).
Surprised. Comparisons show that the participants expressed significantly higher surprise while viewing the blocks of price, number of sealing circuits and reliability (see
Table 7).
Scared. The values for ‘scared’ do not have noticeable changes. The results indicate that the price blocks make the participants noticeably more scared compared with the other categories (see
Table 8).
Disgust. The emotion of disgust stayed at the lowest values during the experiment, as shown in
Table 9. The participants did not show any notable changes in their disgust.
4.2. Heart Rate Measurements
Heart rate data were analysed when the emotions of each participant were captured. This experiment relied on images of renovation projects, illustrations, diagrams and alternative matrices as emotional stimulus sources to elicit certain emotions. Participants were in a room in front of a computer monitor and the survey was conducted from 8 a.m. to 1 p.m. During the task, HR was recorded via a smartwatch system (see
Figure 8). Specifically, the task required participants to make certain decisions about situations they were shown, which had offers they could accept or reject. In addition, the participants were told that the proposed solutions relate to the following different contexts: economic aspects, simplicity of the construction process, the durability of materials, warranty period, aesthetic appearance, etc.
Along with changes in emotional mood, cardiac activity changes, can also be extracted and used as signals of various emotions.
Figure 9 shows several typical parameters used to extract features.
Parameters (1) and (3) show HR amplitude changes. Parameter (2) shows that HR follows an increasing scale over time, Parameter (4) shows the slope of the HR change, and Parameter (5) indicates the duration during which the HR data remain without changes.
The experiment proved that when a participant’s emotions change (happiness, sadness and a neutral state), their heart rate should reflect their mood accordingly. Statistical analysis showed that the rise in heart rate was significant when participants felt positive emotions, whereas negative emotions cause the heart rate to decrease. Statistical analysis also showed that emotions can be recognised and monitored in real-time using affordable, wearable devices. This method was fast, easy and simple to use on a wide range of portable devices available in the market. When smart bracelets are used for emotion recognition, it is suggested to first show the user standard neutral stimulation videos to obtain neutral mood heart rate data as a baseline to eliminate personalised differences.
4.3. Multiple-Criteria Assessment
In order for renovation projects to be fully sustainable, the interaction and interdependence of qualitative and quantitative features corresponding to objective and subjective values during the project life cycle seem to be an important point of focus. For this purpose, the multiple-criteria assessment by the COPRAS method was conducted. This analysis was based on economic, technological, demographic (men and women aged between 30 and 40, 41 and 50, and 51 and 66), psychographic criteria and criteria of consumer behaviour (anger, sadness, happiness, heart rate variability and valence). Multi-criteria analysis and the related calculations were performed using Stages 1–5 of the COPRAS method [
71].
When studying expensive and time-consuming processes, it is justified to strive to obtain mathematical models with minimal cost and time expenditures. The human factor in decision-making can lead to incomplete or distorted data, which ultimately calls into question the reliability of the processed datasets. In this case, due to a large amount of data, it is advisable to automate the stages of analysis and the processing of measurement results in order to build relevant mathematical models. This, in turn, will allow the exclusion of the influence of the human factor on the results of the experiment and to reduce the time for its implementation. Decision makers, therefore, need an automatic tool that satisfies their requirements to support them in decision making.
Based on the COPRAS method and using the Python language [
www.python.org], an automated stand for modelling an intelligent decision support system was developed.
In order to ensure its quality (reliability, update status, fullness, uniformity across data sources, importance, dependability, proper display, significance and availability), the data sent to the intelligent multi-criteria decision support system were cleaned as part of the data validation process. When this cleaning effort revealed that some data were incorrect, incorrect, partial, rounded, stacked, censored and missing data were removed. When it was feasible to do so, this issue was fixed. Thermal image segmentation, which involved determining the typical temperature of an individual’s face, was performed on a predetermined range. In order to exclude extraneous temperature measurements that could have altered the study’s findings, we solely measured the average crowd facial temperature. The average background temperatures of those who were not in the observation zone were later removed during the data processing stage.
The intelligent model base’s initial development was completed together with the creation of the specifications. The foundation of the intelligent model was validated and verified using an iterative model. Following that, the intelligent model base and its models were examined and tested to ensure their accuracy and validity. The recommendations model, the decision support and expert subsystem, and the intelligent decision support were all subjected to this validation and verification process. This method of verification showed that the concept of an intelligent multi-criteria decision support system and the intelligent model base and its models were well suited to each other. In this project, the expert technique was used, and logic flow diagrams were created to demonstrate the potential applications of modularity. The intelligent model base and its models were evaluated subjectively.
Table 10 shows sample input data for the evaluation of alternative window options. The input information covers: an initial list of criteria, the indicators of a higher/lower criterion value, ultimate weights of the criteria, etc. The weights of the criteria were determined by responses to questionnaires. Once completed, the questionnaires were processed and the concordance coefficient, which demonstrates the compatibility of expert assessments, calculated to determine to what extent the expertise is reliable.
The standard steps for the proposed method, after receiving the input information, determine the significance, usefulness and priority of the recovered elements. The script consisted of formulas from Stages 1–5 of the COPRAS method [
71].
After downloading all of the necessary files and other information, the next step was to run the script. The output data, which is the result of the calculation of the automated system for choosing the best alternative to the object of research, come in the form of the final Excel table (see
Table 11).
In this case, the most efficient window option is Alternative 5.
In addition to its feature that helps evaluate whether a certain solution is better than another among the possible options, the intelligent decision support system developed as part of this study can also be used in the initial procedures of design to define the main initiatives and areas towards holistic renovation of a building.
The data collected for that purpose and related to the essential factors provide background and the overall details of the renovation project. The main component in this decision-making system works as a Value Map (see
Figure 10) and presents the main goals for sustainable renovation in a visual form. The focus is on multiple-criteria analysis and this component can be used in conjunction with the services of sustainability consultants.
Data must also be checked to make sure their collection has been statistically and methodologically sound. The results can be used to audit, monitor, and evaluate renovation effectiveness and assist with decision making throughout the life cycle of a project. This can be useful for identifying and establishing the key performance indicators and criteria in early steps of the design stage. In addition, the results can be used to guide stakeholder engagement and decision making. The advantages and disadvantages of each renovation alternative can also be compared to determine their specific value on a case-by-case basis.
Table 12 presents the performance evaluation system for the criteria of the sustainable development decision support system. A graded rating system is used with points between 1 to 5, where 1 indicates substandard quality, while 5 is the highest score in this framework marking what can currently be considered a roughly “fully sustainable retrofitting”, e.g., almost zero-energy renewable project.
The criteria used in this study can be of two types: either qualitative or quantitative. The factors that correspond to quantitative indicators in the Value Map are mostly quantifiable, such as service life or investment costs, duration of work or durability; their values can be determined in a sufficiently objective way. Quality factors mean that their evaluation has to be qualitative. The drawing stage is the step when these factors should be met and designed.
4.4. BIM Integration
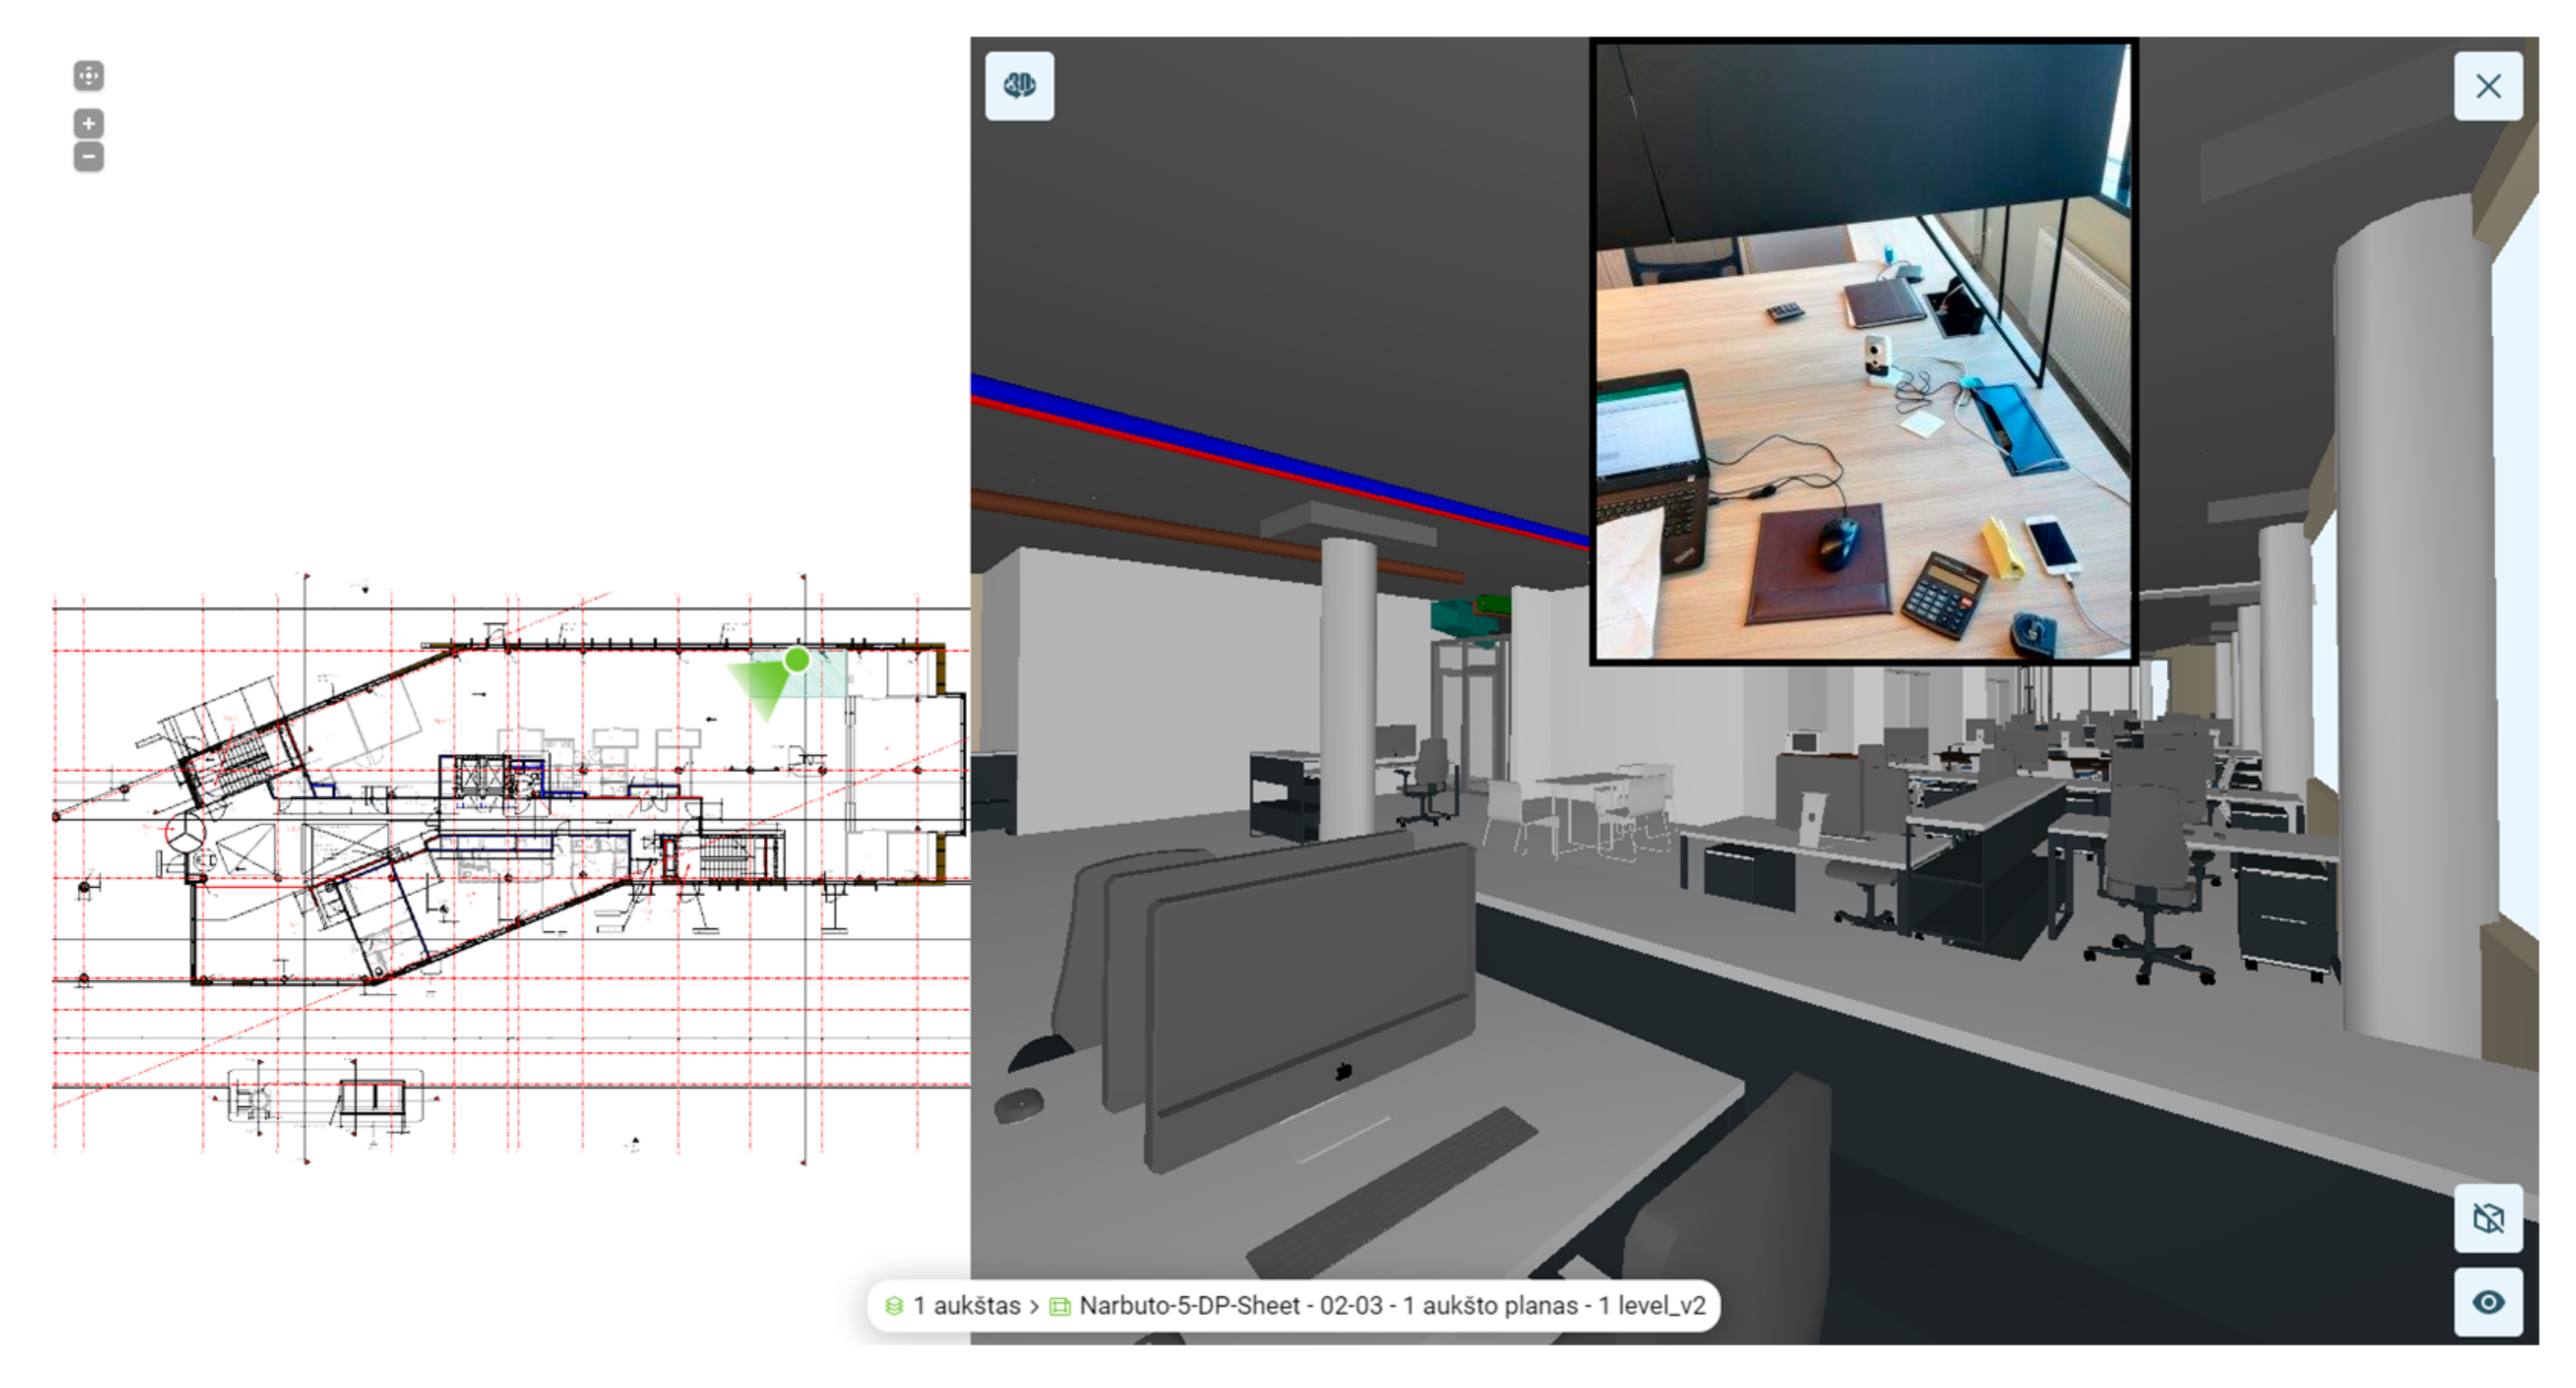
As an application example the SAVAS prototype system was developed and adapted for renovation projects during the intelligent, self-learning and adaptive buildings (SAVAS) project. This integration of the Building Information Model (BIM) subsystem with the intelligent multi-criteria decision support (SAVAS) system helps professionals make the most rational renovation decision. This solution takes advantage of BIM technology’s most significant benefit: creating, storing, and managing comprehensive information about the renovated building. The DALUX software platform was selected as the basis of the BIM subsystem, in which the common data environment (CDE), 3D model (according to the principles of BIM methodology) and information/data management interfaces are combined. This information integration with BIM and possibility of the customisation for SAVAS needs was the most suitable solution with extensive configuration, data/information management functions and face/emotion recognition system application (connection with emotional data). Another benefit of the DALUX software platform is cloud-based storage and accessibility by every project participant. In the SAVAS prototype’s common data environment (CDE), a dynamic BIM integration subsystem represents multimodal data obtained and synchronised from SAVAS project participants or data from the analysis of emotion sources as described in previous
Section 3 and
Section 4 (see
Figure 11).
In the SAVAS prototype’s common data environment (CDE), a dynamic integrated BIM subsystem represents multimodal data obtained and synchronised from SAVAS project participants or data from the analysis of emotion sources.
For example,
Figure 12 shows the interface window for image recording and pro-cessing of detected faces.
Figure 13 shows how the video recording system does not identify the face covered with the mask and does not capture the data.
Figure 14 shows an example of the collected SAVAS emotional data fragmentation.
The parameters of the emotion indicators (such as happiness, sadness, angry surprised, scared and disgusted) collected and analysed in specific zones (considering the structure and interrelationships of the data layers) are linked to the 3D/geometrical elements of the BIM model shown in
Figure 15. The DALUX platform enables detailed filtering and analysis of the BIM model parameters of the building, as well as updating and multimodal data after the analysis procedures for renovation decision.
5. Discussion
The authors [
72,
73,
74,
75,
76,
77,
78,
79,
80] of this research have been analysing human emotional, affective and physiological states for many years and collected over a billion of these data in Vilnius city during the H2020 ROCK and BIM4REN projects. Data collection was connected with a BIM integration subsystem and gives the capability of application for visual machine-learning analysis. During these projects over 54,000 average and strong correlations were determined.
Figure 16 gives several happiness relationships as an example.
The results show that participants expressed significant emotional differences in neutral, happy, sad, disgust and surprise states towards the renovation project. The participants had higher positive ratings for the selection of window replacement alternatives. Three-dimensional drawings could inspire participants to come up with more relevant ideas. In addition, the following limitations and precautions have been summarised when using FaceReader under experimental conditions: (1) when the data viewed by the participants was static, the statistical significance of negative emotions may have been lower; (2) FaceReader recognises neutral facial expressions as sadness.
This study can be useful for researchers who use the evaluation and analysis of human emotions when they need to choose a method appropriate for their purposes or are looking for alternative solutions. This approach provides a preferred foundation for researchers and designers in their respective areas of the construction industry and marketing. This method allows the parties involved in a construction process to find the most rational solutions and thus make sure renovation work is of high quality and well-timed with all stakeholders satisfied with the result. The results of this study present applicable methods for each type of emotion and their intensity and suggest their classification. A classification of emotion sensors is presented to reveal the scope and expected results of each method, with their limitations.
Feedback from stakeholders was collected for determining their decision-making practices in renovation solutions. None of the surveyed organisations currently takes into account greenhouse gas emissions due to the use of non-environmental materials during renovation. Four organisations expressed interest to start performing such estimations if they will have a simple budget tool. Incorporating residents’ opinions about a future renovation project or involving residents in the process is a challenge that can influence the result as well as residents’ satisfaction with the renovation project. None of the organisations had previously used any measurements or surveys for monitoring indoor environmental quality.
Three organisations reported that they hold joint meetings with tenants. The meetings are generally held to share information about future projects, and tenants are encouraged to utter their thoughts, which can influence decision making to some extent. None of the organisations conducts a survey of tenants before the start of the renovation to establish, e.g., environmental problems in the premises that can be solved during the renovation.
Organisations agreed that the proposed decision-making system could enhance the efficiency of the renovation. After comparing the results of integrated emotion and the traditional analysis it could be seen that the emotion indirectly increases the value of each alternative.
Previous studies [
81,
82] have shown that the software is an effective emotion analysis tool with 90% accuracy. Although previous research showed that participants took the experimental task seriously, FaceReader identified their emotions as anger [
83]. These results prove that FaceReader can detect subtle and instantaneous changes in facial expressions in an objective manner and draw conclusions with a high degree of accuracy using potentially representative emotion components as a basis. Observations of the researchers and verbal responses of the participants are, however, necessary to understand the way participants feel and to discuss the face recognition results further. The key point of the facial recognition experiment is to distinguish changes in emotions. Each emotion is of a very short duration of about 0.5–4 s [
66], thus differences between data points are difficult to quantify and not every frame of a participant’s video may be analysed. FaceReader can be used for reliable analysis of emotions by studying the way facial expressions of participants change, but researcher observation, participant self-reports and proper experimentation are also needed to minimise the potential for inconsistent results. The correlation signs shown in
Table 13 are consistent with studies conducted around the world. Many studies, for instance, show that an increase in happiness leads to decreases in sadness (e.g., [
84,
85]).
According to Panoulas et al. [
88], various broad models can be used to express emotions. Happiness, sadness, wrath, surprise, contempt and fear are among the main emotions, according to some authors [
45]. According to some researchers [
89], this model has shortcomings when it comes to accurately representing particular emotions in a wider spectrum of affective states. Measurement, representation and modelling of emotion recognition strongly rely on psychological theories for their guidance [
90]. However, the concept of emotion theory is still developing and subject to vigorous discussion [
91,
92]. Additionally, context [
93] can attenuate the effects of cultural, geographic and individual differences on how we may perceive, experience and express emotions [
94,
95].
This study has some limitations. The following factors need to be taken into account in any upcoming research:
Planning specialists, architects, constructors, etc. do not always have access to reliable, depersonalised, real-time biometric data, which restricts the method’s use. Due to this, gathering data is both prohibitively expensive and time-consuming.
Renovation projects could be more accurate by taking into account social, hedonic and customer-perceived values, emotional, affective, and biometric maps, in addition to those of the surrounding environment. As a result, more useful advice for enhancing renovation process efficiency would be generated.
Data and customer privacy concerns are the main obstacle to using the ASP System. Since May 2018, all businesses conducting business within every EU member state are required to abide by the data protection regulations outlined in the General Data Protection Regulation. These strengthened restrictions give the general public more control over data protection pertaining to their personal data.
The proposed approach is limited to calculating hedonic, customer-perceived, integrated, market and hedonic-investment values at a specific moment. Values of public spaces, communities, districts, and geographic places may include their monetary, social, and land worth. This shows that the suggested approach still has problems. Because of this, this methodology must be combined with other strategies, such as multi-attribute market value assessment (MAMVA) [
96], which must be taken into account before beginning fresh investigations. The findings of this study, the MAMVA approach [
96] and the neuro-decision tables [
97,
98,
99,
100] serve as the basis for estimating the economic, social, and land values of public areas, their surroundings, districts and regions.
6. Conclusions
The literature analysis shows that decision-making systems or tools do not integrate emotion recognition in renovation solutions. The present study has proposed an innovative decision-making framework and an intelligent system for sustainable renovation solutions, based on emotion recognition and BIM integration. The proposed system enables automation in calculation processes for sustainable renovation.
The experiment proved that when a participant’s emotions change (happiness, sadness and a neutral state), their heart rate should reflect their mood accordingly. Statistical analysis showed that the rise in heart rate was significant when participants felt positive emotions, whereas negative emotions cause the heart rate to decrease. Another conclusion is that real-time emotion monitoring and recognition is possible with affordable wearable devices. This method was easy, fast and simple to use on many portable devices available in the market. When smart bracelets are used for emotion recognition in real world settings, it is suggested to first show the user standard neutral stimulation videos to obtain a neutral mood heart rate data as a baseline. This way personalised differences can be eliminated.
The intelligent decision support system which was built as part of this study is not only intended to evaluate whether a certain solution is better than another among many possible options, but it can also be used according to BIM methodology in the early stages of design with a BIM integration subsystem to define the main initiatives and areas towards holistic renovation of a building.
The decision support system developed as part of this research can be adopted in all stages of renovation from decision making through investigation and design to construction activities and seamless handover and further maintenance. Integrated BIM subsystem described in research and shown in the methodological framework is a part of decisions support in the building life-cycle, and can be initiated as a process to return loop to the initial stage for better decisions based on continuous multi-criteria assessment of renovation alternatives.
The developed intelligent decision support system with BIM integration is not ideal, since it has certain limitations. Next is a brief discussion on how to eliminate them. In the future, the intention is to integrate the intelligent decision support system with currently available non-contact technologies for monitoring and modelling learner behaviours and applying advanced BIM solutions for information management. Therefore, the authors of this article anticipate integrating the intelligent decision support system with the analytics of verbal emotions, analysis of inaudible sound and eye tracking and emotion regression analysis [
78,
79], which would allow a more successfully tailored educational process for a learner in consideration of the accessible historical and real-time information. Students cannot hear sound frequencies measuring less than 20 Hz. According to Lippold [
101], inaudible sound varies inversely with stress; that is, it decreases as stress increases. The stress experienced by a speaker suppresses inaudible microtremors. Voice stress analyser experts claim that these variations associate with aroused states [
102]. Integration of eye tracking would result in better assessment of the emotions of learners. For example, the use of an eye tracker would enable determining where the glance of a learner falls and how his/her pupil changes in size (when it expands and when it contracts), as well as how often the learner blinks. Kaklauskas et al. [
73] already partly performed these investigations.
Based on the current research, we highlight and discuss the future research directions as follows.
An opinion analytics module will be introduced to the intelligent multi-criteria decision support system, opening up two more possibilities:
With the users’ official authorisation, the system will be able to review comments made regarding the sustainable renovation on networking and social media sites, news media sites, and other online sites.
Without the owners’ consent, the desired content will not be automatically added to the opinion analytics module, which uses papers, evaluations, questionnaires, feedback, beliefs, notifications, documents, and various studies to analyse built environment issues.
In addition, three directions for research must be pursued in the future to improve the intelligent multi-criteria decision support system.
Regional communities could benefit from the idea of a triple bottom line, which combines social, economic and environmental considerations. It enables promoting sustainable economic development growth. The implementation of this idea also asks for increased collaboration between regional people, government officials, and corporate, nonprofit, and nonprofit organisation leaders [
103]. Therefore, when trying to create a sustainable city, using the aid of an intelligent multi-criteria decision support system makes sense. It makes it possible to analyse urban communities and their inhabitants as a whole in the future. In this case, an integrated inquiry would be conducted to examine collective transparency, recollection, intelligence, sense, awareness, decision-making and problem-solving behaviour, reactions and activities. Additionally, group dynamics, crowd psychology, emotional environment, affective atmospheres and intergroup conversation would all be taken into account in this analysis along with the collective spirit of the people and the spirit of the nation.


 ,
, 


