Article

Estimating Moisture Content of Sausages with Different Types of Casings via Hyperspectral Imaging in Tandem with Multivariate

1
School of Regional Innovation and Social Design Engineering, Faculty of Engineering, Kitami Institute of Technology, 165 Koen-cho, Kitami 090-8507, Hokkaido, Japan
2
RIKEN Centre for Advanced Photonics, RIKEN, 519-1399 Aramaki-Aoba, Aoba-ku, Sendai 980-0845, Miyagi, Japan
*
Author to whom correspondence should be addressed.
Appl. Sci. 2023, 13(9), 5300; https://doi.org/10.3390/app13095300
Submission received: 28 March 2023 / Revised: 20 April 2023 / Accepted: 20 April 2023 / Published: 24 April 2023
(This article belongs to the Special Issue Image Analysis for Product Quality Control)

Abstract

:
The moisture levels in sausages that were stored for 16 days and added with different concentrations of orange extracts to a modification solution were assessed using response surface methodology (RSM). Among the 32 treatment matrixes, treatment 10 presented a higher moisture content than that of treatment 19. Spectral pre-treatments were employed to enhance the model’s robustness. The raw and pre-processed spectral data, as well as moisture content, were fitted to a regression model. The RSM outcomes showed that the interactive effects of [soy lecithin concentration] × [soy oil concentration] and [soy oil concentration] × [orange extract addition] on moisture were significant (p < 0.05), resulting in an R2 value of 78.28% derived from a second-order polynomial model. Hesperidin was identified as the primary component of the orange extracts using high-performance liquid chromatography (HPLC). The PLSR model developed from reflectance data after normalization and 1st derivation pre-treatment showed a higher coefficient of determination in the calibration set (0.7157) than the untreated data (0.2602). Furthermore, the selection of nine key wavelengths (405, 445, 425, 455, 585, 630, 1000, 1075, and 1095 nm) could render the model simpler and allow for easy industrial applications.

1. Introduction

Hyperspectral imaging (HSI), which can allow measured parameters to be displayed from pixel to pixel [1,2,3], is widely applied to various foodstuffs, such as grape [4,5,6], pork [7,8,9], blueberry [10,11], sheep [12,13,14], strawberries [15], beef [16,17,18,19], and processed meat products [2,20,21,22]. The physicochemical attributes, microbiological attributes, and sensory attributes of dry-cured sausages (vacuum-packed) have been assessed by HSI [23]. Ma et al. (2018) employed multispectral imaging to evaluate the moisture and water-holding capacity of cooked pork sausage, and the partial least squares regression model (PLSR) developed for predicting those parameters showed a correlation coefficient of 0.949 and 0.832, respectively [24]. The color [3] and pH [25] of sausages were evaluated by HSI associated with PLSR, with the highest determination coefficient of the calibration group (Rc2) achieved at 0.934 [3] and 0.73 [25], respectively. The moisture contents of freeze-thaw cycles within five times were estimated by HSI coupled with an electronic nose. The combination of HSI and electronic nose technologies using an improved decision fusion model demonstrated the highest predictive capacity, with a determination coefficient of prediction group (Rp2) of 0.9533 and root mean square error of prediction (RMSEP) of 0.3869 [7]. It is clearly demonstrated that HSI is a novel and powerful analytical technology in comparison to traditional spectroscopic methods.
Sausages, which are made from comminuted meats, have been prevalent for thousands of years. Although how and when the first sausage was invented is not clearly recorded, delicious sausage products were consumed during annual orgiastic festivals and sacrifices. The sausage casings, which are applied to hold the comminuted meats, should be strong enough to bear the pressure generated during stuffing or cooking while maintaining their tender taste at the same time [26]. Sausage manufacturers are frustrated by the casing burst incident because it will cause a lot of food waste and hinder rapid sausage production. To this end, the casing, modified by different concentrations of surfactant solution and stored in the slush salt, was investigated [27]. The modified casings were observed to be more porous and could lessen the burst incidence [27]. There is a necessity for a deeper study of how this type of casing responds to the moisture content during mid-long-term storage.
Moisture content (MC) is an essential parameter to evaluate sausages because it is related to the lipids that influence eating quality, such as flavor, juiciness, color, and appearance [7]. Microbial growth will be also profoundly influenced by moisture content because micro-organisms will make use of the water inside the sausage for biological activities. The moisture content of the sausage has a strong relationship with other parameters, such as water activity, textural tenderness, water holding capacity, and so on [28,29,30]. All of those will finally affect the shelf life and quality evaluation of the sausage. Due to the porous nature of the modified casing, there is a risk of micro-organism growth or lipid oxidation, necessitating the use of natural preservatives to ensure its quality and prolong its shelf life.
From an economical point of view, the recycling of waste orange peels can not only solve the environmental problem but also be a good material supplier for extracting flavonoids for the pharmaceutical industry. Hesperidin, as the main component that exists in orange peels, belongs to flavonoids and possesses antioxidative, anti-inflammatory, and anti-cancer properties [31,32] and may have a function in the therapy of SARS-CoV-2 [33]. Hesperidin is effective against various types of cancer, such as liver cancer, breast cancer, lung cancer, and others [34]. The most recent literature indicates that flavonoids, such as hesperidin and rutin, have a higher binding affinity to the main protease of COVID-19 than nelfinavir [33,35]. As a result, they could be considered the initial point for the development of therapeutics against COVID-19. The effects of hesperidin on the moisture content of sausages stuffed with three different types of casings have been studied [36]. Sausages stuffed with natural hog casings possessed a significantly higher MC than those with modified casings at d 138 (p < 0.05). The moisture of sausages with modified casing [soy lecithin concentration: 1:30 (w/w), soy oil concentration: 2.5% (w/w), lactic acid concentration: 21 mL/kg solid NaCl, residence time: 90 min] presented comparable moisture stability during 171 days of storage than others [36].
To date, although some studies have addressed estimating the color [3,21], pH [2,25], and ATP [22] of sausages by employing HSI and chemometrics, a few studies have investigated how the MC of sausages stuffed in different combinations of modified hog casings responds to the addition of orange peel extracts (OPE) to the modified casing solution. The aim of this study is first to estimate the combined effects of surfactant solution with the addition of OPE on the MC of sausage cores by using HSI in tandem with multi-variate analysis. Following this, the most important wavelengths for MC of sausages with the different treated combinations will be determined by multivariate data analysis. Finally, multi-variate calibration models using both full wavelengths and important wavelengths will be built to explain the relationship between spectra and MC.

2. Materials and Methods

2.1. Orange Crude Extraction and Sausage Preparation

After drying the orange peels (Citrus sinensis) in an oven set at 40 °C for 7 days, 40 g of well-blade-milled orange powder (milled by an electric powder mill machine) was extracted with 100% ethanol via the method of Soxhlet extraction [37]. After leaving the extracts overnight in the fume hood, the solvents evaporated naturally. The extracts were washed with distilled water, transferred to filter paper, and finally dried in a desiccator to obtain crude precipitation. Subsequently, a length of 30 cm of natural casing section was put in a mixed solution of soy lecithin (SLC), soy oil (SOC), and orange crude precipitation. After immersing the casings for the treated time with the magnetic stirrer at 500 rpm, the casing section was picked up and stored in the slush salt added with lactic acid for the same treated time. The additional concentrations of soy lecithin, soy oil, orange extract addition, lactic acid addition, and treatment time were designed by a central composite design via Minitab software (21.1, Kozo Keikaku Engineering Inc., Tokyo, Japan). The combination matrix can be found in Table 1.
The sausage filling was composed of minced back fat, minced lean pork, Chinese white wine, black pepper, spicy seasoning, sugar, and salt. The specific concentration can be found in Feng et al. (2022) [25]. Both modified and unmodified casings (natural casings as a control) were employed to produce the sausages by using a stuffing machine (STX-4000-TB2-PD-BL, Electric Meat Grinder & Sausage Stuffer, STX International, Lincoln, NE, USA). The sausages were sectioned at a length of 15 cm and dried in an oven for 24 h at a temperature of 45 °C. These handmade sausages were aged at 20 °C for the following 48 h at last. The sections were sterilized, cut, and vacuum packaged using polyethylene vacuum bags and stored at 4 °C for 16 days.

2.2. Reference Analysis

After 16 days of storage, five grams of sausage were well chopped and dried in an oven at 105 °C until they reached the constant weight, which is according to the method of Feng et al. [26]. The MC was calculated using the following equation:
Moisture   content   ( % ) = W 1 W 2 W 1 × 100 %
where W1 and W2 were the weight before and after drying, respectively. The MC analysis was repeated three times.

2.3. Identification of the Chemical Profile of Orange Extracts by High-Performance Liquid Chromatography (HPLC)

The HPLC system was composed of a column oven (Shimadzu, Kyoto, Japan), a C18 RP column (InertSustainSwift C18 5 μm, 250 × 4.6 mm-i.d.; GL Sciences Inc., Tokyo, Japan) with a cartridge guard column, two pumps, and a photodiode array detector (SCL-10A, Shimadzu, Tokyo, Japan). According to the previous UPLC results of orange extracts [38], the main compositions of orange peels were hesperidin, naringin, and neo-hesperidin. Therefore, they were considered for further analysis. The HPLC-grade standards of hesperidin, neo-hesperidin, and naringin with a purity greater than 90% were purchased from [Tokyo Chemical Industry (TCI) Co. Ltd., Tokyo, Japan], TCI, and Sigma-Aldrich, Merck, Germany, respectively. The standards and dried orange extracts were diluted by methanol-dimethyl sulfoxide (1:1, v/v) and filtered by a 0.45 μm millipore filter before injection. A two-solvent gradient system of aqueous 10 mM phosphoric acid (A) and methanol (B) was employed, with the gradient program consisting of three periods: (1) 0–55 min, 70–55% A, (2) 55–95 min, 55–0% A, (3) 95–100 min, 100% B. The sample injection volume was 5 μL with a flow rate of 0.6 mL/min, with the column being operated at 40 °C and a detection wavelength set at 285 nm. The resulting chromatographic data were integrated for up to 100 min. This method is referred to as the flavonoid analysis method from Nogata et al. [39], with a slight modification. The orange extracts were identified by comparing their retention times and UV spectra with authentic standards, and the concentration of each flavonoid was determined from the integrated peak area of the sample and the corresponding standard calibration curve.

2.4. Hyperspectral Data Processing

The sausages with different modified casings after 16 days of cold room storage were cut into cores with a diameter and height of 2.77 ± 0.16 cm and 2.03 ± 0.16 cm, respectively. Hyperspectral images were taken by a hyperspectral camera (EBA Japan, Tokyo, Japan) with its model NH-4-KIT. There were 151 contiguous spectra, and the exposure time was set to 12.47 ms with push-broom line scanning. To prevent shadows and render the light an even distribution, a white sheet was utilized, with 3 lamp lights (halogen) fixed around the white sheet. The ice bags were put under the black sheet to maintain the temperature at 20 °C. The reason to use the black sheet is to get a good boundary between the background and the sample. Imaging calibration was carried out based on the following formula:
R calibration = R r a w R d a r k R w h i t e R d a r k
where Rraw is the raw reflectance image, while Rwhite and Rdark are the reflectance images white (100% white reference) and dark (by completely covering the camera lens in a dark room), respectively. The region of interest (ROI) of the sausage core was chosen manually by separating the sausage core from the background or other undesired parts. The average spectra of ROI selected from each sausage core were used for model establishment.

2.5. Model Establishment

Before the multivariate analysis, quite a few spectral data pre-treatments were used to improve the model’s performance. Those pre-treatments are normalization, standard normal variate (SNV), the 1st and 2nd derivations, and multiplicative scatter correction (MSC). One-third of the samples were allocated to the prediction set, while two-thirds were allocated to the training set. The relationship between moisture content and spectra extracted from sausages cores with different casing treatments was elucidated by a partial least square regression model using full wavelengths.

2.6. Selection of Important Wavelengths and Model Evaluation

The wavelengths associated with peaks and valleys were selected as the important wavelengths (IW). A new simplified model was developed based on those IWs. This approach allowed for the elimination of noise and redundant information, potentially improving the model’s accuracy. The predictive abilities of both the simplified model and full model were compared using the mean square error of calibration (RMSEC), validation (RMSEV), and cross-validation (RMSECV), as well as the determination coefficients of validation (Rv2), calibration (Rc2), and cross-validation (Rcv2).

3. Results and Discussion

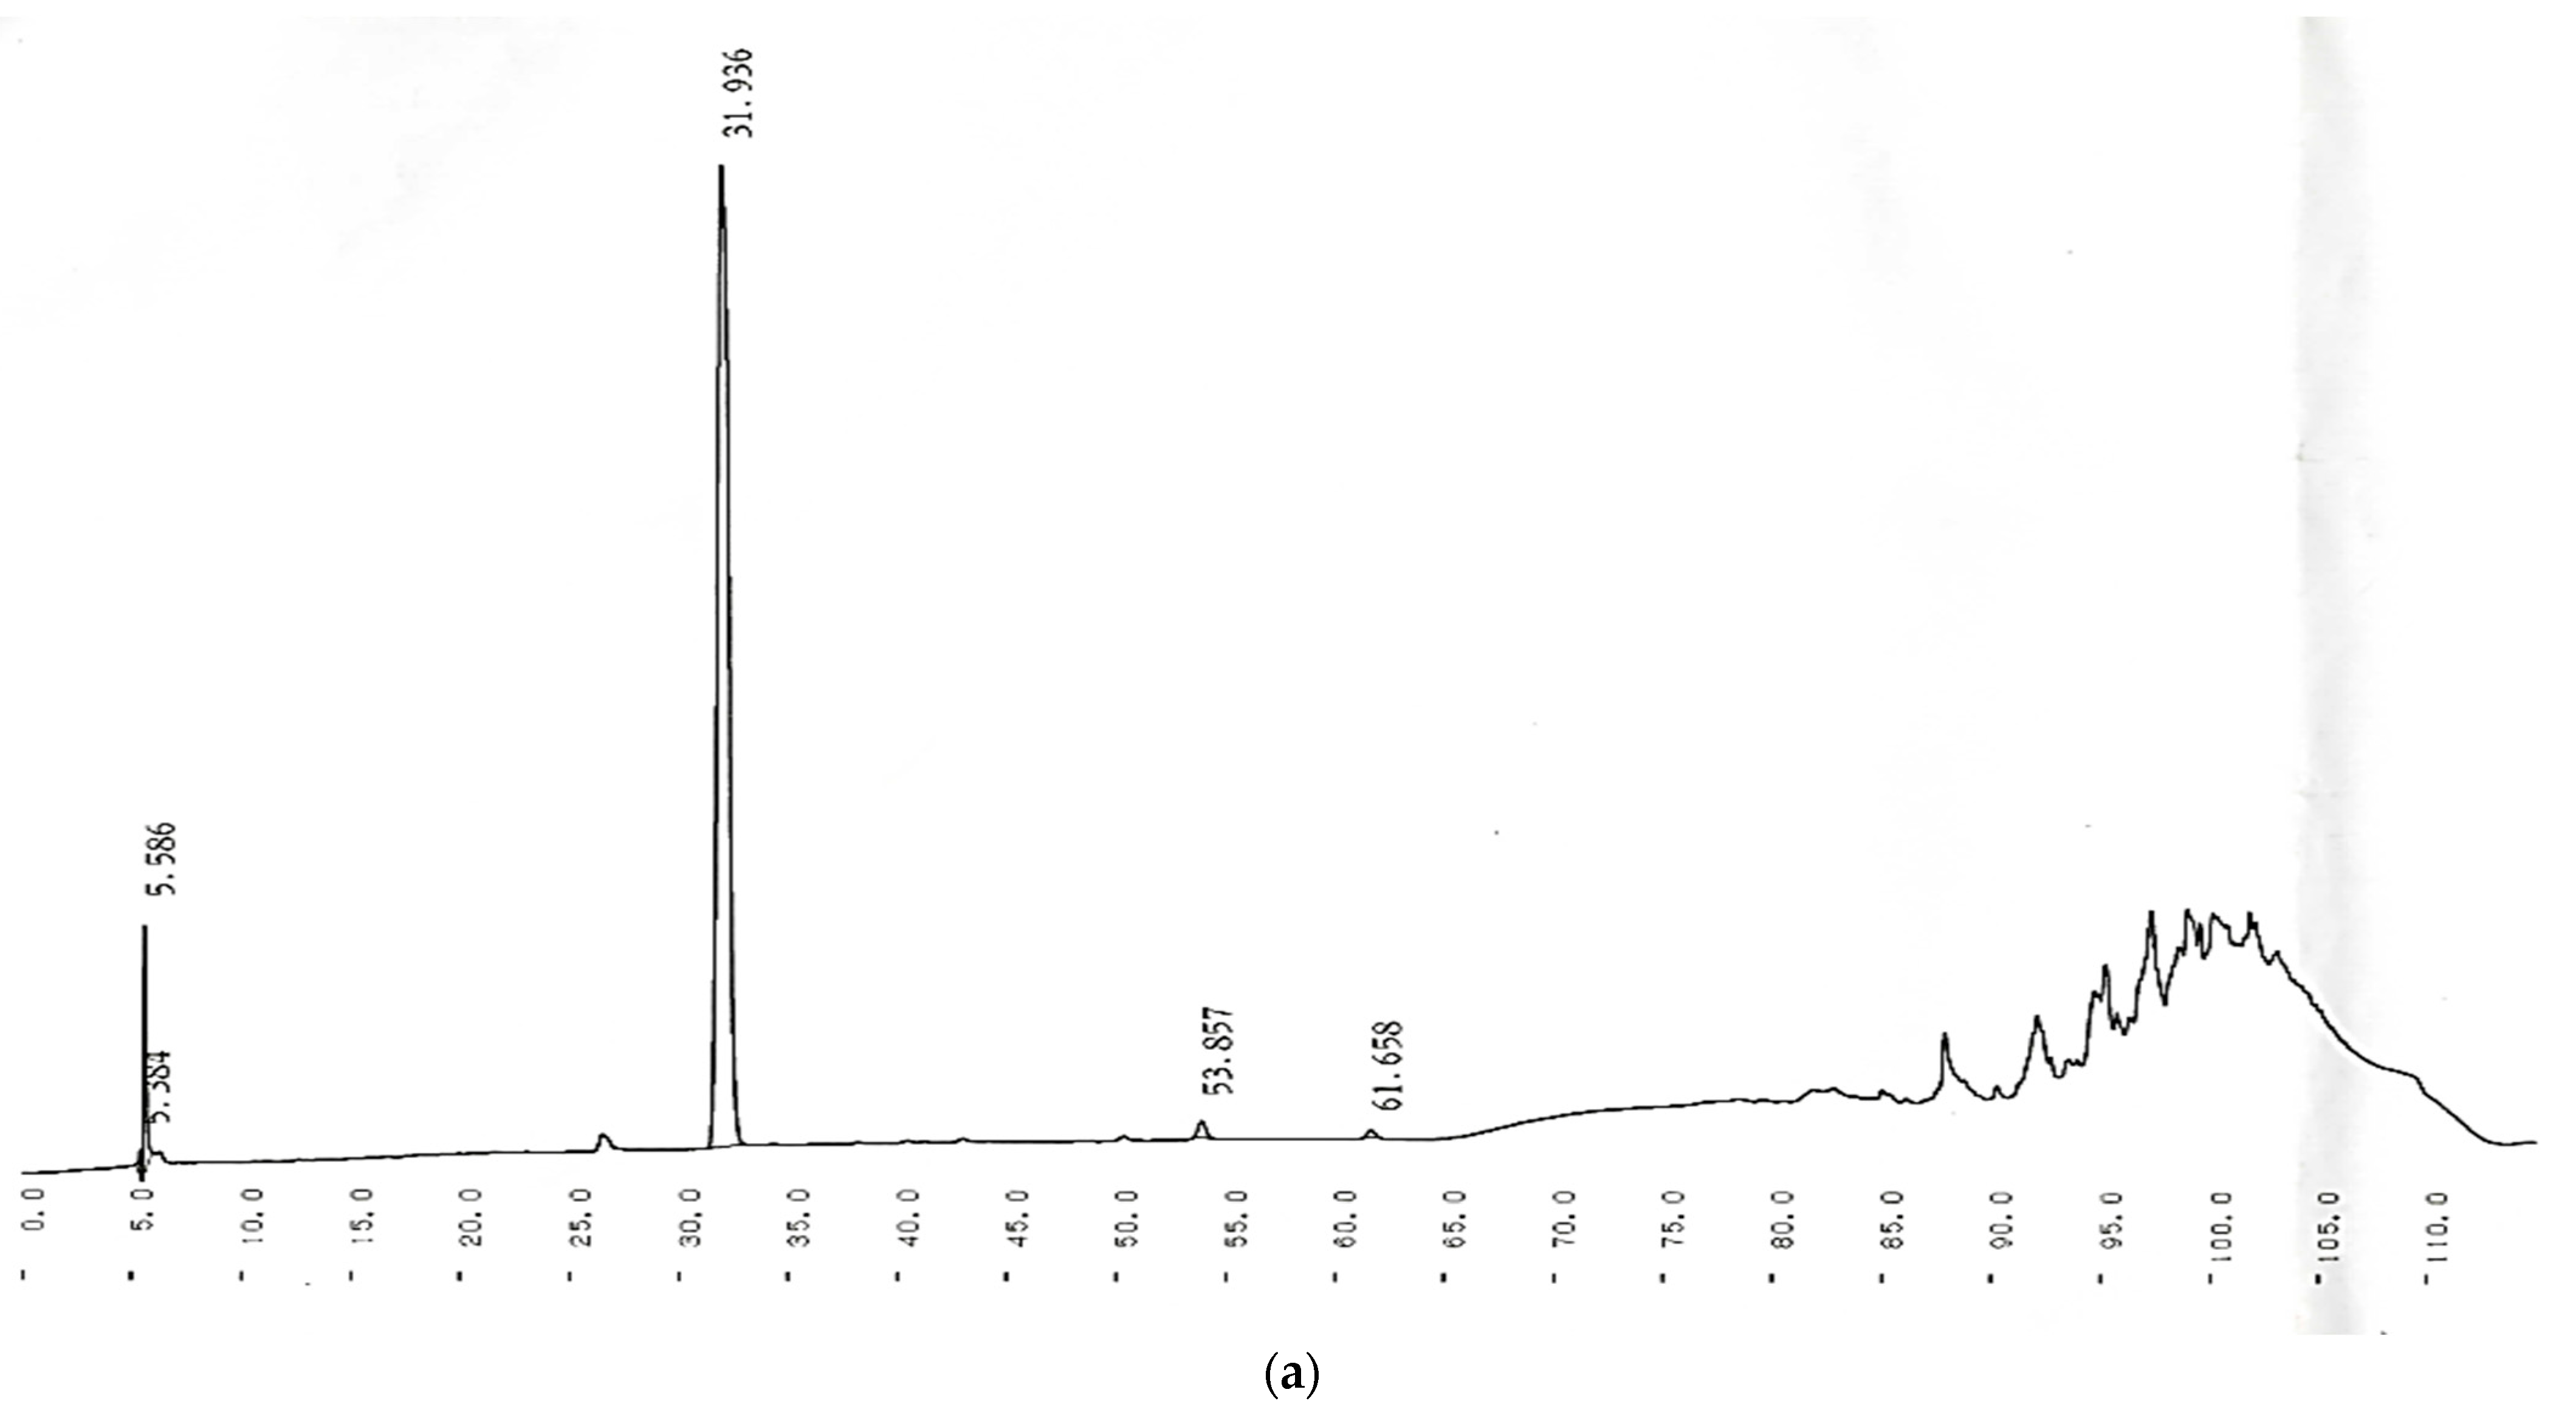
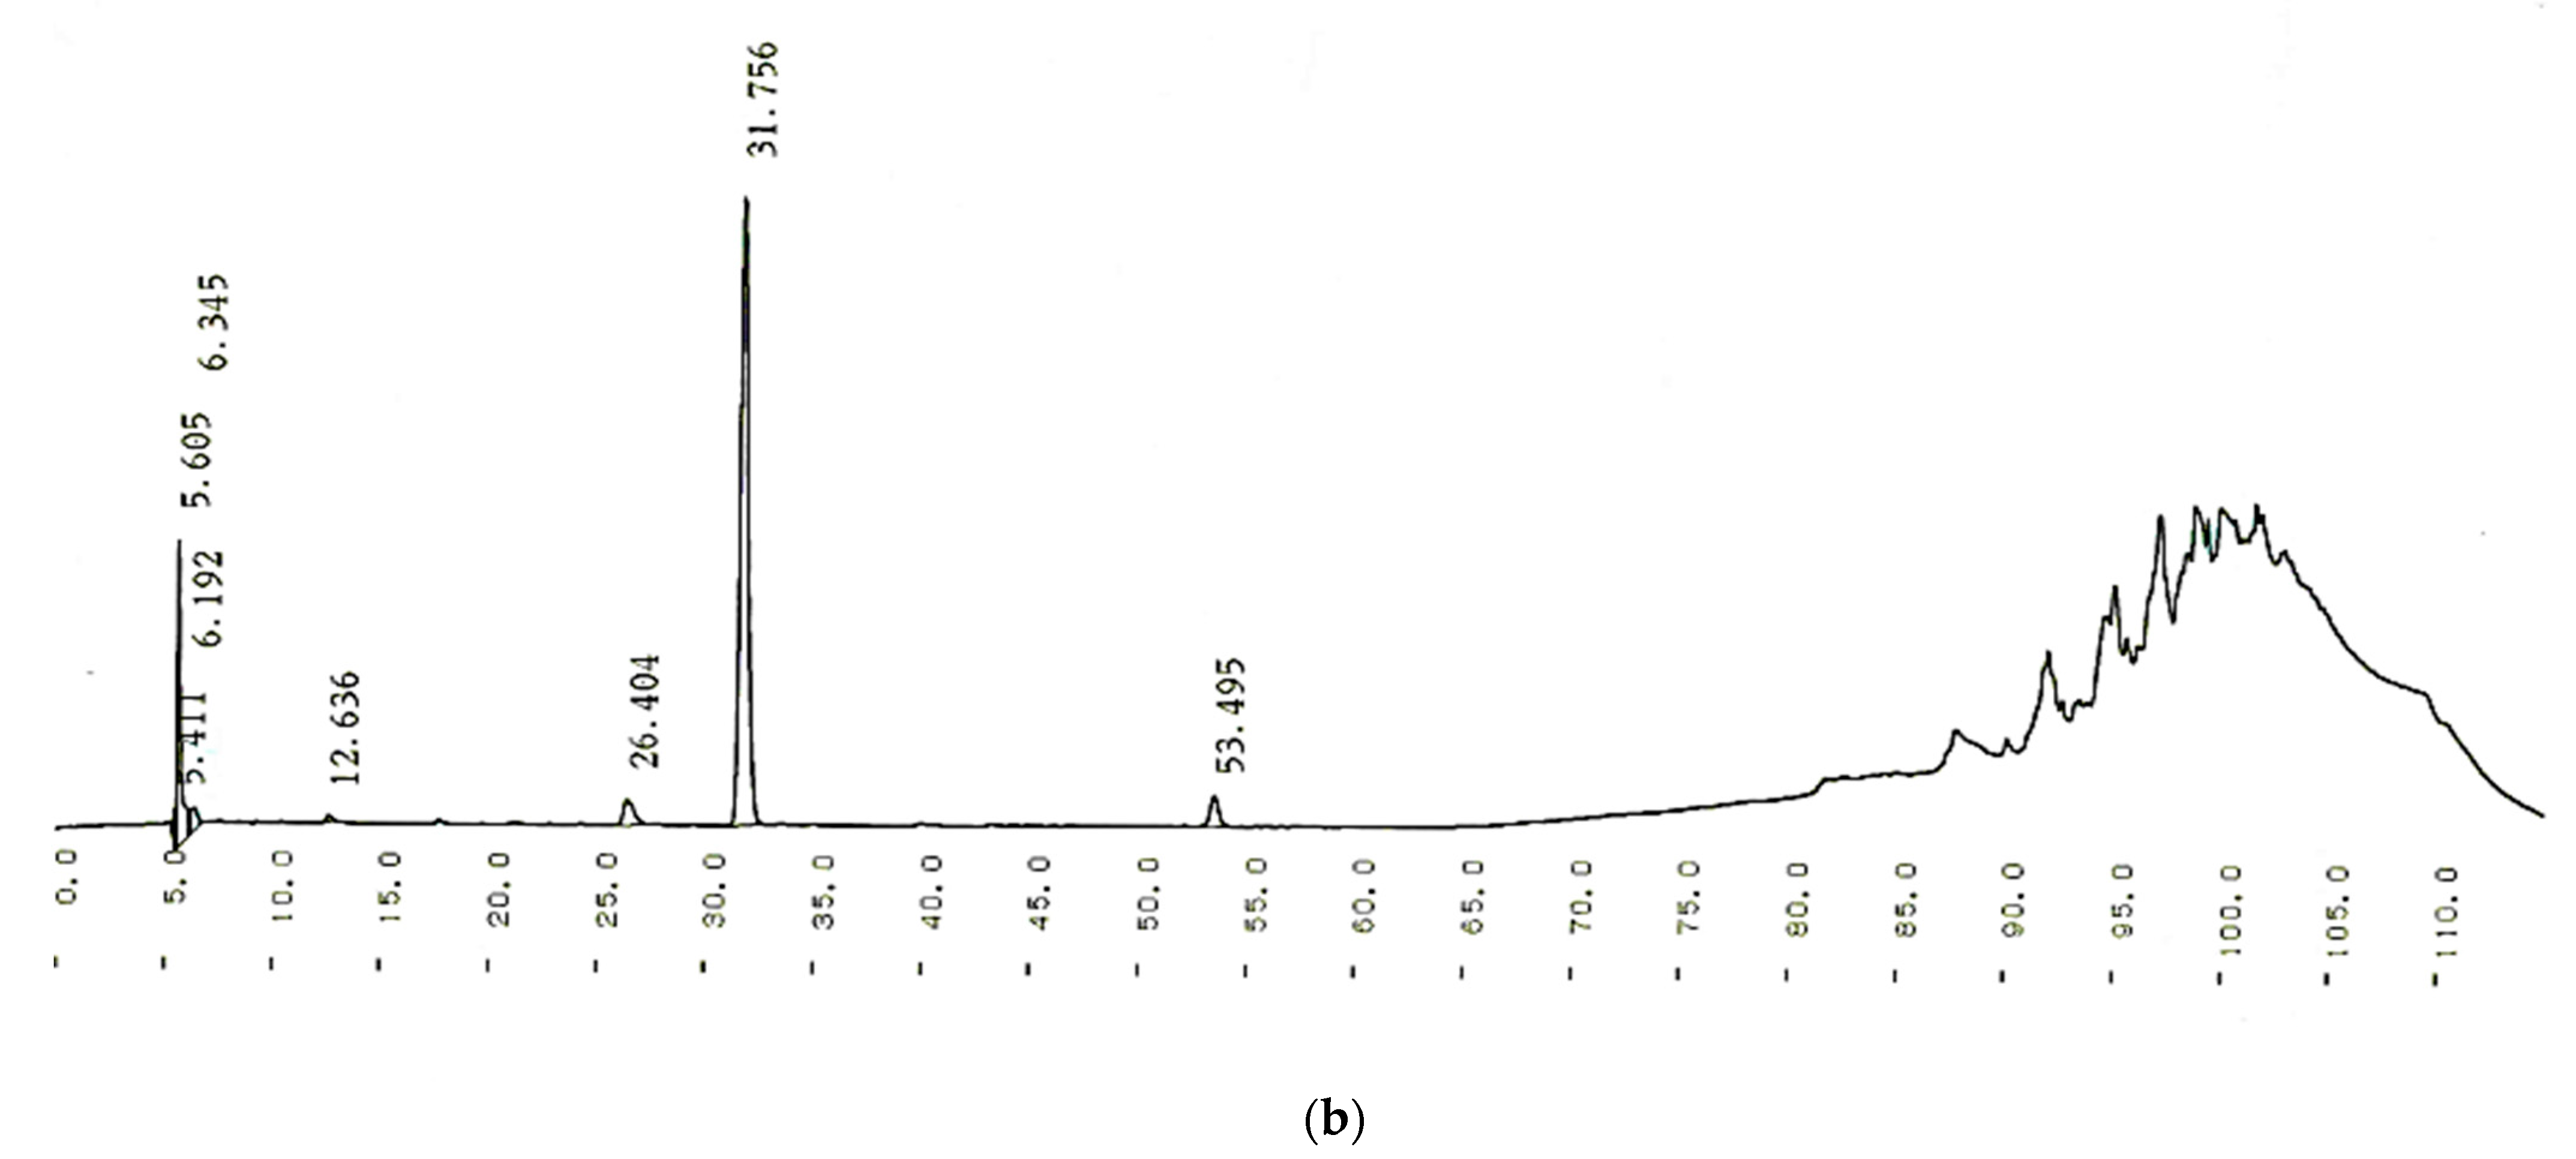
3.1. HPLC Profile of Orange Extracts from Waste Orange Peels

The average retention times for hesperidin, neo-hesperidin, and naringin were identified as 31.98 min, 35.01 min, and 29.55 min, respectively. Figure 1 displays the representative HPLC profiles of hesperidin [Figure 1a] and orange extracts from waste orange peels [Figure 1b]. The result indicates that the main composition of orange extracts was hesperidin, which agrees with the observations of Feng [40] and Feng et al. [31,38]. The investigated ranges for the determination of all analytes exhibited good linearity in the calibration curves, with R2 > 0.9999. The hesperidin content in orange extracts was calculated to be 46.82 ± 5.23 μg/40 g dried orange. The dried navel orange peels extracted by 70% ethanol solution with successive extraction with ethyl acetate were investigated [41]. Hesperidin content was reported to be 31.45 ± 0.38 μg/dry weight of extracts [41]. The orange extracts were also detected by terahertz spectroscopy (THz), and their THz spectra were similar to those of the hesperidin standard [31], which is consistent with current observation where the main component of orange extracts was identified to be the hesperidin. Hesperidin was reported to be 100% detected in the sweet orange, whereas only a 20% probability of naringin can be found in the sweet orange [38]. For neo-hesperidin, it is not detected in sweet orange peels [38].

3.2. Effects on the Moisture Content of Sausage Core

Response surface methodology was used to analyze the five simultaneous effects on the moisture content of sausage cores. The regression model had an R2 value (78.28%), with a lack of fits that is not significant at a 5% level, indicating that the model was highly adequate. The polynomial equivalences for predicting the MC in the uncoded units are as follows:
Ym = 5.800 + 2.230 [soy lecithin concentration] − 17.100 [soy oil concentration] − 0.200 [treated time] + 5.090 [lactic acid addition] + 112.300 [orange extracts addition] − 0.344 [soy lecithin concentration]2 + 0.759 [soy oil concentration]2 + 0.001 [treated time]2 − 0.195 [lactic acid addition]2 − 22.100 [orange extracts addition]2 + 1.653 [soy lecithin concentration] × [soy oil concentration] − 0.042 [soy lecithin concentration] × [treated time] + 0.054 [soy lecithin concentration] × [lactic acid addition] − 1.66 [soy lecithin concentration] × [orange extracts addition] − 0.064 [soy oil concentration] × [treated time] + 0.887 [soy oil concentration] × [lactic acid addition] − 11.620 [soy oil concentration] × [orange extracts addition] − 0.015 [treated time] × [lactic acid addition] − 0.149 [treated time] × [orange extracts addition] − 3.100 [lactic acid addition] × [orange extracts addition]
Along with the corresponding coefficient from Formula (3), orange extract addition (112.300) played the most important role in the moisture content of the sausage core after 16 days of 4 °C storage, although not at a 5% significant level. As shown in Table 2, the interactive effects of [soy lecithin concentration] × [soy oil concentration] and [soy oil concentration] × [orange extract addition] on MC were observed at a 5% significant level. Treated time and lactic acid addition show an insignificant effect on moisture in linear, quadratic, and 2-way interactions with other parameters (Table 2). The 2D contour plot [Figure 2c] and the 3D surface plot [Figure 2a] showed that MC increased to 48–50% when a high soy lecithin concentration (>3.9%) was associated with a higher soy oil concentration (2.0%) or a higher concentration of soy oil (>2.3%) combined with an addition of orange extracts between 0.05% and 0.40% [Figure 2b,d]. It is worth noting that the porous structure of casings modified by a lower concentration of soy lecithin was larger than that of a higher concentration of soy lecithin [27]. This can explain the phenomenon of why the higher moisture content was achieved with a high soy lecithin concentration because of the smaller porous structure, leading to less moisture loss. The effects of the addition of radix puerariae (RP) extracts along with butylated hydroxyanisole and butylated hydroxytoluene (BHA/BHT) on the moisture content of pork sausages were investigated [40]. Sausage filling added with 1% of RP extracts can achieve significantly higher moisture content (59.59 ± 0.04) than other treatments (p < 0.05). The authors attributed this observation to the muscle fibers’ degradation influenced by the addition of the RP extracts [40].

3.3. Spectra Overview

The mean reflectances of the sausage cores with treatments 10 and 19 (as the representatives) are shown in Figure 3. The mean reflectance of the sample with treatment 10 was lower (i.e., higher absorbance) than the sample with treatment 19. Accordingly, the measured average moisture content of the treatment 10 (49.71 ± 1.78%) sample was significantly higher than that of treatment 19 (43.47 ± 3.50%) (p < 0.05), indicating sausages stuffed with different casing treatments may have their own feature spectra in the NIR range. The different absorbances recorded by the NIR hyperspectral system are linked to combinations of fundamental vibrations of functional groups such as C-H, N-H, O-H, and S-H [42], according to internal structural changes or intermolecular force changes. For instance, the slope shape within the 600–700 nm range is consistently indicative of oxymyoglobin formation, whereas the absorption band in transmittance at 790 nm corresponds to the third overtone of N-H stretching combined with protein [43]. Additionally, subtle absorption observed at 780 nm could be associated with the third overtones of O-H stretching, while subtle absorption observed at 980 nm could be pertinent to the second overtones of O-H stretching that relate to water [3]. Lastly, the absorption observed at 940 nm is linked to fat and pertains to the third overtone of C-H [3].

3.4. Calibration Model Using the Entire Range of Wavelengths

Compared with all the pre-treatments, Rc2 (0.7157) after normalization + 1st derivation treatment was higher than that of raw data (Rc2 = 0.2602) (Table 3), indicating model improvement. It is recognized that normalization can improve spectral characteristics, leading to spectra with consistent areas under the curve that make it easier to compare features within the same plot [44]. When dealing with hyperspectral spectra data, normalization is more effective than the conventional spectrophotometer method in achieving a higher signal-to-noise ratio. The application of first and second derivations can also remove background noise and baseline drift, as well as enhance the clarity of subtle spectral features. It has been reported that SNV is intended to eliminate the variability in reflectance spectra caused by light scattering [45]. Likewise, multiplicative scatter correction is to offset the additive and multiplicative effects [46]. The lower sample amounts may explain the low R2 values.
The calibration model established using the full spectra allows for the detection and correction of any instrument drift or non-linearity that may be present in the data. By using the full spectra, all spectral features are included in the calibration, which can improve the accuracy of the model. Furthermore, using the full spectra helps ensure that all relevant information is captured and accounted for in the calibration process. This is especially important in applications where subtle differences between samples can have significant implications. Finally, using the full spectra can help reduce the risk of overfitting, where the calibration model is overly complex and does not generalize well to new data. Although there are several advantages to developing a calibration model using full spectra, the full model is too long (there are 143 spectra and so there will be 143 variables for full spectra) and may not be of practical use for industrial applications. Important wavelength selection is thus meaningful because if the precision of these models based on the selected important wavelengths is comparable to that of the models that utilize full wavelengths, it can simplify the complex full model and offer valuable insights for using the multi-spectral imaging system to monitor the moisture properties of sausage cores with varied modified casings in real-time.

3.5. Calibration Model Using Important Wavelengths

A total of nine different important wavelengths were chosen (405, 445, 425, 455, 585, 630, 1000, 1075, and 1095 nm) using regression coefficients. The predictive performance of the newly developed models utilizing the chosen important wavelengths is presented in Table 3.
It can be found that the Rc2 value (0.3143) had a slight improvement in the reduced model as compared to the model that utilized full wavelengths (0.2602) (Table 3). This could be attributed to the removal of noise and pixel outliers. The prediction accuracy using the selected wavelengths is equivalent to that using the entire range of wavelengths, and approximately 93% of the wavelengths were eliminated from the entire range of wavelengths, which simplifies the models.

4. Conclusions

This study aimed to assess the feasibility of using a hyperspectral imaging system to measure the moisture content of sausage cores after 16 days of cold room storage. The main conclusions can be drawn as follows:
(1)
The results showed that sausage cores with treatment 19 (SLC: 2.11%, SOC: 1.18%, Treated time: 60 min, OPE: 0.12%, lactic acid addition to salt: 21 mL/kg NaCl) modified casing had lower moisture content than those with treatment 10 modified casing (SLC: 3.16%, SOC: 1.78%, treated time: 45 min, OPE: 0.26%, lactic acid addition to salt: 19.5 mL/kg NaCl).
(2)
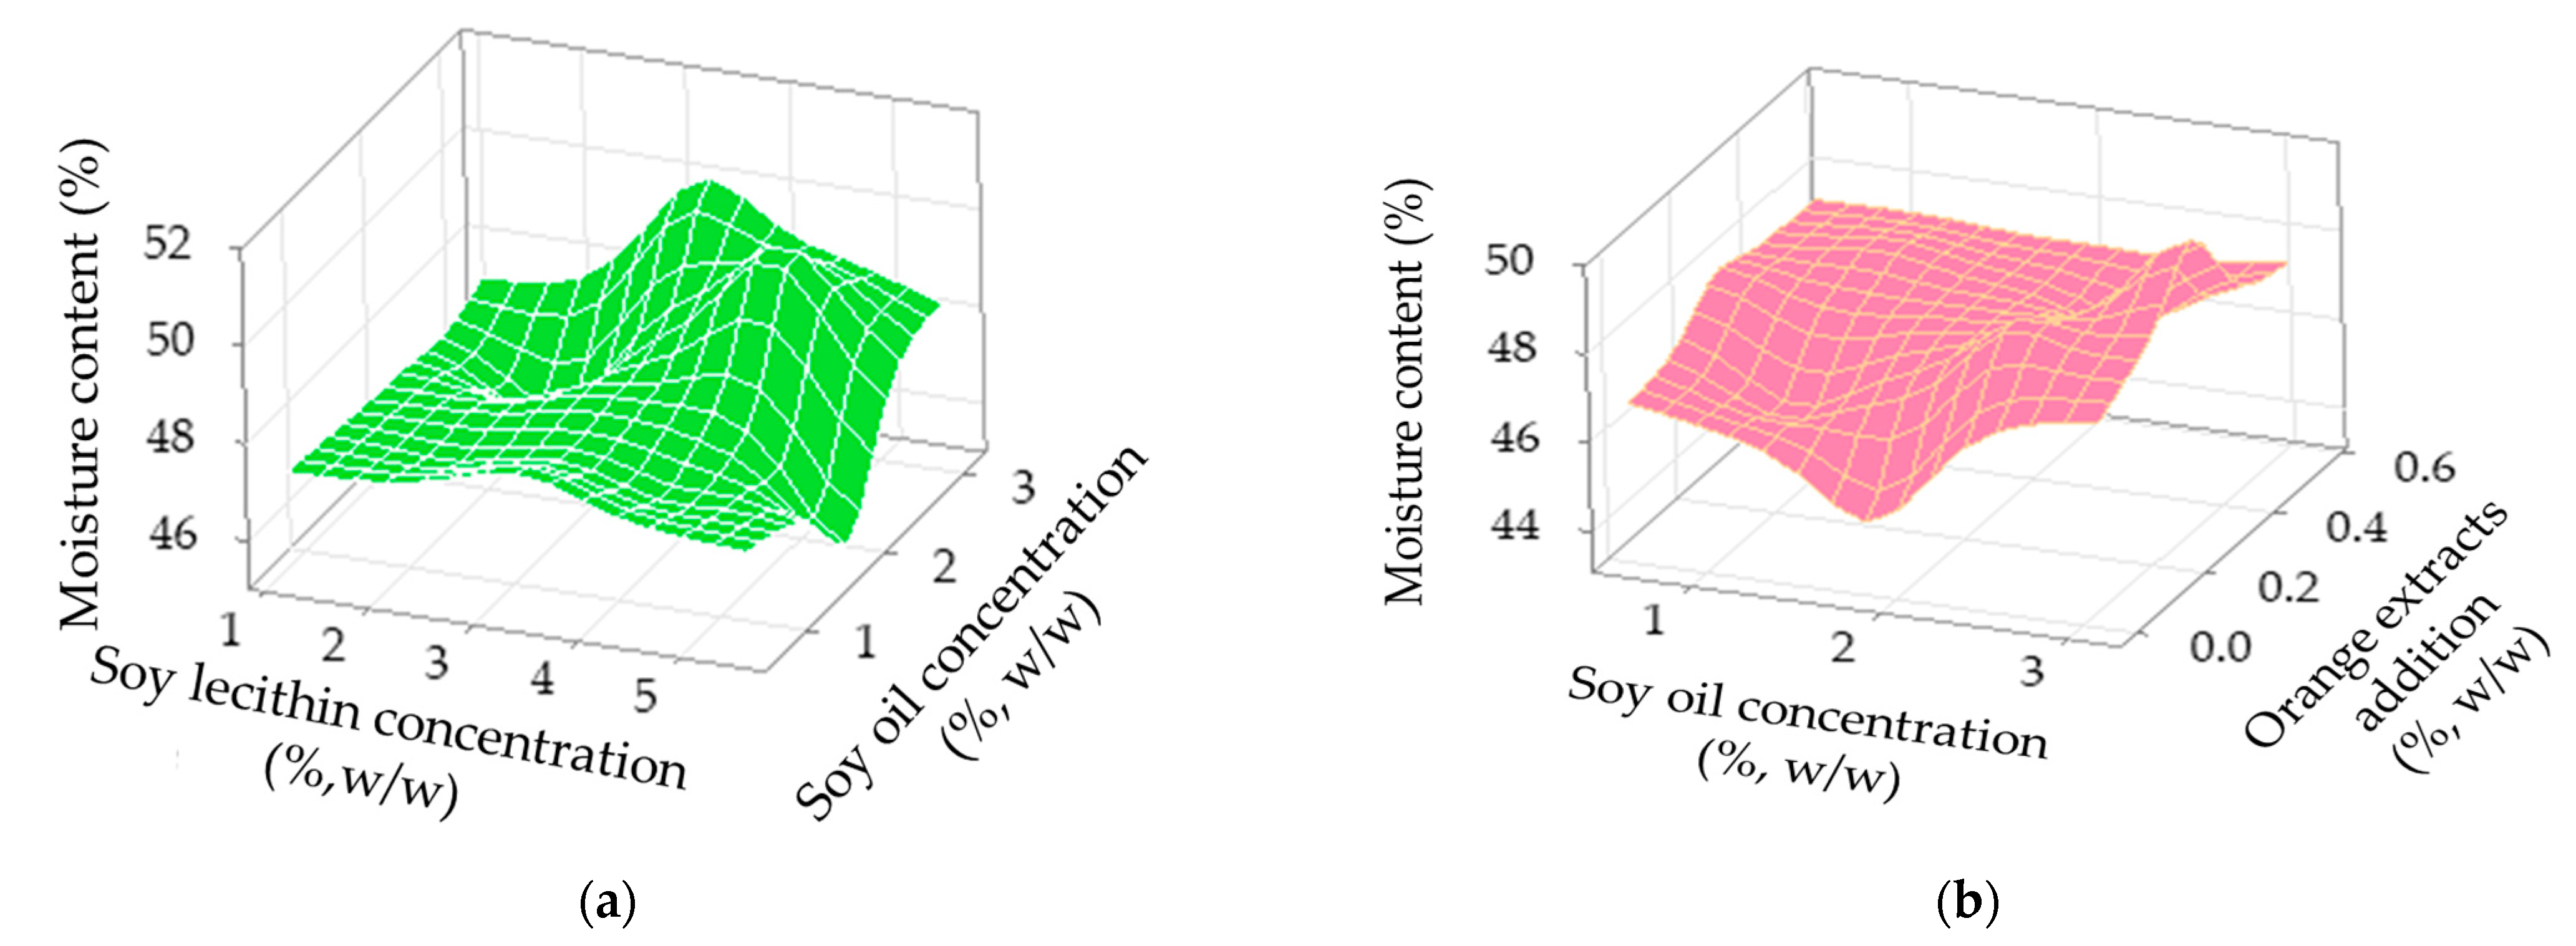
Response surface methodology was used to investigate the effect of different modification processes with varying concentrations of orange extracts on moisture content, achieving an R2 of 78.28% and an insignificant lack of fit. Moisture content increased to 48–50% when a high soy lecithin concentration (>3.9%) was associated with a higher soy oil concentration (2.0%) or a higher concentration of soy oil (>2.3%) combined with an addition of orange extracts between 0.05% and 0.40%.
(3)
Nine important wavelengths (405, 445, 425, 455, 585, 630, 1000, 1075, and 1095 nm) were identified that could be used for the development of a simple and cost-effective multispectral system or for online industrial employment.
The outcomes attained through this method can be applied to automate inspection and quality assessment of sausages through the incorporation of effective image processing algorithms in industrial machine vision systems based on their moisture content.

Author Contributions

Conceptualization, C.-H.F.; methodology, C.-H.F.; software, C.-H.F.; validation, C.-H.F.; formal analysis, C.-H.F.; investigation, C.-H.F. and H.A.; resources, C.-H.F.; data curation, C.-H.F.; writing—original draft preparation, C.-H.F. and H.A.; writing—review and editing, C.-H.F. and H.A.; visualization, C.-H.F.; supervision, H.A.; project administration, C.-H.F. and H.A.; funding acquisition, C.-H.F. and H.A. All authors have read and agreed to the published version of the manuscript.

Funding

This research was funded by the Leading Initiative for Excellent Young Researchers (LEADER) from the Government of Japan Ministry of Education, Culture, Sports, Science and Technology (MEXT) (2020L0277), the Japan Society for the Promotion of Science Grant-in-Aid for Early Career Scientists (20K15477), Sasakawa Scientific Research Grant from The Japan Science Society (2022-3005), FY 2022 Mishima Kaiun Memorial Foundation, Grants-in-Aid for Regional R&D Proposal-Based Program from Northern Advancement Center for Science & Technology of Hokkaido Japan (T-2-4), FY 2022 President’s Discretionary Grants and FY 2021 President’s Discretionary Grants, funded by the Kitami Institute of Technology.

Institutional Review Board Statement

Not applicable.

Informed Consent Statement

Not applicable.

Data Availability Statement

Data are contained within this article.

Acknowledgments

The authors would also like to thank the anonymous reviewers for their constructive comments.

Conflicts of Interest

The authors declare no conflict of interest.

References

  1. Siripatrawan, U.; Makino, Y. Simultaneous assessment of various quality attributes and shelf life of packaged bratwurst using hyperspectral imaging. Meat Sci. 2018, 146, 26–33. [Google Scholar] [CrossRef] [PubMed]
  2. Feng, C.H.; Makino, Y.; Yoshimura, M.; Thuyet, D.C.; García-Martín, J.F. Hyperspectral imaging in tandem with R statistics and image processing for detection and visualisation of pH in Japanese big sausages under different storage conditions. J. Food Sci. 2018, 83, 358–366. [Google Scholar] [CrossRef] [PubMed]
  3. Feng, C.H.; Makino, Y.; Yoshimura, M.; Rodríguez-Pulido, F.J. Real-time prediction of pre-cooked Japanese sausages color with different storage days using hyperspectral imaging. J. Sci. Food Agric. 2018, 98, 2564–2572. [Google Scholar] [CrossRef] [PubMed]
  4. Rodríguez-Pulido, F.J.; Hernández-Hierro, J.M.; Nogales-Bueno, J.; Gordillo, B.; González-Miret, M.L.; Heredia, F.J. A novel method for evaluating flavanols in grape seeds by near infrared hyperspectral imaging. Talanta 2014, 122, 145–150. [Google Scholar] [CrossRef]
  5. Rodríguez-Pulido, F.J.; Gordillo, B.; Heredia, F.J.; González-Miret, M.L. CIELAB—Spectral image matching: An app for merging colorimetric and spectral images for grapes and derivatives. Food Control 2021, 125, 108038. [Google Scholar] [CrossRef]
  6. Rodríguez-Pulido, F.J.; Mora-Garrido, A.B.; González-Miret, M.L.; Heredia, F.J. Research progress in imaging technology for assessing quality in wine grapes and seeds. Foods 2022, 11, 254. [Google Scholar] [CrossRef] [PubMed]
  7. Cheng, J.H.; Sun, J.; Yao, K.S.; Xu, M.; Tian, Y.; Dai, C.X. A decision fusion method based on hyperspectral imaging and electronic nose techniques for moisture content prediction in frozen-thawed pork. LWT Food Sci. Technol. 2022, 165, 113778. [Google Scholar] [CrossRef]
  8. Zhuang, Q.B.; Peng, Y.K.; Yang, D.Y.; Wang, Y.L.; Zhao, R.H.; Chao, K.L.; Guo, Q.H. Detection of frozen pork freshness by fluorescence hyperspectral image. J. Food Eng. 2022, 316, 110840. [Google Scholar] [CrossRef]
  9. Cheng, J.H.; Sun, J.; Yao, K.S.; Xu, M.; Zhou, X. Nondestructive detection and visualization of protein oxidation degree of frozen-thawed pork using fluorescence hyperspectral imaging. Meat Sci. 2022, 194, 108975. [Google Scholar] [CrossRef]
  10. Hu, M.-H.; Dong, Q.-L.; Liu, B.-L. Classification and characterization of blueberry mechanical damage with time evolution using reflectance, transmittance and interactance imaging spectroscopy. Comput. Electron. Agric. 2016, 122, 19–28. [Google Scholar] [CrossRef]
  11. Hu, M.-H.; Dong, Q.-L.; Liu, B.-L.; Opara, U.L. Prediction of mechanical properties of blueberry using hyperspectral interactance imaging. Postharvest Biol. Technol. 2016, 115, 122–131. [Google Scholar] [CrossRef]
  12. Wan, G.-L.; Fan, S.-X.; Liu, G.S.; He, J.G.; Wang, W.; Li, Y.; Cheng, L.J.; Ma, C.; Guo, M. Fusion of spectra and texture data of hyperspectral imaging for prediction of myoglobin content in nitrite-cured mutton. Food Control 2023, 144, 109332. [Google Scholar] [CrossRef]
  13. Zhang, J.J.; Ma, Y.H.; Liu, G.S.; Fan, N.Y.; Li, Y.; Sun, Y.R. Rapid evaluation of texture parameters of Tan mutton using hyperspectral imaging with optimization algorithms. Food Control 2022, 135, 108815. [Google Scholar] [CrossRef]
  14. Zhang, J.J.; Liu, G.S.; Li, Y.; Guo, M.; Pu, F.N.; Wang, H. Rapid identification of lamb freshness grades using visible and near-infrared spectroscopy (Vis-NIR). J. Food Compos. Anal. 2022, 111, 104590. [Google Scholar] [CrossRef]
  15. Ktenioudaki, A.; Esquerre, C.A.; Nunes, C.M.D.N.; O’Donnell, C.P. A decision support tool for shelf-life determination of strawberries using hyperspectral imaging technology. Biosyst. Eng. 2022, 221, 105–117. [Google Scholar] [CrossRef]
  16. León-Ecay, S.; López-Maestresalas, A.; Murillo-Arbizu, M.T.; Beriain, M.J.; Mendizabal, J.A.; Arazuri, S.; Carmen, J.; Bass, P.D.; Colle, M.J.; García, D.; et al. Classification of beef longissimus thoracis muscle tenderness using hyperspectral imaging and chemometrics. Foods 2022, 11, 3105. [Google Scholar] [CrossRef]
  17. Song, K.; Wang, S.-H.; Yang, D.; Shi, T.-Y. Combination of spectral and image information from hyperspectral imaging for the prediction and visualization of the total volatile basic nitrogen content in cooked beef. J. Food Meas. Charact. 2021, 15, 4006–4020. [Google Scholar] [CrossRef]
  18. Xie, A.G.; Sun, J.; Wang, T.M.; Liu, Y.H. Visualized detection of quality change of cooked beef with condiments by hyperspectral imaging technique. Food Sci. Biotechnol. 2022, 31, 1257–1266. [Google Scholar] [CrossRef]
  19. Ahmed, M.; Reed, D.D.; Young, J.M.; Eshkabilov, S.; Berg, E.P.; Sun, X. Beef quality grade classification based on intramuscular fat content using hyperspectral imaging technology. Appl. Sci. 2021, 11, 4588. [Google Scholar] [CrossRef]
  20. Cernadas, E.; Fernández-Delgado, M.; Fulladosa, E.; Munoz, I. Automatic marbling prediction of sliced dry-cured ham using image segmentation, texture analysis and regression. Expert Syst. Appl. 2022, 206, 117765. [Google Scholar] [CrossRef]
  21. Feng, C.H.; Makino, Y.; García-Martín, J.F. Hyperspectral imaging coupled with multivariate analysis and image processing for detection and visualisation of colour in cooked sausages stuffed with different modified casings. Foods 2020, 9, 1089. [Google Scholar] [CrossRef] [PubMed]
  22. Feng, C.H.; Makino, Y.; Yoshimura, M.; Rodríguez-Pulido, F.J. Estimation of adenosine triphosphate content in ready-to-eat sausages with different storage days, using hyperspectral imaging coupled with R statistics. Food Chem. 2018, 264, 419–426. [Google Scholar] [CrossRef] [PubMed]
  23. Siripatrawan, U. Hyperspectral imaging for rapid evaluation and visualization of quality deterioration index of vacuum packaged dry-cured sausages. Sens. Actuators B Chem. 2018, 254, 1025–1032. [Google Scholar] [CrossRef]
  24. Ma, F.; Zhang, B.; Wang, W.; Li, P.J.; Niu, X.L.; Chen, C.; Zheng, L. Potential use of multispectral imaging technology to identify moisture content and water-holding capacity in cooked pork sausages. J. Sci. Food Agric. 2018, 98, 1832–1838. [Google Scholar] [CrossRef]
  25. Feng, C.H.; Arai, H.; Rodríguez-Pulido, F.J. Evaluation of pH in sausages stuffed in a modified casing with orange extracts by hyperspectral imaging coupled with response surface methodology. Foods 2022, 11, 2797. [Google Scholar] [CrossRef]
  26. Feng, C.H.; Drummond, L.; Zhang, Z.H. Evaluation of innovative immersion vacuum cooling with different pressure reduction rates and agitation for cooked sausages stuffed in natural or artificial casing. LWT Food Sci. Technol. 2014, 59, 77–85. [Google Scholar] [CrossRef]
  27. Feng, C.H.; Drummond, L.; Sun, D.W.; Zhang, Z.-H. Evaluation of natural hog casings modified by surfactant solutions combined with lactic acid by response surface methodology. LWT Food Sci. Technol. 2014, 58, 427–438. [Google Scholar] [CrossRef]
  28. Manzoor, A.; Haque, A.; Ahmad, S.; Hopkins, D.L. Incorporation of betel leaf extract provides oxidative stability and improves phytochemical, textural, sensory and antimicrobial activities of buffalo meat sausages. Meat Sci. 2023, 200, 109157. [Google Scholar] [CrossRef]
  29. Zhang, Y.L.; Lu, Y.Y.; Chen, F.S. Relationship between physicochemical properties and microbial structural distribution of Chinese-style and Salami fermented sausages. Food Biosci. 2023, 53, 102583. [Google Scholar] [CrossRef]
  30. Feng, C.H. Quality evaluation and mathematical modelling approach to estimate the growth parameters of total viable count in sausages with different casings. Foods 2022, 11, 634. [Google Scholar] [CrossRef]
  31. Feng, C.-H.; Otani, C.; Ogawa, Y. Innovatively identifying naringin and hesperidin by using terahertz spectroscopy and evaluating flavonoids extracts from waste orange peels by coupling with multivariate analysis. Food Control 2022, 137, 108897. [Google Scholar] [CrossRef]
  32. Sammani, M.S.; Cerdὰ, V. Sample pre-treatment and flavonoids analytical methodologies for the quality control of foods and pharmaceutical matrices. In The Book of Flavonoids, 1st ed.; Feng, C.-H., García Martín, J.F., Eds.; Nova Science Publishers, Inc.: New York, NY, USA, 2021; Chapter 1; pp. 1–130. [Google Scholar]
  33. Bellavite, P.; Donzelli, A. Hesperidin and SARS-CoV-2: New light on the healthy function of citrus fruits. Antioxidants 2020, 9, 742. [Google Scholar] [CrossRef] [PubMed]
  34. Sawalha, S.M.S.; Arráez-Román, D.; Segura-Carretero, A.; Fernández-Gutiérrez, A. Quantification of main phenolic compounds in sweet and bitter orange peel using CE-MS/MS. Food Chem. 2009, 116, 567–574. [Google Scholar] [CrossRef]
  35. Li, X.W.; Geng, M.M.; Peng, Y.Z.; Meng, L.S.; Lu, S.M. Molecular immune pathogenesis and diagnosis of COVID-19. J. Pharm. Anal. 2020, 10, 102–108. [Google Scholar] [CrossRef]
  36. Feng, C.H.; Arai, H. Evaluation of hesperidin on sausages stuffed in a new modified casing during long-term storage—A preliminary study. Sustainability 2022, 14, 9071. [Google Scholar] [CrossRef]
  37. Mishra, A.; Mohite, A.M.; Sharma, N. Influence of particle size on physical, mechanical, thermal, and morphological properties of tamarind- fenugreek mucilage biodegradable films. Polym. Bull. 2023, 80, 3119–3133. [Google Scholar] [CrossRef]
  38. Feng, C.H.; García-Martín, J.F.; Lavado, M.B.; López-Barrera, M.C.; Álvarez-Mateos, P. Evaluation of different solvents on flavonoids extraction efficiency from sweet oranges and ripe and immature Seville oranges. Int. J. Food Sci. 2020, 55, 3123–3134. [Google Scholar] [CrossRef]
  39. Nogata, Y.; Sakamoto, K.; Shiratsuchi, H.; Ishii, T.; Yano, M.; Ohta, H. Flavonoid composition of fruit tissues of citrus species. Biosci. Biotechnol. Biochem. 2006, 70, 178–192. [Google Scholar] [CrossRef]
  40. Jung, E.-Y.; Yun, I.-R.; Go, G.-W.; Kim, G.-D.; Seo, H.-W.; Joo, S.-T.; Yang, H.-S. Effects of radix puerariae extracts on physicochemical and sensory quality of precooked pork sausage during cold storage. LWT Food Sci. Technol. 2012, 46, 556–562. [Google Scholar] [CrossRef]
  41. Zhang, J.; Zhang, L.Y.; Lai, C.L.; Liang, Y.; Gao, L.L.; Kaliaperumal, K.; Jiang, Y.M. Nutraceutical potential of navel orange peel in diabetes management: The chemical profile, antioxidant, α-glucosidase inhibitory and antiglycation effects of its flavonoids. Food Biosci. 2022, 49, 101943. [Google Scholar] [CrossRef]
  42. Feng, C.H. Optimizing procedures of ultrasound-assisted extraction of waste orange peels by response surface methodology. Molecules 2022, 27, 2268. [Google Scholar] [CrossRef] [PubMed]
  43. Sanz, J.A.; Fernandes, A.M.; Barrenechea, E.; Silva, S.; Santos, V.; Gonçalves, N.; Paternain, D.; Jurio, A.; Melo-Pinto, P. Lamb muscle discrimination using hyperspectral imaging: Comparison of various machine learning algorithms. J. Food Eng. 2016, 174, 92–100. [Google Scholar] [CrossRef]
  44. Jamil, Z.; Mohite, A.; Sharma, N. Selected engineering properties and drying behavior of tendu (diospyros melanoxylon roxb.) fruit. Curr. Res. Nutr. Food Sci. 2020, 8, 622–629. [Google Scholar] [CrossRef]
  45. Jia, B.B.; Yoon, S.-C.; Zhuang, H.; Wang, W.; Li, C.Y. Prediction of pH of fresh chicken breast fillets by VNIR hyperspectral imaging. J. Food Eng. 2017, 08, 57–65. [Google Scholar] [CrossRef]
  46. Helland, I.S.; Næs, T.; Isaksson, T. Related versions of the multiplicative scatter correction method for preprocessing spectroscopic data. Chemom. Intell. Lab. Syst. 1995, 29, 233–241. [Google Scholar] [CrossRef]
Figure 1. HPLC profile of representative standard hesperidin (a) and orange extracts (b). Note: The x-axis is retention time (min) and the y-axis is milli-absorbance (mAU). The numbers beside the absorbance are the retention times.
Applsci 13 05300 g001aApplsci 13 05300 g001b
Figure 2. The moisture content of the sausage cores as affected by SLC and SOC (a) 3D surface plot; (c) 2D contour plot; and affected by SOC and OPE additions (b) 3D surface plot; (d) 2D contour plot.
Applsci 13 05300 g002aApplsci 13 05300 g002b
Figure 3. Mean reflectance spectral of samples with treatments 10 and 19 (as the representatives).
Applsci 13 05300 g003
Table 1. The parameters employed in the central composite design with physical values.
FactorCoded (Xi) Variable Level
StarLowCenterHighStar
−2−1012
1 SLC (%, w/w)1.082.153.174.205.17
2 SOC (%, w/w)0.601.181.782.392.94
3 Treated Time (min)45607590105
4 Orange Extracts (%, w/w)00.120.260.400.54
5 Lactic Acid (ml/kg NaCl)16.51819.52122.5
Note: 1 SLC: soy lecithin concentration, 2 SOC: soy oil concentration.
Table 2. Regression summaries for dependent variables: coefficients in terms of coded factors and fit statics.
Coded Coefficients
TermCoefficientsSE Coefficientst-Valuep-Value
Constant48.0040.68969.720
1 SLC 0.5680.3521.610.136
2 SOC 0.4670.3521.330.212
3 Treated Time−0.4240.352−1.20.254
4 Orange Extracts0.2280.3520.650.532
5 Lactic Acid−0.4780.352−1.360.202
Square
1 SLC2−0.4230.319−1.330.211
2 SOC20.2960.3190.930.372
3 Treated Time20.2580.3190.810.435
4 Orange Extracts2−0.4180.319−1.310.216
5 Lactic Acid2−0.4380.319−1.370.197
2-way interaction
1 SLC × 2 SOC1.1470.4322.660.022
1 SLC × 3 Treated Time−0.7010.432−1.620.133
1 SLC × 4 Orange Extracts−0.2530.432−0.590.570
1 SLC × 5 Lactic Acid0.0910.4320.210.838
2 SOC × 3 Treated Time−0.5970.432−1.380.194
2 SOC × 4 Orange Extracts−0.9990.432−2.310.041
2 SOC × 5 Lactic Acid0.8320.4321.930.080
3 Treated Time × 4 Orange Extracts−0.3080.432−0.710.490
3 Treated Time × 5 Lactic Acid0.3440.4320.80.443
4 Orange Extracts × 5 Lactic Acid−0.640.432−1.480.166
Note: 1 SLC: soy lecithin concentration, 2 SOC: soy oil concentration, SE coefficients: standard error of the regression coefficients.
Table 3. Moisture content of sausage cores using PLSR with the entire range of wavelengths.
TreatmentsTraining Set
(n = 22)
Prediction Set
(n = 11)
Cross-Validation
Rc2RMSEC (%)Rp2RMSEP (%)Rcv2RMSECV (%)
Full wavelengthsUntreated (Raw)0.26021.66530.03382.85400.04142.2560
Normalization0.33311.58120.03252.85590.04542.2513
1st Derivation 0.58451.24800.04982.83020.04732.2491
2nd Derivation0.31651.6007Na3.19390.40031.7844
Standard normal variate0.03031.9067Na3.01370.01462.2873
Multiplicative scatter correction0.03001.9070Na3.01210.01432.2877
Normalization and 1st Derivation 0.71571.03240.05662.82000.04162.2558
1st Derivation and Normalization 0.04671.8905Na2.91870.07042.2216
Normalization and 2nd Derivation0.31081.6074Na3.20910.37521.8213
2nd Derivation and Normalization 0.60331.21950.13482.70060.14642.1289
Important wavelengthsUntreated (Raw)0.31431.60340.04442.83830.03042.2688
Normalization0.31491.60260.05792.81810.07912.2112
1st Derivation 0.37611.52940.02412.86830.16962.0998
2nd Derivation0.30371.61570.04542.83680.14952.1250
Standard normal variate0.32181.59460.04462.83800.21972.0353
Multiplicative scatter correction0.31621.60110.05192.82710.054012.2411
Normalization and 1st Derivation 0.34361.56870.03012.85940.20602.0531
1st Derivation and Normalization 0.06471.8726Na3.08060.08722.2015
Normalization and 2nd Derivation0.18461.7484Na2.99070.13752.1399
2nd Derivation and Normalization 0.17511.75860.11502.73130.01042.2922
Note: RMSEC: the root mean square error of calibration; RMSEV: the root mean square error of validation.
Disclaimer/Publisher’s Note: The statements, opinions and data contained in all publications are solely those of the individual author(s) and contributor(s) and not of MDPI and/or the editor(s). MDPI and/or the editor(s) disclaim responsibility for any injury to people or property resulting from any ideas, methods, instructions or products referred to in the content.

