Article

Decision Support System for Predicting Mortality in Cardiac Patients Based on Machine Learning

by
Ashir Javeed
1,2,
Muhammad Asim Saleem
3,
Ana Luiza Dallora
2,
Liaqat Ali
4,
Johan Sanmartin Berglund
2 and
Peter Anderberg
2,5,*
1
Aging Research Center, Karolinska Institutet, 171 65 Stockholm, Sweden
2
Department of Health, Blekinge Institute of Technology, 371 79 Karlskrona, Sweden
3
Center of Excellence in Artificial Intelligence, Machine Learning and Smart Grid Technology, Department of Electrical Engineering, Chulalongkorn University, Bangkok 103 30, Thailand
4
Department of Electrical Engineering, University of Science and Technology Bannu, Bannu 28100, Pakistan
5
School of Health Sciences, University of Skövde, 541 28 Skövde, Sweden
*
Author to whom correspondence should be addressed.
Appl. Sci. 2023, 13(8), 5188; https://doi.org/10.3390/app13085188
Submission received: 3 March 2023 / Revised: 14 April 2023 / Accepted: 19 April 2023 / Published: 21 April 2023
(This article belongs to the Special Issue Opinion Mining and Sentiment Analysis Using Deep Neural Network)

Abstract

:
Researchers have proposed several automated diagnostic systems based on machine learning and data mining techniques to predict heart failure. However, researchers have not paid close attention to predicting cardiac patient mortality. We developed a clinical decision support system for predicting mortality in cardiac patients to address this problem. The dataset collected for the experimental purposes of the proposed model consisted of 55 features with a total of 368 samples. We found that the classes in the dataset were highly imbalanced. To avoid the problem of bias in the machine learning model, we used the synthetic minority oversampling technique (SMOTE). After balancing the classes in the dataset, the newly proposed system employed a χ 2 statistical model to rank the features from the dataset. The highest-ranked features were fed into an optimized random forest (RF) model for classification. The hyperparameters of the RF classifier were optimized using a grid search algorithm. The performance of the newly proposed model ( χ 2 _RF) was validated using several evaluation measures, including accuracy, sensitivity, specificity, F1 score, and a receiver operating characteristic (ROC) curve. With only 10 features from the dataset, the proposed model χ 2 _RF achieved the highest accuracy of 94.59%. The proposed model χ 2 _RF improved the performance of the standard RF model by 5.5%. Moreover, the proposed model χ 2 _RF was compared with other state-of-the-art machine learning models. The experimental results show that the newly proposed decision support system outperforms the other machine learning systems using the same feature selection module ( χ 2 ).

1. Introduction

Heart disease has been a major contributor to mortality over the past decade and is the leading cause of death [1]. The Global Burden of Disease study found that heart disease has increased significantly over the past decade. In India alone, nearly 1.7 million people have died from serious heart disease. According to the World Health Organization (WHO), heart disease causes morbidity and mortality worldwide. In 2019, nearly 17.9 million people died from cardiovascular disease, accounting for 32% of all deaths worldwide; 85% of these deaths were due to heart attacks and strokes (WHO—cardiovascular diseases (CVDs)) [2]. Large amounts of data are generated daily in healthcare, containing repetition, multiple assignments, insufficient information, and a warm relationship with time [3]. These data are difficult to handle, and data mining techniques help in the sophisticated use of these data to extract useful knowledge and draw conclusions. Thus, these techniques help health professionals make better decisions about effective patient treatment in a relatively short time [4]. Therefore, it is very important to develop techniques that help in the early detection of the disease to save countless lives. Traditional medical treatments include diagnostic tests to detect heart diseases, such as auscultation, blood pressure, pulse rate, electrocardiogram (ECG), and blood glucose levels. These tests are expensive and time-consuming; the patient may be unable to wait and may need immediate treatment [5].
There are many types of heart disease, such as coronary, cardiovascular, and cardiomyopathy. Cardiovascular diseases affect blood flow and veins and are usually related to the heart [6]. The diagnosis of coronary disease can be divided into three main tasks. First, datasets are analyzed, then multiple designs are created, and finally, the design that combines the lowest possible cost with the greatest possible efficacy is selected. Finally, the correct information is extracted from the datasets, and the resulting observations are made. Since there are many risk factors, such as high blood pressure, a fast heartbeat, high cholesterol, diabetes, the heart, and other parameters, it is difficult to predict the mortality rate related to the heart. Certain data mining techniques, such as neural networks and machine learning, are used to determine the severity of the disease. Other methods, such as Naive Bayes (NB), decision tree (DT), K-nearest neighbor (kNN), and genetic algorithm (GA) are also used in classifying the severity of disease [7]. Heart diseases are difficult to treat because they have complex effects on patients’ lives; therefore, they are difficult to manage, and if not treated carefully, they can cause severe damage to the heart, ultimately leading to the patient’s death [8].
Researchers have designed and developed several clinical decision support systems [9], and automated diagnostic systems based on machine learning and data mining for various disease conditions, such as hepatitis [10], dementia [11,12], and heart disease [13,14]. One of these methods was presented by L. Ali et. al., who proposed a deep neural network-based diagnostic system for cardiovascular disease prediction. The authors claim that the χ 2 model for feature classification in their proposed work has an accuracy of 93% [14]. Javeed et al. proposed an intelligent learning system based on a random search algorithm and RF for early heart disease prediction. Other researchers also developed other methods. The accuracy of their proposed model was 93.33%, which was the highest possible [15]. Chen et al. [16] used ECG data to predict cardiac issues early. The method uses a two-stage predictive framework for processing ECG data. A global classification factor compared abnormalities with a universal reference model. Pecchia et al. [17] built a health monitoring system to identify patients with heart failure. A data mining strategy using the CART method and HRV was used for feature extraction. The proposed method achieved 96.39% accuracy in identifying heart failure cases. The accuracy in determining the severity of heart failure was 79.31%. The publicly available RR Interval database was used for the studies as the data source for heart failure. The dataset contained information from 83 participants, 54 of whom were healthy and 29 of whom were diagnosed with heart failure. Kumar et al. [18] utilized a fuzzy resolution process for heart failure detection. The proposed solution involves a combination of ANN and fuzzy logic. The approach was evaluated using an open-source dataset of cardiac disease from Cleveland. The accuracy of the proposed ANFIS model was 91.83%. MATLAB was used for all experiments. Maio et al. [19] used an enhanced random survival forest to make a model that predicts how long heart failure patients will live in the hospital. A public dataset from the MIMIC II clinical database was used for the trials. This dataset had 8059 patients and 32 characteristics. The suggested approach had 82.01% accuracy. A.A. Almazroi [20] developed several machine learning techniques to predict the survival of cardiac patients. In his proposed work, the decision tree achieved the highest accuracy (85%) compared to the other supervised machine learning techniques. R. Aggrawal and S. Pal [21] developed six models; each developed model used eight machine learning classifiers, such as logistic regression (LR), decision tree (DT), support vector machine (SVM), linear discriminant analysis (LDA), random forest (RF), K-nearest neighbor (KNN), and Naive Bayes (NB). Other measures, such as precision, recovery rate, F1 score, support score, and AUC/ROC were calculated to support the accuracy assessment of the model. The highest accuracy improvement was achieved by linear discriminant analysis with a performance of 80.61%, as well as 83.17% by RF in one model, 83.12% by LDA, and 83.05% by LR. Table 1 provides a summary of previous studies on the prediction of heart failure and mortality in cardiac patients using machine learning methods
However, the prediction of heart failure refers to identifying patients at risk of developing heart failure in the future. This may include assessing risk factors such as age, hypertension, diabetes, obesity, and history of cardiovascular disease. Early identification of patients at risk of heart failure allows timely interventions to prevent the development of heart failure and improve outcomes. On the other hand, predicting mortality in heart patients involves identifying patients at risk of dying from their heart disease. Factors such as the severity of the disease, the patient’s age, general health, and the presence of comorbidities can be taken into account. Predicting mortality is important in determining the appropriate level of care and treatment for the patient and providing appropriate support for end-of-life care decisions. Therefore, the predictions of heart failure and mortality are important for the management of cardiac patients, but they serve different purposes. Predicting heart failure helps identify patients at risk of developing heart failure, whereas predicting mortality helps identify patients at risk of dying from their heart disease.
A summary of the major contributions of this study follows:
  • A decision support system ( χ 2 _RF) is proposed for mortality prediction in cardiac patients;
  • The problem with the biased ML model due to imbalanced classes in the dataset is addressed by deploying SMOTE;
  • The constructed decision support system ( χ 2 _RF) outperforms other cutting-edge machine learning models for the prediction of mortality in cardiac patients, and boosts the performance of the conventional random forest model by 5.5% for the prediction of mortality in cardiac patients;
  • The proposed method ( χ 2 _RF) has reduced temporal complexity since it uses fewer features;

Aim of the Study

We developed an automated decision support system based on literature studies to predict mortality in cardiac patients. We used a grid search strategy in the newly developed model to optimize the hyperparameters of the RF model. We used the chi-squared statistical model ( χ 2 ) to select relevant and useful features from the dataset. The feature selection module ( χ 2 ) and the classification module (RF) are the two main components of the proposed hybrid model. To balance the classes in the dataset and solve the problem of bias in the ML model, we implemented the synthetic minority oversampling technique (SMOTE) technique. To confirm the effectiveness of the proposed model ( χ 2 _RF), we used several evaluation measures, including accuracy, sensitivity, specificity, the receiver operator characteristic curve, the area under the curve (AUC), the F1 score, and the Matthews correlation coefficient (MCC). We also performed several tests to evaluate the effectiveness of the proposed model.

2. Materials and Methods

2.1. Dataset Description

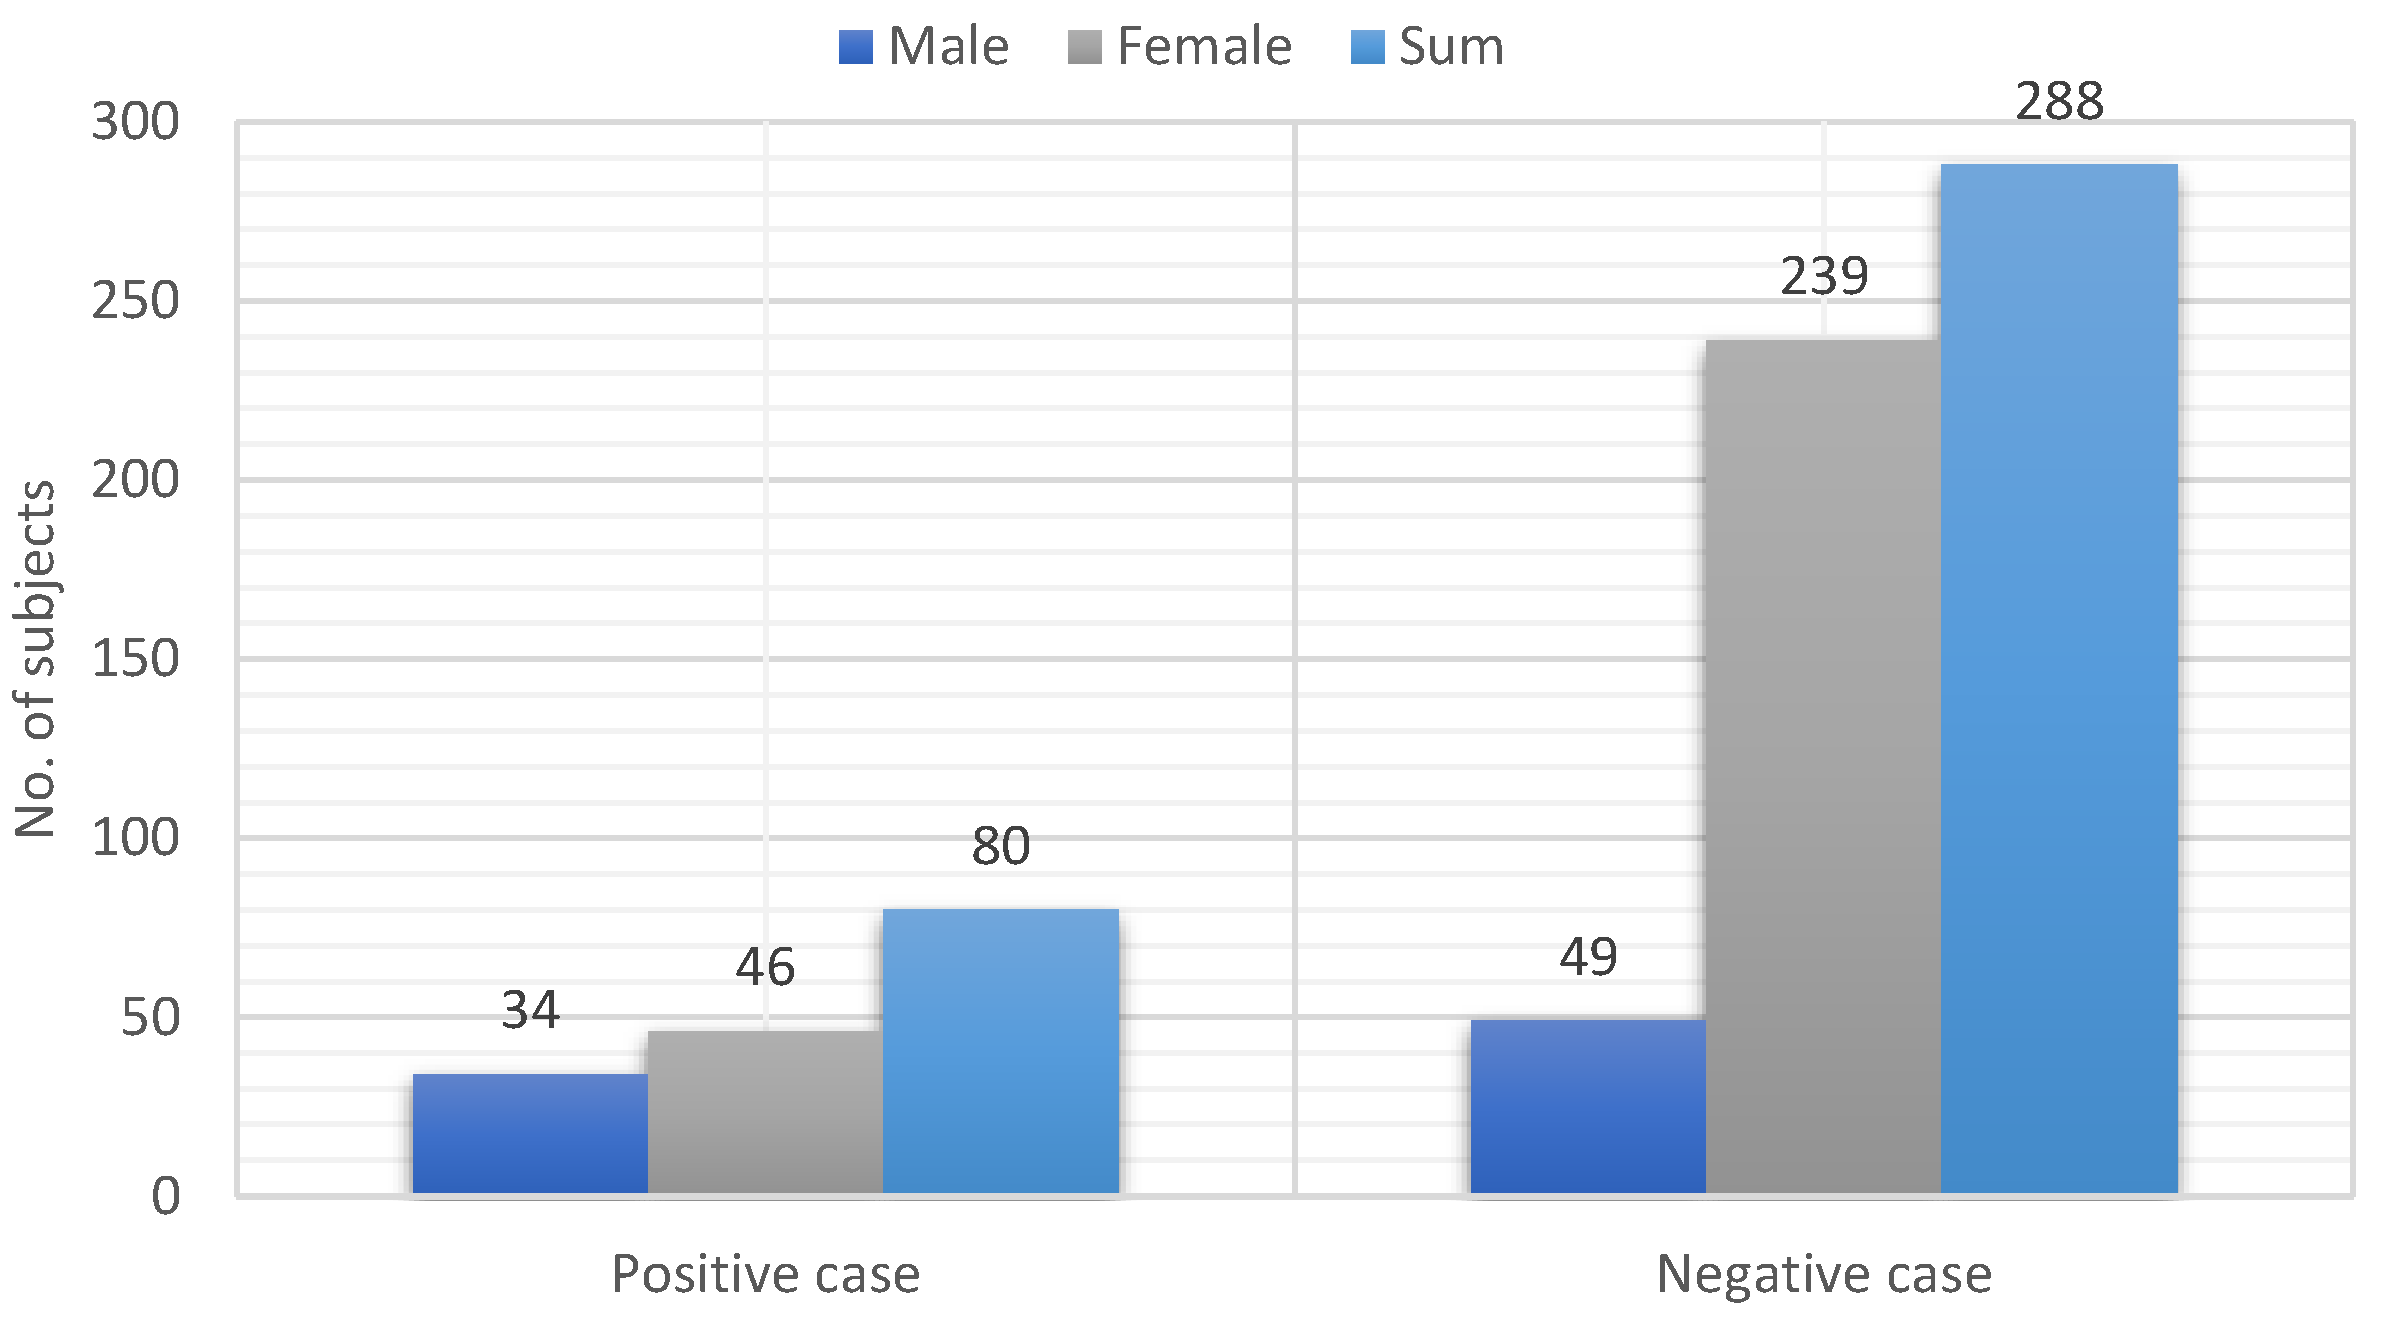
For this study, an online dataset was collected from GitHub for the experimental purpose of predicting mortality in cardiac patients [22]. The collected dataset is based on cardiac patients’ electronic health records (EHR) and comprises 55 features. The features belong to demographics, lifestyle, medical history, absolute or relative contraindications to streptokinase, by streptokinase, and medication. The dataset contains a total of 368 samples. The dataset contains 285 males and 83 females. The total number of patients in the dataset suffering from heart failure is 80. In addition, binary labeling was used in this study, with label value 0 indicating no mortality due to heart disease and label value 1 indicating cardiac mortality. Regarding men, women, and the sum of the samples, Figure 1 provides the statistical data of samples concerning positive and negative case samples in the dataset.

2.2. Proposed Work

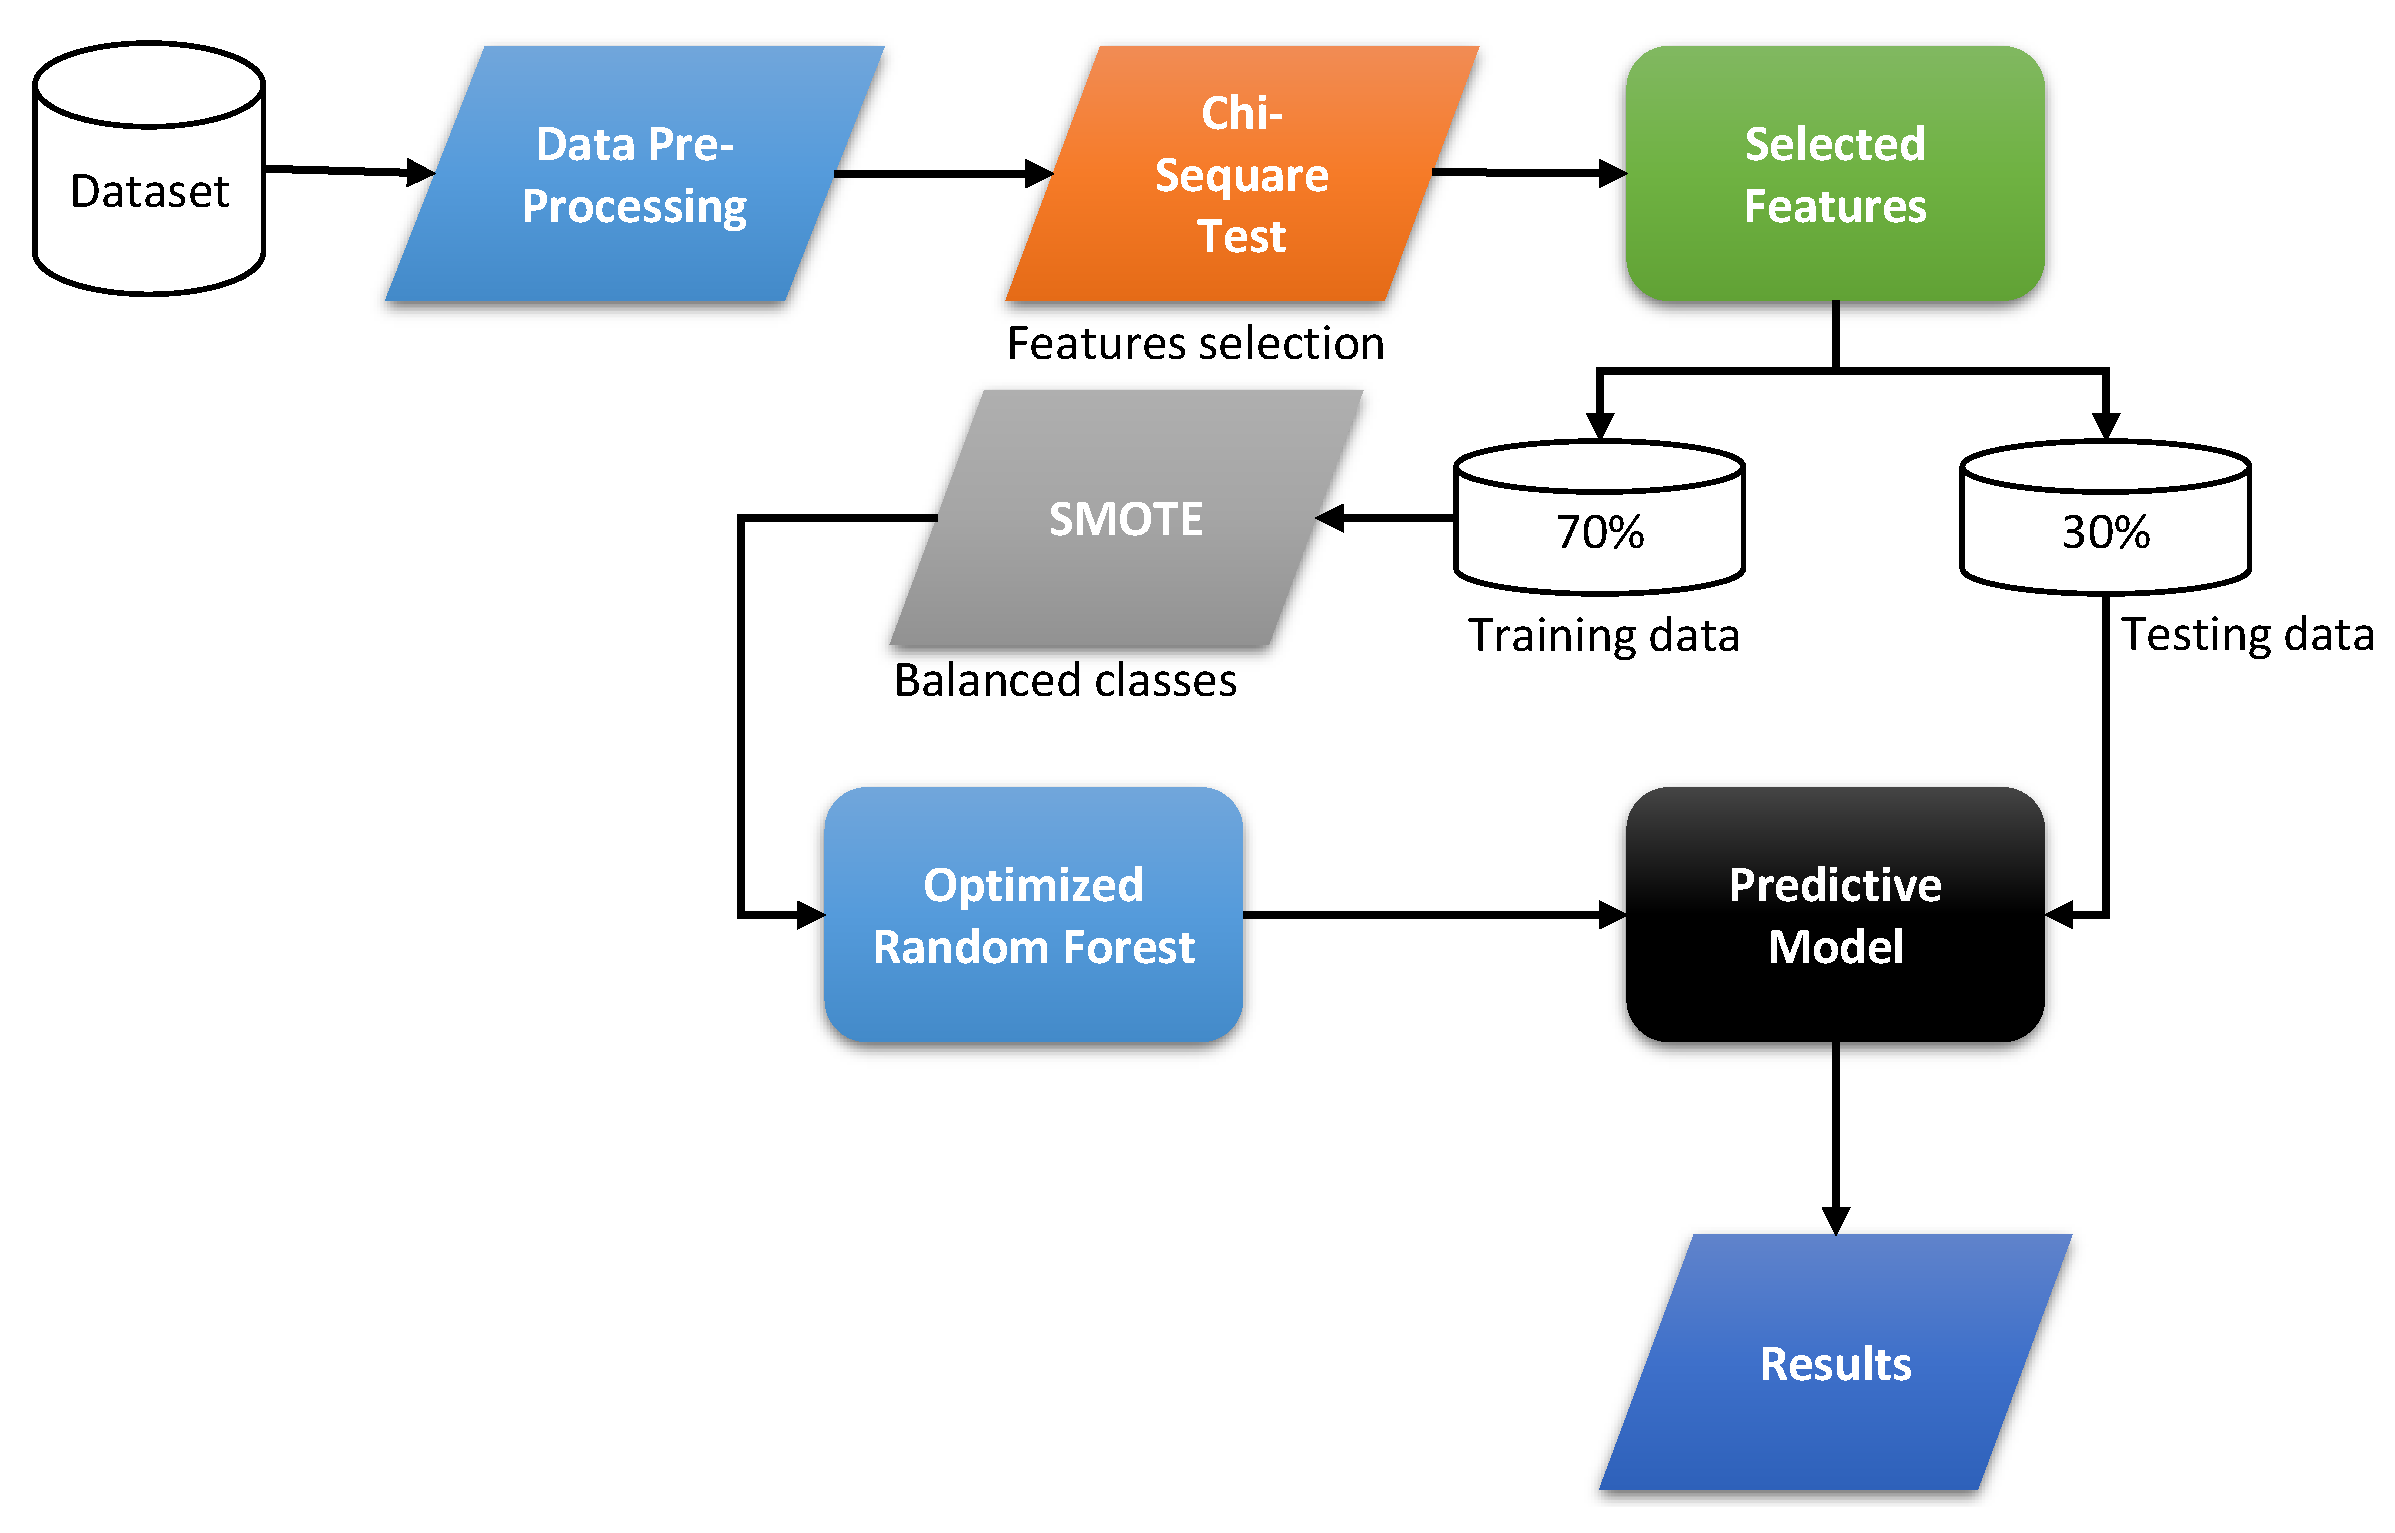
In this study, we developed a diagnostic system for the early detection of mortality risk in heart disease. The proposed diagnostic system uses a dataset of 55 features based on daily lifestyle factors, medical history, and biochemical test results. The newly developed system consists of two main components. One of the main components is to select useful features from the dataset that can help predict the cause of cardiac mortality. The second component, on the other hand, is a classifier that predicts cardiac mortality. To select features from the given dataset, we used a static chi-square model ( χ 2 ), whereas, for the classification problem, we used a random forest classifier (RF), fine-tuning the hyperparameters of the RF using the grid search algorithm [23]. The working of the newly developed system is given in Figure 2.
For this study, we used the ( χ 2 ) model to rank the features from the dataset to eliminate irrelevant features. In feature selection, ( χ 2 ) computes the statistics between the non-negative feature κ i and the class. The model performs the ( χ 2 ) test, which analyzes the degree of dependence between the features and the class. As a result, the model can exclude features more likely to be class-independent, as these features could be considered unimportant for classification. The features are sorted in the first phase depending on the ( χ 2 ) test score. Then, we search for ideal features ω from the scored features. For information on feature selection and discretization using ( χ 2 ) statistics, the reader is referred to [24]. Mathematical feature selection based on the ( χ 2 )-test is described as follows:
From Table 2, we can calculate the statistical score χ 2 for positive and negative classes for the ℧ instances of the binary classification problem of heart mortality. In Table 2, γ represents the number of instances that do not have feature κ , ℧− γ denotes the number of instances that do not contain feature κ , ρ represents the positive instances, and the number of positive instances can be represented from ℧− ρ . The main purpose of the χ 2 test is to measure the expected count, i.e., C, and the observed count, i.e., B, which are derived from each other. Assuming that α , β , τ , and υ represent the observed values and C α , C β , C τ , and C υ denote the expected values, then the predicted values based on the null hypothesis of independent events can be calculated as follows:
C α = ( α + β ) α + β
From Equation (1), C β , C τ , and C υ can be computed. For the general formulation of the χ 2 score, we have
χ 2 = 1 υ i = 1 n ( B i C i ) 2 B i
χ 2 = ( α C α ) 2 C α + ( β C β ) 2 C β + ( τ C τ ) 2 C τ + ( υ C υ ) 2 C υ
From solving the equations, we obtain a simple form of Equation (3)
χ 2 = ( α γ ρ ) 2 γ ρ ( ρ ) ( γ )
After feature ranking from Equation (4), the highly ranked (selected) features (or a subset of the features) are input into RF for classification. However, before the classification phase, it was found that the number of class instances in the dataset was highly imbalanced. To overcome the problem of bias in machine learning, we employed the synthetic minority oversampling technique (SMOTE). SMOTE achieves balanced classes in the data by enriching the training data with synthetic minority class samples, resulting in balanced classes and optimized training processes. It is important to note that SMOTE should be applied to the training data after data partitioning and not to the entire dataset before partitioning to avoid superficial performance caused by having copies of samples from the test dataset in the training dataset [25]. Unlike other oversampling methods, SMOTE works in the feature space rather than the data space [26] by synthesizing minority class samples by generating new samples along the line connecting any or all of the nearest neighbors of the k minority class. Using a holdout validation technique, we divided the dataset into two halves for training and testing to balance between classes. Seventy percent of the dataset was used for training, and thirty percent for ML model testing. After utilizing SMOTE, we only balanced the classes in the training data, which had 396 samples for each class and 198 samples total (positive and negative). In this study, we used the Python software package and the imbalance-learn package to implement the SMOTE technique [27].
After balancing the dataset, the RF model was used; here, the formulation of the RF model is reproduced as follows: RF is an ensemble model q(s, t) in which n is a uniformly distributed irregular vector. Each tree contributes to determining the most abundant class at input s. For an input sample of size P, where P represents an instance in the training set, p samples are taken from each instance. After this, F features are used to sample f features. This process is randomly repeated n times, resulting in n training sets, denoted as T 1 , T 2 , , T n . The decision tree D 1 , D 2 , , D n is generated from the corresponding training sets. Each tree in the forest, except for shear, is fully mature. Many decision trees have contributed to the development of the random forest classification algorithm. The number of decision trees, E, and the depth of each tree, D, are two important hyperparameters for classification [28]. These parameters determine the number of trees forming the forest and the maximum depth of each tree, respectively. For the objective of this study, we used a grid search algorithm to determine the values of E and D that maximize the efficiency of the RF model. In addition, a random forest model was created, and a new sample is included. In addition, the decision tree examines the new sample to determine its category. The final classification of a sample can be determined based on the votes cast by all decision trees within the forest. The trees that result from the formation of the random forest are called bootstrap trees. This is because they are created by resampling by reverting to the training data. Bootstrap is a simple and useful solution for model integration using the replacement method [29]. The training set is used to obtain a set number of samples for bootstrap sampling. The number of samples is returned to the training set after sampling. The extracted samples are assembled into a new batch of bootstrap samples. There is also the possibility that the sampled samples will be resampled after being returned to the training set. For this reason, it is best to test the samples that have already been taken. As an example, consider a random sample of d samples. Using 1 / d and ( 1 1 / d ) , we can calculate the probability that the sample will or will not be captured each time. If the random sample is run D times, then the probability of the selected sample is given as ( 1 1 / d ) D and D converges to and ( 1 1 / d ) D converges to 1 / e = 0.368 . There will be a mirror sample. In addition, the ( 1 / 3 ) instance will break into new samples. Out-of-bag instances are data that are missed during extraction. An out-of-bag instance is called an OOB error. This problem can be expressed mathematically as follows:
P = ı η
From Equation (5), ı denotes the error value for testing η , where η stands for the number of OOB instances and is acknowledged as a class of each data. From Equation (5), ı denotes the error value for testing η , where η stands for the number of OOB instances and is acknowledged as a class of each data.
The Gini index is used to build a decision tree, which is then used to determine the model’s impurity level of the model using the CART method. A lower Gini index value indicates fewer contaminants. The Gini index is lower when there are fewer impurities. For the classification problem, the probability of the Nth category is v n for N categories, and the mathematical formulation of the Gini index is as follows:
G i n i ( D ) = n = 1 n V n ( 1 V n ) = 1 n = 1 n V n 2
The Gini index is used for the feature selection in the decision tree, and the mathematical formula for this is given in Equation (7):
Δ G i n i ( F ) = G i n i ( D ) G i n i F ( D )
The highest Gini index value is selected for the split attribute and the node for the split condition. In the case of overfitting, the decision tree is mirrored. Pre- and post-pruning procedures can reduce the overfitting rate [30]. Pre-pruning can lead to the premature development of decision trees but post-pruning can produce greater results. In addition, the selection is made without pruning. We apply a subset of features selected from the χ 2 statistical model to the RF method for classification. The best RF hyperparameters for this subset of features are found using the grid search approach. Then, another group of features is input to the RF algorithm. The grid search algorithm is used to research the optimized values of the hyperparameters from RF. The best hyperparameters from RF, such as the number of edges (E) and the depth of the tree (D), are searched out. The χ 2 method is used for each subset of features created. Finally, the subset of features with the best predictive accuracy of cardiac mortality is selected and published.
3. Validation and Evaluation

The holdout validation approach is commonly used in the literature to investigate the effectiveness of ML-based diagnostic systems [31]. In a holdout validation approach, a dataset is split into two halves, with one half used for training and the other half used to test the proposed ML model. The dataset is split into 70% for training the ML model and 30% for testing [32,33]. Therefore, our experiments used the above data partitioning criteria for training and evaluating the developed χ 2 _RF model. After data partitioning, we establish evaluation measures to compare the performance of the proposed model with existing state-of-the-art ML cardiac mortality prediction models. The evaluation criteria for the χ 2 _RF model are accuracy, precision, recall, F1 score, Matthew’s correlation coefficient (MCC) [34], and the area under the curve (AUC) [35] using the ROC curve [36,37]. The evaluation metrics are mathematically presented as:
A c c u r a c y = T P + T N T P + T N + F P + F N
In this equation, TP stands for the number of true positives, F P stands for the number of false positives, T N stands for the number of true negatives, and F N stands for the number of false negatives.
P r e c i s i o n = T P T P + F P
R e c a l l = T P T P + F N
F 1 _ s c o r e = 2 T P 2 T P + F P + F N
M C C = T P × T N F P × F N ( T P + F P ) ( T P + F N ) ( T N + F P ) ( T N + F N )
The statistical analysis was performed for a binary classification problem [38,39]. In this context, the F1 score was used as a measure of F. The F-score ranges from 0 to 1, where 1 represents the best predictions and 0 represents the worst predictions. MCC allows us to determine whether a test is reliable or not. MCC can take values between +1 and −1, where +1 stands for the best and −1 for the worst prediction.

4. Experimental Results

To test the efficacy of the newly constructed model ( χ 2 _RF), three types of experiments were performed on the cardiac mortality dataset. In the first experiment, the grid search technique was used to construct and optimize standard models (ML) using all features of the dataset. The proposed ( χ 2 _RF) technique was developed in the second experiment. In contrast, additional state-of-the-art ML models were developed in the third experiment using the identical cardiac mortality dataset and the feature selection module χ 2 . All calculations were performed on an Intel (R) Core (TM) i5-8250U CPU running at 1.60 GHz on Windows 10, 64 bits. All tests were performed using the Python software program.

4.1. Experiment No. 1: Performance of ML Models Using All Features

In this work, we used different machine learning (ML) techniques in Python, such as NB, LR, DT, RF, KNN, and SVM, with different kernels (RBF, linear, polynomial, and sigmoid). The features of the dataset were used to test how well the created ML models performed. It is important to point out that the classes in the dataset are not the same. Therefore, we kept the dataset in its original form for this experiment. Table 3 shows the accuracy, sensitivity, specificity, and MCC for predicting death from heart disease based on the different ML models. Based on SVM with linear kernel, SVM with linear kernel achieved the best accuracy in predicting cardiac mortality of 90.74%.

4.2. Experiment No.2: Performance of Proposed Model χ 2 _RF on Balance Dataset

In this study, we validated the performance of the newly proposed method ( χ 2 _RF) using the χ 2 module to select the most appropriate features from the dataset. At the same time, the optimized RF was used for classification. The hyperparameters of the Rf model were optimized using a lattice research algorithm. From Table 4, it can be seen that the performance of the proposed model is measured using the criteria of selected features (SF), training accuracy (Acc_train), test accuracy (Acc_test), sensitivity, specificity, F1_score, and the Matthews correlation coefficient (MCC). From Table 4, it can be seen that the proposed model χ 2 _RF obtained the best test accuracy (Acc_test) of 94.59 % with a training accuracy (Acc_train) of 97.72%, a sensitivity of 98.00, a specificity of 80.77, an F1_score of 94.00%, and an MCC of 0.8413, with the optimal values of the hyperparameters of RF given as max_depth of a tree (D = 5) and n_estimators = 100. Comparison of Table 3 with Table 4 shows that the proposed model χ 2 _ RF improves the performance of the conventional model RF by 4%, where the conventional model RF uses all features of the dataset. In contrast, the proposed model χ 2 _ RF uses only 10 features, reducing the time complexity of the proposed method.
In addition, we used the receiver operating characteristic (ROC) [40] to extensively test the efficacy of the newly proposed method ( χ 2 _RF). The conventional RF uses all dataset features, and the proposed ones ( χ 2 _RF) were tested based on ROC. It is worth noting that the key parameter of the ROC graph is the area under the curve (AUC), and the graph with a larger area under the curve is considered more efficient. From Figure 3a, it can be seen that the proposed method ( χ 2 _RF) has a larger AUC than the conventional method RF, which is shown in Figure 3b. The proposed method achieves an AUC of 94.00% compared to an AUC of 90% for conventional RF.
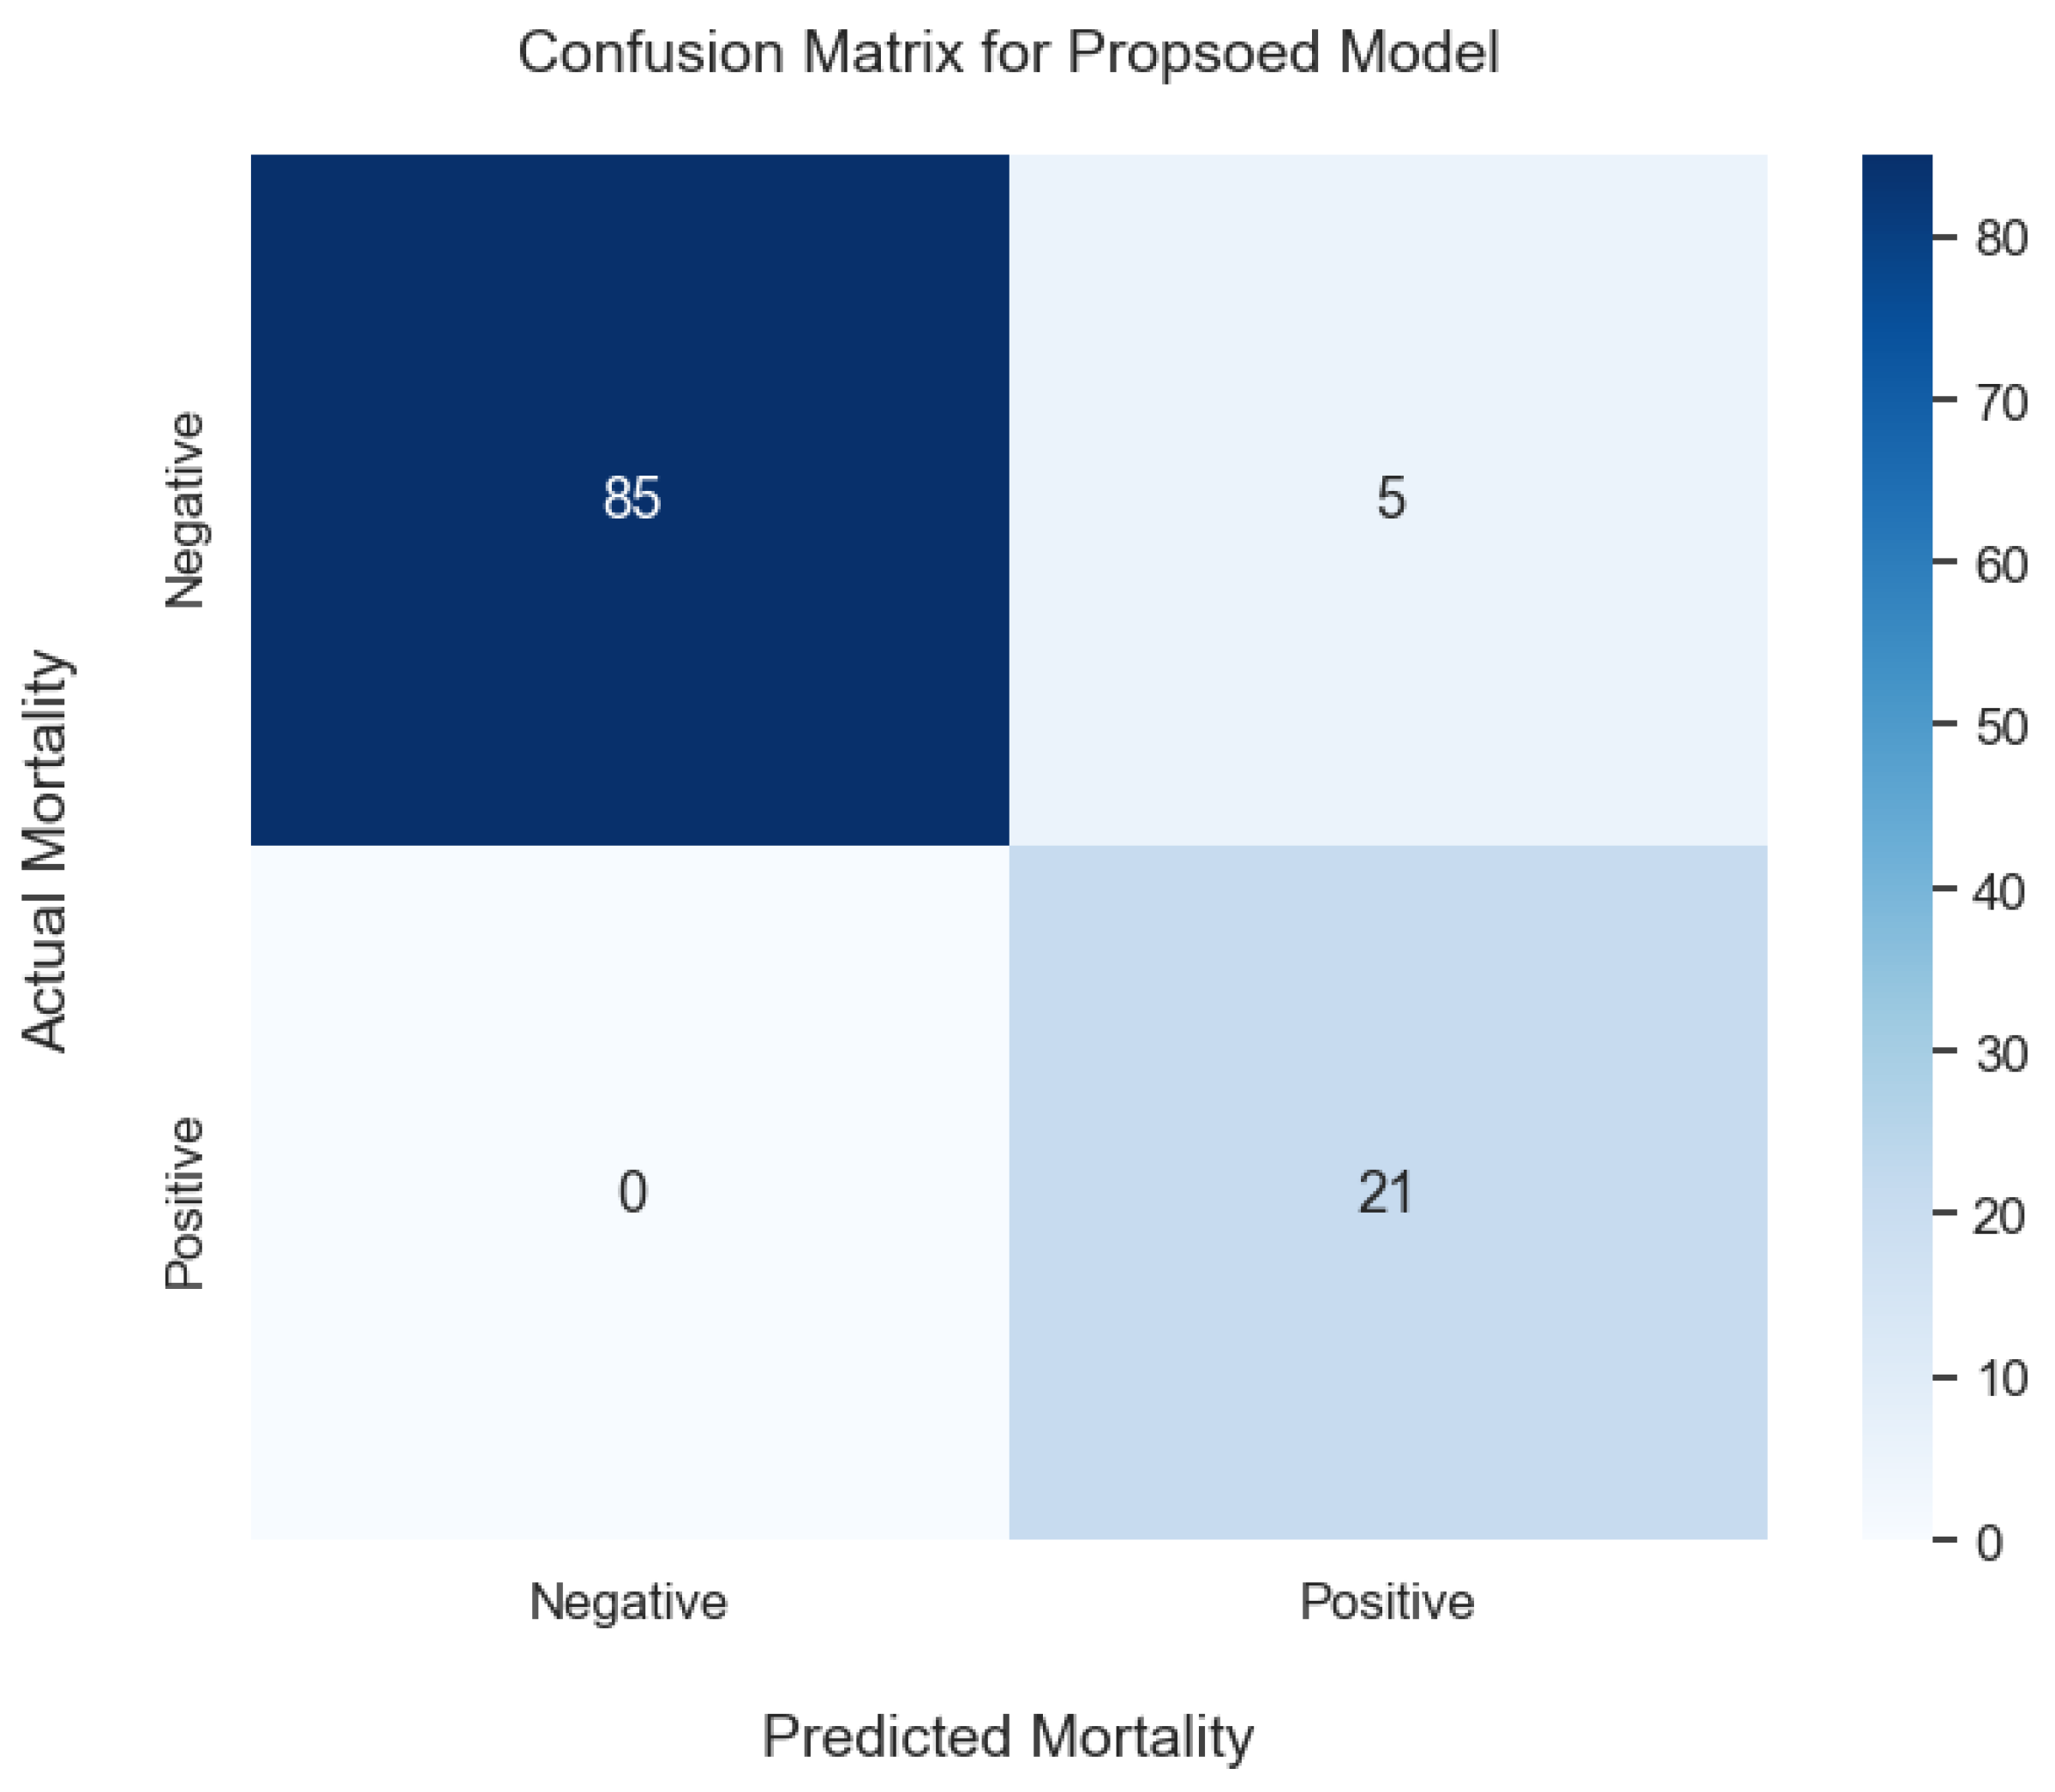
Furthermore, the performance of the proposed model was evaluated based on the confusion matrix. Figure 4 provides an overview of the confusion matrix of the proposed model ( χ 2 _RF).
In addition, we evaluated the performance of the proposed model in unbalanced data to validate its efficiency in balanced data, as indicated in Table 4. The performances of the proposed model ( χ 2 _RF) on unbalanced data were evaluated using various evaluation metrics, such as accuracy, sensitivity, specificity, F1 score, and MCC. Table 5 shows the performance of the proposed model on unbalanced data, where the highest accuracy of 86.15% was achieved by using only 10 selected features, compared with balanced data, where the proposed model achieved the highest accuracy of 94.59% by using the same number of selected features (10).

4.3. Experiment No. 3: Performances of ML Models Using the χ 2 Feature Selection Module

In this study, we evaluated the performances of the state-of-the-art models of ML, i.e., NB, KNN, RF, DT, LR, and SVM with different kernels using the χ 2 feature selection module along with the newly proposed model ( χ 2 _RF). A grid search strategy was used to optimize the hyperparameters of the specified ML models. For a fair comparison, we selected balanced classes in the dataset generated by the SMOTE approach. Table 6 shows the results of each ML model along with the newly proposed model ( χ 2 _RF) with selected features (SF) from the dataset and performance evaluation metrics, such as accuracy on training data (ACC._train), accuracy on test data (ACC._test), sensitivity, specificity, and the Matthews correlation coefficient (MCC).
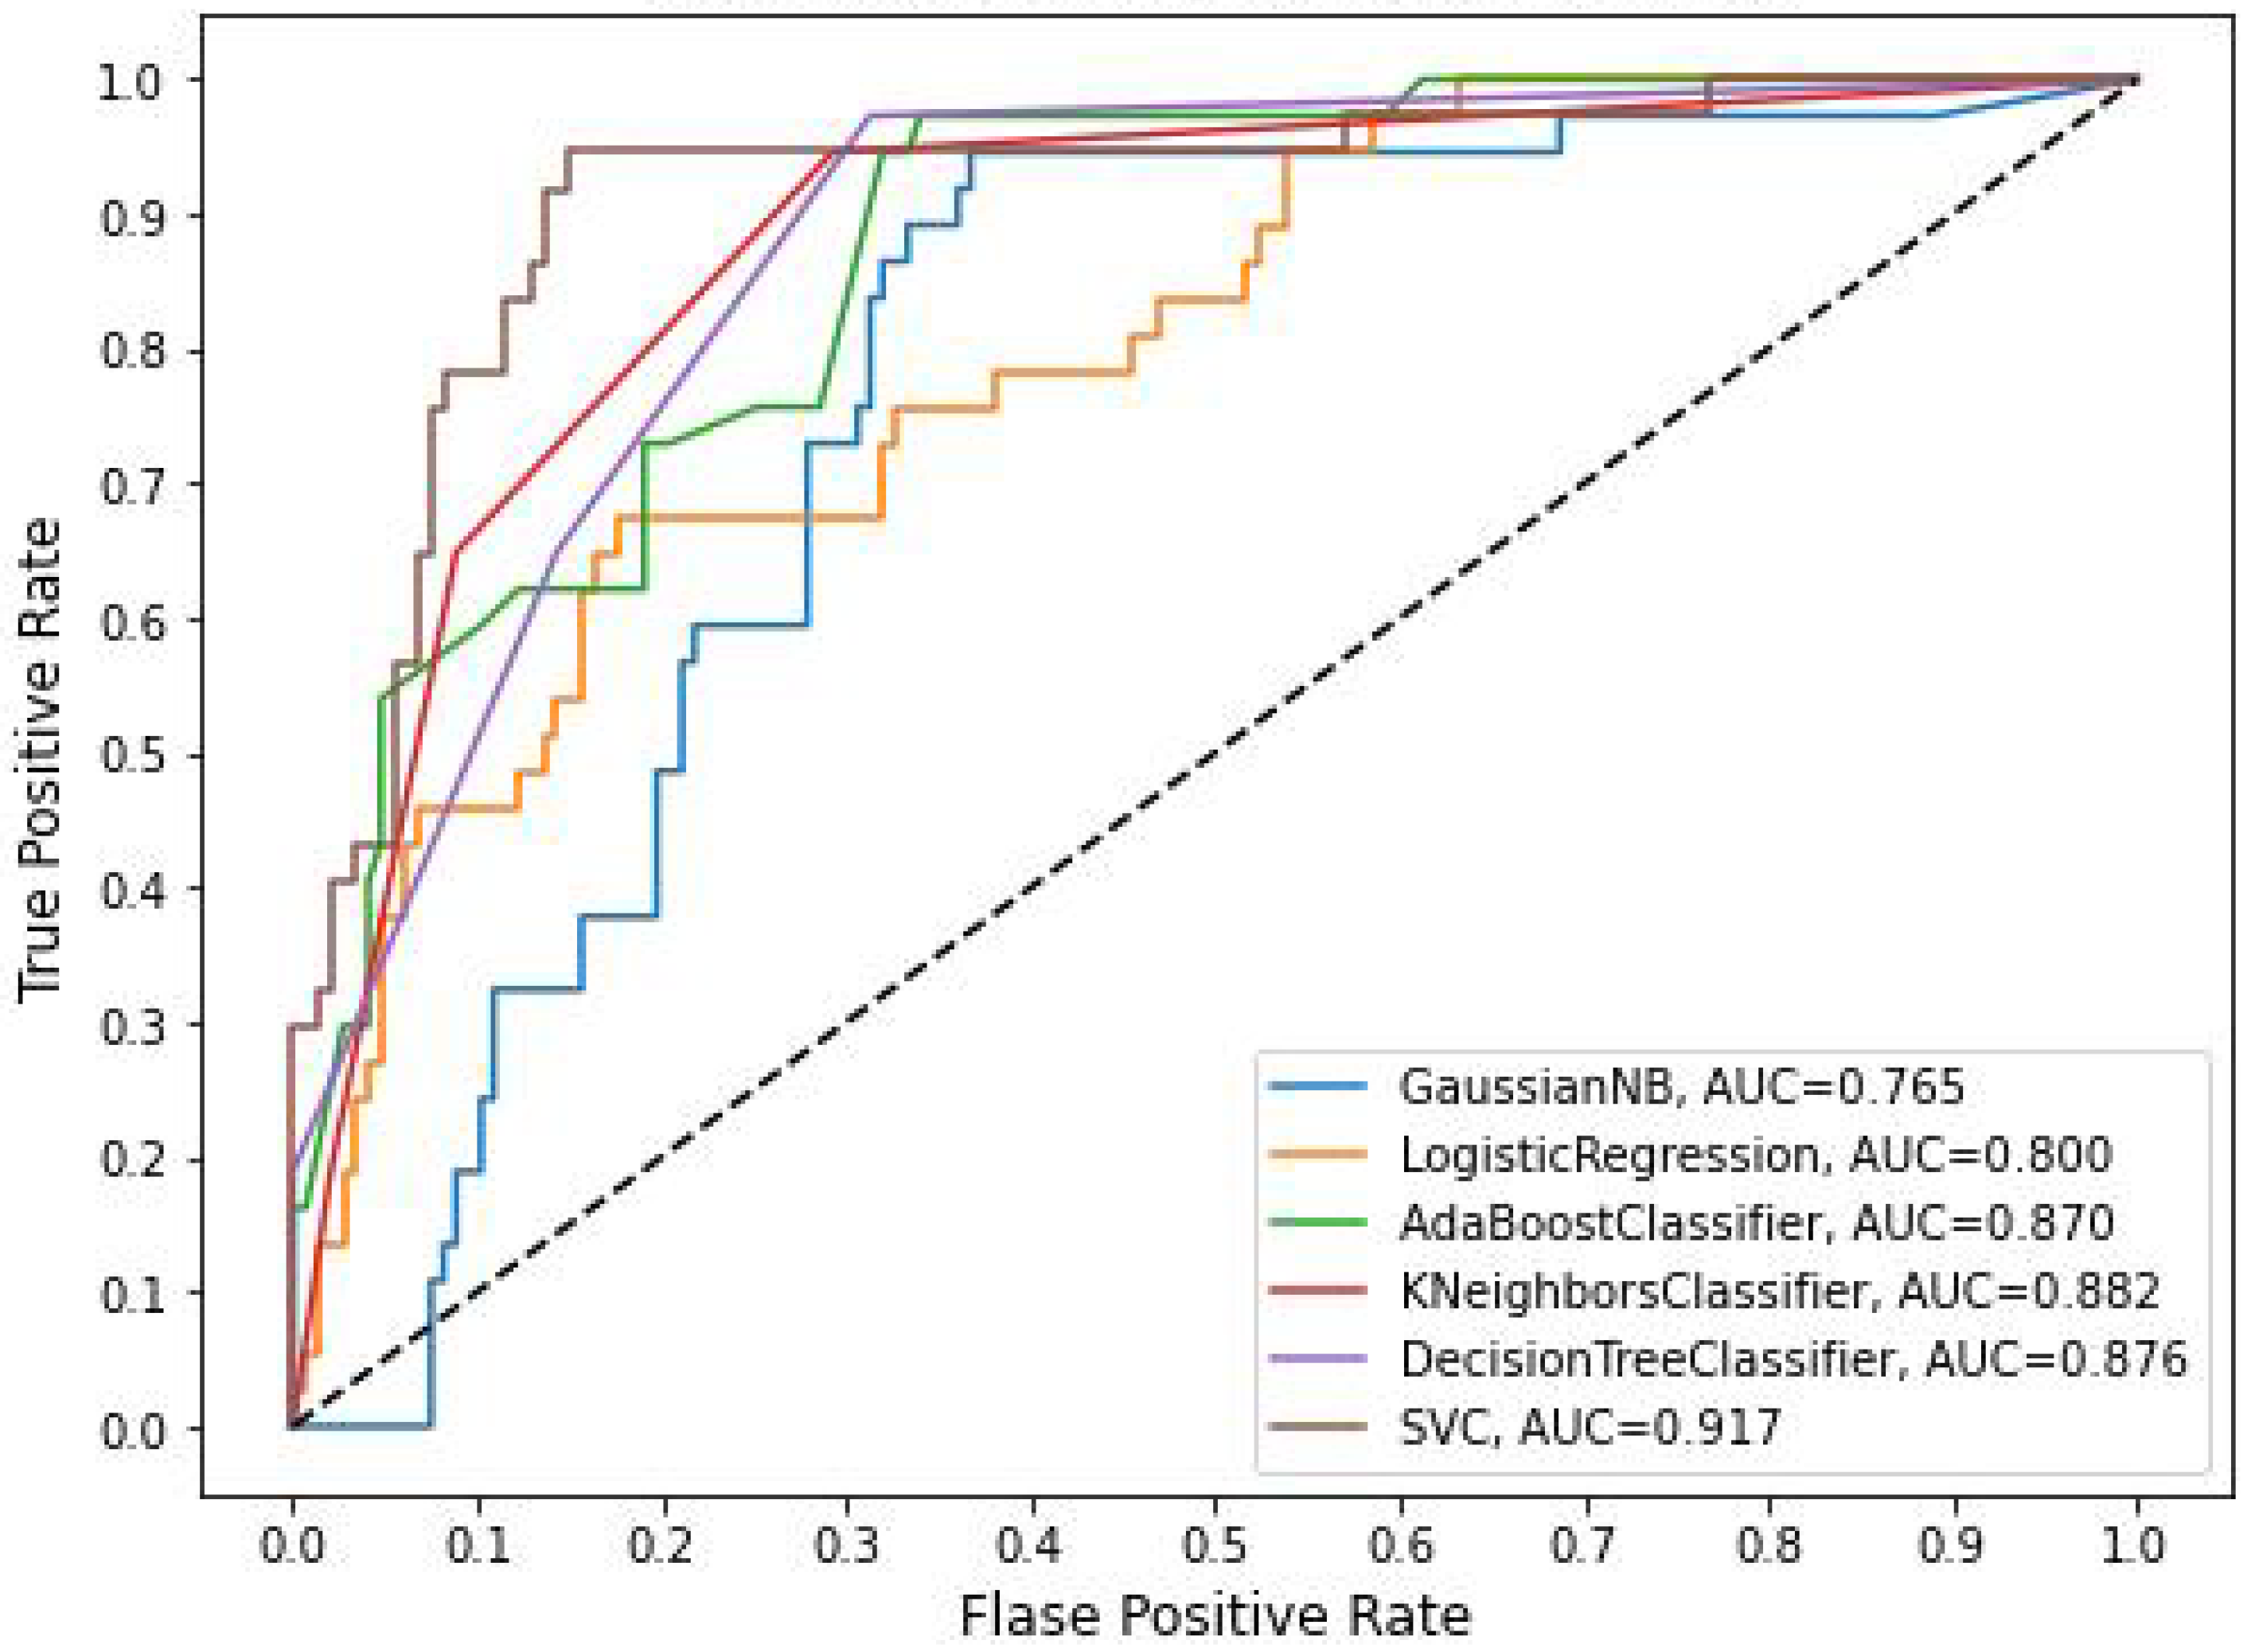
The proposed model ( χ 2 _RF) achieved the highest test accuracy of 94.59% compared to the other ML models using the same feature selection module ( χ 2 ). In addition, we validated the performances of the ML models using the ROC curve. Figure 5 shows the performances of the ML models based on the AUC criterion using the balanced dataset and the χ 2 feature selection module. From Figure 5, it can be seen that SVM achieves the highest AUC of 91.70% compared to the other ML models.

5. Discussion

In this work, we presented a decision support system for predicting cardiac patient mortality with machine learning using electronic health records (EHR). The developed model consists of two hybridized modules combined into a single unit. The first module is based on a statistical model ( χ 2 ) that helps to select the most important features from the feature space, while an RF model was used to classify mortality. The hyperparameters of the RF model were optimized using a grid search algorithm. To evaluate the efficiency of the newly developed system, a public dataset from [22] was collected. It was found that the classes in the collected dataset were highly imbalanced. ML models tend to favor the majority class when trained on an imbalanced dataset. To avoid this problem, we used SMOTE to balance the classes in the training process of the proposed model.
To validate the efficacy of the proposed model ( χ 2 _RF), we used various evaluation metrics, such as accuracy, sensitivity, specificity, F1 score, MCC, and AUC by using ROC. Table 4 shows that the newly constructed model achieved the highest test accuracy of 94.57% by using only 10 selected features from the first module of the proposed method. In addition, we tested the performance of the proposed model ( χ 2 _RF) by using ROC curves. The performance of the conventional model RF is compared with the proposed model ( χ 2 _RF) based on the curve ROC. A machine model with a larger area under the curve (AUC) is more efficient and accurate. From Figure 3, it can be seen that the proposed model ( χ 2 _RF) has a greater AUC of 94.00% compared to the conventional RF model of 90.00%. Moreover, the performance of the proposed model is also compared with other state-of-the-art ML models using the same feature selection module ( χ 2 ) based on the above evaluation metrics. The performance of the proposed model compared to other state-of-the-art ML models is shown in Table 6, where SVM with an RBF kernel achieves the second highest accuracy of 89.21% while using 11 selected features from the dataset.

6. Conclusions

In this study, we presented an automated decision support system for predicting mortality in cardiac patients. The proposed decision support system combines two modules into a single black box. The first module of the proposed χ 2 _RF model uses a χ 2 statistical model to evaluate the appropriate features in the dataset. The selected features are input into an optimized random forest model for the classification task. The hyperparameters of the random forest model are fine-tuned using a grid search algorithm. To validate the performance of the newly proposed system χ 2 _RF, we use various evaluation metrics, including accuracy, sensitivity, specificity, F1 score, and ROC. The proposed model χ 2 _RF achieved the highest accuracy of 94.59% using only 10 features from the dataset, and the newly proposed decision system outperformed the other machine learning systems for predicting mortality in cardiac patients. In addition, more effective referral of cardiac patients will be possible through a newly developed ( χ 2 _RF) clinical decision support system. In addition to clinical indicators of disease severity, the system will enable rapid prognosis, hospitalization of high-risk patients, and thorough monitoring of these patients in the event of outpatient therapy. However, in this study, a supervised machine learning model and a statistical model were used to identify the main features of the dataset. These techniques cannot handle large amounts of data because machine learning requires a lot of time to learn from the training data itself, which also increases the computational complexity of the model. Therefore, multi-modal datasets will be used in the future to investigate the effectiveness of unsupervised machine learning for predicting mortality in cardiac patients.

Author Contributions

Conceptualization and methodology, A.J.; software and validation, L.A., and J.S.B.; formal analysis, A.L.D.; data curation and writing—original draft preparation, A.J.; writing—review and editing, M.A.S.; visualization and supervision, P.A. All authors have read and agreed to the published version of the manuscript.

Funding

This research received no external funding.

Institutional Review Board Statement

This study was carried out in accordance with the Declaration of Helsinki and was approved by the Research Ethics Committee at the Blekinge Institute of Technology (BTH).

Informed Consent Statement

Not applicable.

Data Availability Statement

Data are available at https://github.com/khattakkrk/datascience.html (accessed on 10 January 2023.)

Acknowledgments

The first author’s learning process was supported by the National E-Infrastructure for Aging Research (NEAR), Sweden. NEAR is working on improving the health conditions of older adults.

Conflicts of Interest

The authors declare no conflict of interest.

Abbreviations

The following abbreviations are used in this manuscript:
RSArandom search algorithm
SMOTEsynthetic minority oversampling technique
iRSFimproved random survival forest
ANNartificial neural network
DNNDEEP neural network

References

  1. Heart Disease Facts. Available online: https://www.cdc.gov/heartdisease/facts.html (accessed on 27 February 2023).
  2. Cardiovascular Diseases. Available online: https://www.who.int/health-topics/cardiovascular-diseases.html (accessed on 27 February 2023).
  3. Lipworth, W. Real-world data to generate evidence about healthcare interventions. Asian Bioeth. Rev. 2019, 11, 289–298. [Google Scholar] [CrossRef] [PubMed]
  4. Wu, W.T.; Li, Y.J.; Feng, A.Z.; Li, L.; Huang, T.; Xu, A.D.; Lyu, J. Data mining in clinical big data: The frequently used databases, steps, and methodological models. Mil. Med. Res. 2021, 8, 44. [Google Scholar] [CrossRef] [PubMed]
  5. Ali, L.; Niamat, A.; Khan, J.A.; Golilarz, N.A.; Xingzhong, X.; Noor, A.; Nour, R.; Bukhari, S.A.C. An optimized stacked support vector machines based expert system for the effective prediction of heart failure. IEEE Access 2019, 7, 54007–54014. [Google Scholar] [CrossRef]
  6. Javeed, A.; Khan, S.U.; Ali, L.; Ali, S.; Imrana, Y.; Rahman, A. Machine learning-based automated diagnostic systems developed for heart failure prediction using different types of data modalities: A systematic review and future directions. Comput. Math. Methods Med. 2022, 2022, 9288452. [Google Scholar] [CrossRef]
  7. Lakshmanarao, A.; Swathi, Y.; Sundareswar, P.S.S. Machine learning techniques for heart disease prediction. Forest 2019, 95, 97. [Google Scholar]
  8. Halatchev, I.G.; McDonald, J.R.; Wu, W.C. A patient-centred, comprehensive model for the care for heart failure: The 360 heart failure centre. Open Heart 2020, 7, e001221. [Google Scholar] [CrossRef]
  9. Javeed, A.; Ali, L.; Mohammed Seid, A.; Ali, A.; Khan, D.; Imrana, Y. A Clinical Decision Support System (CDSS) for Unbiased Prediction of Caesarean Section Based on Features Extraction and Optimized Classification. Comput. Intell. Neurosci. 2022, 2022, 1901735. [Google Scholar] [CrossRef]
  10. Akbar, W.; Wu, W.P.; Saleem, S.; Farhan, M.; Saleem, M.A.; Javeed, A.; Ali, L. Development of hepatitis disease detection system by exploiting sparsity in linear support vector machine to improve strength of AdaBoost ensemble model. Mob. Inf. Syst. 2020, 2020, 8870240. [Google Scholar] [CrossRef]
  11. Javeed, A.; Dallora, A.L.; Berglund, J.S.; Anderberg, P. An Intelligent Learning System for Unbiased Prediction of Dementia Based on Autoencoder and AdaBoost Ensemble Learning. Life 2022, 12, 1097. [Google Scholar] [CrossRef]
  12. Javeed, A.; Dallora, A.L.; Berglund, J.S.; Idrisoglu, A.; Ali, L.; Rauf, H.T.; Anderberg, P. Early Prediction of Dementia Using Feature Extraction Battery (FEB) and Optimized Support Vector Machine (SVM) for Classification. Biomedicines 2023, 11, 439. [Google Scholar] [CrossRef]
  13. Javeed, A.; Rizvi, S.S.; Zhou, S.; Riaz, R.; Khan, S.U.; Kwon, S.J. Heart risk failure prediction using a novel feature selection method for feature refinement and neural network for classification. Mob. Inf. Syst. 2020, 2020, 8843115. [Google Scholar] [CrossRef]
  14. Ali, L.; Rahman, A.; Khan, A.; Zhou, M.; Javeed, A.; Khan, J.A. An automated diagnostic system for heart disease prediction based on χ2 statistical model and optimally configured deep neural network. IEEE Access 2019, 7, 34938–34945. [Google Scholar] [CrossRef]
  15. Javeed, A.; Zhou, S.; Yongjian, L.; Qasim, I.; Noor, A.; Nour, R. An intelligent learning system based on random search algorithm and optimized random forest model for improved heart disease detection. IEEE Access 2019, 7, 180235–180243. [Google Scholar] [CrossRef]
  16. Chen, J.; Valehi, A.; Razi, A. Smart heart monitoring: Early prediction of heart problems through predictive analysis of ECG signals. IEEE Access 2019, 7, 120831–120839. [Google Scholar] [CrossRef]
  17. Pecchia, L.; Melillo, P.; Bracale, M. Remote health monitoring of heart failure with data mining via CART method on HRV features. IEEE Trans. Biomed. Eng. 2010, 58, 800–804. [Google Scholar] [CrossRef]
  18. Kumar, A.S. Diagnosis of heart disease using fuzzy resolution mechanism. J. Artif. Intell. 2012, 5, 47–55. [Google Scholar] [CrossRef]
  19. Miao, F.; Cai, Y.P.; Zhang, Y.X.; Fan, X.M.; Li, Y. Predictive modeling of hospital mortality for patients with heart failure by using an improved random survival forest. IEEE Access 2018, 6, 7244–7253. [Google Scholar] [CrossRef]
  20. Almazroi, A.A. Survival prediction among heart patients using machine learning techniques. Math. Biosci. Eng. 2022, 19, 134–145. [Google Scholar] [CrossRef]
  21. Aggrawal, R.; Pal, S. Multi-Machine Learning Binary Classification, Feature Selection and Comparison Technique for Predicting Death Events Related to Heart Disease. Int. J. Pharm. Res. 2021, 13, 428–439. [Google Scholar]
  22. Mortality-Heart Dataset. Available online: https://github.com/khattakkrk/datascience (accessed on 27 February 2023).
  23. Belete, D.M.; Huchaiah, M.D. Grid search in hyperparameter optimization of machine learning models for prediction of HIV/AIDS test results. Int. J. Comput. Appl. 2021, 44, 875–886. [Google Scholar] [CrossRef]
  24. Liu, H.; Setiono, R. Chi2: Feature selection and discretization of numeric attributes. In Proceedings of the 7th IEEE International Conference on Tools with Artificial Intelligence, Herndon, VA, USA, 5–8 November 1995; IEEE: Piscataway, NJ, USA, 1995; pp. 388–391. [Google Scholar]
  25. Luengo, J.; Fernández, A.; García, S.; Herrera, F. Addressing data complexity for imbalanced datasets: Analysis of SMOTE-based oversampling and evolutionary undersampling. Soft Comput. 2011, 15, 1909–1936. [Google Scholar] [CrossRef]
  26. Chawla, N.V.; Bowyer, K.W.; Hall, L.O.; Kegelmeyer, W.P. SMOTE: Synthetic minority over-sampling technique. J. Artif. Intell. Res. 2002, 16, 321–357. [Google Scholar] [CrossRef]
  27. Lemaître, G.; Nogueira, F.; Aridas, C.K. Imbalanced-learn: A python toolbox to tackle the curse of imbalanced datasets in machine learning. J. Mach. Learn. Res. 2017, 18, 559–563. [Google Scholar]
  28. Liu, M.; Lang, R.; Cao, Y. Number of trees in random forest. Comput. Eng. Appl. 2015, 51, 126–131. [Google Scholar]
  29. Aprilliani, U.; Rustam, Z. Osteoarthritis disease prediction based on random forest. In Proceedings of the 2018 International Conference on Advanced Computer Science and Information Systems (ICACSIS), Yogyakarta, Indonesia, 27–28 October 2018; IEEE: Piscataway, NJ, USA, 2018; pp. 237–240. [Google Scholar]
  30. Al-Akhras, M.; El Hindi, K.; Habib, M.; Shawar, B.A. Instance reduction for avoiding overfitting in decision trees. J. Intell. Syst. 2021, 30, 438–459. [Google Scholar]
  31. Saleem, M.A.; Thien Le, N.; Asdornwised, W.; Chaitusaney, S.; Javeed, A.; Benjapolakul, W. Sooty Tern Optimization Algorithm-Based Deep Learning Model for Diagnosing NSCLC Tumours. Sensors 2023, 23, 2147. [Google Scholar] [CrossRef]
  32. Das, R.; Turkoglu, I.; Sengur, A. Effective diagnosis of heart disease through neural networks ensembles. Expert Syst. Appl. 2009, 36, 7675–7680. [Google Scholar] [CrossRef]
  33. Paul, A.K.; Shill, P.C.; Rabin, M.; Islam, R.; Murase, K. Adaptive weighted fuzzy rule-based system for the risk level assessment of heart disease. Appl. Intell. 2018, 48, 1739–1756. [Google Scholar] [CrossRef]
  34. Chicco, D.; Tötsch, N.; Jurman, G. The Matthews correlation coefficient (MCC) is more reliable than balanced accuracy, bookmaker informedness, and markedness in two-class confusion matrix evaluation. BioData Min. 2021, 14, 13. [Google Scholar] [CrossRef]
  35. Marzban, C. The ROC curve and the area under it as performance measures. Weather. Forecast. 2004, 19, 1106–1114. [Google Scholar] [CrossRef]
  36. Hajian-Tilaki, K. Receiver operating characteristic (ROC) curve analysis for medical diagnostic test evaluation. Casp. J. Intern. Med. 2013, 4, 627. [Google Scholar]
  37. Ali, L.; Zhu, C.; Golilarz, N.A.; Javeed, A.; Zhou, M.; Liu, Y. Reliable Parkinson’s disease detection by analyzing handwritten drawings: Construction of an unbiased cascaded learning system based on feature selection and adaptive boosting model. IEEE Access 2019, 7, 116480–116489. [Google Scholar] [CrossRef]
  38. Ding, Y.; Simonoff, J.S. An investigation of missing data methods for classification trees applied to binary response data. J. Mach. Learn. Res. 2010, 11, 131–170. [Google Scholar]
  39. Javeed, A.; Dallora Moraes, A.L.; Berglund, J.; Ali, A. Predicting Dementia Risk Factors Based on Feature Selection and Neural Networks. Comput. Mater. Contin. 2023, 75, 2491–2508. [Google Scholar] [CrossRef]
  40. Javeed, A.; Dallora, A.L.; Berglund, J.S.; Ali, A.; Ali, L.; Anderberg, P. Machine Learning for Dementia Prediction: A Systematic Review and Future Research Directions. J. Med. Syst. 2023, 47, 17. [Google Scholar] [CrossRef]
Figure 1. Distribution of samples in the dataset.
Applsci 13 05188 g001
Figure 2. Flowchart of the proposed model χ 2 _RF.
Applsci 13 05188 g002
Figure 3. Performance comparison based on AUC.
Applsci 13 05188 g003
Figure 4. Confusion matrix of the proposed model χ 2 _RF.
Applsci 13 05188 g004
Figure 5. ROC curve of ML models based on the χ 2 feature selection model.
Applsci 13 05188 g005
Table 1. Summary of previously proposed work.
ProposedYearFPM *ModelAccuracyBalance Data
[18]2012Fuzzy logicANN91.83No
[14]2019 χ 2 DNN93.00No
[15]2019RSARF93.33No
[19]2018RSAiRSF82.01No
[21]2021StackLDA83.12No
[20]2022-DT85.00No
* Feature processing method.
Table 2. Table for computing the χ 2 test score.
Positive ClassNegative ClassSum
Features κ happens α β α + β = γ
Features κ does not happens τ υ τ + υ = ℧ − γ
Sum α + τ = ρ β + υ = ℧ − ρ
Table 3. Performances of ML models on balance data using all features.
ModelAcc._TrainAcc._TestSensitivitySpecificityF1 ScoreMCC
NB65.3671.1710041.8271.000.5158
LR87.1582.8590.0056.6782.000.5475
DT83.6584.0083.010084.000.4282
RF91.0089.0775.8831.0089.000.4586
KNN80.1584.6883.8110085.000.4675
AdaBoost78.5980.1880.0010080.000.5756
SVM_RBF10079.0079.2846.0079.000.3856
SVM_sigmoid63.8164.8677.5353.6465.000.3251
SVM_linear89.4290.7478.0022.5091.000.4128
SVM_poly77.8279.2879.0035.2179.000.3467
Table 4. Performance of the RF model along with χ 2 feature selection method.
SFHyper.Acc._TrainAcc._TestSensitivitySpecificityF1_ScoreMCC
08E:10, D:1091.9188.2892.3170.0088.000.6114
09E:100, D:590.6583.7854.8495.0084.000.5709
10E:100, D:594.9688.2863.3397.5388.000.6901
11E:10, D:594.1990.9967.7410091.000.7759
11E:200, D:596.2191.8970.0010092.000.7937
12E:200, D:295.7089.1863.6410089.000.7426
13E:100, D:595.7792.7910072.4193.000.8122
14E:200, D:597.2291.8997.6573.0892.000.7647
10E:100, D:1097.7294.5998.0080.7794.000.8413
12E:10, D:293.5690.8995.2686.0091.000.8098
13E:100, D:1094.5692.9996.1577.3193.000.8130
14E:200, D:296.7192.8296.5271.0093.000.8231
14E:100, D:597.2293.6910075.0094.000.8316
Table 5. Performance of the proposed model ( χ 2 _RF) on imbalanced data.
SFAcc._TrainAcc._TestSensitivitySpecificityF1_ScoreMCC
0277.0481.1081.0875.2581.000.2355
0479.9881.9883.6557.1482.000.2531
0678.9882.1083.2060.0082.000.2495
0884.2483.7890.9156.5282.000.4908
1088.3286.1591.1161.9086.000.5301
1388.0084.8490.1160.0085.000.4917
Table 6. Performances of ML models on balanced data using the χ 2 feature selection.
ModelSFAcc._TrainAcc._TestSensitivitySpecificityMCC
NB0364.6572.0787.3434.370.2512
LR1383.8478.3797.1446.340.5358
DT1494.1988.2894.5266.660.6403
KNN0984.0987.3890.4270.580.5610
AdaBoost1491.1486.4895.1860.710.6198
SVM_linear1483.3872.0795.3839.130.4341
SVM_sigmoid1380.5567.5696.5535.840.4132
SVM_poly1192.6786.4897.4659.370.6574
SVM_RBF1192.1789.2110058.330.6972
Proposed Model1097.7294.5998.0080.770.8413
Disclaimer/Publisher’s Note: The statements, opinions and data contained in all publications are solely those of the individual author(s) and contributor(s) and not of MDPI and/or the editor(s). MDPI and/or the editor(s) disclaim responsibility for any injury to people or property resulting from any ideas, methods, instructions or products referred to in the content.