
In Vitro Analysis of Hemodynamics in the Ascending Thoracic Aorta: Sensitivity to the Experimental Setup

 ,
,  , , , , and
Abstract
1. Introduction
2. Clinical Dataset, Experimental Setup, and Stochastic Sensitivity Analysis Procedure
2.1. Clinical Dataset
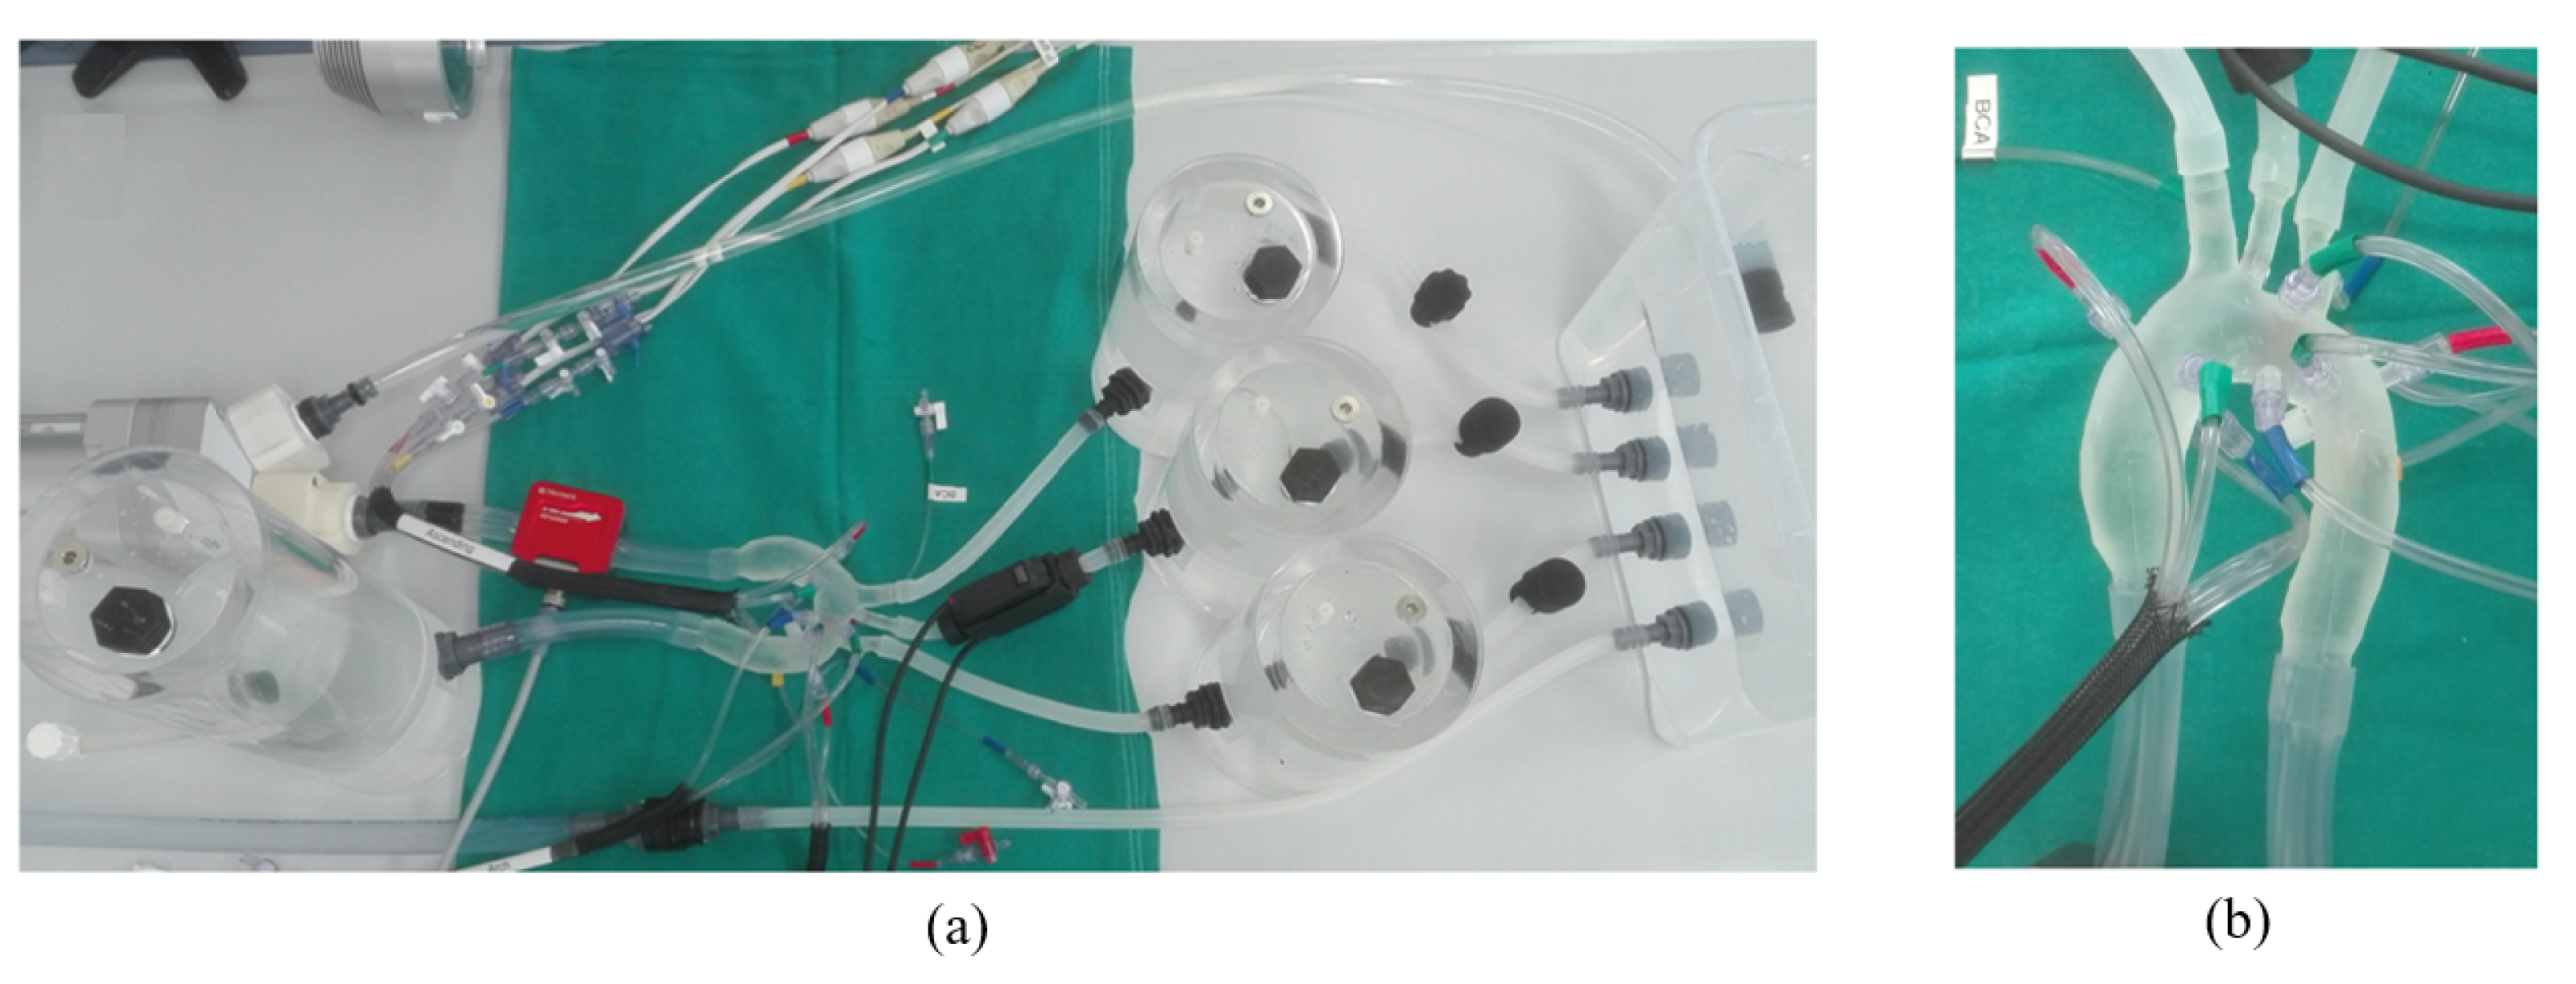
2.2. Experimental Setup
2.3. Stochastic Sensitivity Analysis Procedure
3. Main Flow Features
4. Results of the Sensitivity Analysis to Setup Parameters
4.1. Deterministic Results
4.2. Stochastic Results
5. Conclusions
Author Contributions
Funding
Institutional Review Board Statement
Informed Consent Statement
Data Availability Statement
Conflicts of Interest
References
- Johnston, K.W.; Rutherford, R.B.; Tilson, M.D.; Shah, D.M.; Hollier, L.; Stanley, J.C. Suggested standards for reporting on arterial aneurysms. J. Vasc. Surg. 1991, 13, 452–458. [Google Scholar] [CrossRef] [PubMed]
- Trimarchi, S.; Nienaber, C.A.; Rampoldi, V.; Myrmel, T.; Suzuki, T.; Mehta, R.H.; Bossone, E.; Cooper, J.V.; Smith, D.E.; Menicanti, L.; et al. Contemporary results of surgery in acute type A aortic dissection: The international registry of acute aortic dissection experience. J. Thorac. Cardiovasc. Surg. 2005, 129, 112–122. [Google Scholar] [CrossRef] [PubMed]
- Martufi, G.; Gasser, T.C.; Appoo, J.J.; Di Martino, E.S. Mechano-biology in the thoracic aortic aneurysm: A review and case study. Biomech. Model. Mechanobiol. 2014, 13, 917–928. [Google Scholar] [CrossRef] [PubMed]
- Coady, M.A.; Rizzo, J.A.; Hammond, G.L.; Mandapati, D.; Darr, U.; Kopf, G.S.; Elefteriades, J.A. What is the appropriate size criterion for resection of thoracic aortic aneurysms? J. Thoracic. Cardiovasc. Surg. 1997, 113, 476–491. [Google Scholar] [CrossRef]
- Doshi, A.R.; Chikkabyrappa, S. Coarctation of aorta in children. Cureus 2018, 10, e3690. [Google Scholar] [CrossRef] [PubMed]
- Jager, M.D.; Aldag, J.C.; Deshpande, G.G. A presedation fluid bolus does not decrease the incidence of propofol-induced hypotension in pediatric patients. Hosp. Pediatr. 2015, 5, 85–91. [Google Scholar] [CrossRef] [PubMed]
- Morris, P.D.; Narracott, A.; von Tengg-Kobligk, H.; Soto, D.A.S.; Hsiao, S.; Lungu, A.; Evans, P.; Bressloff, N.W.; Lawford, P.V.; Hose, D.R.; et al. Computational fluid dynamics modelling in cardiovascular medicine. Heart 2016, 102, 18–28. [Google Scholar] [CrossRef]
- Khudzari, A.Z.M.; Kadir, M.R.A.; Osman, K.; Hudzari, A.H.M. Mock circulatory loop for cardiovascular assist device testing. In Cardiovascular Engineering Technological Advancements, Reviews, and Applications; Springer: Berlin/Heidelberg, Germany, 2020; pp. 177–200. [Google Scholar]
- Hewlin, R.L., Jr.; Tindall, J.M. Computational Assessment of Magnetic Nanoparticle Targeting Efficiency in a Simplified Circle of Willis Arterial Model. Int. J. Mol. Sci. 2023, 24, 2545. [Google Scholar] [CrossRef]
- Shi, Y.; Peng, C.; Liu, J.; Lan, H.; Li, C.; Qin, W.; Yuana, T.; Kan, Y.; Wang, S.; Fu, W. A modified method of computed fluid dynamics simulation in abdominal aorta and visceral arteries. Comput. Methods Biomech. Biomed. Eng. 2021, 24, 1718–1729. [Google Scholar] [CrossRef]
- Sun, Z.; Xu, L. Computational fluid dynamics in coronary artery disease. Comput. Med. Imaging Graph. 2014, 38, 651–663. [Google Scholar] [CrossRef]
- Kambayashi, Y.; Takao, H.; Shinohara, K.; Suzuki, T.; Takayama, S.; Fujimura, S.; Masuda, S.; Watanabe, M.; Suzuki, T.; Dahmani, C.; et al. Computational fluid dynamics analysis of tandem carotid artery stenoses: Investigation of neurological complications after carotid artery stenting. Technol. Health Care 2016, 24, 673–679. [Google Scholar] [CrossRef] [PubMed]
- Jhunjhunwala, P.; Padole, P.; Thombre, S. CFD analysis of pulsatile flow and non-Newtonian behavior of blood in arteries. MCB Mol. Cell. Biomech. 2015, 12, 37–47. [Google Scholar]
- Fanni, B.M.; Capellini, K.; Di Leonardo, M.; Clemente, A.; Cerone, E.; Berti, S.; Celi, S. Correlation between LAA morphological features and computational fluid dynamics analysis for non-valvular atrial fibrillation patients. Appl. Sci. 2020, 10, 1448. [Google Scholar] [CrossRef]
- Capellini, K.; Vignali, E.; Costa, E.; Gasparotti, E.; Biancolini, M.E.; Landini, L.; Positano, V.; Celi, S. Computational fluid dynamic study for aTAA hemodynamics: An integrated image-based and radial basis functions mesh morphing approach. J. Biomech. Eng. 2018, 140, 111007. [Google Scholar] [CrossRef]
- Morbiducci, U.; Gallo, D.; Cristofanelli, S.; Ponzini, R.; Deriu, M.A.; Rizzo, G.; Steinman, D.A. A rational approach to defining principal axes of multidirectional wall shear stress in realistic vascular geometries, with application to the study of the influence of helical flow on wall shear stress directionality in aorta. J. Biomech. 2015, 48, 899–906. [Google Scholar] [CrossRef]
- Boccadifuoco, A.; Mariotti, A.; Capellini, K.; Celi, S.; Salvetti, M.V. Validation of numerical simulations of thoracic aorta hemodynamics: Comparison with in vivo measurements and stochastic sensitivity analysis. Cardiovasc. Eng. Technol. 2018, 9, 688–706. [Google Scholar] [CrossRef]
- Capellini, K.; Gasparotti, E.; Cella, U.; Costa, E.; Fanni, B.M.; Groth, C.; Porziani, S.; Biancolini, M.E.; Celi, S. A novel formulation for the study of the ascending aortic fluid dynamics with in vivo data. Med. Eng. Phys. 2021, 91, 68–78. [Google Scholar] [CrossRef]
- Antonuccio, M.N.; Morales, H.G.; This, A.; Capellini, K.; Avril, S.; Celi, S.; Rouet, L. Towards the 2D velocity reconstruction in abdominal aorta from Color-Doppler Ultrasound. Med. Eng. Phys. 2022, 107, 103873. [Google Scholar] [CrossRef]
- Gallo, D.; De Santis, G.; Negri, F.; Tresoldi, D.; Ponzini, R.; Massai, D.; Deriu, M.A.; Segers, P.; Verhegghe, B.; Rizzo, G.; et al. On the use of in vivo measured flow rates as boundary conditions for image-based hemodynamic models of the human aorta: Implications for indicators of abnormal flow. Ann. Biomed. Eng. 2012, 40, 729–741. [Google Scholar] [CrossRef]
- Morbiducci, U.; Ponzini, R.; Gallo, D.; Bignardi, C.; Rizzo, G. Inflow boundary conditions for image-based computational hemodynamics: Impact of idealized versus measured velocity profiles in the human aorta. J. Biomech. 2013, 46, 102–109. [Google Scholar] [CrossRef]
- Condemi, F.; Campisi, S.; Viallon, M.; Troalen, T.; Xuexin, G.; Barker, A.J.; Markl, M.; Croisille, P.; Trabelsi, O.; Cavinato, C.; et al. Fluid- and biomechanical analysis of ascending thoracic aorta aneurysm with concomitant aortic insufficiency. Ann. Biomed. Eng. 2017, 45, 2921–2932. [Google Scholar] [CrossRef] [PubMed]
- Boccadifuoco, A.; Mariotti, A.; Celi, S.; Martini, N.; Salvetti, M.V. Uncertainty quantification in numerical simulations of the flow in thoracic aortic aneurysms. In Proceedings of the ECCOMAS Congress, Crete Island, Greece, 5–10 June 2016; pp. 6226–6249. [Google Scholar]
- Boccadifuoco, A.; Mariotti, A.; Celi, S.; Martini, N.; Salvetti, M.V. Impact of uncertainties in outflow boundary conditions on the predictions of hemodynamic simulations of ascending thoracic aortic aneurysms. Comput. Fluids 2018, 165, 96–115. [Google Scholar] [CrossRef]
- Antonuccio, M.N.; Mariotti, A.; Fanni, B.M.; Capellini, K.; Capelli, C.; Sauvage, E.; Celi, S. Effects of uncertainty of outlet boundary conditions in a patient-specific case of aortic coarctation. Ann. Biomed. Eng. 2021, 49, 3494–3507. [Google Scholar] [CrossRef] [PubMed]
- Fanni, B.M.; Pizzuto, A.; Santoro, G.; Celi, S. Introduction of a Novel Image-Based and Non-Invasive Method for the Estimation of Local Elastic Properties of Great Vessels. Electronics 2022, 11, 2055. [Google Scholar] [CrossRef]
- Schiavazzi, D.E.; Arbia, G.; Baker, C.; Hlavacek, A.M.; Hsia, T.Y.; Marsden, A.L.; Vignon-Clementel, I.E.; Congenital Hearts Alliance (MOCHA) Investigators, T. M. Uncertainty quantification in virtual surgery hemodynamics predictions for single ventricle palliation. Int. J. Numer. Methods Biomed. Eng. 2016, 32, e02737. [Google Scholar] [CrossRef] [PubMed]
- Sarrami-Foroushani, A.; Lassila, T.; Gooya, A.; Geers, A.J.; Frangi, A.F. Uncertainty quantification of wall shear stress in intracranial aneurysms using a data-driven statistical model of systemic blood flow variability. J. Biomech. 2016, 49, 3815–3823. [Google Scholar] [CrossRef]
- Brault, A.; Dumas, L.; Lucor, D. Uncertainty quantification of inflow boundary condition and proximal arterial stiffness–coupled effect on pulse wave propagation in a vascular network. Int. J. Numer. Methods Biomed. Eng. 2017, 33, e2859. [Google Scholar] [CrossRef] [PubMed]
- Bozzi, S.; Morbiducci, U.; Gallo, D.; Ponzini, R.; Rizzo, G.; Bignardi, C.; Passoni, G. Uncertainty propagation of phase contrast-MRI derived inlet boundary conditions in computational hemodynamics models of thoracic aorta. Comput. Methods Biomech. Biomed. Eng. 2017, 20, 1104–1112. [Google Scholar] [CrossRef] [PubMed]
- Mariotti, A.; Boccadifuoco, A.; Celi, S.; Salvetti, M.V. Hemodynamics and stresses in numerical simulations of the thoracic aorta: Stochastic sensitivity analysis to inlet flow-rate waveform. Comput. Fluids 2021, 230, 105123. [Google Scholar] [CrossRef]
- Mariotti, A.; Vignali, E.; Gasparotti, E.; Capellini, K.; Celi, S.; Salvetti, M.V. Comparison between numerical and MRI data of ascending aorta hemodynamics in a circulatory mock loop. In Proceedings of the Conference of the Italian Association of Theoretical and Applied Mechanics, Rome, Italy, 15–19 September 2019; Springer: Cham, Switzerland, 2019; pp. 898–907. [Google Scholar]
- Ferrari, G.; Balasubramanian, P.; Tubaldi, E.; Giovanniello, F.; Amabili, M. Experiments on dynamic behaviour of a Dacron aortic graft in a mock circulatory loop. J. Biomech. 2019, 86, 132–140. [Google Scholar] [CrossRef]
- Brindise, M.C.; Chiastra, C.; Burzotta, F.; Migliavacca, F.; Vlachos, P.P. Hemodynamics of stent implantation procedures in coronary bifurcations: An in vitro study. Ann. Biomed. Eng. 2017, 45, 542–553. [Google Scholar] [CrossRef] [PubMed]
- Stanley, N.; Ciero, A.; Timms, W.; Hewlin, R.L., Jr. Development of 3-D Printed Optically Clear Rigid Anatomical Vessels for Particle Image Velocimetry Analysis in Cardiovascular Flow. In Proceedings of the ASME International Mechanical Engineering Congress and Exposition, Salt Lake City, UT, USA, 11–14 November 2019; American Society of Mechanical Engineers: New York, NY, USA, 2019; Volume 59445, p. V007T08A004. [Google Scholar]
- Brindise, M.C.; Rothenberger, S.; Dickerhoff, B.; Schnell, S.; Markl, M.; Saloner, D.; Rayz, V.L.; Vlachos, P.P. Multi-modality cerebral aneurysm haemodynamic analysis: In vivo 4D flow MRI, in vitro volumetric particle velocimetry and in silico computational fluid dynamics. J. R. Soc. Interface 2019, 16, 20190465. [Google Scholar] [CrossRef]
- Vignali, E.; Gasparotti, E.; Mariotti, A.; Haxhiademi, D.; Ait-Ali, L.; Celi, S. High-versatility left ventricle pump and aortic mock circulatory loop development for patient-specific hemodynamic in vitro analysis. Asaio J. 2022, 68, 1272–1281. [Google Scholar] [CrossRef] [PubMed]
- Cavallo, A.; Gasparotti, E.; Losi, P.; Foffa, I.; Al Kayal, T.; Vignali, E.; Celi, S.; Soldani, G. Fabrication and in-vitro characterization of a polymeric aortic valve for minimally invasive valve replacement. J. Mech. Behav. Biomed. Mater. 2021, 115, 104294. [Google Scholar] [CrossRef] [PubMed]
- Mariotti, A.; Vignali, E.; Gasparotti, E.; Marchese, P.; Morello, M.; Salvetti, M.V.; Celi, S. Hemodynamics in healthy and pathological thoracic aorta: Integration of in-vivo data in CFD simulations and in in-vitro experiments. In Proceedings of the World Congress in Computational Mechanics and ECCOMAS Congress, Oslo, Norway, 5–9 June 2022. [Google Scholar]
- Mariotti, A.; Gasparotti, E.; Vignali, E.; Marchese, P.; Celi, S.; Salvetti, M.V. Integrating in-vivo Data in CFD Simulations and in in-vitro Experiments of the Hemodynamic in Healthy and Pathologic Thoracic Aorta. In Bioinformatics and Biomedical Engineering, Proceedings of the 9th International Work-Conference, IWBBIO 2022, Maspalomas, Gran Canaria, Spain, 27–30 June 2022; Lecture Notes in Computer Science (including subseries Lecture Notes in Artificial Intelligence and Lecture Notes in Bioinformatics); Springer: Berlin/Heidelberg, Germany, 2022; Volume 13347, pp. 208–219. [Google Scholar]
- Gasparotti, E.; Cella, U.; Vignal, E.; Costa, E.; Soldani, G.; Cavallo, A.; Losi, P.; Biancolini, M.E.; Celi, S. A combined approach of numerical simulation and additive manifacturing technique for in-silico and in-vitro testing of a 3D printing-based aortic polymeric heart valve. In Proceedings of the Sim-AM 2019: II International Conference on Simulation for Additive Manufacturing, Pavia, Italy, 11–13 September 2019; pp. 19–30. [Google Scholar]
- Antonuccio, M.N.; Mariotti, A.; Celi, S.; Salvetti, M.V. Effects of the Distribution in Space of the Velocity-Inlet Condition in Hemodynamic Simulations of the Thoracic Aorta. In Bioinformatics and Biomedical Engineering, Proceedings of the 8th International Work-Conference, IWBBIO 2020, Granada, Spain, 6–8 May 2020; Springer: Berlin/Heidelberg, Germany, 2020. [Google Scholar]
- Mathison, M.; Furuse, A.; Asano, K. Doppler analysis of flow velocity profile at the aortic root. J. Am. Coll. Cardiol. 1988, 12, 947–954. [Google Scholar] [CrossRef] [PubMed]
- Haugen, B.O.; Berg, S.; Brecke, K.M.; Torp, H.; Slørdahl, S.A.; Skjærpe, T.; Samstad, S.O. Blood flow velocity profiles in the aortic annulus: A 3-dimensional freehand color flow Doppler imaging study. J. Am. Soc. Echocardiogr. 2002, 15, 328–333. [Google Scholar] [CrossRef]
- Sigovan, M.; Dyverfeldt, P.; Wrenn, J.; Tseng, E.E.; Saloner, D.; Hope, M.D. Extended 3D approach for quantification of abnormal ascending aortic flow. Magn. Reson. Imaging. 2015, 33, 695–700. [Google Scholar] [CrossRef]
- Youssefi, P.; Gomez, A.; Arthurs, C.; Sharma, R.; Jahangiri, M.; Alberto Figueroa, C. Impact of patient-specific inflow velocity profile on hemodynamics of the thoracic aorta. J. Biomech. Eng. 2018, 140, 011002. [Google Scholar] [CrossRef]
- Myers, J.G.; Moore, J.A.; Ojha, M.; Johnston, K.W.; Ethier, C.R. Factors influencing blood flow patterns in the human right coronary artery. Ann. Biomed. Eng. 2001, 29, 109–120. [Google Scholar] [CrossRef]
- Marzo, A.; Singh, P.; Reymond, P.; Stergiopulos, N.; Patel, U.; Hose, R. Influence of inlet boundary conditions on the local hemodynamics of intracranial aneurysms. Comput. Methods Biomech. Biomed. Eng. 2009, 12, 431–444. [Google Scholar] [CrossRef]
- Campbell, I.C.; Ries, J.; Dhawan, S.S.; Quyyumi, A.A.; Taylor, W.R.; Oshinski, J.N. Effect of inlet velocity profiles on patient-specific computational fluid dynamics simulations of the carotid bifurcation. J. Biomech. Eng. 2012, 134, 051001. [Google Scholar] [CrossRef] [PubMed]
- Chiastra, C.; Morlacchi, S.; Gallo, D.; Morbiducci, U.; Cárdenes, R.; Larrabide, I.; Migliavacca, F. Computational fluid dynamic simulations of image-based stented coronary bifurcation models. J. R. Soc. Interface 2013, 10, 20130193. [Google Scholar] [CrossRef] [PubMed]
- Pinto, S.I.S.; Campos, J.B.L.M. Numerical study of wall shear stress-based descriptors in the human left coronary artery. Comput. Methods Biomech. Biomed. Eng. 2016, 19, 1443–1455. [Google Scholar] [CrossRef] [PubMed]
- Krzhizhanovskaya, V.V.; Závodszky, G.; Lees, M.H.; Dongarra, J.J.; Sloot, P.M.A.; Brissos, S.; Teixeira, J. Advanced Radial Basis Functions Mesh Morphing for High Fidelity FluidStructure Interaction with Known Movement of the Walls: Simulation of an Aortic Valve; Springer International Publishing: Cham, Switzerland, 2020. [Google Scholar]
- Fanni, B.M.; Antonuccio, M.N.; Santoro, G.; Mariotti, A.; Salvetti, M.V.; Celi, S. Effects of uncertainties of image-based material properties of great vessels on vascular deformation. In Proceedings of the World Congress in Computational Mechanics and ECCOMAS Congress, Oslo, Norway, 5–9 June 2022; Volume 288949, pp. 1–10. [Google Scholar]
- Fanni, B.M.; Antonuccio, M.N.; Pizzuto, A.; Berti, S.; Santoro, G.; Celi, S. Uncertainty Quantification in the In Vivo Image-Based Estimation of Local Elastic Properties of Vascular Walls. J. Cardiovasc. Dev. Dis. 2023, 10, 109. [Google Scholar] [CrossRef] [PubMed]
- Eck, V.G.; Donders, W.P.; Sturdy, J.; Feinberg, J.; Delhaas, T.; Hellevik, L.R.; Huberts, W. A guide to uncertainty quantification and sensitivity analysis for cardiovascular applications. Int. J. Numer. Methods Biomed. Eng. 2015, 32, 02755. [Google Scholar] [CrossRef]
- Cantinotti, M.; Marchese, P.; Koestenberger, M.; Giordano, R.; Santoro, G.; Assanta, N.; Kutty, S. Intracardiac flow visualization using high-frame rate blood speckle tracking echocardiography: Illustrations from infants with congenital heart disease. Echocardiography 2021, 38, 707–715. [Google Scholar] [CrossRef]
- Xiu, D.; Karniadakis, G.E. The Wiener–Askey polynomial chaos for stochastic differential equations. Siam J. Sci. Comput. 2002, 24, 619–644. [Google Scholar] [CrossRef]
- Sobol, I.M. Global sensitivity indices for nonlinear mathematical models and their Monte Carlo estimates. Math. Comput. Simul. 2001, 55, 271–280. [Google Scholar] [CrossRef]
- Baumgartner, H.; Bonhoeffer, P.; De Groot, N.M.; De Haan, F.; Deanfield, J.E.; Galie, N. Endorsed by the Association for European Paediatric Cardiology (AEPC). ESC guidelines for the management of grown-up congenital heart disease (new version 2010): The Task force on the management of Grown-up Congenital Heart Disease of the European Society of Cardiology (ESC). Eur. Heart J. 2010, 31, 2915–2957. [Google Scholar]
- Lan, I.S.; Liu, J.; Yang, W.; Zimmermann, J.; Ennis, D.B.; Marsden, A.L. Validation of the reduced unified continuum formulation against in vitro 4D-flow MRI. Ann. Biomed. Eng. 2023, 51, 377–393. [Google Scholar] [CrossRef]
- Bardi, F.; Gasparotti, E.; Vignali, E.; Avril, S.; Celi, S. A Hybrid Mock Circulatory Loop for Fluid Dynamic Characterization of 3D Anatomical Phantoms. IEEE Trans. Biomed. Eng. 2022. Article in Press. [Google Scholar] [CrossRef] [PubMed]
- Vignali, E.; Gasparotti, E.; Celi, S.; Avril, S. Fully-coupled FSI computational analyses in the ascending thoracic aorta using patient-specific conditions and anisotropic material properties. Front. Physiol. 2021, 12, 732561. [Google Scholar] [CrossRef] [PubMed]


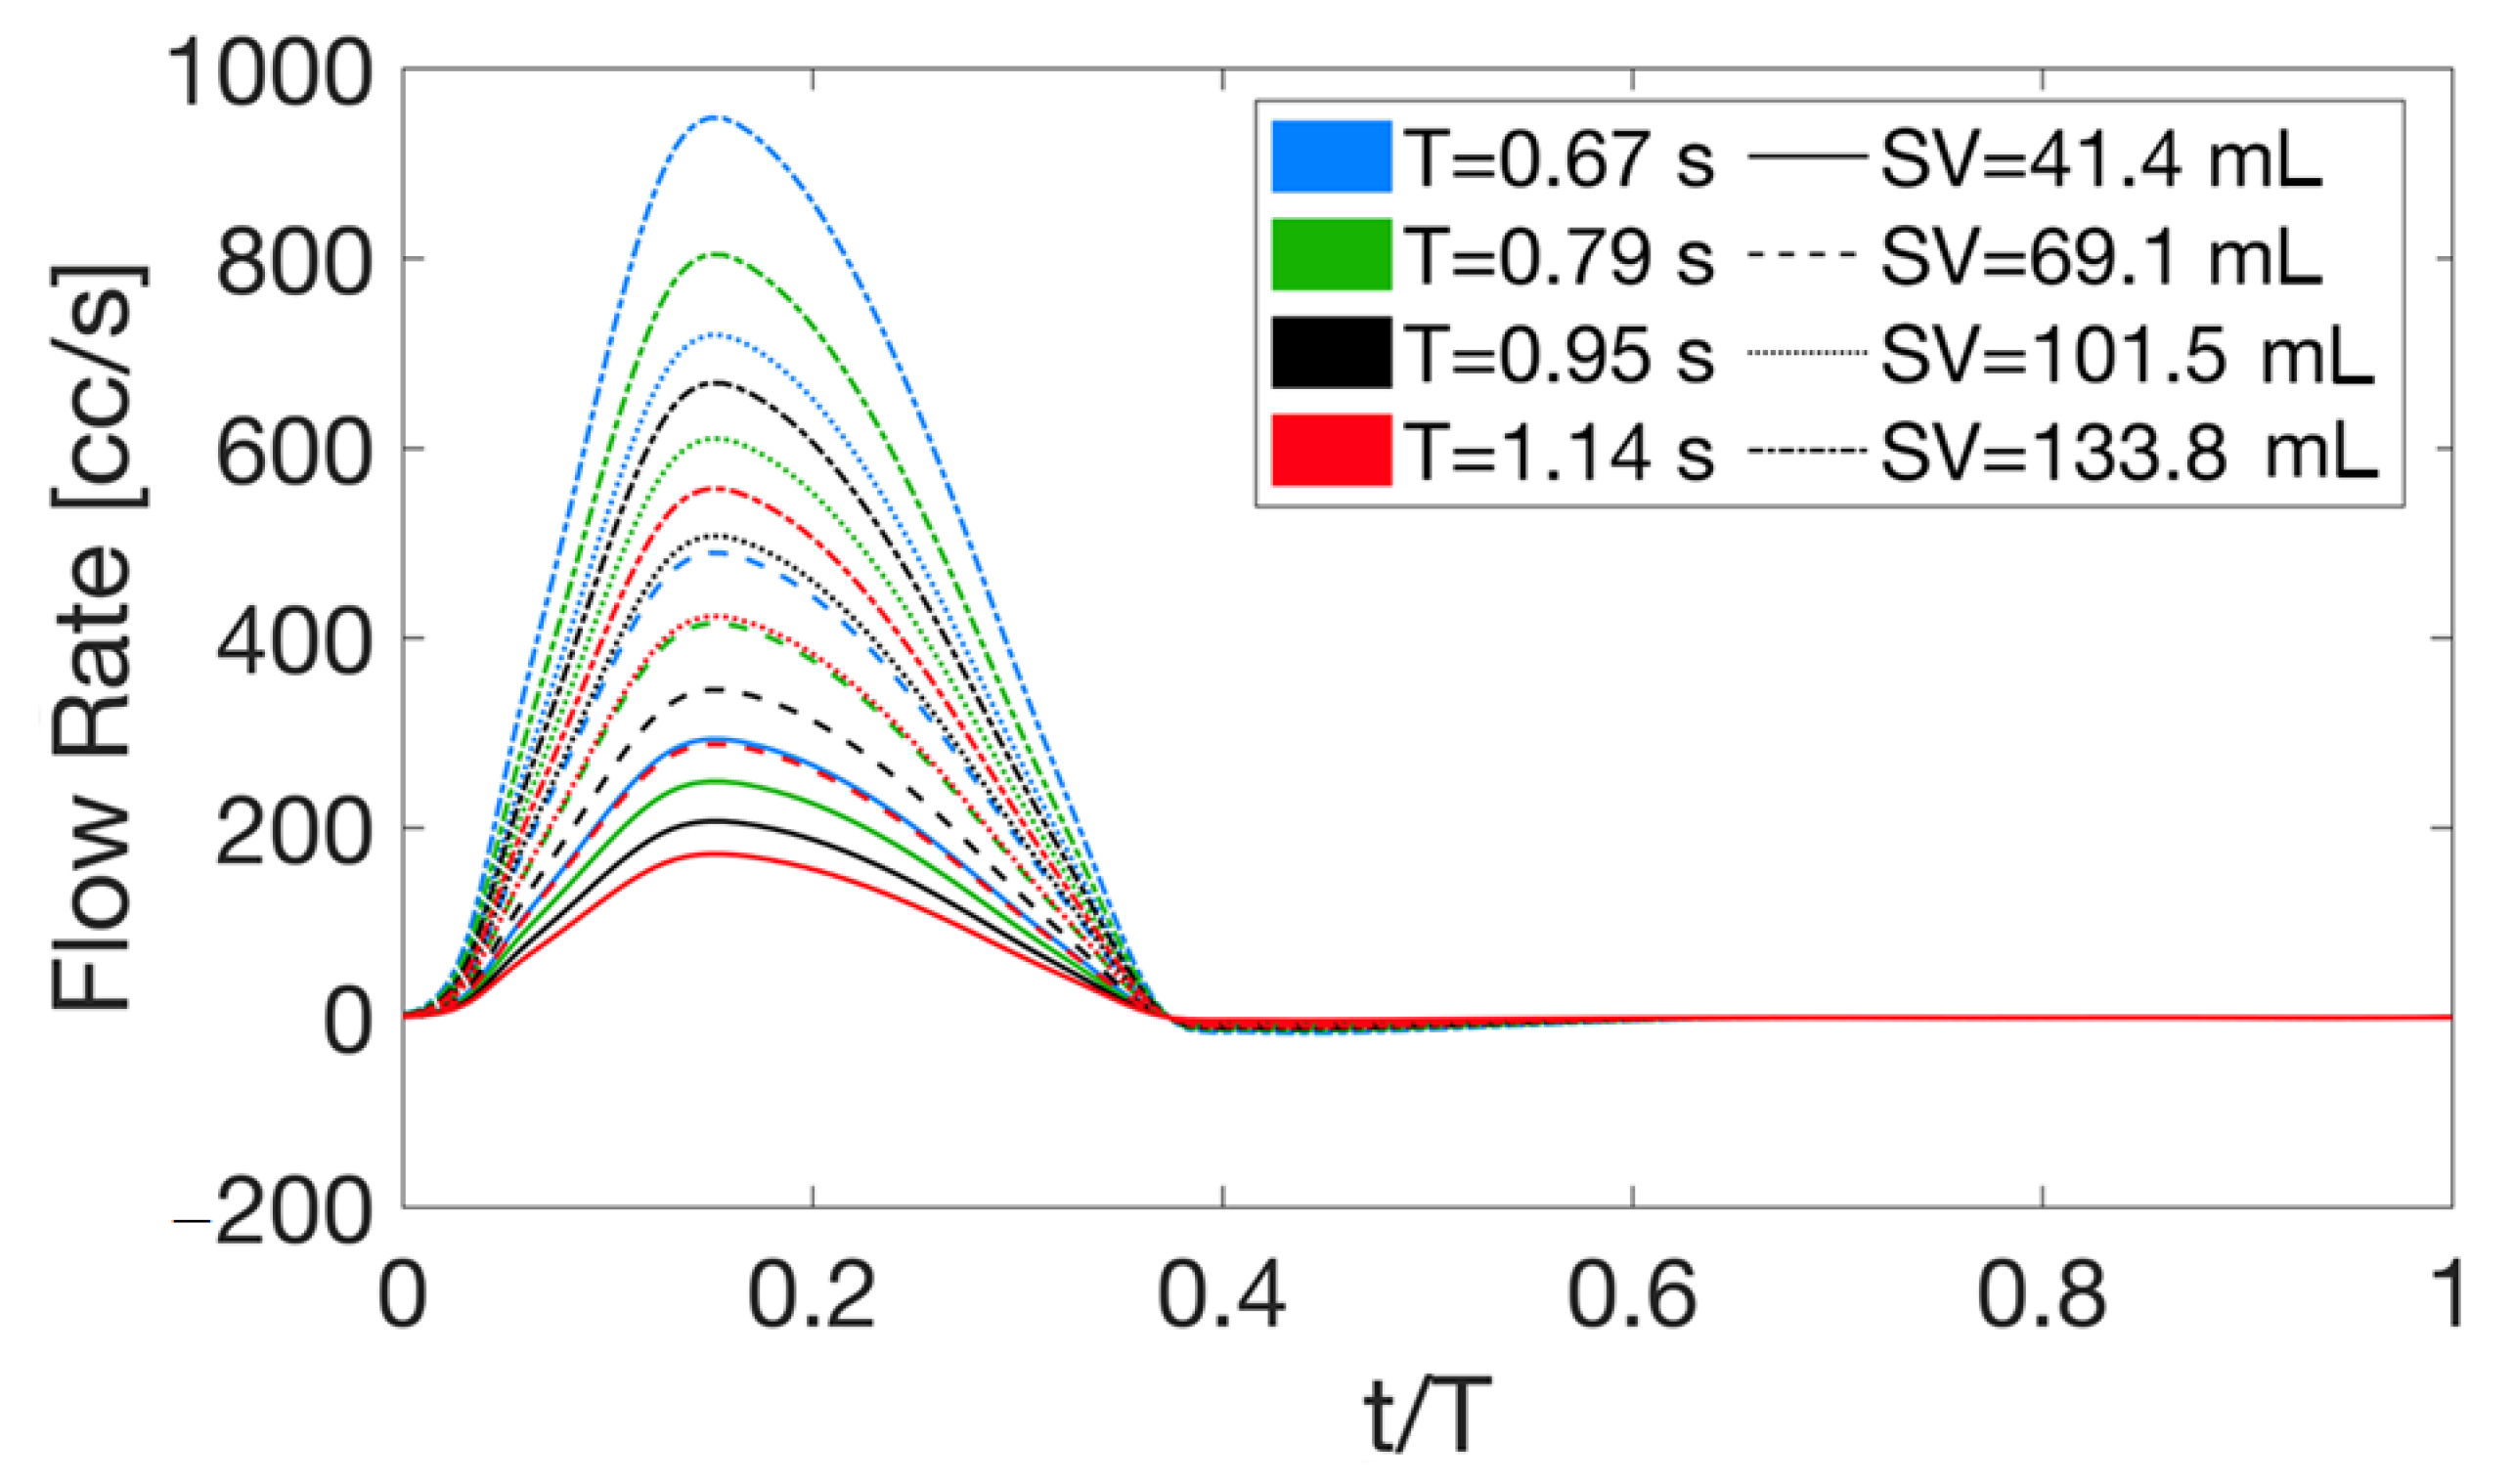
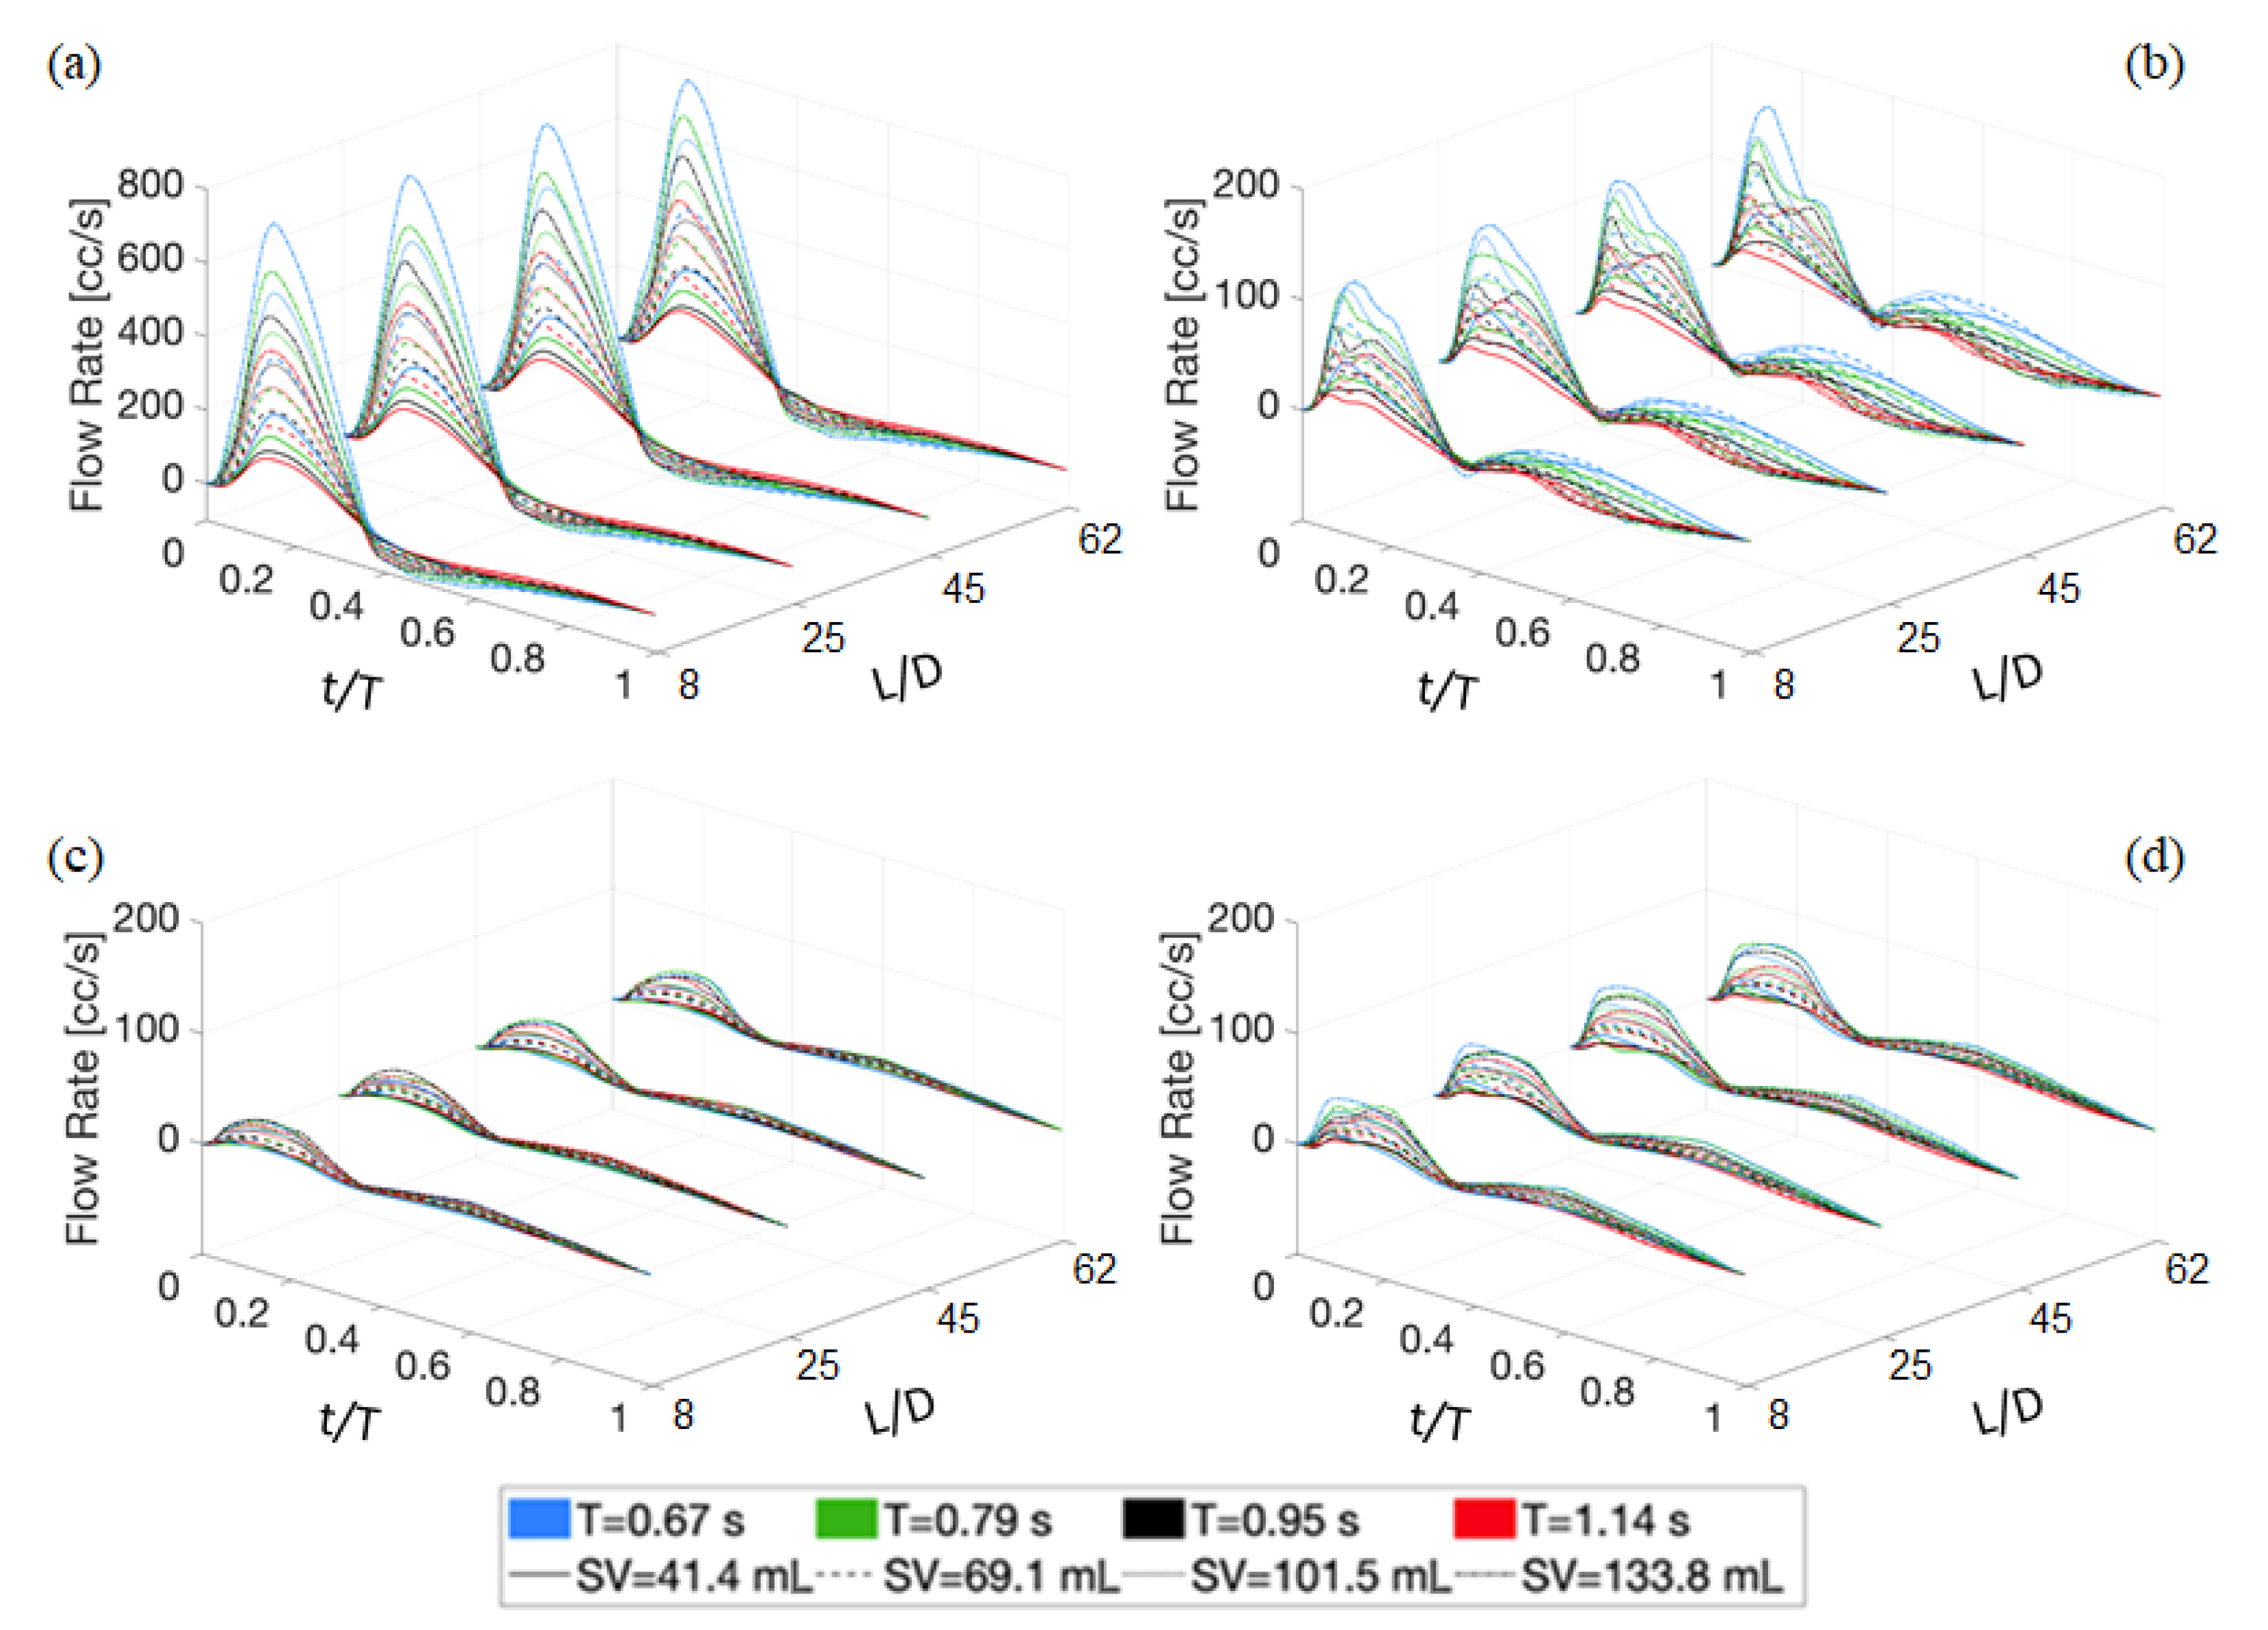
| T [] | 0.67 | 0.79 | 0.95 | 1.14 |
| [] | 41.4 | 69.1 | 101.5 | 133.8 |
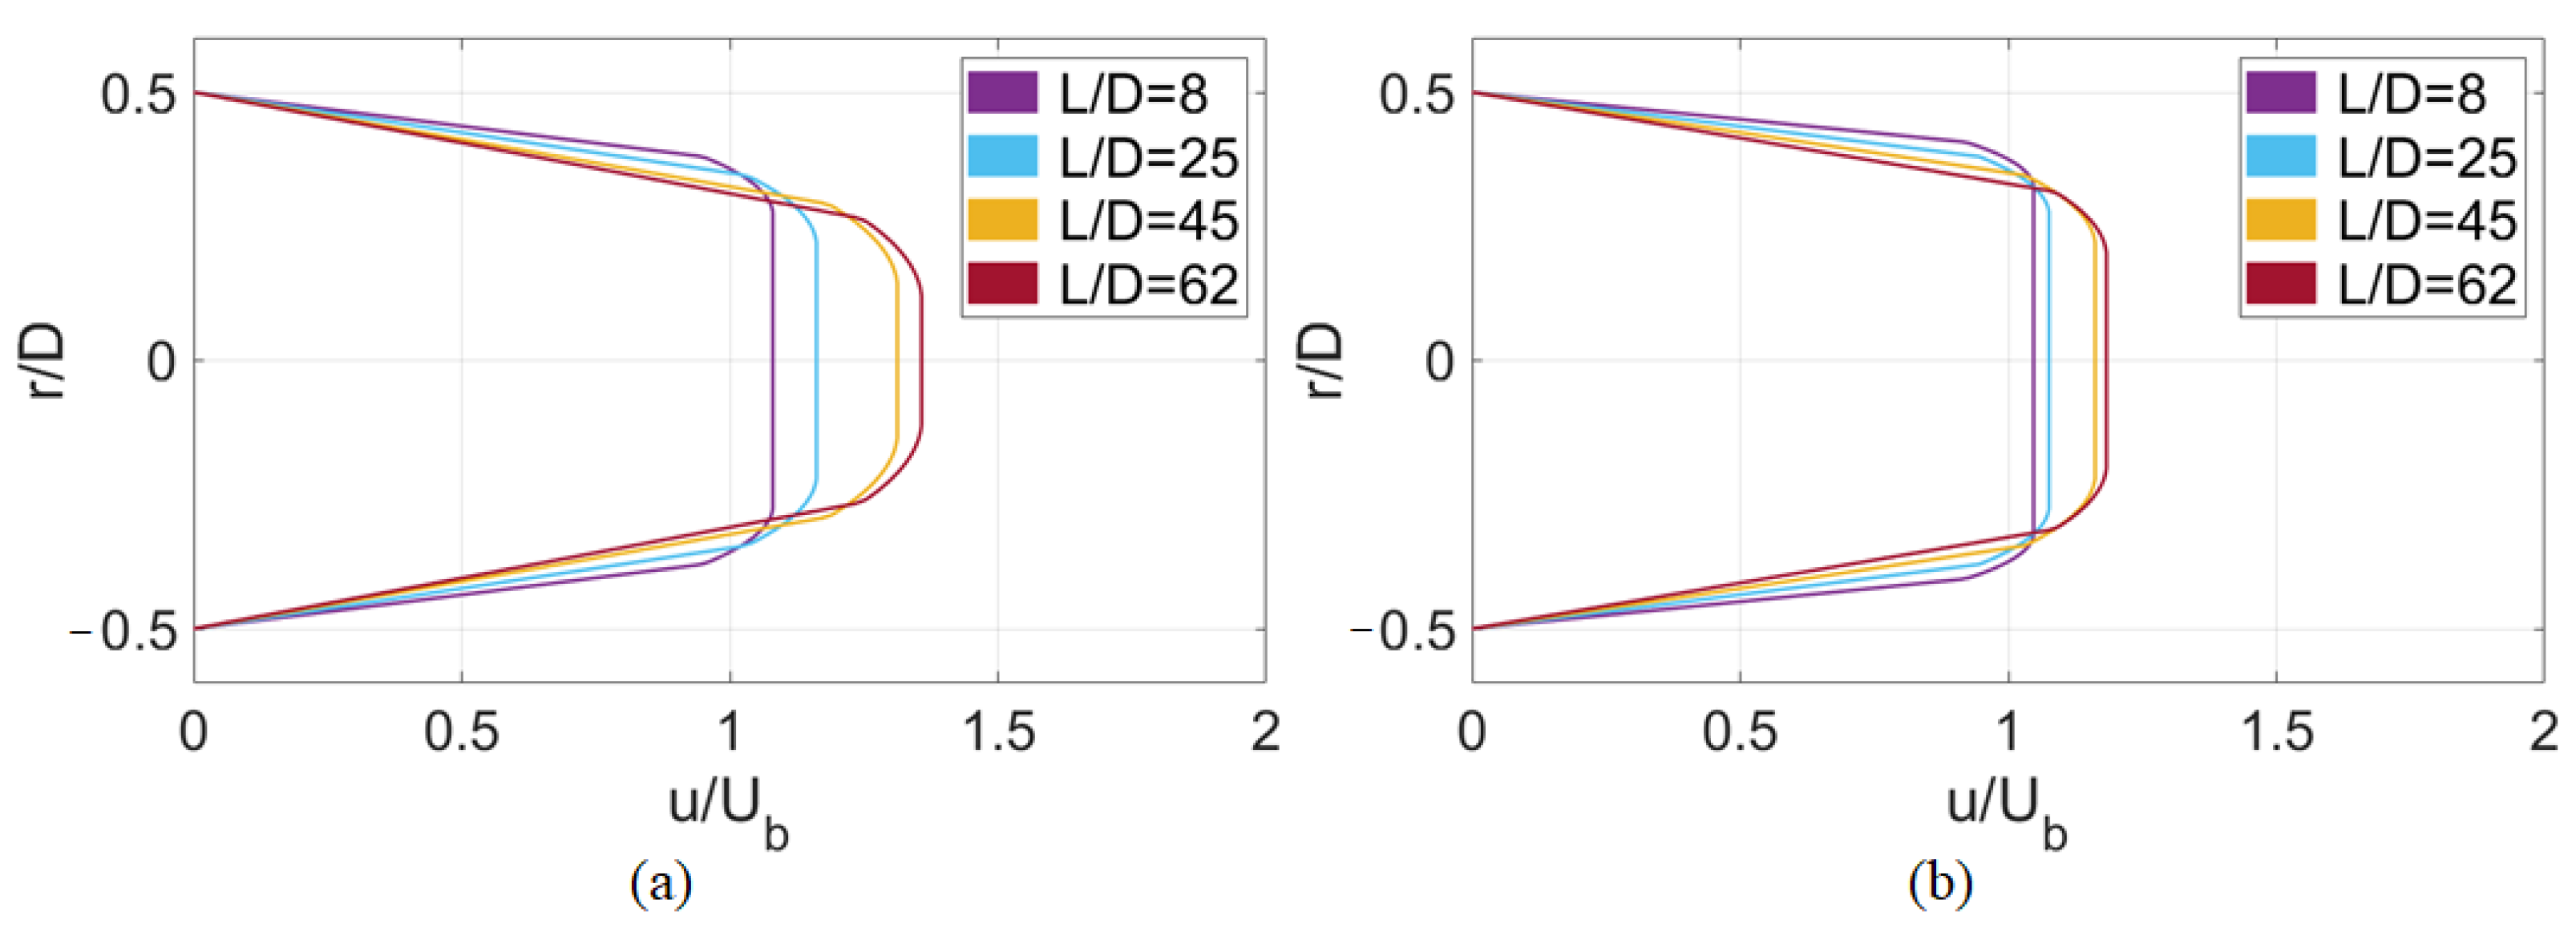
| [−] | 8 | 25 | 45 | 62 |
Disclaimer/Publisher’s Note: The statements, opinions and data contained in all publications are solely those of the individual author(s) and contributor(s) and not of MDPI and/or the editor(s). MDPI and/or the editor(s) disclaim responsibility for any injury to people or property resulting from any ideas, methods, instructions or products referred to in the content. |
© 2023 by the authors. Licensee MDPI, Basel, Switzerland. This article is an open access article distributed under the terms and conditions of the Creative Commons Attribution (CC BY) license (https://creativecommons.org/licenses/by/4.0/).
Share and Cite
Mariotti, A.; Vignali, E.; Gasparotti, E.; Morello, M.; Singh, J.; Salvetti, M.V.; Celi, S. In Vitro Analysis of Hemodynamics in the Ascending Thoracic Aorta: Sensitivity to the Experimental Setup. Appl. Sci. 2023, 13, 5095. https://doi.org/10.3390/app13085095
Mariotti A, Vignali E, Gasparotti E, Morello M, Singh J, Salvetti MV, Celi S. In Vitro Analysis of Hemodynamics in the Ascending Thoracic Aorta: Sensitivity to the Experimental Setup. Applied Sciences. 2023; 13(8):5095. https://doi.org/10.3390/app13085095
Chicago/Turabian StyleMariotti, Alessandro, Emanuele Vignali, Emanuele Gasparotti, Mario Morello, Jaskaran Singh, Maria Vittoria Salvetti, and Simona Celi. 2023. "In Vitro Analysis of Hemodynamics in the Ascending Thoracic Aorta: Sensitivity to the Experimental Setup" Applied Sciences 13, no. 8: 5095. https://doi.org/10.3390/app13085095
APA StyleMariotti, A., Vignali, E., Gasparotti, E., Morello, M., Singh, J., Salvetti, M. V., & Celi, S. (2023). In Vitro Analysis of Hemodynamics in the Ascending Thoracic Aorta: Sensitivity to the Experimental Setup. Applied Sciences, 13(8), 5095. https://doi.org/10.3390/app13085095