Article

A Real-Time Traffic Sign Recognition Method Using a New Attention-Based Deep Convolutional Neural Network for Smart Vehicles

1
CEM, Lab ENIS, University of Sfax, Sfax 3038, Tunisia
2
ESME, ESME Research Lab, 94200 Ivry sur Seine, France
*
Author to whom correspondence should be addressed.
Appl. Sci. 2023, 13(8), 4793; https://doi.org/10.3390/app13084793
Submission received: 8 March 2023 / Revised: 30 March 2023 / Accepted: 8 April 2023 / Published: 11 April 2023

Abstract

:
Artificial Intelligence (AI) in the automotive industry allows car manufacturers to produce intelligent and autonomous vehicles through the integration of AI-powered Advanced Driver Assistance Systems (ADAS) and/or Automated Driving Systems (ADS) such as the Traffic Sign Recognition (TSR) system. Existing TSR solutions focus on some categories of signs they recognise. For this reason, a TSR approach encompassing more road sign categories like Warning, Regulatory, Obligatory, and Priority signs is proposed to build an intelligent and real-time system able to analyse, detect, and classify traffic signs into their correct categories. The proposed approach is based on an overview of different Traffic Sign Detection (TSD) and Traffic Sign Classification (TSC) methods, aiming to choose the best ones in terms of accuracy and processing time. Hence, the proposed methodology combines the Haar cascade technique with a deep CNN model classifier. The developed TSC model is trained on the GTSRB dataset and then tested on various categories of road signs. The achieved testing accuracy rate reaches 98.56%. In order to improve the classification performance, we propose a new attention-based deep convolutional neural network. The achieved results are better than those existing in other traffic sign classification studies since the obtained testing accuracy and F1-measure rates achieve, respectively, 99.91% and 99%. The developed TSR system is evaluated and validated on a Raspberry Pi 4 board. Experimental results confirm the reliable performance of the suggested approach.

1. Introduction

Road transport is the most widely used mode of transportation, generating significant and increasing traffic around the world. Unfortunately, this expansion has several negative consequences for public health, the economy, and society. According to the World Health Organisation (WHO), 1.3 million people die and 50 million are injured each year. In addition, a study conducted by the U.S. National Highway Transportation Safety Administration (NHTSA) in 2016 shows that the percentage of car accidents due to human error represents between 94% and 96% of all vehicle accidents caused by driver carelessness, disregarding, or misreading road signs, which attests for the need and importance of having an automatic and intelligent system in order to assist the driver in his driving tasks.
Today, many car manufacturers integrate systems offering various levels of autonomy and security in their vehicles, like Advanced Driver Assistance Systems (ADAS) and Automated Driving Systems (ADS), which are two parts of the Driving Automation (DA) domain [1]. Among these systems, we find a fatigue detection system, an accident and pedestrian detection system, and a traffic sign recognition system (TSRS), among others, that may help drivers avoid stress and serious driving errors and minimise the number of bad decisions and accidents that may occur.
In order to assist drivers and improve their efficiency and safety, TSRS is considered one of the most important vehicle-based intelligent systems, designed to detect and interpret road signs. It consists in fixing a vehicle-mounted camera to record and analyse real-time road scenes to recognise traffic signs, display and inform the driver of their content in the case of ADAS, and improve control and safety in an ADS case.
The TSR process includes two steps: Traffic Sign Detection (TSD) and Traffic Sign Classification (TSC). In the literature, several algorithms were proposed for road sign detection and classification. In fact, traffic sign detection methods are mainly based on inherent information, such as the colour and shape of traffic signs [2], which accurately extracts traffic sign candidate areas from the actual road scenes. Unfortunately, these methods are not robust to changes in lighting, scale, occlusions, and rotations. In order to deal with these problems, TSD methods using artificial intelligence are used [3,4,5,6]. In the classification step, classical machine learning methods with descriptors are used, such as the oriented gradient histogram (HOG) [7,8,9], Local Binary Pattern (LBP) [10], the Scale-Invariant Feature Transform (SIFT) descriptor [11], and the Speeded Up Robust Features (SURF) descriptor [12,13]. One of the main problems with these methods is that the classification accuracy is largely determined by the ability of the descriptor to represent the different discriminant characteristics. That is why several authors, like [2,14], switch to deep learning to overcome this limitation.
The challenges for fast and efficient road sign recognition in real scenes are enormous and complex when the vehicle is moving at a random speed. Indeed, several parameters condition the detection and the classification algorithms, such as the climatic situation, ambient lighting, similar objects, degradation of the panel’s quality, total or partial obstruction, etc. Meeting all these challenges requires not only a robust system but also a reliable one that must ensure the response in real time before passing the sign. Available TSR solutions generally deal with some categories of signs, specifically the regulatory one. However, there are a multitude of traffic sign categories to be recognised [15]. For example, TESLA’s Autopilot system (in update 2020.36) recognises and reads speed limit signs and models them on the instrument cluster [16]. The Nissan Safety Shield system reads and recognises speed limit signs according to weather conditions. The Mercedes Traffic Signs Assistant detects signs, taking weather conditions into account, and displays detected speed limits and no overtaking signs on the instrument cluster [17].
Faced with the existing TSR system’s limitation, which can only recognise regulatory signs, we deal in this work with four categories of road signs (Warning, Regulatory, Obligatory, and Priority signs) as shown in Figure 1. We propose a methodology that recognises 43 types of signs by combining the fastest TSD method able to detect the road sign in the captured frame with the most accurate TSC method, ensuring its classification, to build a robust TSR system able to recognise all road signs in the GTSRB dataset with a relevant level of accuracy and processing time. In fact, the proposed method combines the Haar cascade technique with deep CNN model classification. The developed TSC model is trained on the GTSRB dataset and then tested on different traffic signs. In order to improve the classification performance, we propose a new attention-based deep convolutional neural network, which enables us to achieve a test accuracy rate of 99.91%. The proposed methodology is then tested and validated on an embedded system (Raspberry Pi 4). Overall, the proposed TSR system appears to be a highly effective solution for traffic sign recognition, with excellent performance in terms of accuracy, precision, and execution time. The proposed solution being evaluated seems to outperform other recent approaches mentioned in this work in terms of accuracy, with an execution time of only 150 ms.
The remainder of this paper is organised as follows: Section 2 details a review of the relevant methods used to detect and classify traffic signs. Section 3 introduces our TSR methodology and discusses the obtained results. The last section provides conclusions drawn from the paper and suggests some potential future works.

2. Related Works

2.1. TSR Process

Road sign recognition has been extensively studied in intelligent research over the past few years. In fact, according to [18], a TSR system, as shown in Figure 2, is a process based on five main steps: image acquisition, preprocessing, detection, classification, and result. Indeed, the first step consists in acquiring images from cameras embedded in a vehicle. Then, these images are cleaned and prepared for further analysis in the second step. This can include operations such as image distortion correction, resizing, and noise removal. The system then uses traffic sign detection algorithms to locate road signs in the preprocessed images. In the fourth step, the system pays close attention to the identification of what exact class the detected traffic sign belongs to. Finally, the system uses the information obtained to make a decision that is either reported to the driver or transmitted to another component of the vehicle.

2.1.1. Image Acquisition

Image acquisition is a crucial component of any traffic sign recognition system. In fact, the system must be able to capture high-quality images of traffic signs in real time, under varying lighting and weather conditions, and from different angles and distances. There are several ways to acquire images for a traffic sign recognition system, including using cameras mounted on vehicles or roadside infrastructure, such as traffic lights or signs. The cameras can be monocular or stereo, with monocular cameras being more common due to their lower cost and simpler installation.
To ensure high-quality images, the cameras must have a high resolution, a high frame rate, and a good dynamic range. Additionally, the system may use filters or image processing algorithms to enhance the image quality and improve the accuracy of sign detection. Overall, the quality and reliability of image acquisition are critical to the performance of a traffic sign recognition system, as accurate and timely detection of traffic signs is essential for ensuring road safety and efficient traffic management.

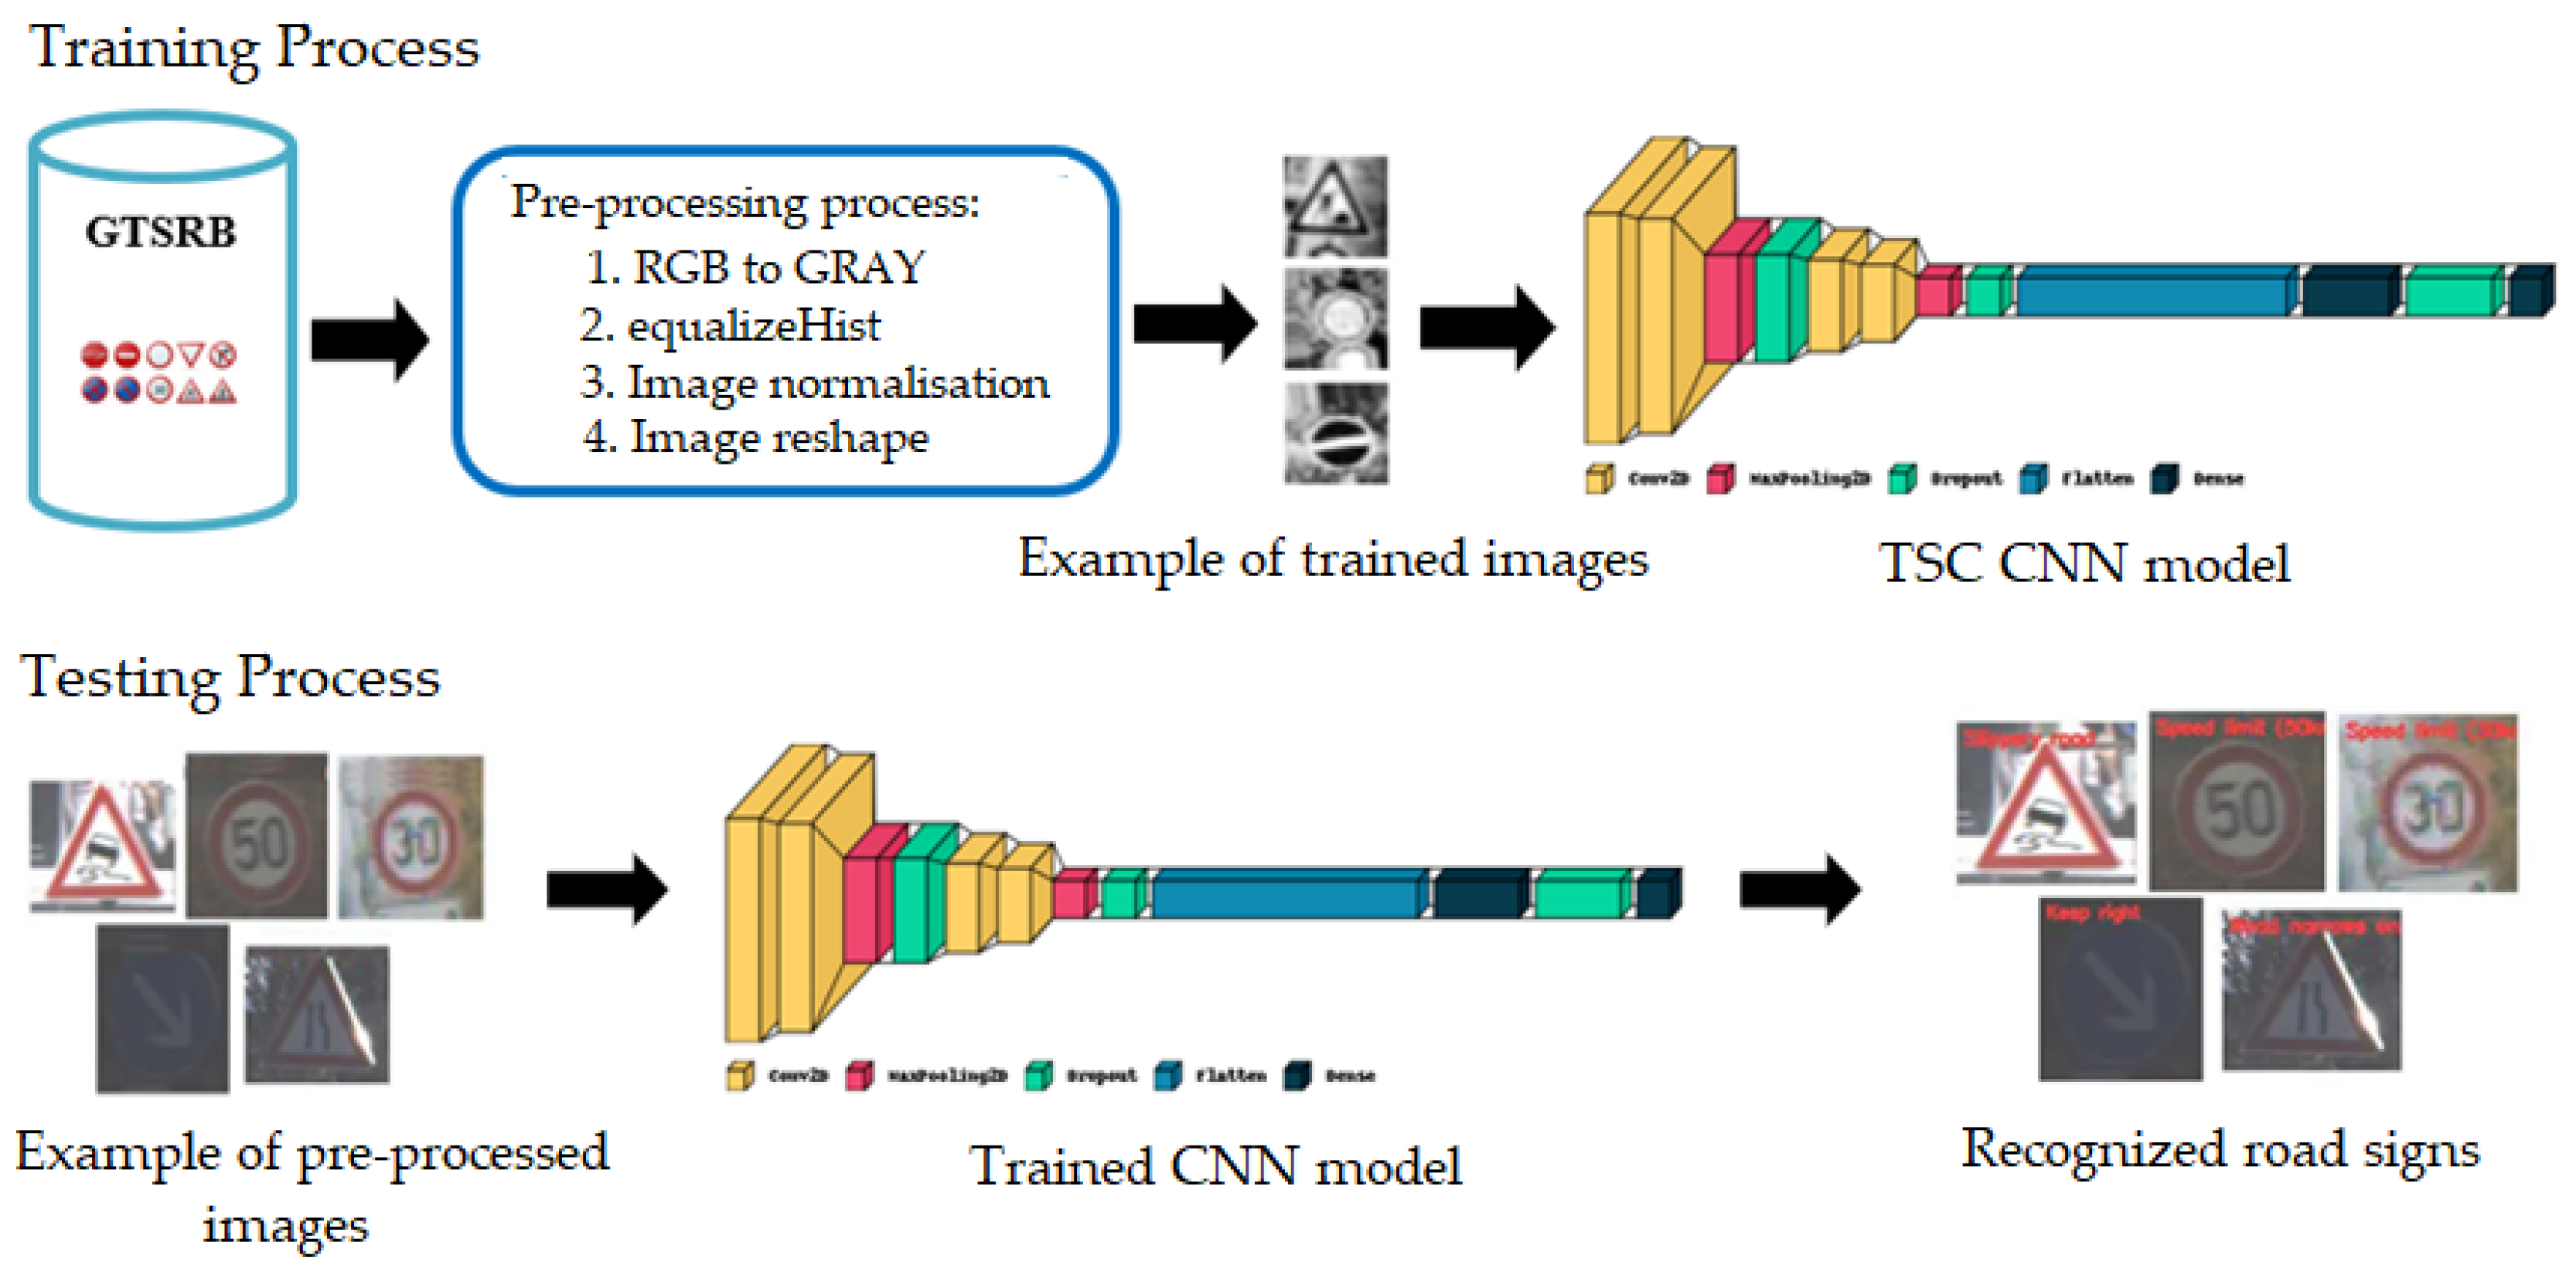
2.1.2. Preprocessing

Preprocessing is a critical step in the TSR process, as it helps to enhance the quality of the input images and improve the accuracy of the recognition system. There are several preprocessing techniques that can be applied to traffic sign images, depending on the specific characteristics of the image data and the requirements of the recognition system. In fact, these techniques depend on the requirements of the system and the characteristics of the data, like removing noise, standardising input data, and enhancing the features of the image that are relevant to classification.
Some of the most common preprocessing techniques used in traffic sign recognition include:
  • Image cropping involves selecting a region of interest (ROI) that contains only the traffic sign and removing any background information. This can help reduce the amount of irrelevant data that the machine learning model needs to process, leading to faster and more accurate classification;
  • Resizing images to a fixed size can help standardise the input data, which is important for some machine learning algorithms that require consistent input dimensions. It can also reduce the computational load and improve the speed of the system;
  • Image normalisation involves scaling the pixel values to a common range, such as [0, 1] or [−1, 1]. This can help improve the accuracy of the system by reducing the impact of lighting variations and enhancing the contrast of the image;
  • Image smoothing techniques like Gaussian blur can help reduce noise in the image and make the edges of the traffic sign more distinct. This can help improve the accuracy of edge detection algorithms and enhance the features that are relevant to classification;
  • A colour space conversion such as HSV or YUV can help separate the colour information from the luminance information. This can help improve the accuracy of colour-based segmentation and enhance the relevant features for classification.

2.1.3. Traffic Sign Detection (TSD) Module

The traffic sign detection step aims to find locations and sizes of traffic signs in natural image scenes. Actually, the efficiency and the processing time of the detection process are important factors. They play a significant role in the entire system by reducing the search space and indicating only the road sign in the image. Most traffic sign detection methods are based either on the sign’s colour and/or shape information or on machine learning and deep learning methods [19].
Colour-based traffic sign detection methods aim to find the interesting area from the captured frame based on the traffic signs colours. They are largely impacted by illumination, bad weather conditions, different colours, time of the day, and reflection of the sign’s surface [20]. Referring to [21,22], HSV has the most robust segmentation performance compared to other colour spaces thanks to its invariance to illumination changes and its robustness to conditions like occlusion.
Shape-based traffic sign detection methods consist of finding contours and approximating them to reach a final decision based on the number of contours. Experimental results show that these methods are generally more robust than colorimetric methods because the variation in daylight or colour does not affect them. However, shape-based detection methods are sensitive to small and vague traffic signs and are costly in computation time [19]. The EDC Circles method proposed by [8] is applied to the GTSDB dataset and has achieved results of 93.78% for Prohibitive and 75.51% for Mandatory detection signs in 36 ms/image.
Colour- and shape-based traffic sign detection methods are based on both colour and shape characteristics. They often rely on good colour enhancement and suitable parameters [23,24]. They share a common deficiency in several factors, like lighting changes, occlusion, translation, rotation, and scale change. The authors in [2] used the Improved HSV and HOG technique on GTSDB and achieved detection rates of 98.67%, 96.67%, and 90.43% for Prohibitive, Danger, and Mandatory signs, respectively.
Machine Learning and Deep Learning-based traffic sign detection methods can detect traffic signs accurately and treat the deficiencies shared by the previous methods, like lighting changes, occlusion, translation, rotation, and scale changes. Most of the machine learning-based detection methods shown in Table 1 use handcrafted features to extract the traffic sign, like AdaBoost detection methods and SVM methods, whereas the deep learning-based detection methods shown in Table 2 learn features through Convolutional Neural Networks (CNNs).
The Haar-like cascade features method was developed by [25] in order to detect faces in real time and was then used to detect other objects like traffic signs by [26,27]. The Support Vector Machine (SVM) uses HOG features to express the objects and to treat the detection problem of the object as an SVM classification problem in which each candidate is classified into objects or backgrounds [28]. According to [4], the Haar-like features method is faster and more useful than the HOG-like features method in detecting blurry and faded signs in various lighting conditions. Moreover, AdaBoost-based detection methods do not need a Region of interest (ROI) extraction process, whereas SVM-based methods often need the extraction process to get these regions, which greatly affects the performance of the SVM-based TSD detectors.
Most CNN-based detection networks are generally slow to detect signs. However, some networks, like You Only Look Once, have fast performance (YOLO) [6,29]. The application of Faster RCNN to the German Traffic Sign Detection Benchmark dataset (GTSDB) achieved 84.5% accuracy in 261 ms, compared to 94.2% accuracy in 155 ms for the Haar-like cascade technique [25,30]. The authors in [31] applied the Haar-like cascade classifier to the GTSDB dataset and achieved good detection rates (Speed limit: 99.13%, Danger: 99.17%, Unique: 99.04%, Mandatory: 98.95%, Derestriction: 98.92%, and other prohibition signs: 99.08%).

2.1.4. Traffic Sign Classification (TSC) Module

TSC is the second step in the process of road sign recognition. It involves the traditional computer vision and machine learning-based methods, but these were quickly replaced by deep learning-based classifiers. In fact, these methods use various datasets in order to be trained, tested, and validated. The GTSRB dataset is the most used dataset in the literature thanks to its diversity of classes (43 classes), its relevant content of data, and its large number of images and annotations. Table 3 and Table 4 summarise some classification rates (CR) obtained after applying machine learning and deep learning-based classification methods to the GTSRB dataset.
Machine learning-based classification methods consist of two major stages: in the first stage, image features are extracted to accentuate the differences among the classes, and then they are classified using machine learning algorithms. Actually, handcrafted features such as Histogram of Oriented Gradients (HOG), locally Binary Patterns (LBP), and Gabor filter, among others, refer to properties derived using various algorithms using the existing information in the image itself. They were commonly used with traditional machine learning techniques for object recognition and computer vision, like SVM [8], Random Forest (RF), K-d trees [32], and ELM [33].
Machine learning classifiers are not only used separately but also in combination. In fact, the authors in [34] use Dempster Shafer’s theory of belief functions to merge the obtained results from the training of several classifiers (SVM, KNN, MLP, and Random Forest) on 15 classes of the GTSRB dataset in order to find the most accurate combination of classifiers. They reach an accuracy of 99.85% by combining the four classifiers.
The deep learning-based classification methods are based on CNN or ConvNet. They use extracted features from images, which eliminates the need for manual feature extraction. In fact, features are not trained but learned while the network trains on a set of images. This makes the deep learning models more accurate for computer vision tasks. CNNs learn feature detection through tens or hundreds of hidden layers. Each layer increases the complexity of the learned features. There are many studies that demonstrate the excellent capacities of CNNs and deep learning for engineering applications. The authors in [35] provide a comprehensive survey of the most important aspects of deep learning and include those enhancements recently added to the field. The authors in [36] discuss various applications of CNNs, including OCR and image recognition, detecting objects in self-driving cars, social media face recognition, and image analysis in medicine. In addition, other studies like [37] propose a surrogate model based on 2D-CNN with hyperparameter optimisation to predict the torsional strength of RC beams. The results show that the proposed model exhibits high performance in predicting the torsional strength of RC beams. The authors in [38] propose a hybrid framework based on PCA, DSAE models, and data fusion for structural damage diagnosis. An enhanced WOA was developed to optimise the meta-parameters of the DSAE model.
According to [39], the authors combine CNN and ELM and reach a classification rate of 99.40%, whereas the authors in [14] obtain a better classification rate of 99.61% by compacting 2 ConvNet in order to classify road signs. In addition, the authors in [40] propose a new variant (3CNN) of their previous CNN and achieve 99.70% compared to 99.51% on GTSRB.
Based on this overview, we propose in this paper a new TSR methodology combining Haar-like cascades and deep learning techniques using the whole GTSRB dataset in order to satisfy the criteria of real-time, robustness, and accuracy. Then we implement and validate our TSR system on an embedded board.

2.1.5. Result

The result of the traffic sign recognition system consists of identifying the type of traffic sign present in the image captured by the camera system and determining the appropriate action based on the type of the detected sign. This result can take many forms, such as displaying a warning to the driver, showing the maximum speed limit, detecting stop signs, etc. It is important that the traffic sign recognition system can make quick and accurate decisions because a traffic sign detection error can have dangerous consequences for drivers and pedestrians on the road. For this reason, TSR systems must be rigorously tested and continuously improved to ensure their effectiveness.

2.2. Science Gaps in Existing TSR Systems

Despite significant progress, existing traffic sign recognition systems have made significant progress over the years in detecting and classifying traffic signs. However, there are still some scientific gaps that need to be addressed. One of the main issues is the limited robustness of these systems, particularly in real-world scenarios. Environmental factors such as lighting, weather conditions, and occlusions can significantly affect the system’s performance, making it challenging to generalise to new scenarios. A study by [41] finds that existing traffic sign recognition systems have limited robustness when tested under various lighting conditions. The study showed that the systems’ performance dropped significantly when the lighting conditions changed from normal to low or high.
Another science gap is the limited scalability of existing traffic sign recognition systems. These systems often struggle to handle large-scale datasets and generalise to new and diverse scenarios. This is due to the lack of high-quality and diverse training datasets, which makes it challenging to train the system to handle various situations [42]. For example, traffic sign recognition systems struggled to recognise certain types of traffic signs that were not present in their training dataset.
A third science gap is the limited interpretability of existing traffic sign recognition systems. These systems often lack transparency, making it challenging to understand how the system makes its decisions. This is a significant issue as it makes it challenging to debug and improve the system’s performance, and it can also lead to a lack of trust in the system. A study by [43] considered that existing traffic sign recognition systems lacked interpretability and provided little insight into the decision-making process. The study proposed a new approach to traffic sign recognition that used attention mechanisms to provide better interpretability.
Finally, existing traffic sign recognition systems are unable to accurately recognise and classify rare or novel traffic signs that may not have been encountered during the training phase of the system. In fact, most traffic sign recognition systems are trained on a limited set of traffic signs, which are commonly found on roads. These systems work well for detecting and classifying these common traffic signs, but they may struggle with rare or novel signs, which may have different shapes, colors, or symbols. This can be problematic in real-world situations where drivers may encounter new or unfamiliar traffic signs, particularly in different countries where traffic signs may differ significantly. One of the contributions of this work is to address this science gap through our proposed TSR system.

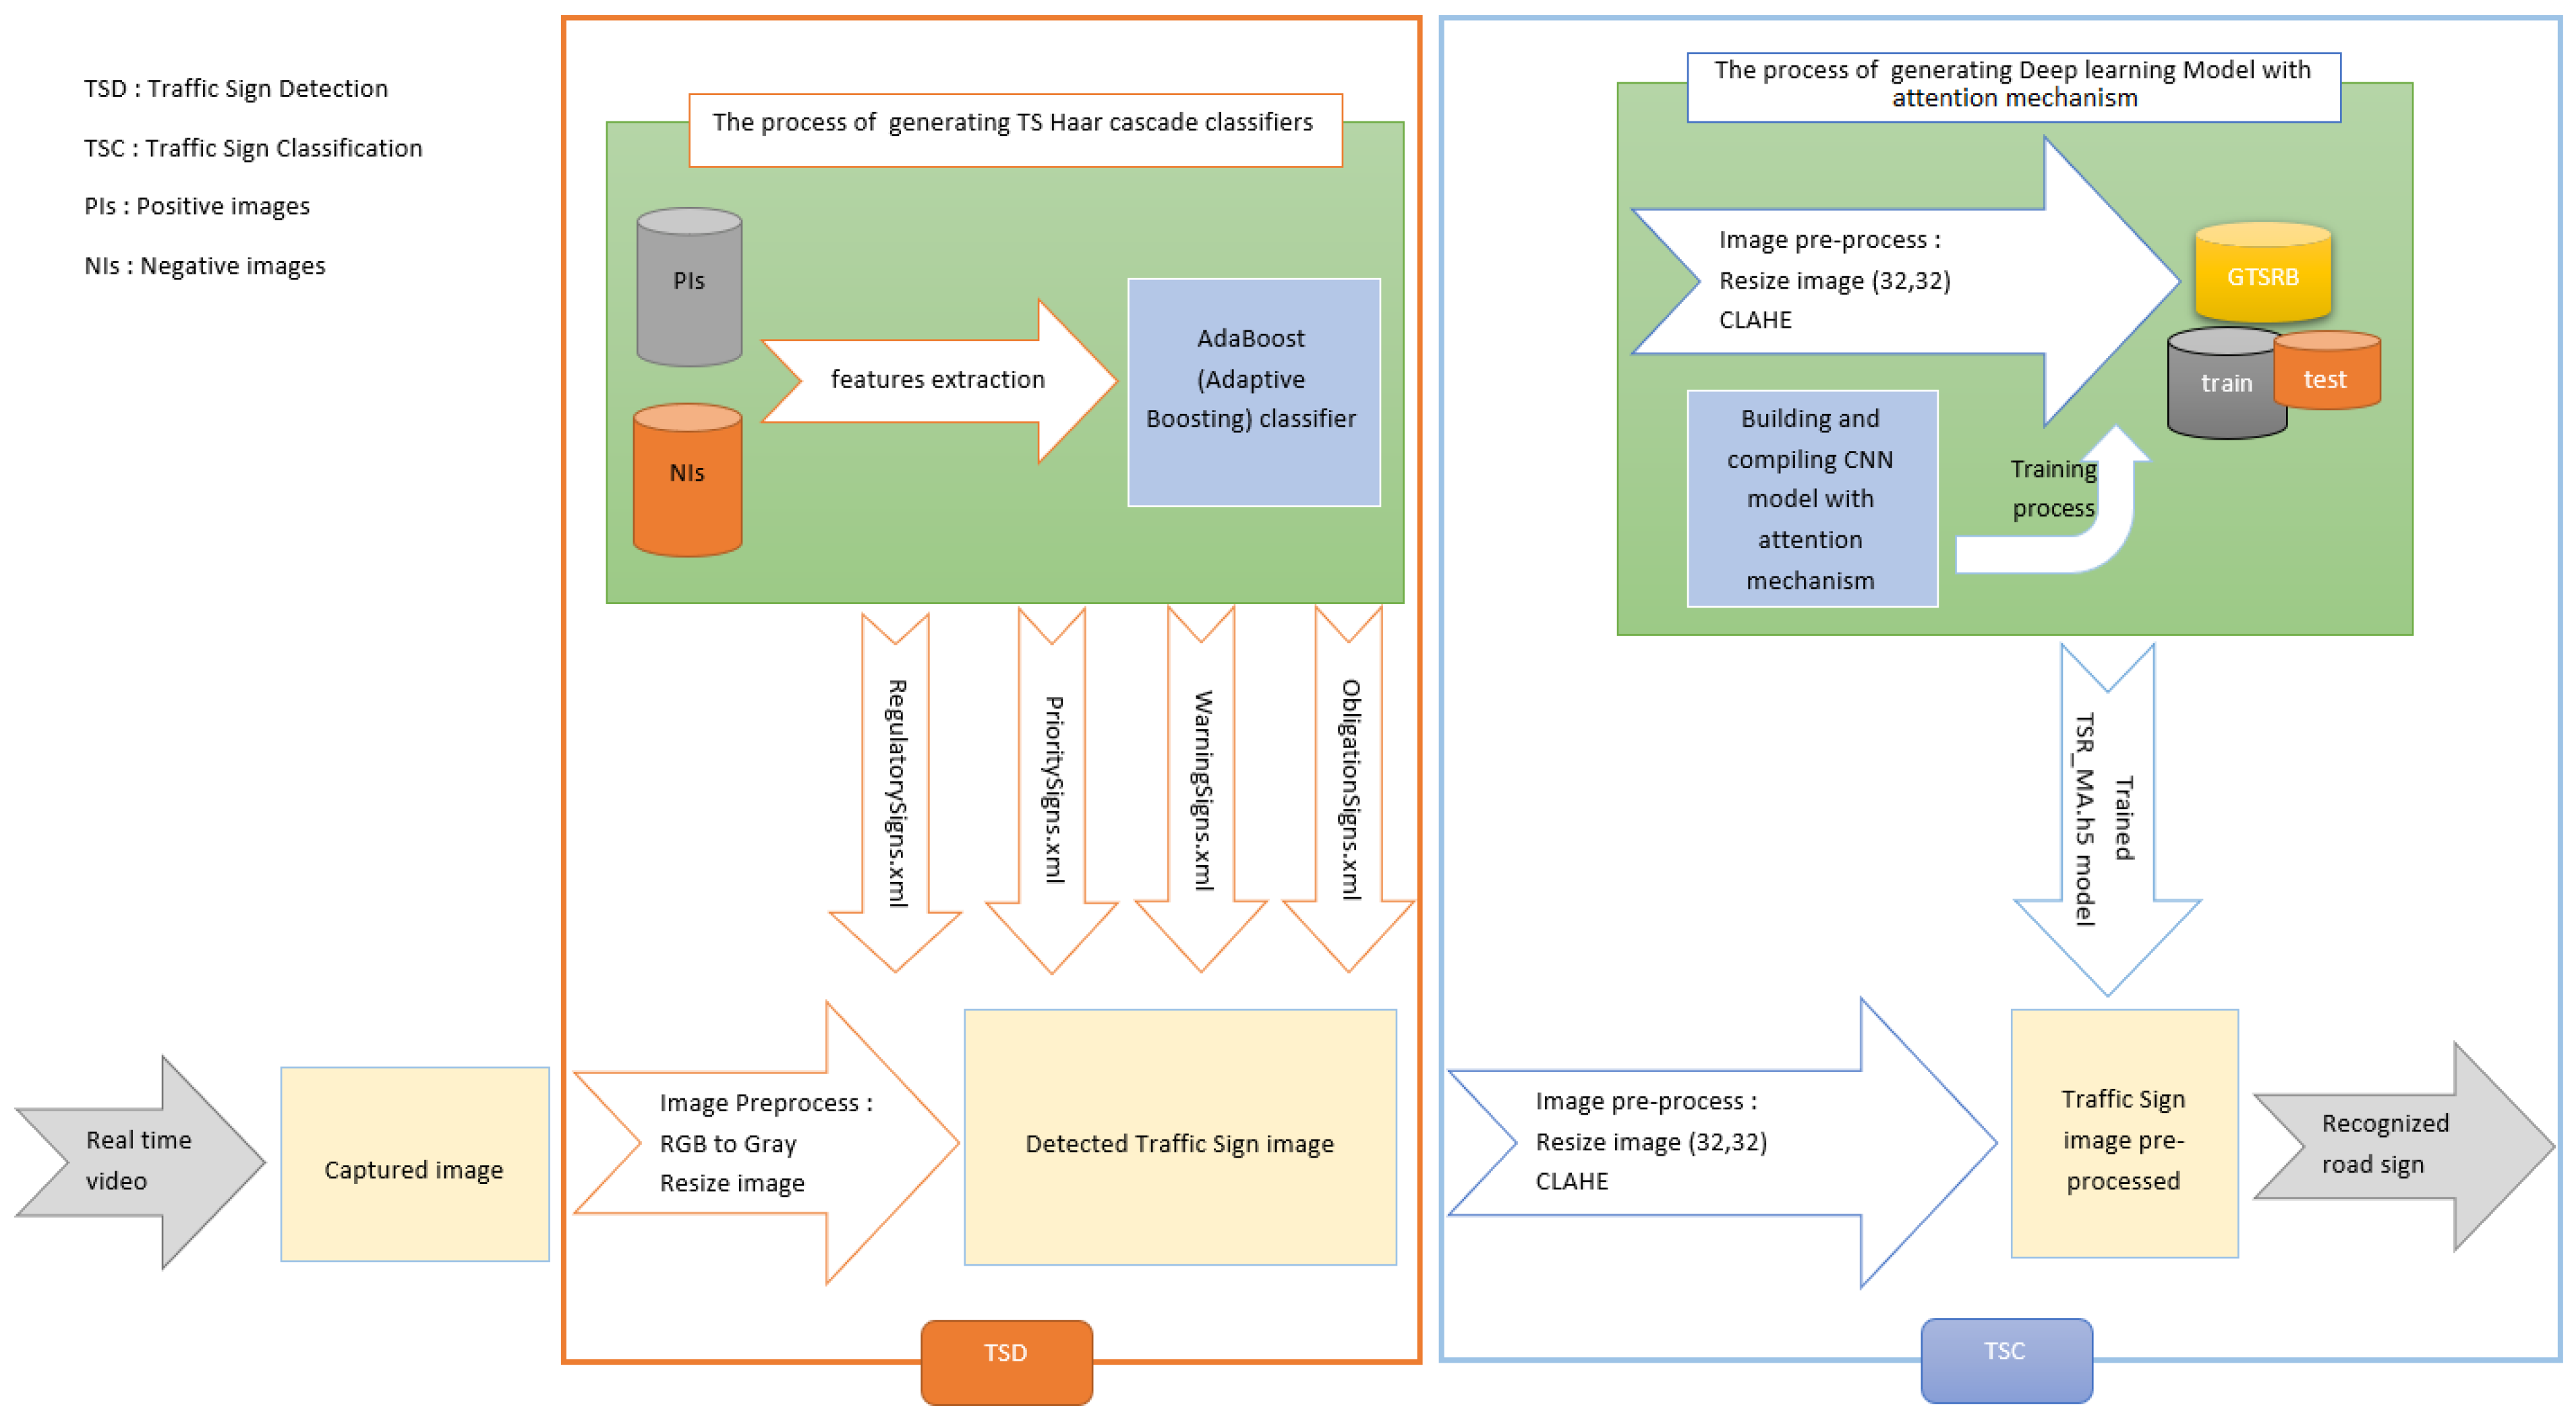
3. Proposed TSR Methodology

TSR systems are performant only if they achieve a high accuracy rate with a short processing time. In fact, the TSR system must detect and classify a road sign on the roadside in order of appearance, especially in the case of high-speed driving. Thus, our methodology is at the heart of this context. It combines the two best methods of detection (Haar cascade detector) and classification (Deep learning CNN model with attention mechanism) in terms of accuracy and detection time.
The recognition process, as shown in Figure 3, begins with capturing frames using a real-time camera. In order to reduce the impact of object detection problems like high speeds, the weather, the time of day, and many external noises such as fading and blurring effects, affected visibility, multiple appearances of the sign, chaotic backgrounds, viewing angle problems, damaged and partially obscured signs, etc., numerous configurations must be applied to the camera before or at the time of the image acquisition, like adjusting the High Dynamic Range (HDR), image resolution, image size, etc.
Preprocessing techniques are then applied to the input frame to improve its quality and consistency and make it easier for the detection algorithm to identify the signs. In our case, a colour space conversion technique is used to convert the RGB image to greyscale and resize the greyscale image to 32 × 32 pixels.
In the detection step, the Haar cascade technique begins by extracting Haar-like features from input images and then builds cascaded classifiers embedded into the AdaBoost classifier to discard negative images. After the training process, the obtained Haar cascade detector is applied to the preprocessed acquired image to extract the traffic sign image, which is then processed with the trained CNN model developed with the attention mechanism in order to be identified.
In fact, in the classification step, we choose to use the GTSRB dataset to train the developed deep learning model for many reasons, including: it contains forty-three classes, with approximately more than 50,000 pixelated low-resolution and contrast images, describing four categories of road signs (Warning, Regulatory, Obligatory, and Priority), and considering different driving conditions (blurring, lighting, etc.).
In order to improve the contrast of the training images, CLAHE (Contrast Limited Adaptive Histogram Equalisation), a preprocessing filter is performed on traffic sign images, which are already resized to 32 × 32 pixels. At the end, our approach is tested first on the CPU and then on a development board in an embedded system to validate the efficiency of our proposed TSR system.
The steps of our methodology are summarised in the algorithm below:
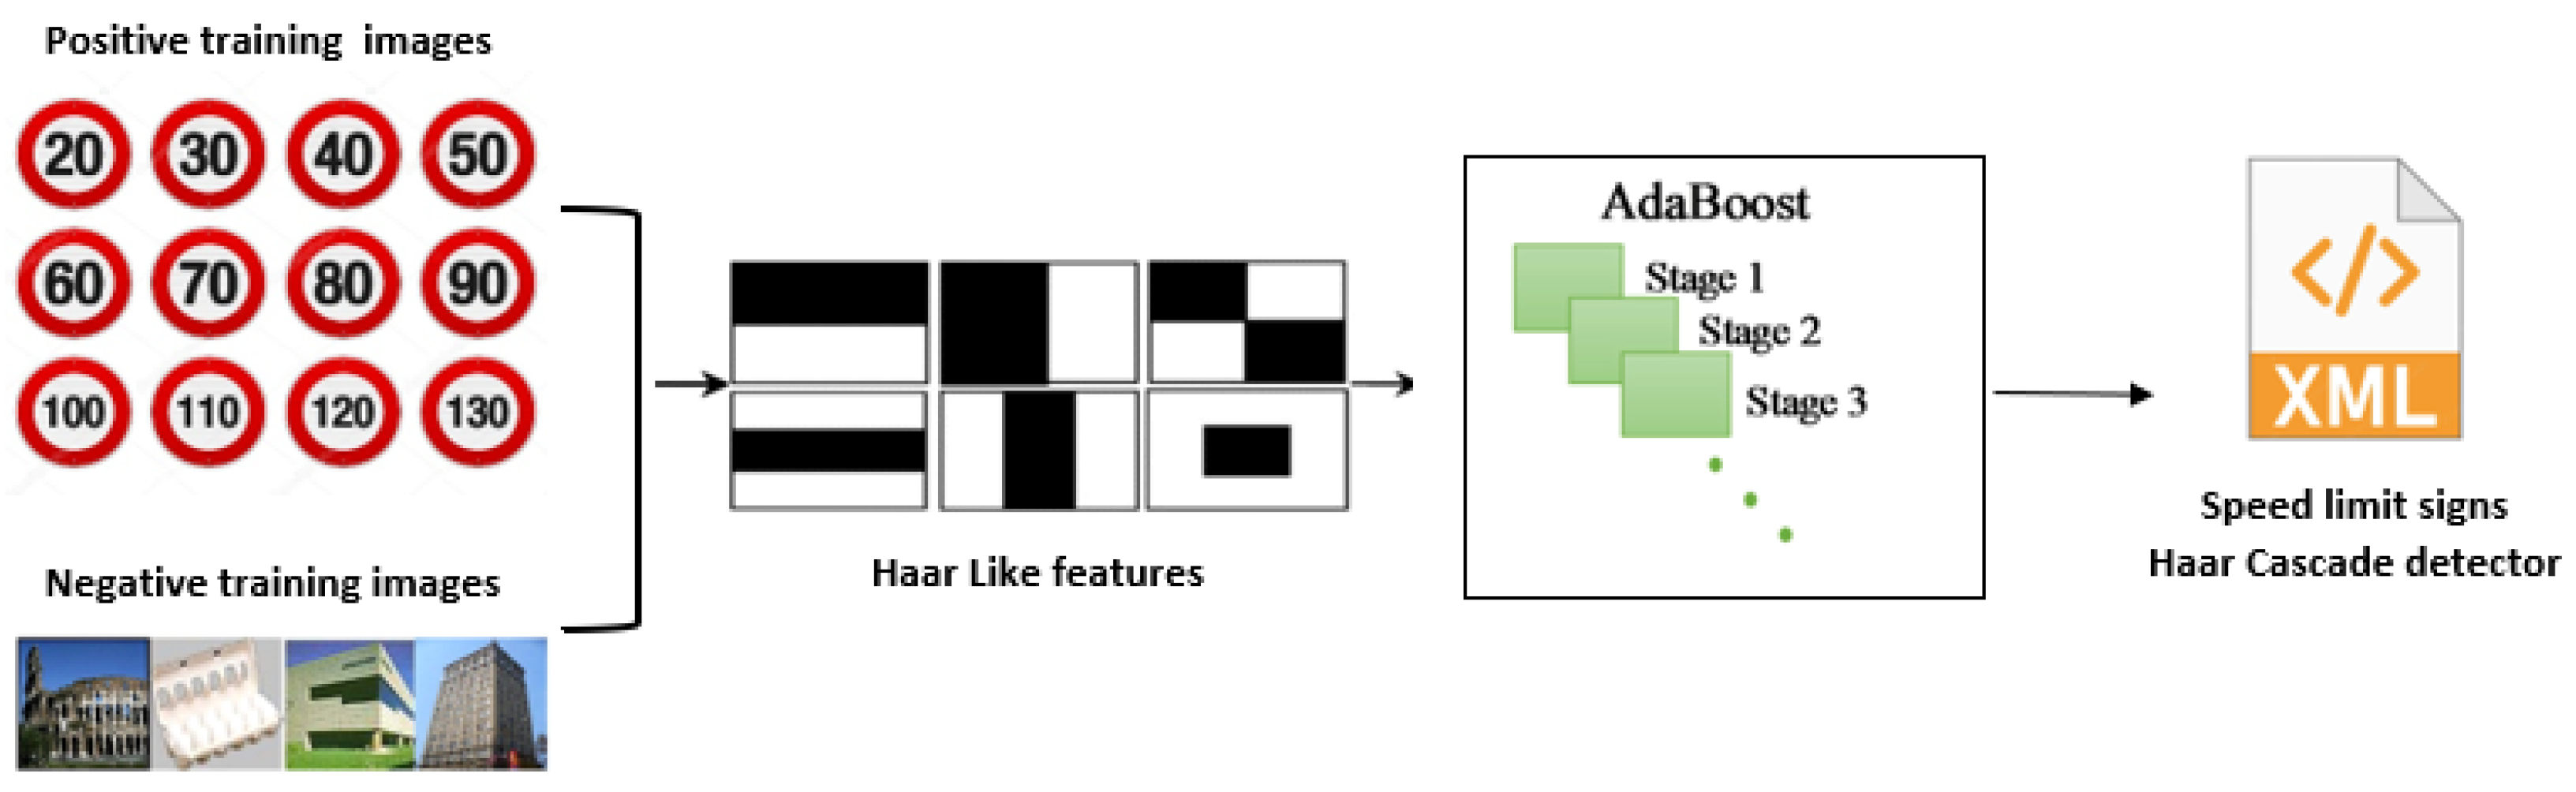
  • Step 1: prepare Haar-like cascade detectors;
  • Step 2: develop a deep neural network based on CNNs using attention mechanisms;
  • Step 3: train and test the CNN model on the GTSRB dataset;
  • Step 4: save the trained model;
  • Step 5: capture and preprocess the image from the video camera;
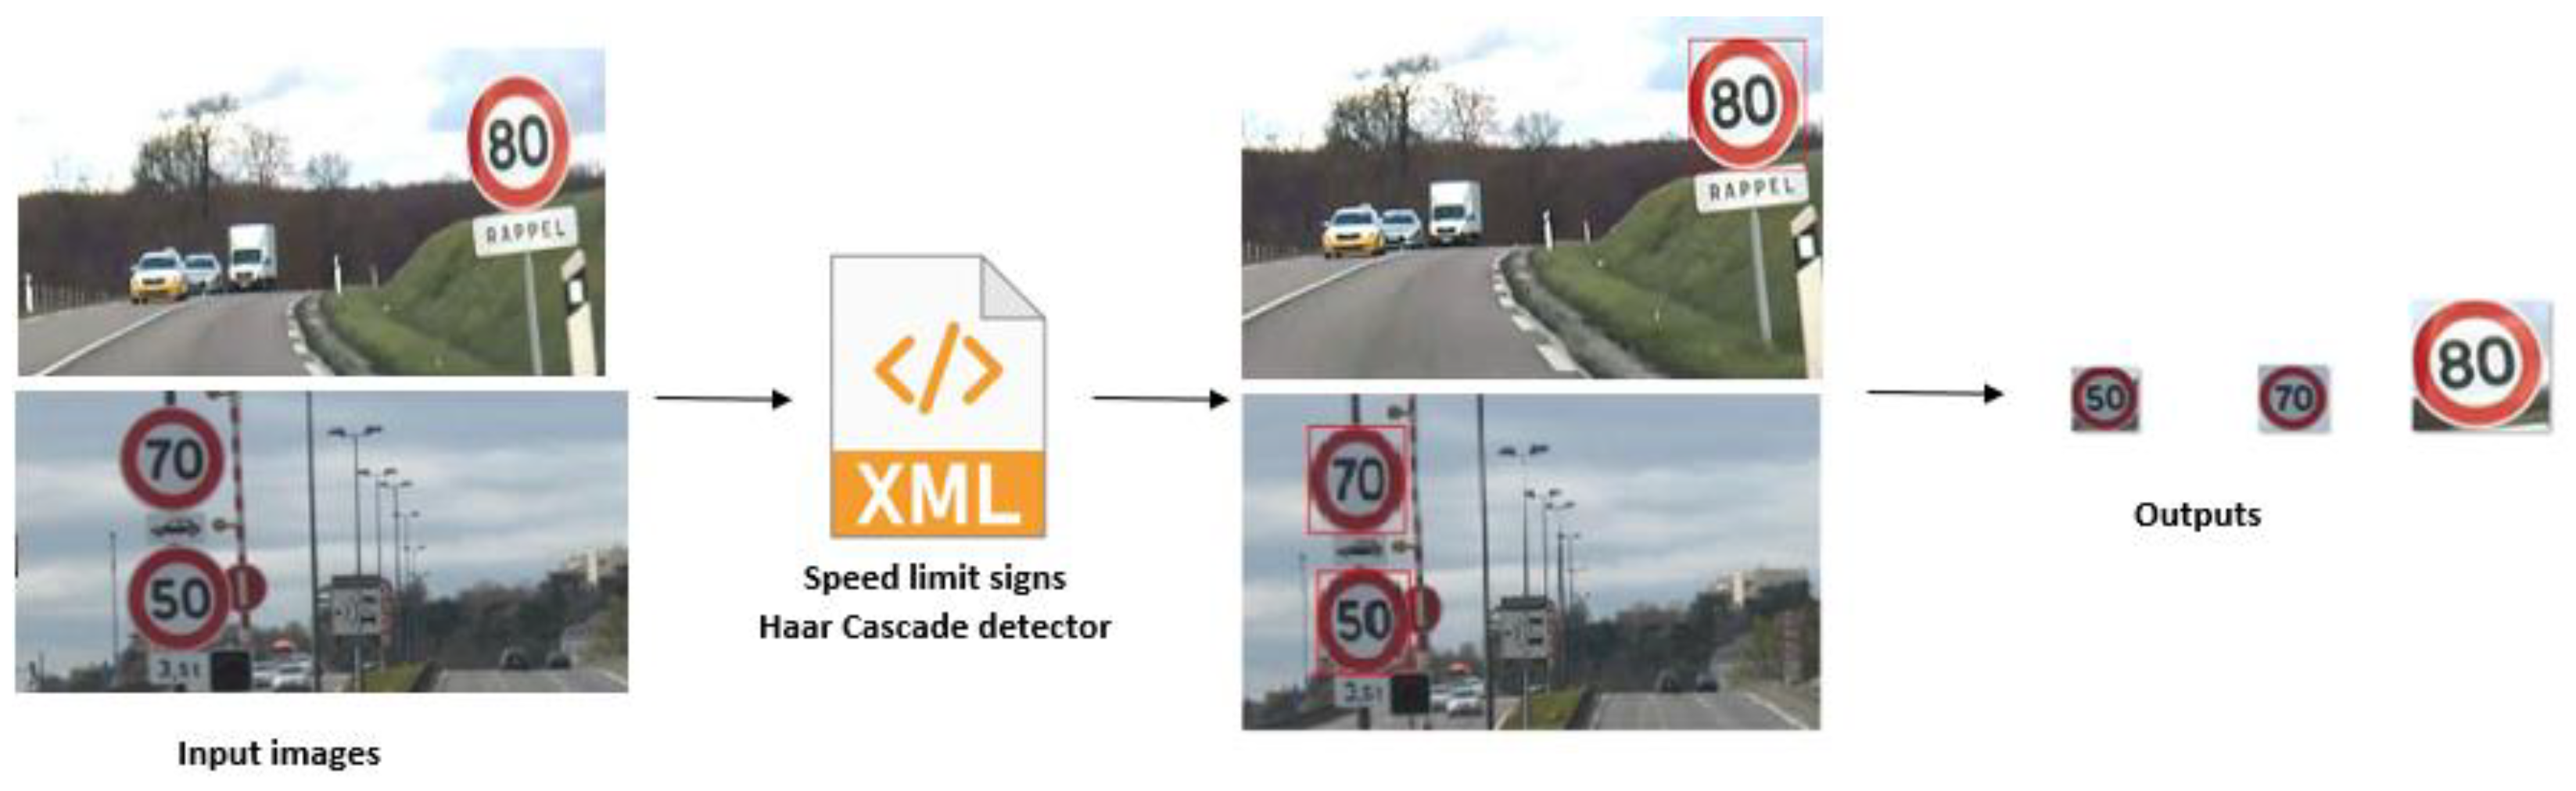
  • Step 6: extract the ROI from the captured image using the Haar-like cascade-trained detector;
  • Step 7: prediction of the detected road sign using the trained model;
  • Step 8: validation on the CPU and on a development board in an embedded system.

3.1. Traffic Sign Detection (TSD) Step

In this study, we opt for the best traffic sign detection method in terms of performance. For this reason, we rely on the best TSD techniques, which offer the best detection rates (DR) as well as processing times achieved through applying the GTSDB dataset. Table 5 confirms that the Haar cascade technique achieves the highest sign detection accuracy of 99.05%.
The Haar cascade is a machine learning-based approach used in the detection step of our TSR system to identify 43 types of road signs divided into four categories. Hundreds of positive samples were collected in a folder describing the same traffic sign category, and several arbitrary negative images (without traffic signs) were gathered in another folder.
This technique begins by extracting Haar-like features from input images and then building cascaded classifiers embedded into the AdaBoost classifier, a strong detector able to discard negative images quickly. After the training process, an XML file describing a road sign category was created to localise the traffic signs on a real-time video or on a captured frame.
As an example, Figure 4 describes the Haar cascade process, which gives a speed limit sign detector, which is then applied to input images in order to detect speed limit signs, as shown in Figure 5.

3.2. Traffic Sign Classification (TSC) Step

In order to classify the detected traffic signs, machine learning and deep learning methods were used to train and test different algorithms. Table 6 recapitulates the classification results achieved by applying the TSC methods to the GTSRB dataset. In fact, using deep learning models (CNNs) yields more accurate results than applying machine learning classifiers.
The classification process consists of two steps, which are training and testing, as shown in Figure 6. In the training process, the images are first preprocessed to feed the deep neural Traffic Sign CNN model later. Once the model is trained after several epochs, the testing step takes place using test images to evaluate the developed CNN model. The CNN model is displayed in the figure below.

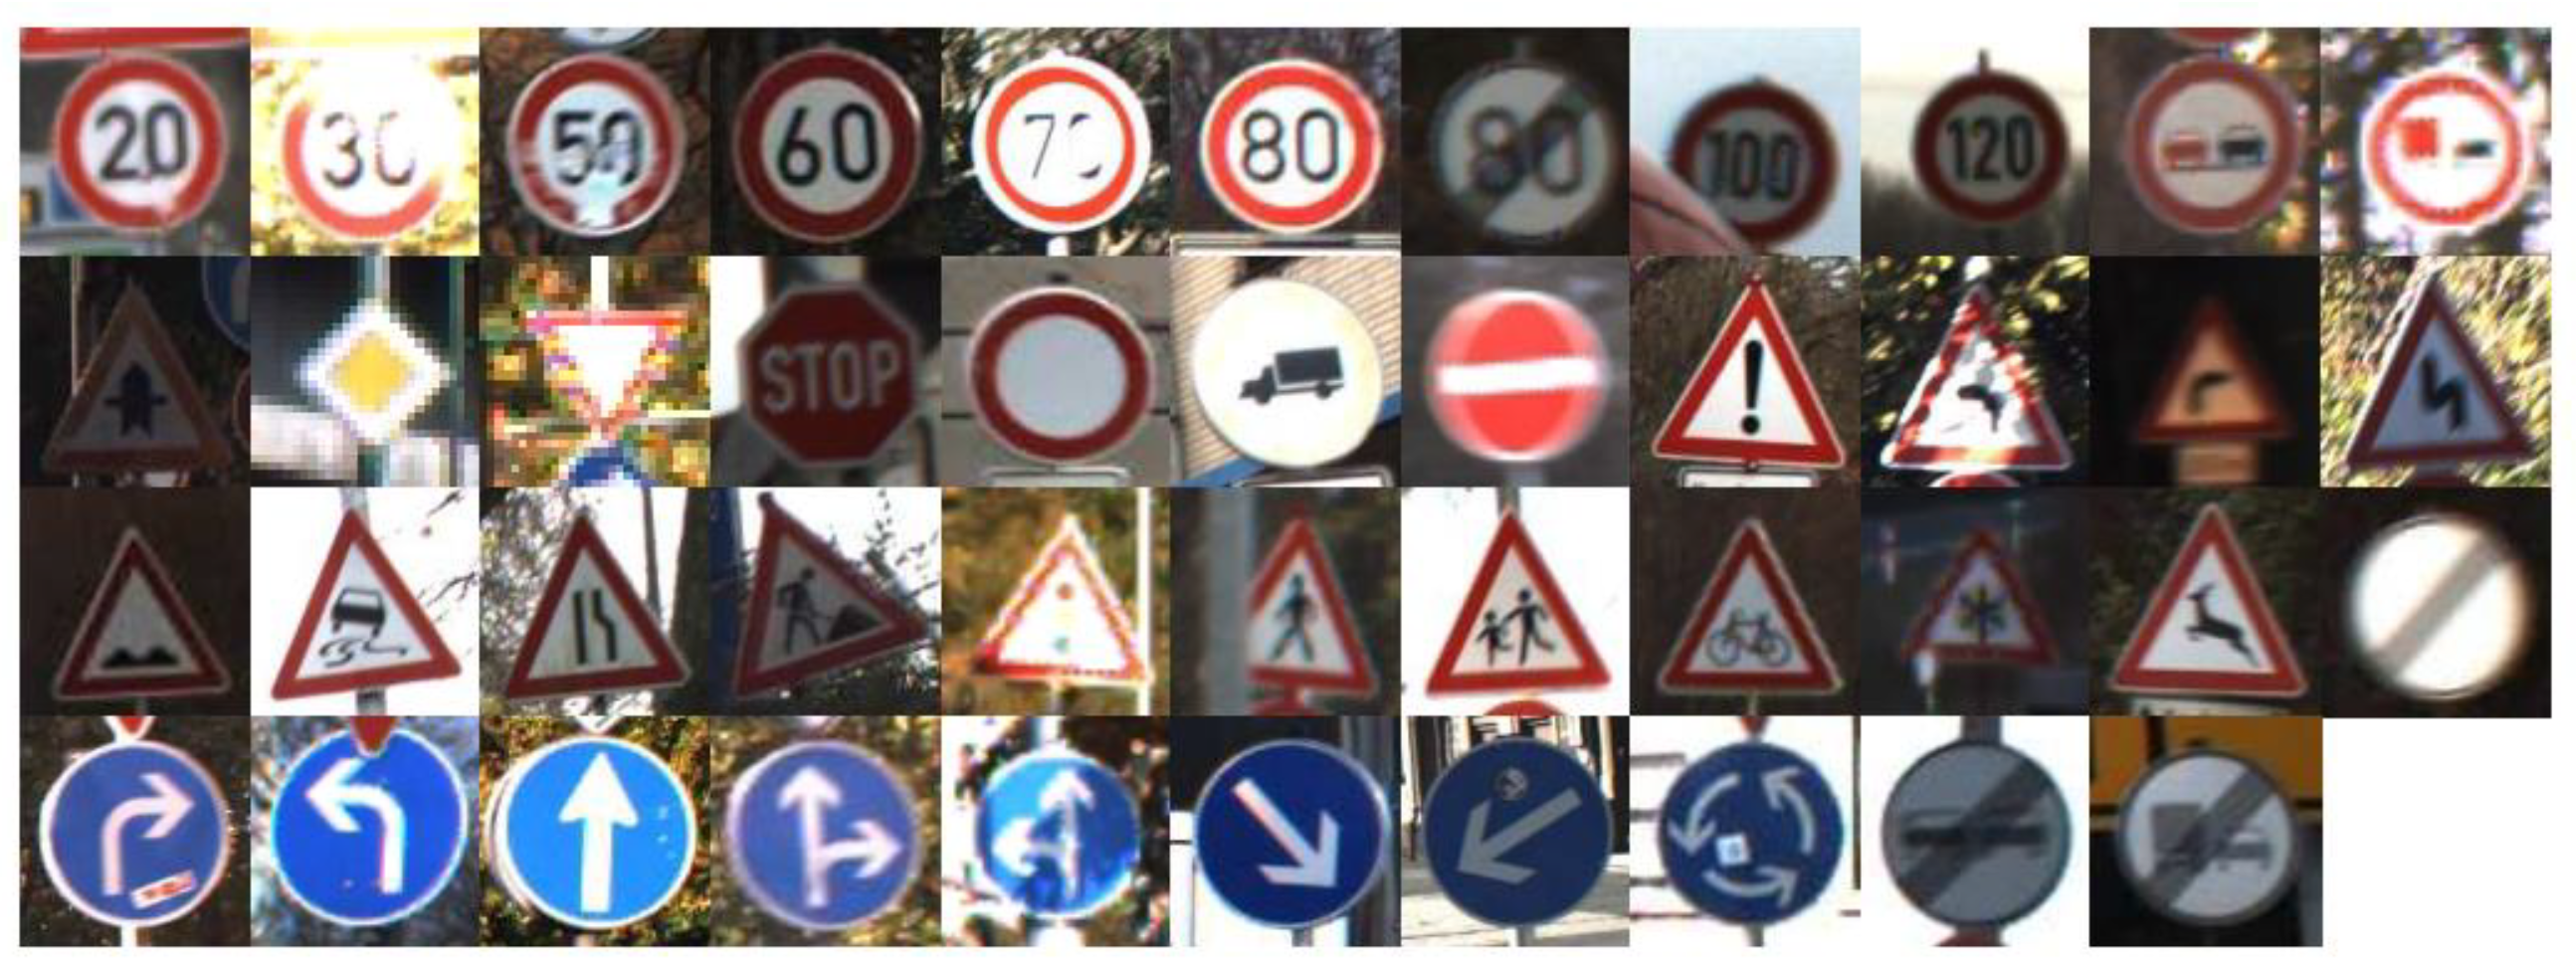
3.2.1. GTSRB Dataset

The GTSRB dataset was collected by the Institute of Neural Information Processing (INI) at the University of Ulm in Germany [44].
The techno-economic parameters of this dataset can refer to various aspects related to it, such as:
  • Size: this dataset involves 43 road sign classes as described in Figure 7 [44], with 51,839 images (34,799, 4410, and 12,640 for training, validation, and testing, respectively) collected from real-world traffic scenes in Germany;
  • Image resolution: the images in the GTSRB dataset are of various resolutions, ranging from 15 × 15 pixels to 250 × 250 pixels;
  • Annotation: The dataset was annotated by human experts who manually labelled each image with the corresponding traffic sign class. The annotations include both the bounding box coordinates for the traffic sign and the corresponding class label and were performed using an online annotation tool specifically designed for the task of traffic sign recognition;
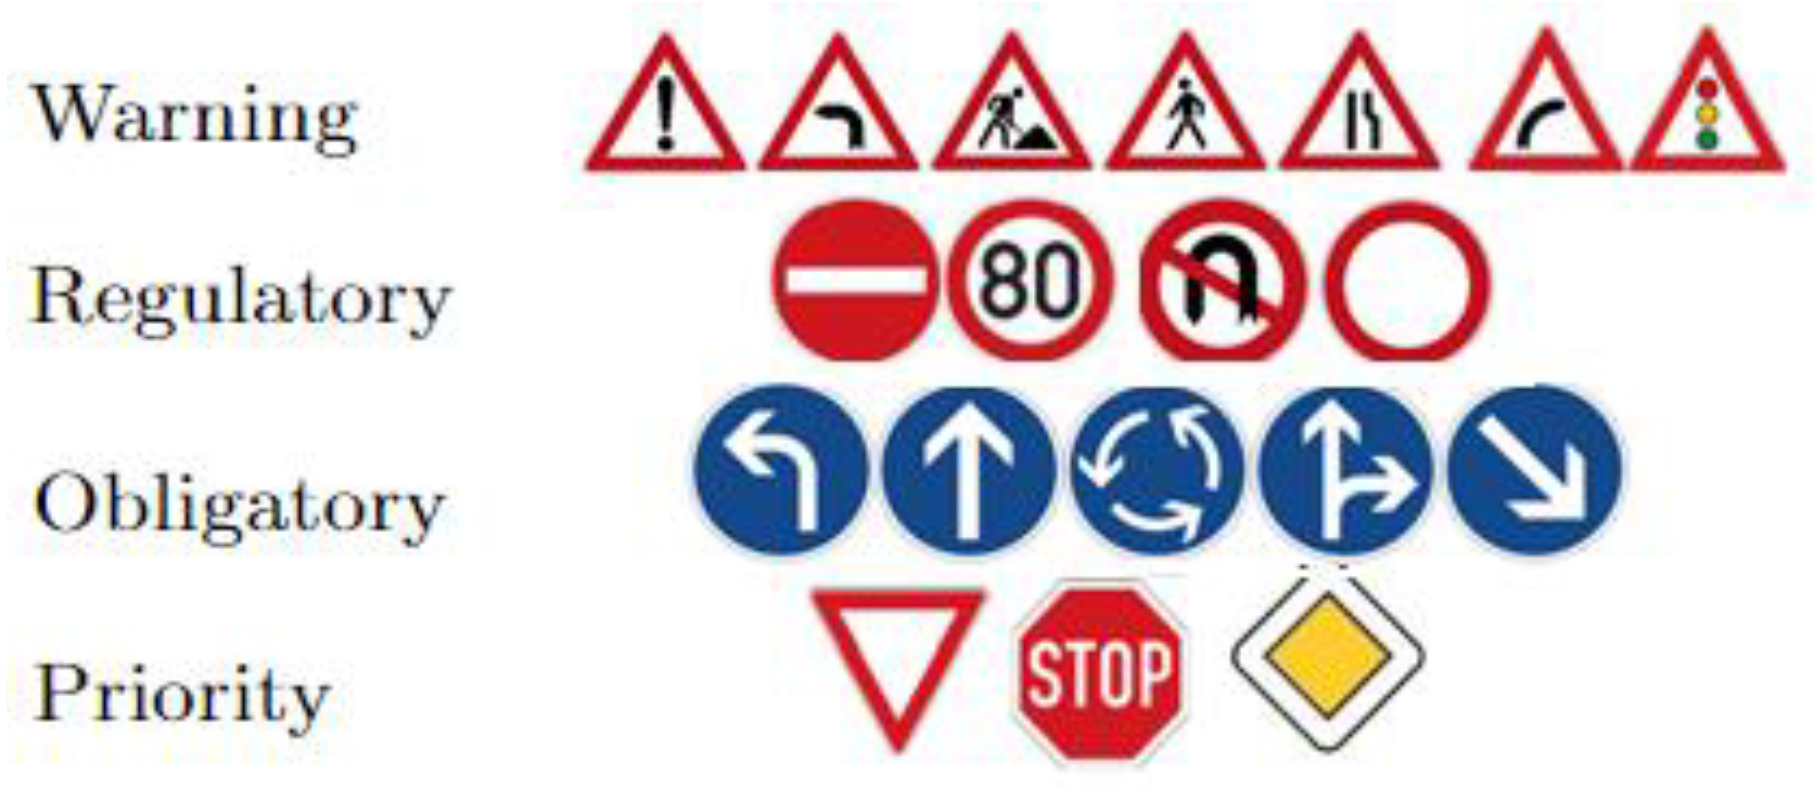
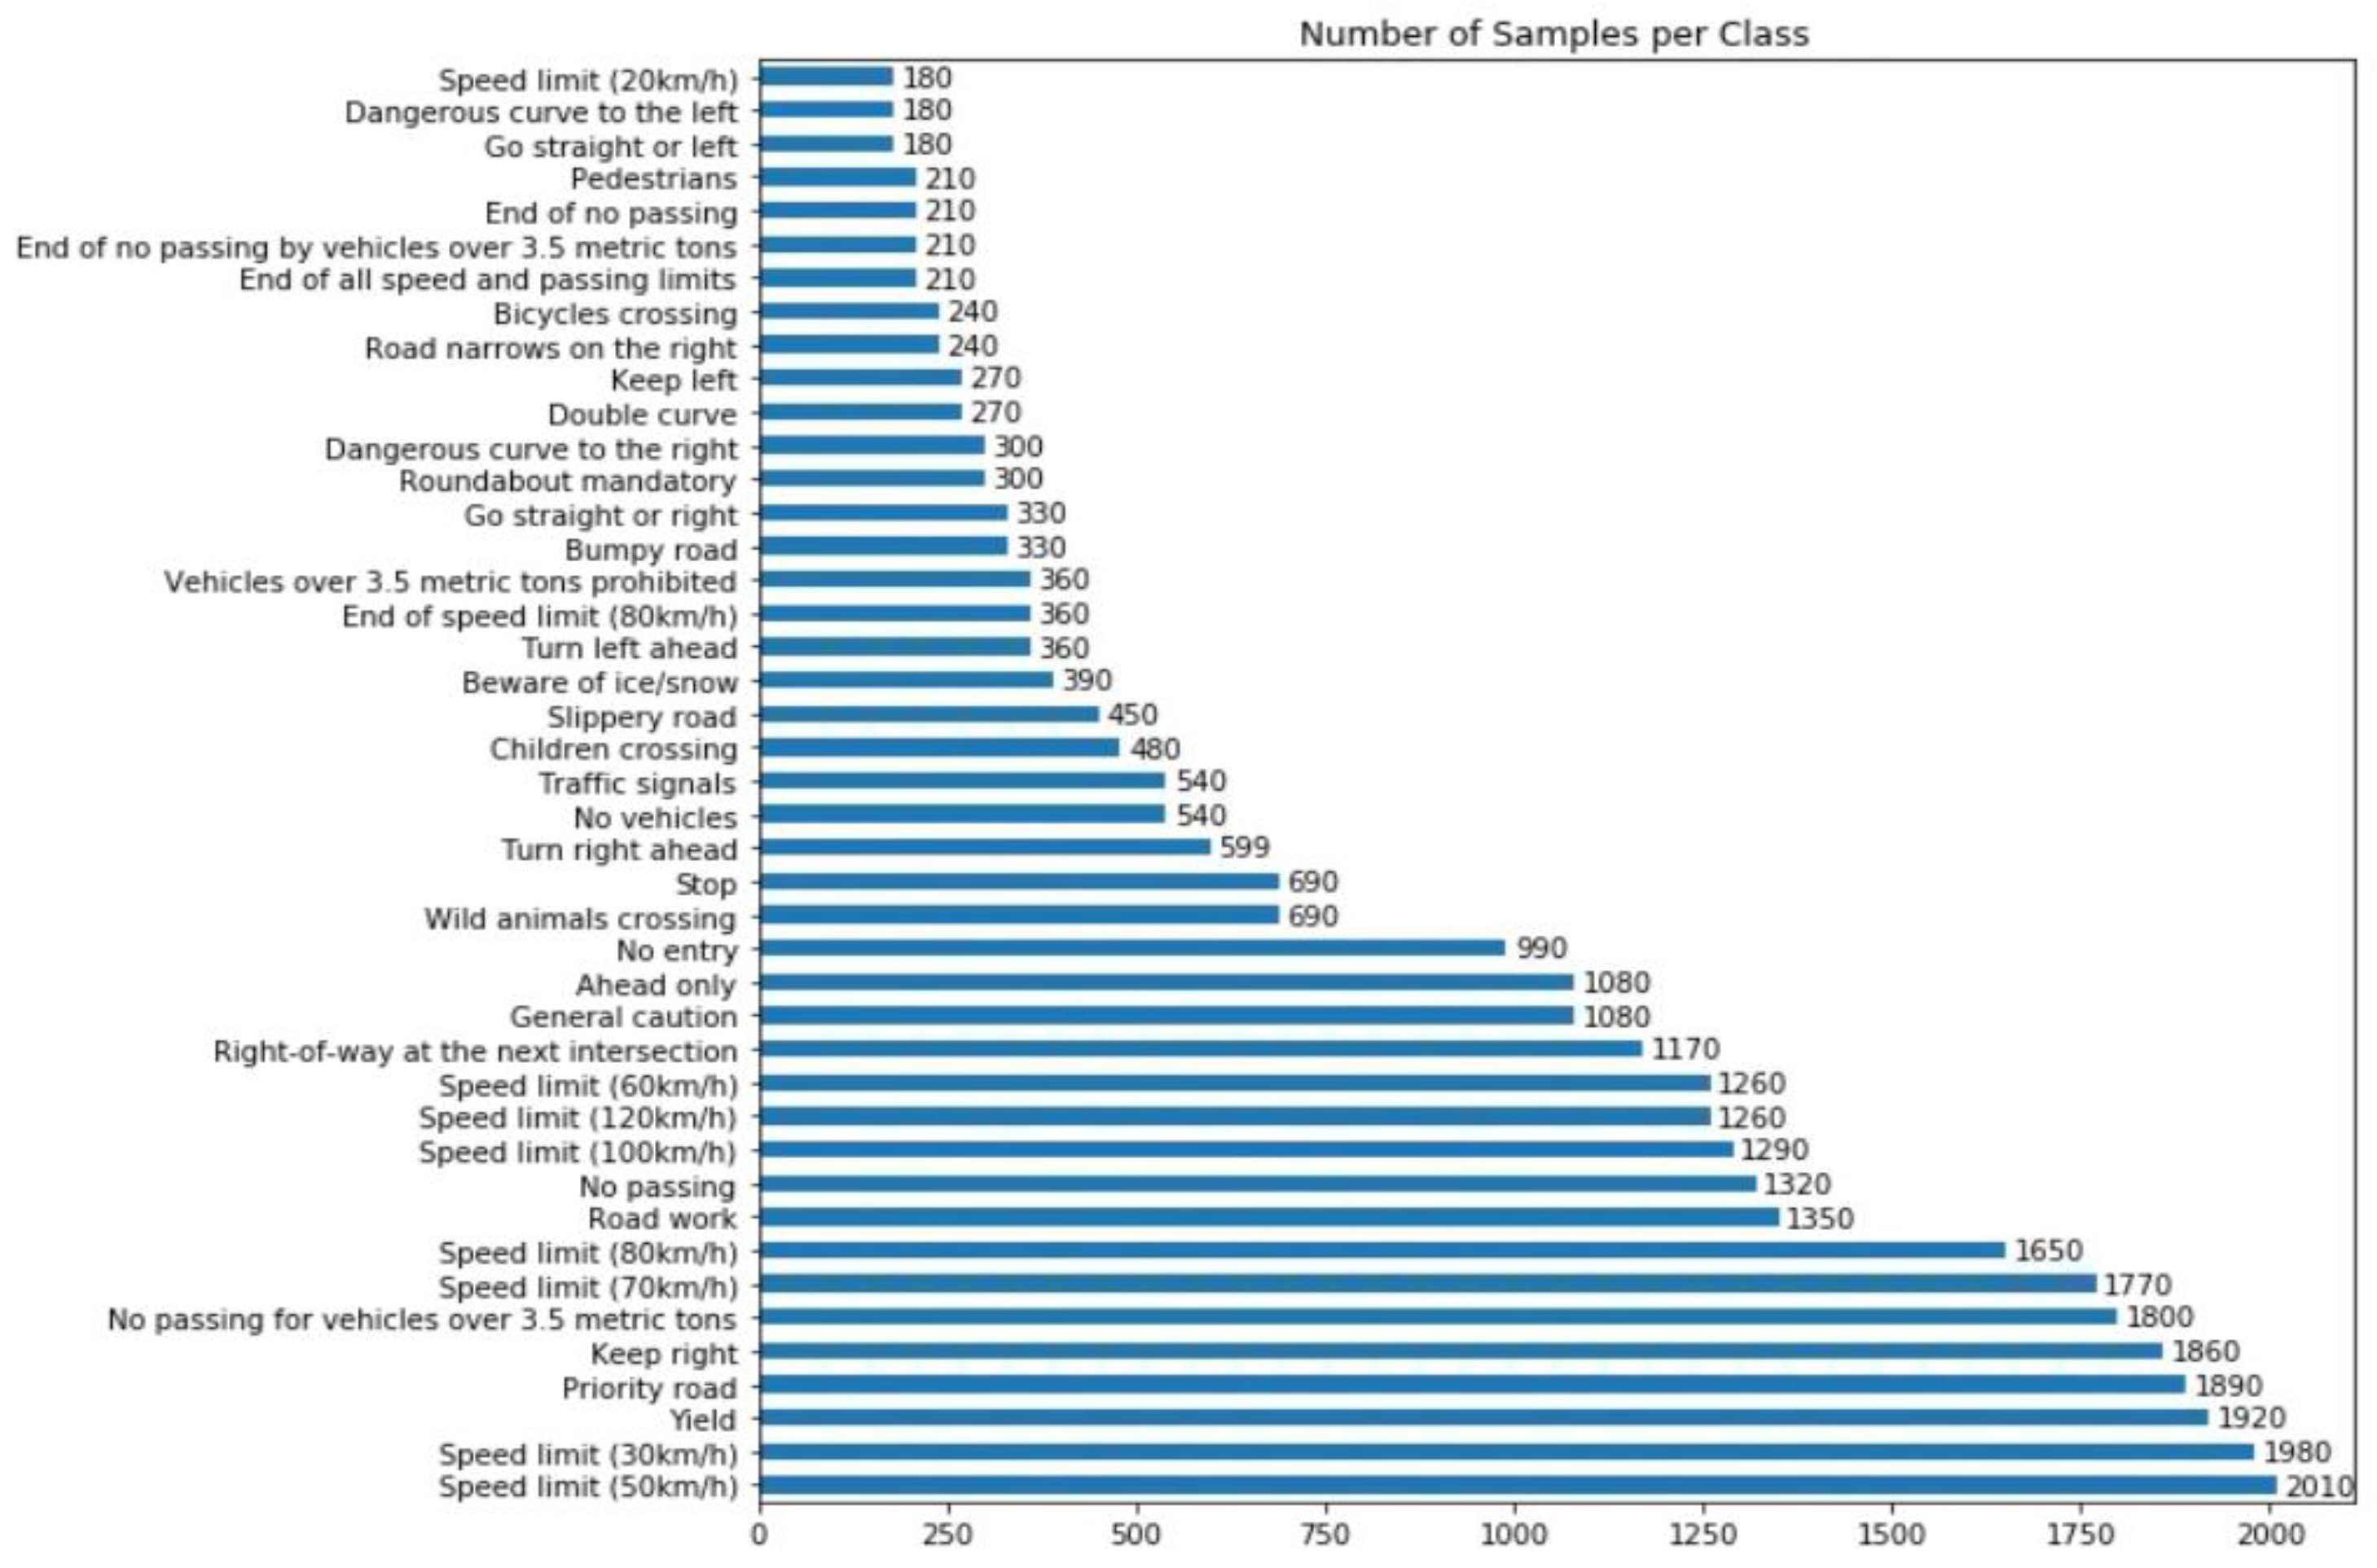
  • Diversity: It contains a diverse set of traffic signs, including speed limit signs, warning signs, and prohibition signs. Some traffic signs may be overrepresented or underrepresented in the dataset due to differences in their frequency in real-world traffic scenes. In fact, the distribution of the number of samples used to train the model per class shown in Figure 8 is not uniform. The largest classes have 10 times more traffic sign images than the smallest ones. This is normal since, in real life, some signs appear more frequently than others. To address this, the dataset includes a training-validation-test split that helps ensure that the models trained on the dataset are evaluated on a representative set of data;
  • Collection method: the GTSRB dataset was collected using a camera mounted on a vehicle and taken under different conditions (blur, lighting, etc.) to ensure a fair evaluation of model performance;
  • Availability: this dataset is freely available for academic and research purposes;
  • Usage: It is commonly used for evaluating the performance of various traffic sign recognition algorithms, including deep learning-based approaches. The dataset has been used in various competitions, challenges, and research projects related to traffic sign recognition [44]. The use of this dataset has led to the development of many state-of-the-art traffic sign recognition algorithms, which have potential applications in areas such as autonomous driving and road safety;
  • Complexity: the GTSRB dataset is considered challenging due to the large number of classes and the variation in the appearance of traffic signs due to lighting conditions, weather, and occlusion.

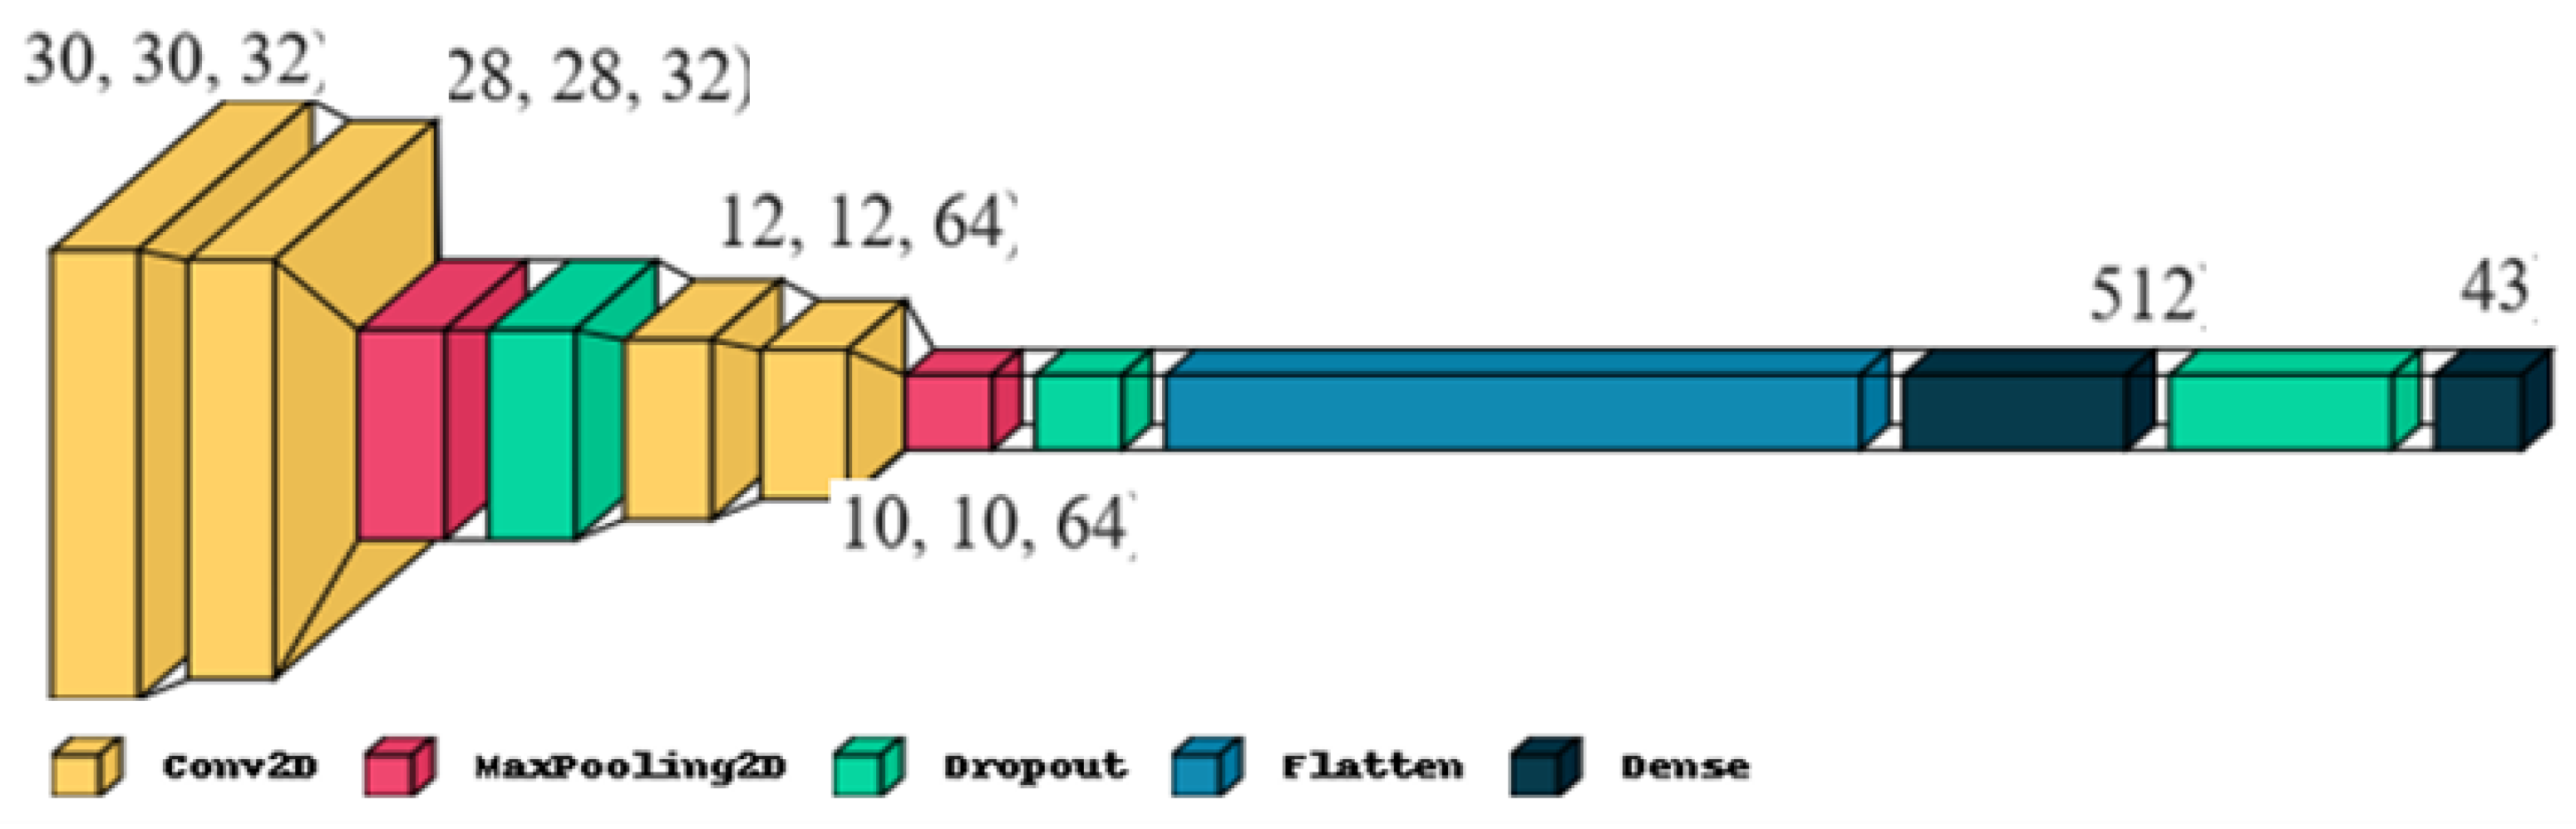
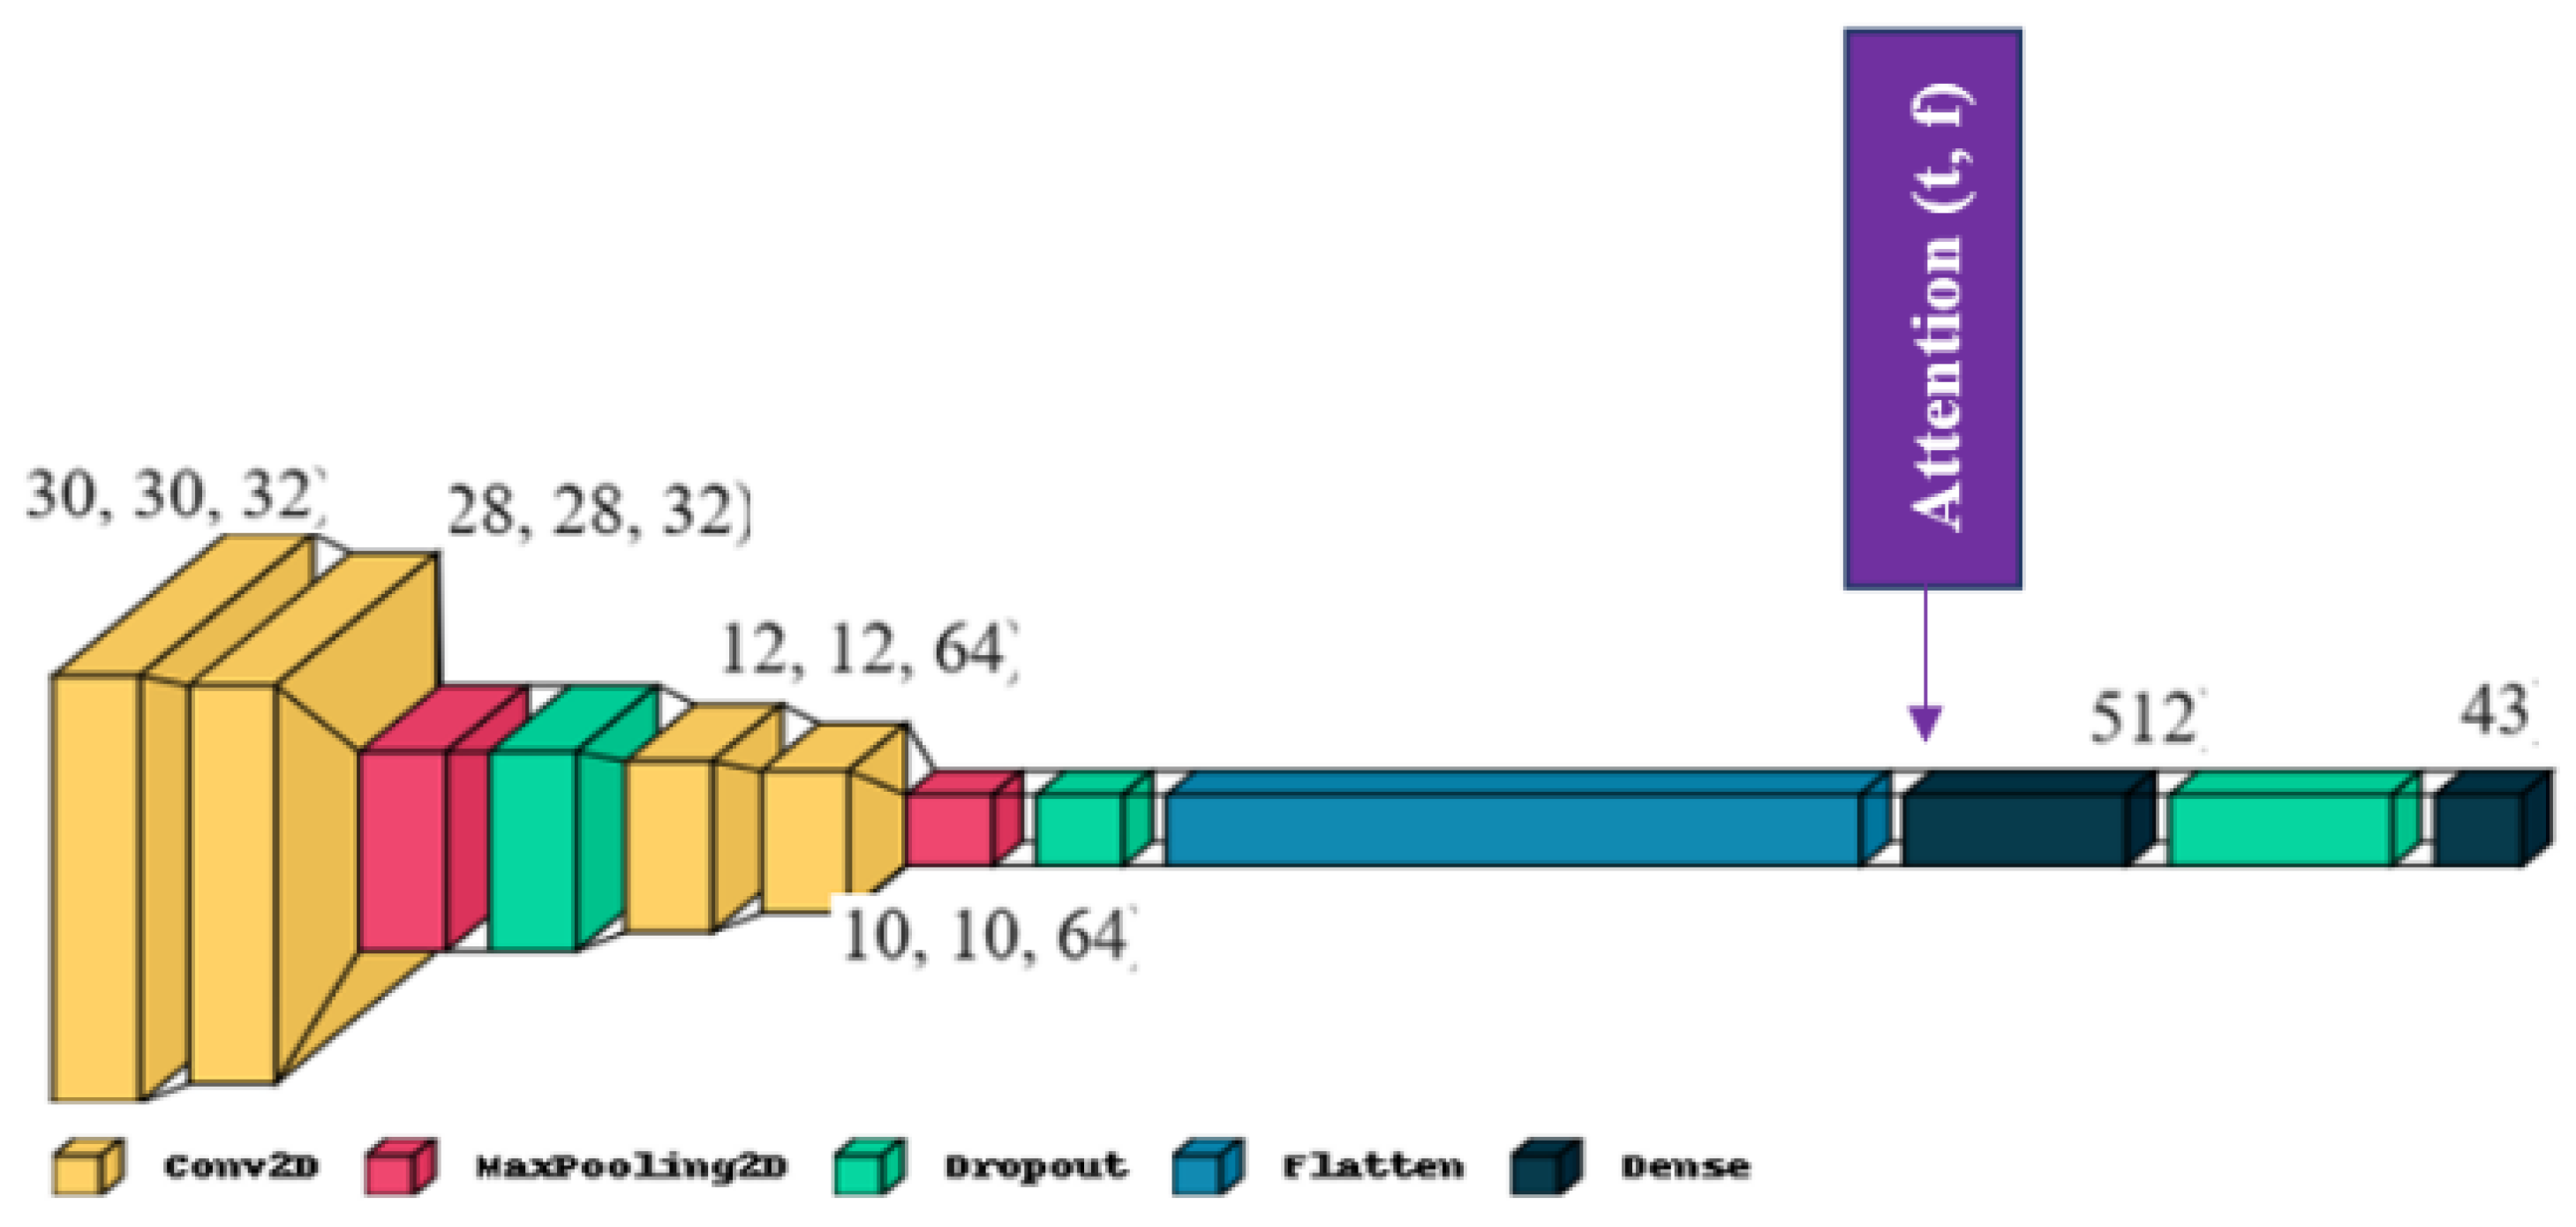
3.2.2. TSC Models and Architectures

Two distinct TSC architectures are built: one does not involve any attention mechanisms, while the other does. The developed CNN model without an attention mechanism consists of two sets of convolutional layers (two per set), followed by two fully connected layers, as shown in Figure 9. Max pooling was applied after each set of convolutional layers to avoid overfitting. The model uses a rectified linear activation function (ReLU) at each step. The last layer gives the SoftMax probabilities for each of the 43 road sign classes.
In addition, the process of finding the optimal parameters for traffic sign classification on the GTSRB dataset requires careful experimentation and testing. According to our research, some hyperparameters are fixed, like the learning rate (0.001), batch size (50), number of epochs (70), and the optimizer (Adam).
  • Attention mechanism
Attention mechanism is a technique that mimics natural cognitive attention. It has been applied to a very wide range of applications, such as speech recognition [45], machine translation [46], text summarisation [47], and image description [46]. The effect of this mechanism is to enhance some parts of the input data while decreasing the impact of other parts, focusing more on this small but important part of the data. This mechanism is characterised by its flexibility, which comes from its role as “soft weights” that can change during execution, unlike standard weights that must remain fixed at execution time, which helps to save processing resources when faced with complex data to analyse in an image.
In our case, the goal of the attention module is to learn which part of the image is most important to focus on. Inspired by the visual attention mechanism, a visual selective attention model is designed to simulate the visual perception process of human beings in order to model the distribution of human attention during the observation of images as well as videos and to extend its applications, which is indeed a considerable contribution to the improvement of traffic sign type image processing.
This was achieved by transposing the input and feeding it into a dense layer called a SoftMax, which estimates weight distributions that are then combined with the input sequence as shown in Figure 10 and the algorithm below (Algorithm 1):
Algorithm 1 Attention (timestamp, features)
Input: timestamp, features
Output: weighted output sequence
For each t ∈ timestamp, f ∈ features
  Input (t, f)
  Dense layer (t, f)
  Multiplication (Input (t, f), Dense layer (t, f))
End For
Google colaboratory was used for training and testing the two developed models on the GTSRB dataset. This cloud service provides nearly 12 GB of RAM, which can be extended to 25 GB with GPU support. The CNN models are implemented using Keras (version 2.8.0) and TensorFlow (version 2.8.0) as a backend. The number of images used in the training step is increased by using the data augmentation process, which generates images with various sets of disturbances like rotation, shift, shear, and zoom to improve performance and the ability of the model to generalise, but it does not resolve the problem of the unbalanced dataset. Images are then resized to 32 * 32 with one channel so that they can be fed to the TSC model.
The TSC_M is trained for 30, 70, and 100 epochs and the TSC_MA for 30 and 70 epochs on the GTSRB dataset. Then we test and evaluate them on a variety of testing sets using the Adam optimizer with a minibatch size of 50 and a learning rate of 0.001. There are a total of 906,763 parameters that are all formable;
2.
Classification metrics
The possible values to get in a classification problem can be defined as follows:
  • True positives (TP): the number of positive instances that were classified as positive;
  • True negatives (TN): the number of negative instances that were classified as negative;
  • False positives (FP): the number of negative instances that were classified as positive;
  • False negatives (FN): the number of positive instances that were classified as negative;
  • The used metrics are accuracy, precision, recall, and F1;
  • Accuracy, used to evaluate the classification model, is the ration of the number of correct predictions to the total number of predictions:
Accuracy = TP   +   TN TP + FP + TN + FN   ;
  • Precision, often referred to as positive predictive value, is the ratio of correctly classified positive instances to the total number of instances classified as positive:
Precision = TP TP   +   FP ;
  • Recall, also called sensitivity or true positive rate, is the ratio of correctly classified positive instances to the total number of positive instances:
Recall = TP TP   +   FP ;
  • F1 combines precision and recall as a single value:
F 1 = Precision     Recall Precision +   Recall   .
In our work, 43 classes have unbalanced distributions in the dataset. For this, in addition to the accuracy metric, the weighted averaged (precision, recall, and F1) score is used to improve the lowest scores. The weighted average is calculated by taking the mean of all per-class (precision, recall, and F1) scores while considering each class’s support (support refers to the number of actual testing occurrences of the class in the dataset);
3.
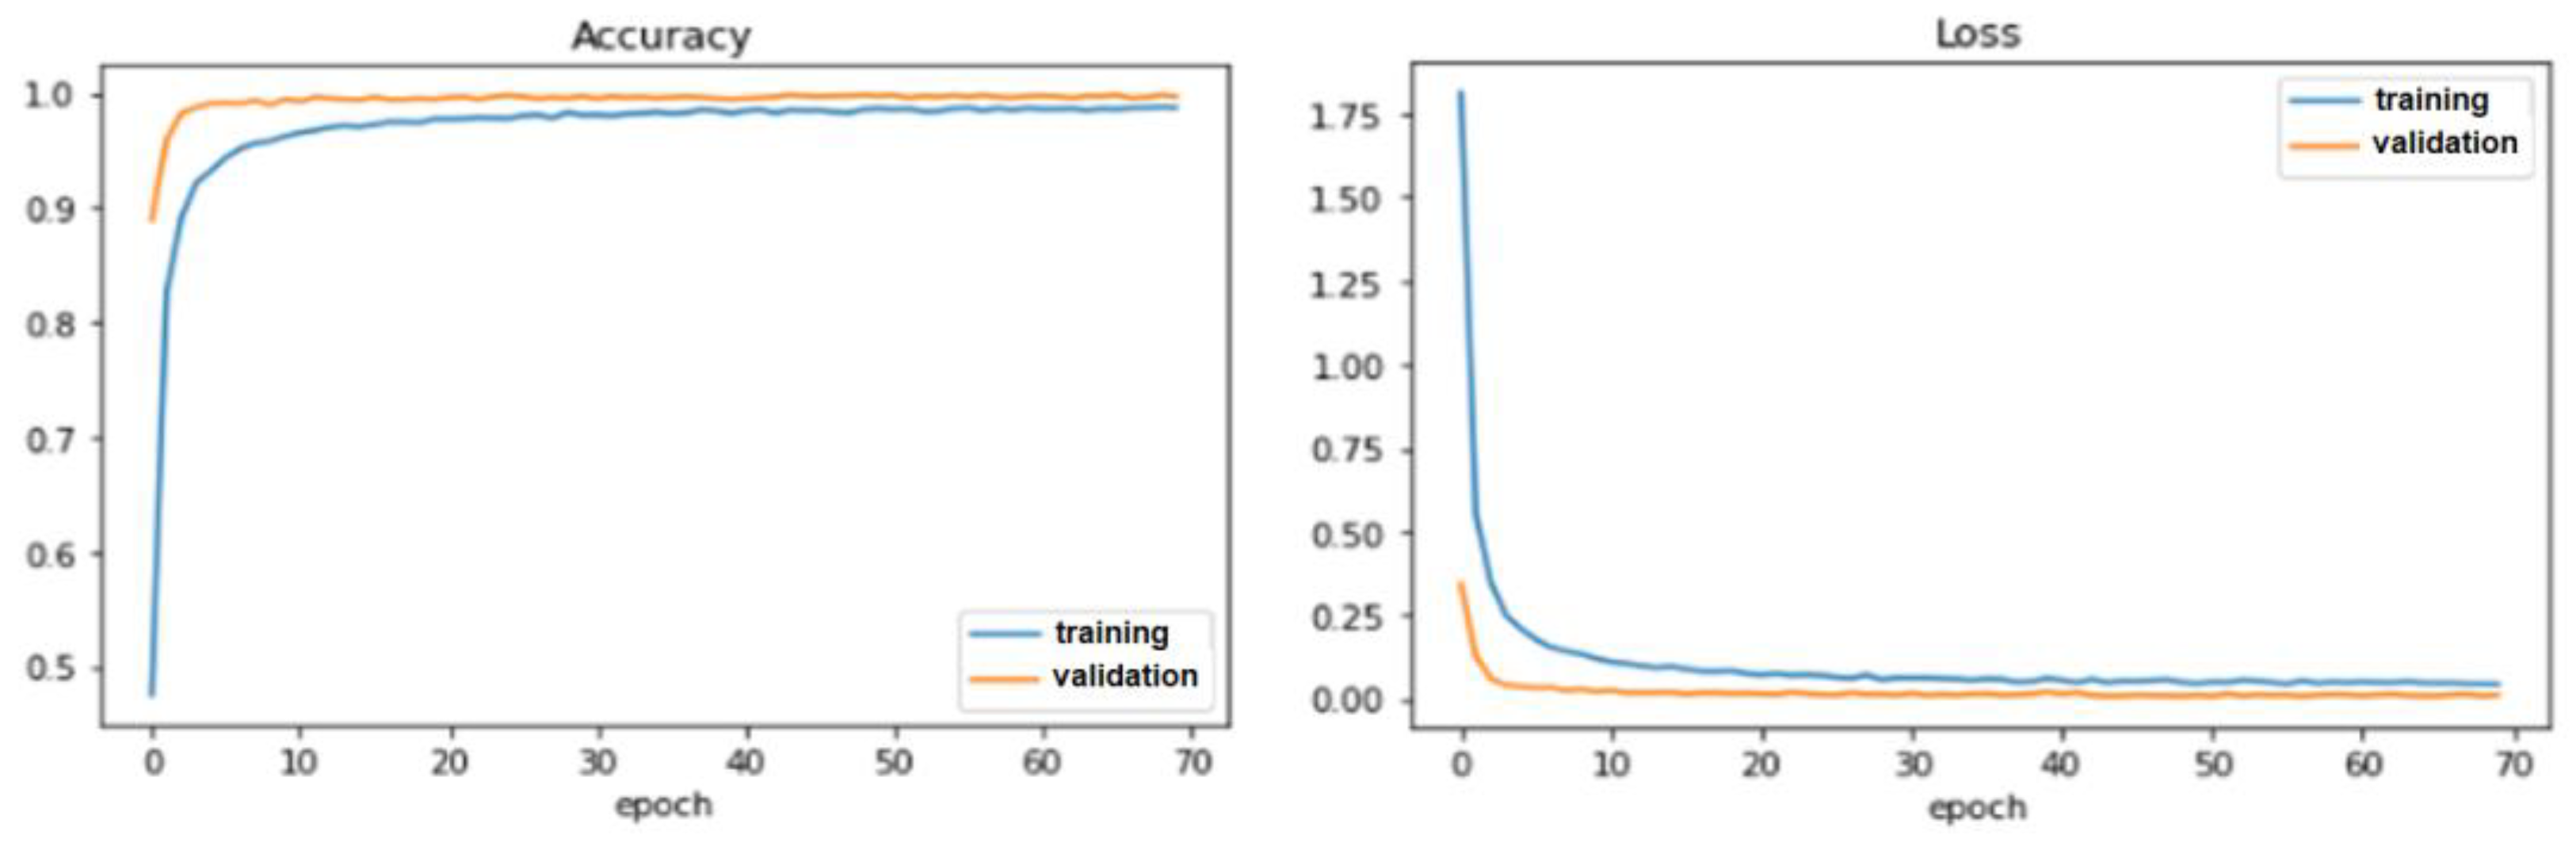
Obtained results using the TSC model without the attention mechanism (TSC_M)
The TSC_M is tested on 12,630 images from the GTSRB dataset. Table 7 shows that after training the model for 70 epochs, 99.97% of training accuracy is achieved with a reduced loss of 0.00098. The achieved validation accuracy is 99.68% with a reduced loss of 0.0105. The testing accuracy reaches 98.56%, which is considered an interesting result compared to other small-scale models like the LeNet-5 model, which achieved 90%, and 97.71% for the small-scale CNN model developed by [48].
Moreover, accuracy and loss curves shown in Figure 11 confirm further the efficiency of our developed deep learning CNN model.
Referring to Table 8, the deep learning CNN algorithm achieves a weighted average of 98%, which is better than the 97% obtained by the authors in [49].
The F1 score result is 100% when predicting ten classes, 99% for fourteen classes, 98% for seven classes, 97% for four classes, 96% for three classes, and 95% for five classes.
Despite these good results, the test accuracy can be further improved by applying attention mechanisms in the developed neural network;
4.
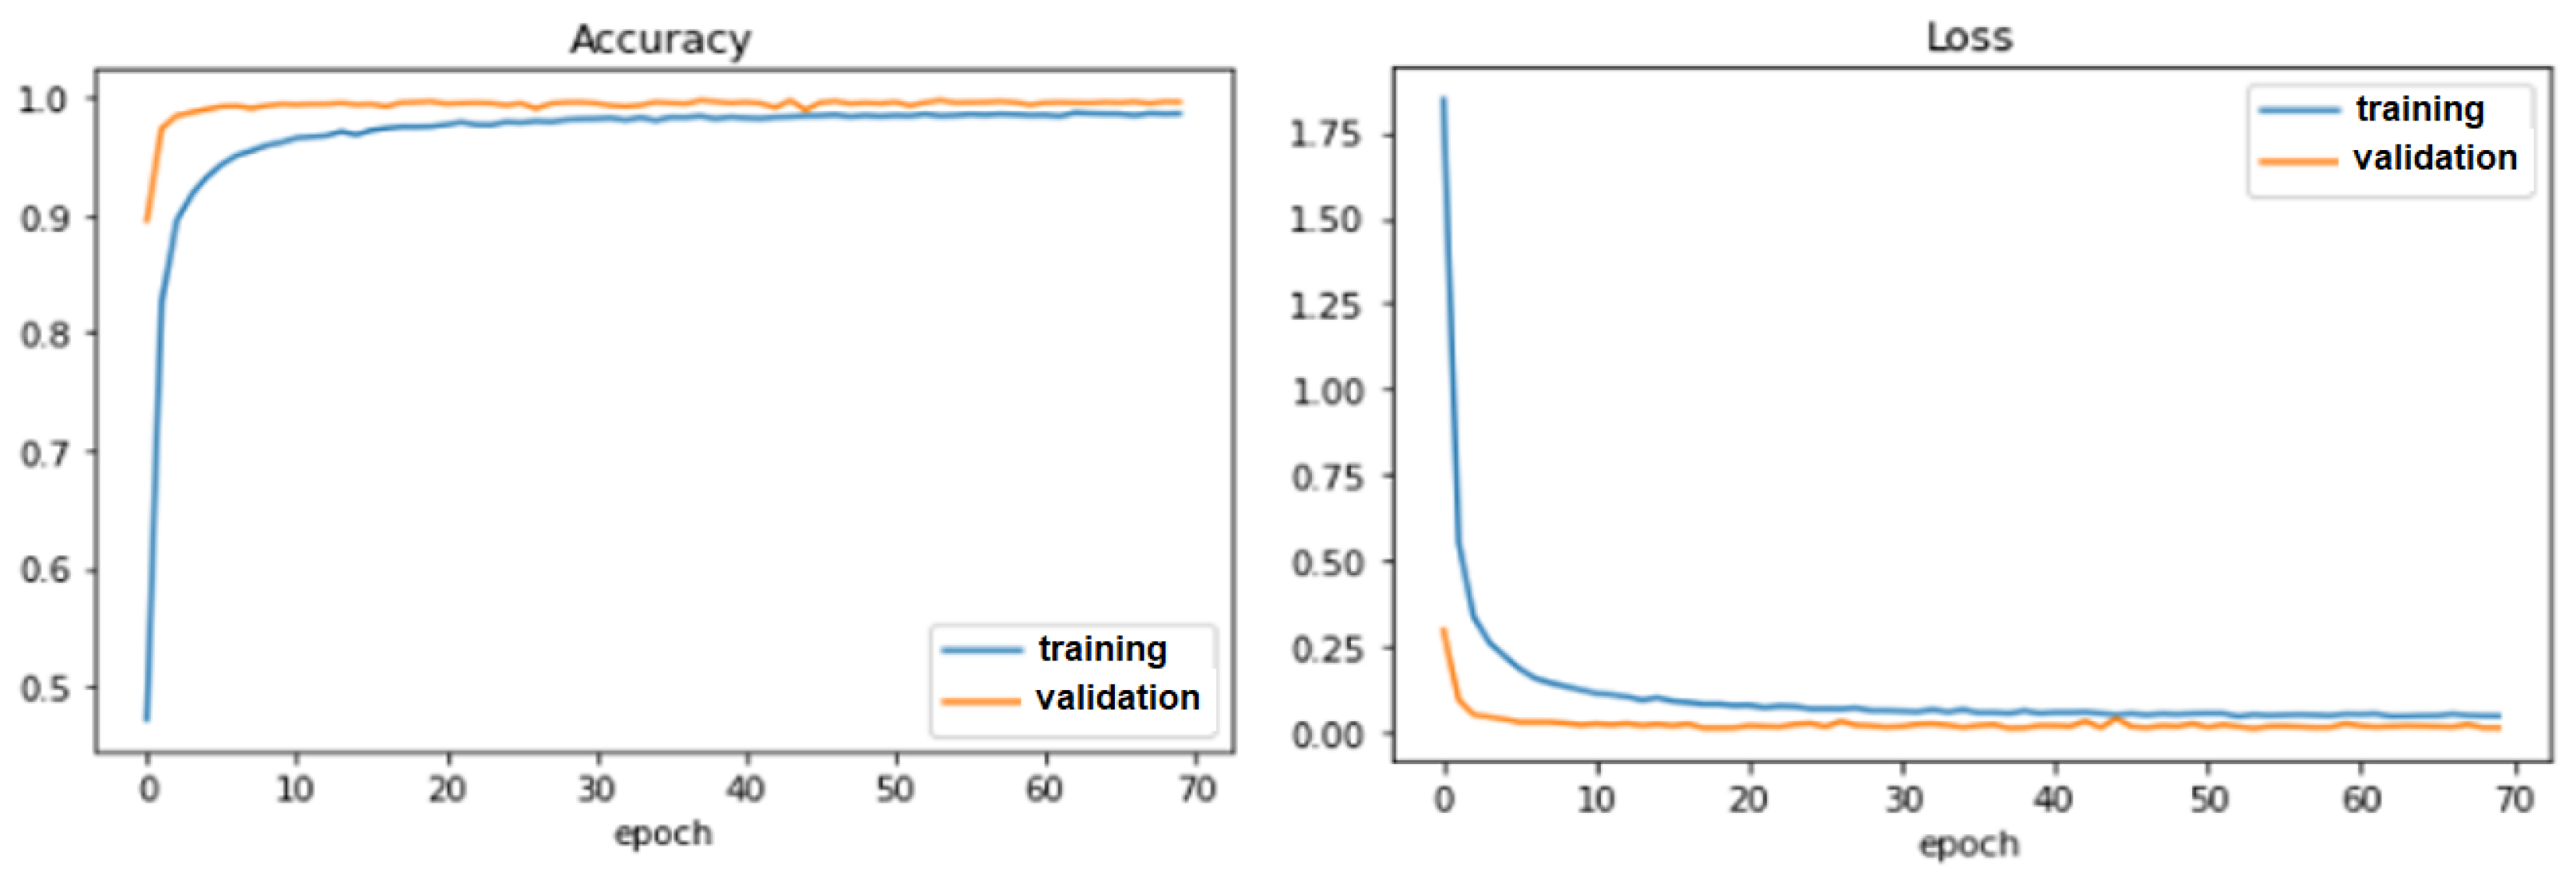
Obtained results using the TSC model with attention mechanism (TSC_MA)
The TSR attention CNN model is trained for 30 and 70 epochs (Ep). The achieved results are summarised in Table 9. In fact, testing accuracy reaches 99.91% with a reduced loss of 0.062, which is considered an interesting accuracy rate compared to the previously achieved testing accuracy.
The curves in Figure 12 describe a good fit of the model. In fact, a good fit is identified by a training and validation loss that decreases to a point of stability and a training and validation accuracy that increases until stability.
The application of the TSC_MA achieves a weighted average of 99%, as shown in Table 10. This score is more significant than that found in previous research.
It is commonly observed that incorporating an attention mechanism into the TSC model can improve its performance compared to one without one.
In addition, the five-fold cross-validation technique is also performed on the GTSRB dataset in order to further evaluate our TSC_MA.
In fact, the dataset is divided into five subsets, where each subset is used once as the testing set and the remaining four subsets are combined to form the training set. This process is repeated five times, with each subset being used as the testing set once, and the average performance across all iterations is calculated. In each iteration, we can compute various performance measures, such as accuracy and AUC.
Based on lists of accuracies and AUCs obtained by the application of five-fold cross-validation, it appears that the model being evaluated is performing very well, with consistently high accuracies and AUCs across multiple trials. In fact, the mean accuracy of the model is 0.994 with a standard deviation of 0.001. This means that the model can correctly predict the class of 99.4% of the samples on average. Additionally, the mean AUC (area under the ROC curve) of the model is 0.999 with a standard deviation of 0.000. An AUC of 0.999 means that the model has a perfect ability to distinguish between the positive and negative classes, which is a very good performance.
Overall, the TSC_MA model is highly accurate and consistently performs well across multiple trials. The mean accuracy and AUC are very high, with negligible standard deviation, indicating a very reliable and robust model.
The confusion matrix is also a valuable tool used for evaluating the performance of the TSC_MA algorithm. In fact, a confusion matrix for 43 classes would be a 43 × 43 matrix that shows the number of correctly and incorrectly classified instances for each class, as shown in Figure 13.
Various evaluation metrics can be calculated using the values in the confusion matrix, such as accuracy, precision, recall, F1-score, etc. In fact, we counted the number of classes with the same F1 score together, and the obtained results were: 100% for fourteen classes, 99% for sixteen classes, 98% for twelve classes, and 97% for one class;
5.
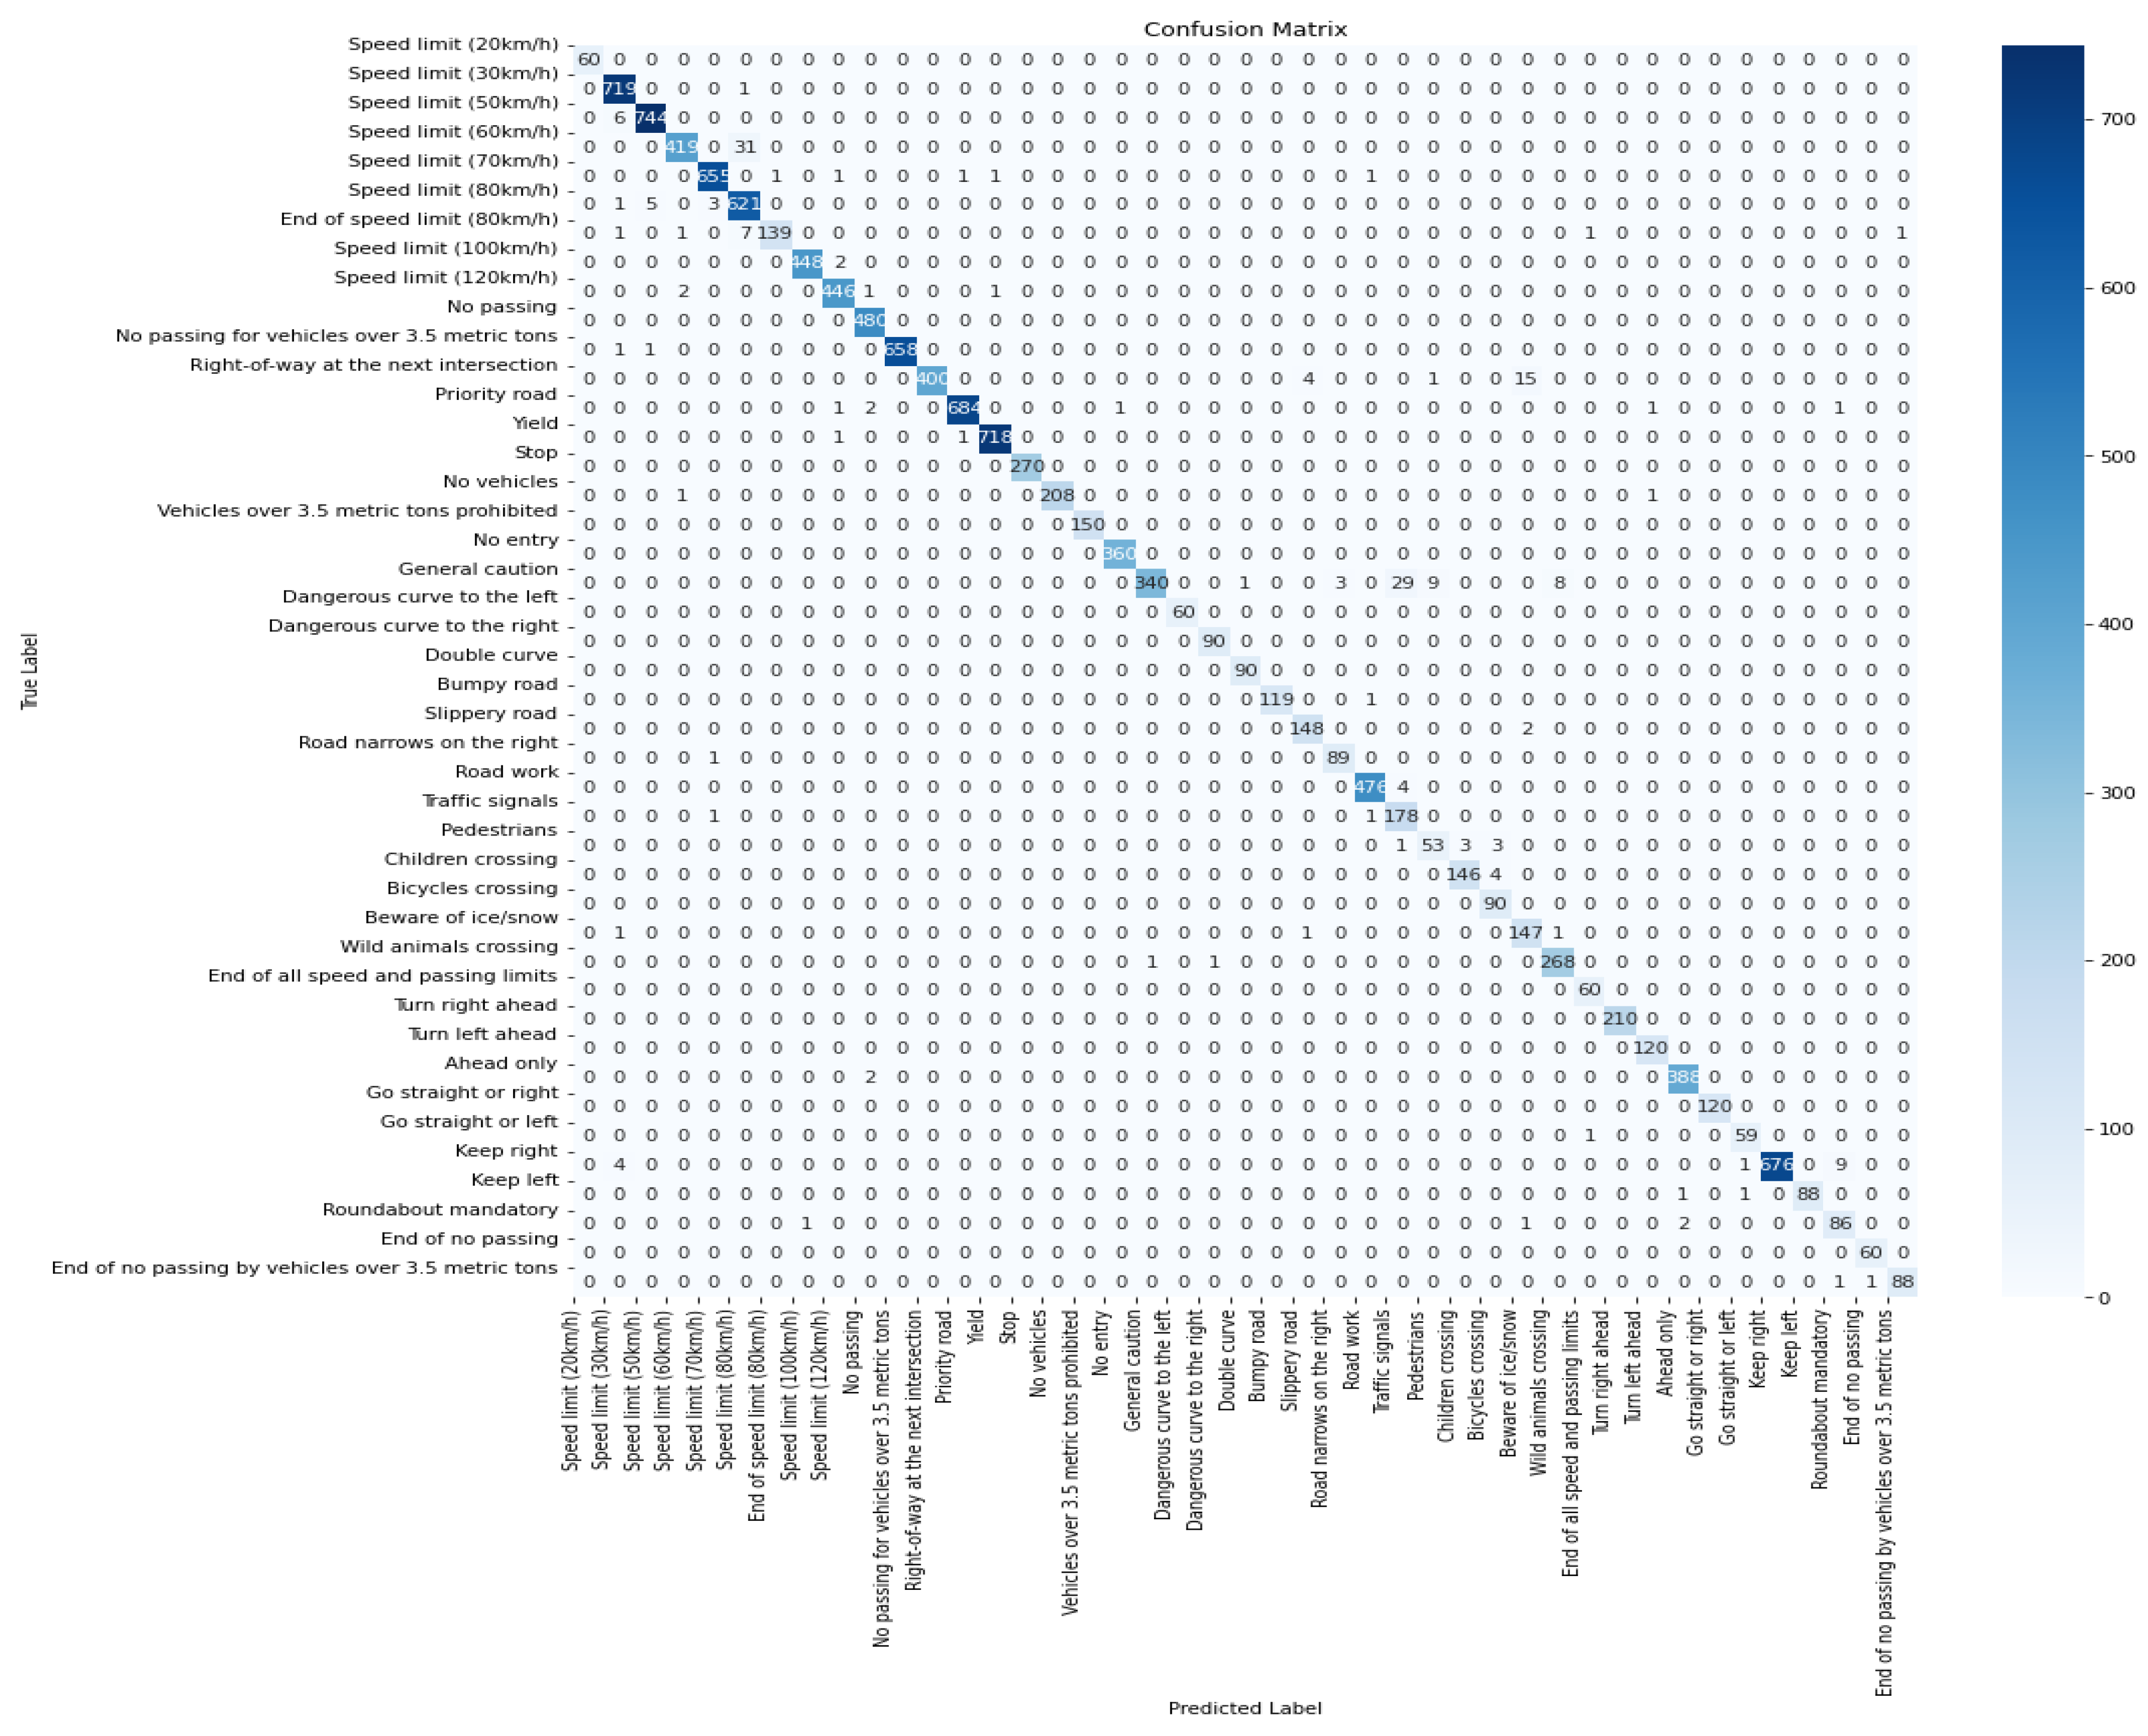
Classification step’s performance evaluation
In order to validate the robustness of our proposed model, the TSC_MA is trained, validated, and tested on the BTSCB, which comprises more than 7000 traffic sign images of 62 different classes. It gives an image of a road scene that is close to real-time weather conditions and is influenced by the cluttered environment that enables the system to afford an adequate result in real-time. In fact, the TSC_MA was trained for 70 epochs.
Training, validation, and testing accuracy rates reach, respectively, 99.35%, 99.31%, and 99.27%. These results, as shown in Table 11, are considered interesting in addition to those found previously with the GTSRB dataset, which confirms the robustness of our developed TSR system.
In order to test and validate the results obtained by the developed TSR solution, an implementation step is performed on a PC and on a Raspberry Pi 4. These two steps allow us to evaluate and validate the approach proposed in this paper.

4. Experimental Results and Discussion

We first tested our TSR system on a PC with the following configuration: Intel® Core (TM) i57200 CPU, 64 bits; 8 GB of RAM. Then, a second test is carried out on a Raspberry Pi 4 board Model B equipped with a 1.5 GHz ARM Cortex-A72 quad-core processor, 64 bits of CPU, and 8 GB of RAM.

4.1. ARM Experimentation

In order to evaluate our TSR system, we used a video sequence describing a road scene that lasted approximately 2 min. Figure 14 shows examples of recognised road sign images (bumpy road, general caution, speed limit (50 km/h)). The achieved processing time was calculated from the detection moment of the sign to its classification. During this short span, the system spends an average of 0.08 s to correctly identify each detected traffic sign.
Obtained recognition processing time is not as efficient as expected, and this is due to hardware performance when loading the video sequence in the programming console. For this reason, we test our TSR system in real time using the laptop webcam.
Figure 15 shows that our TSR system can correctly recognise each sign (32 signs) in an average of 0.06 s.

4.2. Raspberry Pi Experimentation

The Raspberry Pi is a popular platform for implementing traffic sign recognition systems due to its low cost, compact size, and ability to interface with various sensors and cameras. The use of Raspberry Pi in traffic sign recognition systems involves implementing computer vision, machine learning, and deep learning algorithms on the platform. It can be easily integrated into vehicles or installed on roadside cameras to provide real-time information to drivers and traffic control systems. However, the performance of Raspberry Pi-based systems can be limited by the computational power of the system.
Some works on TSR systems have been the subject of experimentation on the Raspberry Pi board. In fact, the authors in [50] study the effect of shading on the road sign recognition system running on the Raspberry Pi, but the performance of the system is not clearly stated. Concerning [51], the authors develop a robotic traffic sign detection and recognition system using an edge detection algorithm running on a Raspberry Pi to detect traffic signs. However, the performance of the developed system is not evaluated in a real-world environment that could have a significant impact, such as light reflection on the captured traffic sign image. In addition, the authors of [52] develop a traffic sign recognition system using a Raspberry Pi, focusing only on speed signs and taking into account the stability of colour detection as a function of daylight. The results show that the system has an accuracy of 80% and a processing time of up to 2 s.
According to [53], a real-time traffic sign detection and recognition system using the Raspberry Pi 3 is implemented using machine learning algorithms to identify the type of traffic sign and send alerts to the driver, considering five different classes of traffic signs. The results show that the average accuracy of detection and identification of traffic sign images of the five traffic sign classes is above 90%, and the maximum average time to determine the type of traffic sign in the system is 3.44 s when the car is driving at 50 km/h.
In this work, the proposed TSR system outperforms the cited approaches in terms of accuracy, with a score of 99%, which means that it correctly identifies a large majority of traffic signs. In terms of execution time, the proposed TSR system is the fastest one, with an average of 0.15 s. This makes it a practical solution for real-time traffic sign recognition applications.

5. Conclusions

The continuous evolution of automated safety technologies aims to deliver Advanced Driver Assistance Systems (ADAS) and Automated Driving Systems (ADS), which can handle all the driving tasks and help to save lives and prevent injuries by avoiding dangerous situations that may lead to an accident. An important component of ADAS and ADS is the TSR system, which consists of automatically recognising road signs in real time with good performance. The TSR system requires a very high recognition rate, and its operation does not tolerate that a road sign is misrecognised or not recognised at all.
For this reason, this paper proposes a system that guarantees the set objectives in terms of accuracy and time processing. The proposed methodology consists of building a new TSR system based on the Haar cascade detector and a deep learning model classifier. The developed TSC model is trained on the GTSRB dataset and then tested on various road signs. The achieved testing accuracy rate reaches 98.56%. In order to improve the classification performance, we incorporated an attention mechanism into our deep learning model, which enabled us to achieve a 99.91% testing accuracy rate. The system is experimented with and evaluated in different ways (video sequence, real-time camera, and real-time embedded camera).
The obtained results show good performances. In fact, our approach allowed us to achieve 0.06 s and 0.15 s as processing times and full road sign recognition during the testing stage on a CPU and a Raspberry Pi board, respectively.
Given the hardware and software diversity and the multitude of road sign datasets, we are planning to extend our work to recognise different types of road sign categories related to other countries using a transfer learning mechanism. Additionally, we would like to implement an embedded system with different hardware architectures, such as FPGA and Nano Jetson (from Nvidia) boards, and compare their results in real-world car tests.
In addition, we envisage using ensemble learning, which is considered a powerful technique, to improve the overall performance of the developed TSR system. Finally, we are considering collaborating with local car manufacturers in order to valorise our work.

Author Contributions

Conceptualisation, N.T., M.K. (Mohamed Ksantini), and M.K. (Mohamed Karray); theory development and computational experimentation, N.T. and M.K. (Mohamed Ksantini); verification of analytical methods, N.T. and M.K. (Mohamed Karray). All authors have read and agreed to the published version of the manuscript.

Funding

This research received no external funding.

Data Availability Statement

The GTSRB dataset is a public dataset used during the study and is available at the following link: https://www.kaggle.com/datasets/meowmeowmeowmeowmeow/gtsrb-german-traffic-sign.

Conflicts of Interest

The authors declare no conflict of interest.

References

  1. Wintersberger, P.; Riener, A. Trust in Technology as a Safety Aspect in Highly Automated Driving. i-com 2016, 15, 297–310. [Google Scholar] [CrossRef]
  2. Youssef, A.; Albani, D.; Nardi, D.; Bloisi, D.D. Fast Traffic Sign Recognition Using Color Segmentation and Deep Convolutional Networks. In Advanced Concepts for Intelligent Vision Systems; Blanc-Talon, J., Distante, C., Philips, W., Popescu, D., Scheunders, P., Eds.; Lecture Notes in Computer Science; Springer International Publishing: Cham, Switzerland, 2016; Volume 10016, pp. 205–216. ISBN 978-3-319-48679-6. [Google Scholar]
  3. Wali, S.B.; Hannan, M.A.; Hussain, A.; Samad, S.A. Comparative Survey on Traffic Sign Detection and Recognition: A Review. Prz. Elektrotechniczny 2015, 91, 38–42. [Google Scholar] [CrossRef] [Green Version]
  4. Saadna, Y.; Behloul, A. An Overview of Traffic Sign Detection and Classification Methods. Int. J. Multimed. Inf. Retr. 2017, 6, 193–210. [Google Scholar] [CrossRef]
  5. Ali, N.M.; Rashid, N.A.M.M.; Mustafah, Y.M. Performance Comparison between RGB and HSV Color Segmentations for Road Signs Detection. In Applied Mechanics and Materials; Trans Tech Publications Ltd.: Stafa-Zurich, Switzerland, 2013. [Google Scholar] [CrossRef]
  6. Rajendran, S.P.; Shine, L.; Pradeep, R.; Vijayaraghavan, S. Real-Time Traffic Sign Recognition Using YOLOv3 Based Detector. In Proceedings of the 2019 10th International Conference on Computing, Communication and Networking Technologies (ICCCNT), Kanpur, India, 6–8 July 2019; pp. 1–7. [Google Scholar]
  7. Li, C.; Yang, C. The Research on Traffic Sign Recognition Based on Deep Learning. In Proceedings of the 2016 16th International Symposium on Communications and Information Technologies (ISCIT), Qingdao, China, 26–28 September 2016; pp. 156–161. [Google Scholar]
  8. Kaplan Berkaya, S.; Gunduz, H.; Ozsen, O.; Akinlar, C.; Gunal, S. On Circular Traffic Sign Detection and Recognition. Expert Syst. Appl. 2016, 48, 67–75. [Google Scholar] [CrossRef]
  9. Coţovanu, D.; Zet, C.; Foşalău, C.; Skoczylas, M. Detection of Traffic Signs Based on Support Vector Machine Classification Using HOG Features. In Proceedings of the 2018 International Conference and Exposition on Electrical and Power Engineering (EPE), Iasi, Romania, 18–19 October 2018; pp. 0518–0522. [Google Scholar]
  10. He, X.; Dai, B. A New Traffic Signs Classification Approach Based on Local and Global Features Extraction. In Proceedings of the 2016 6th International Conference on Information Communication and Management (ICICM), Hatfield, UK, 29–31 October 2016; pp. 121–125. [Google Scholar]
  11. Sathish, P.; Bharathi, D. Automatic Road Sign Detection and Recognition Based on SIFT Feature Matching Algorithm. In Proceedings of the International Conference on Soft Computing Systems; Suresh, L.P., Panigrahi, B.K., Eds.; Springer India: New Delhi, India, 2016; pp. 421–431. [Google Scholar]
  12. Lasota, M.; Skoczylas, M. Recognition of Multiple Traffic Signs Using Keypoints Feature Detectors. In Proceedings of the 2016 International Conference and Exposition on Electrical and Power Engineering (EPE), Iasi, Romania, 20–22 October 2016; pp. 535–540. [Google Scholar]
  13. Behloul, A.; Saadna, Y. A Fast and Robust Traffic Sign Recognition. Int. J. Innov. Appl. Stud. 2014, 5, 139–149. [Google Scholar]
  14. Aghdam, H.H.; Heravi, E.J.; Puig, D. A Practical and Highly Optimized Convolutional Neural Network for Classifying Traffic Signs in Real-Time. Int. J. Comput. Vis. 2017, 122, 246–269. [Google Scholar] [CrossRef]
  15. Babić, D.; Babić, D.; Fiolić, M.; Šarić, Ž. Analysis of Market-Ready Traffic Sign Recognition Systems in Cars: A Test Field Study. Energies 2021, 14, 3697. [Google Scholar] [CrossRef]
  16. Lambert, F. Tesla Releases New Software Update to Visually Detect Speed Limit Signs, and More. Electrek 2020, 5, 100113. [Google Scholar]
  17. Kryvinska, N.; Poniszewska-Maranda, A.; Gregus, M. An Approach towards Service System Building for Road Traffic Signs Detection and Recognition. Procedia Comput. Sci. 2018, 141, 64–71. [Google Scholar] [CrossRef]
  18. Boumediene, M.; Lauffenburger, J.P.; Daniel, J.; Cudel, C.; Mips-Ea, L. De´tection, association et suivi de pistes pour la reconnaissance de panneaux routiers. In Proceedings of the Rencontres francophones sur la Logique Floues et ses Applications; Detection, Association and Tracking for Traffic Sign Recognition, Cargèse, France, 8 October 2014. [Google Scholar]
  19. Liu, C.; Li, S.; Chang, F.; Wang, Y. Machine Vision Based Traffic Sign Detection Methods: Review, Analyses and Perspectives. IEEE Access 2019, 7, 86578–86596. [Google Scholar] [CrossRef]
  20. Zeng, Y.; Lan, J.; Ran, B.; Wang, Q.; Gao, J. Restoration of Motion-Blurred Image Based on Border Deformation Detection: A Traffic Sign Restoration Model. PLoS ONE 2015, 10, e0120885. [Google Scholar] [CrossRef] [Green Version]
  21. Zakir, U.; Leonce, A.N.J.; Edirisinghe, E. Road Sign Segmentation Based on Colour Spaces: A Comparative Study. In Proceedings of the 11th Iasted International Conference on Computer Graphics and Imgaing, Innsbruck, Austria, 17–19 February 2010. [Google Scholar]
  22. Faiedh, H.; Farhat, W.; Hamdi, S.; Souani, C. Embedded Real-Time System for Traffic Sign Recognition on ARM Processor. Int. J. Appl. Metaheuristic Comput. 2020, 11, 77–98. [Google Scholar] [CrossRef]
  23. Belaroussi, R.; Foucher, P.; Tarel, J.-P.; Soheilian, B.; Charbonnier, P.; Paparoditis, N. Road Sign Detection in Images: A Case Study. In Proceedings of the 2010 20th International Conference on Pattern Recognition, Istanbul, Turkey, 23–26 August 2010; pp. 484–488. [Google Scholar]
  24. Barnes, N.; Zelinsky, A.; Fletcher, L.S. Real-Time Speed Sign Detection Using the Radial Symmetry Detector. IEEE Trans. Intell. Transp. Syst. 2008, 9, 322–332. [Google Scholar] [CrossRef]
  25. Viola, P.; Jones, M. Rapid Object Detection Using a Boosted Cascade of Simple Features. In Proceedings of the 2001 IEEE Computer Society Conference on Computer Vision and Pattern Recognition, CVPR 2001, Kauai, HI, USA, 8–14 December 2001; IEEE Computer Society: Kauai, HI, USA, 2001; Volume 1, pp. I-511–I–518. [Google Scholar]
  26. Ruta, A.; Li, Y.; Liu, X. Towards Real-Time Traffic Sign Recognition by Class-Specific Discriminative Features; BMVA Press: Durham, UK, 2007; Volume 1. [Google Scholar]
  27. Prisacariu, V.A.; Timofte, R.; Zimmermann, K.; Reid, I.; Van Gool, L. Integrating Object Detection with 3D Tracking Towards a Better Driver Assistance System. In Proceedings of the 2010 20th International Conference on Pattern Recognition, Istanbul, Turkey, 23–26 August 2010; pp. 3344–3347. [Google Scholar]
  28. Agrawal, S.; Chaurasiya, R.K. Ensemble of SVM for Accurate Traffic Sign Detection and Recognition. In Proceedings of the International Conference on Graphics and Signal Processing, Singapore, 24–27 June 2017; Association for Computing Machinery: New York, NY, USA, 2017; pp. 10–15. [Google Scholar]
  29. Zhang, J.; Huang, M.; Jin, X.; Li, X. A Real-Time Chinese Traffic Sign Detection Algorithm Based on Modified YOLOv2. Algorithms 2017, 10, 127. [Google Scholar] [CrossRef] [Green Version]
  30. Jeon, W.J.; Sanchez, G.A.R.; Lee, T.; Choi, Y.; Woo, B.; Lim, K.; Byun, H. Real-Time Detection of Speed-Limit Traffic Signs on the Real Road Using Haar-like Features and Boosted Cascade. In Proceedings of the 8th International Conference on Ubiquitous Information Management and Communication—ICUIMC’14, Siem Reap, Cambodia, 9–11 January 2014; ACM Press: Siem Reap, Cambodia, 2014; pp. 1–5. [Google Scholar]
  31. Abdi, L.; Meddeb, A. Deep Learning Traffic Sign Detection, Recognition and Augmentation. In Proceedings of the SAC’17: Symposium on Applied Computing, Marrakech, Morocco, 3–7 April 2017; pp. 131–136. [Google Scholar]
  32. Zaklouta, F.; Stanciulescu, B.; Hamdoun, O. Traffic Sign Classification Using K-d Trees and Random Forests. In Proceedings of the 2011 International Joint Conference on Neural Networks, San Jose, CA, USA, 31 July–5 August 2011; pp. 2151–2155. [Google Scholar]
  33. Aziz, S.; Aroussi, M.; FAKHRI, Y. Traffic Sign Recognition Based on Multi-Feature Fusion and ELM Classifier. Procedia Comput. Sci. 2018, 127, 146–153. [Google Scholar] [CrossRef]
  34. Triki, N.; Ksantini, M.; Karray, M. Traffic Sign Recognition System Based on Belief Functions Theory. In Proceedings of the 13th International Conference on Agents and Artificial Intelligence, Virtual Event, 4–6 February 2021; pp. 775–780. [Google Scholar]
  35. Alzubaidi, L.; Zhang, J.; Humaidi, A.J.; Al-Dujaili, A.; Duan, Y.; Al-Shamma, O.; Santamaría, J.; Fadhel, M.A.; Al-Amidie, M.; Farhan, L. Review of Deep Learning: Concepts, CNN Architectures, Challenges, Applications, Future Directions. J. Big Data 2021, 8, 53. [Google Scholar] [CrossRef] [PubMed]
  36. Li, Z.; Liu, F.; Yang, W.; Peng, S.; Zhou, J. A Survey of Convolutional Neural Networks: Analysis, Applications, and Prospects. IEEE Trans. Neural Netw. Learn. Syst. 2022, 33, 6999–7019. [Google Scholar] [CrossRef]
  37. Yu, Y.; Liang, S.; Samali, B.; Nguyen, T.N.; Zhai, C.; Li, J.; Xie, X. Torsional Capacity Evaluation of RC Beams Using an Improved Bird Swarm Algorithm Optimised 2D Convolutional Neural Network. Eng. Struct. 2022, 273, 115066. [Google Scholar] [CrossRef]
  38. Yu, Y.; Li, J.; Li, J.; Xia, Y.; Ding, Z.; Samali, B. Automated Damage Diagnosis of Concrete Jack Arch Beam Using Optimized Deep Stacked Autoencoders and Multi-Sensor Fusion. Dev. Built Environ. 2023, 14, 100128. [Google Scholar] [CrossRef]
  39. Zeng, Y.; Xu, X.; Shen, D.; Fang, Y.; Xiao, Z. Traffic Sign Recognition Using Kernel Extreme Learning Machines with Deep Perceptual Features. IEEE Trans. Intell. Transp. Syst. 2017, 18, 1647–1653. [Google Scholar] [CrossRef]
  40. Aghdam, H.; Heravi, E.; Puig, D. Recognizing Traffic Signs Using a Practical Deep Neural Network. In Robot 2015: Second Iberian Robotics Conference: Advances in Robotics, Volume 1; Springer International Publishing: Cham, Switzerland, 2016; Volume 417, ISBN 978-3-319-27145-3. [Google Scholar]
  41. Berghoff, C.; Bielik, P.; Neu, M.; Tsankov, P.; von Twickel, A. Robustness Testing of AI Systems: A Case Study for Traffic Sign Recognition. In Artificial Intelligence Applications and Innovations, Proceedings of the 17th IFIP WG 12.5 International Conference, AIAI 2021, Hersonissos, Crete, Greece, 25–27 June 2021, Proceedings 17; Springer International Publishing: New York, NY, USA, 2021; Volume 627, pp. 256–267. [Google Scholar]
  42. Tabernik, D.; Skočaj, D. Deep Learning for Large-Scale Traffic-Sign Detection and Recognition. IEEE Trans. Intell. Transp. Syst. 2020, 21, 1427–1440. [Google Scholar] [CrossRef] [Green Version]
  43. Traffic Sign Recognition in Harsh Environment Using Attention Based Convolutional Pooling Neural Network|SpringerLink. Available online: https://link.springer.com/article/10.1007/s11063-020-10211-0.
  44. Stallkamp, J.; Schlipsing, M.; Salmen, J.; Igel, C. The German Traffic Sign Recognition Benchmark: A Multi-Class Classification Competition. In Proceedings of the 2011 International Joint Conference on Neural Networks, San Jose, CA, USA, 31 July–5 August 2011; pp. 1453–1460. [Google Scholar]
  45. Chorowski, J.; Bahdanau, D.; Serdyuk, D.; Cho, K.; Bengio, Y. Attention-Based Models for Speech Recognition. arXiv 2015, arXiv:1506.07503. [Google Scholar]
  46. Bahdanau, D.; Cho, K.; Bengio, Y. Neural Machine Translation by Jointly Learning to Align and Translate. arXiv 2016, arXiv:1409.0473. [Google Scholar]
  47. Rush, A.M.; Chopra, S.; Weston, J. A Neural Attention Model for Abstractive Sentence Summarization. arXiv 2015, arXiv:1509.00685. [Google Scholar]
  48. Chaudhari, T.; Wale, A.; Joshi, P.A.; Sawant, P.S. Traffic Sign Recognition Using Small-Scale Convolutional Neural Network; Social Science Research Network: Rochester, NY, USA, 2020. [Google Scholar]
  49. Lim, K.; Hong, Y.; Choi, Y.; Byun, H. Real-Time Traffic Sign Recognition Based on a General Purpose GPU and Deep-Learning. PLoS ONE 2017, 12, e0173317. [Google Scholar] [CrossRef] [Green Version]
  50. Akshay, G.; Dinesh, K.; Scholars, U. Road Sign Recognition System Using Raspberry Pi. Int. J. Pure Appl. Math. 2018, 119, 1845–1850. [Google Scholar]
  51. Vinit, P.K. A Road Sign Detection and Recognition Robot Using Raspberry-Pi. Int. Res. J. Eng. Technol. (IRJET) 2018, 5, 1–5. [Google Scholar]
  52. Bilgin, E.; Robila, S. Road Sign Recognition System on Raspberry Pi. In Proceedings of the 2016 IEEE Long Island Systems, Applications and Technology Conference (LISAT), Farmingdale, NY, USA, 29 April 2016; pp. 1–5. [Google Scholar]
  53. Isa, I.S.B.M.; Choy, J.Y.; Shaari, N.L.A.B.M. Real-Time Traffic Sign Detection and Recognition Using Raspberry Pi. Int. J. Electr. Comput. Eng. (IJECE) 2022, 12, 331. [Google Scholar] [CrossRef]
Figure 1. Road sign categories.
Applsci 13 04793 g001
Figure 2. Traffic Sign Recognition (TSR) process.
Applsci 13 04793 g002
Figure 3. Proposed Traffic Sign Recognition methodology.
Applsci 13 04793 g003
Figure 4. Speed limit Haar cascade detector.
Applsci 13 04793 g004
Figure 5. Detection and extraction of ROIs using a Haar-like cascade detector.
Applsci 13 04793 g005
Figure 6. Traffic Sign Classification process.
Applsci 13 04793 g006
Figure 7. Traffic Sign Classes.
Applsci 13 04793 g007
Figure 8. Distribution of road sign images per class.
Applsci 13 04793 g008
Figure 9. TSC model architecture without attention mechanism (TSC-M).
Applsci 13 04793 g009
Figure 10. TSC model architecture with attention mechanism (TSC-MA).
Applsci 13 04793 g010
Figure 11. Obtained accuracy and loss curves after 70 epochs (TSC_M).
Applsci 13 04793 g011
Figure 12. Obtained accuracy and loss curves after 70 epochs (TSC_MA).
Applsci 13 04793 g012
Figure 13. Confusion matrix of the proposed TSC_MA.
Applsci 13 04793 g013
Figure 14. Examples of road sign recognition in a video sequence.
Applsci 13 04793 g014
Figure 15. Examples of road sign recognition detected from the webcam of the PC using the TSC-MA.
Applsci 13 04793 g015
Table 1. Machine learning-based detection methods.
Machine Learning Traffic Sign DetectorsFeaturesTraining Methods
AdaBoost-based methodsHaar-likeFeatures cascade
SVM-based methodsHOG featuresLinear SVM
Table 2. Deep learning-based detection methods.
Deep Learning Traffic Sign DetectorsTraining Methods
SVM + CNN
Convolutional neural network (CNN)
CNN-based detection methodsFCN and Deep CNN
Faster RCNN
Cascaded convolutional networks
YOLOv2 and YOLOv3
Table 3. Examples of machine learning-based classification methods.
Features DescriptorsML ClassifiersCR (%)DatasetTime (s)
HOGK-d trees92.90GTSRB-
Random Forest97.20 -
Gabor + LBP + HOGSVM97.04GTSRB
(48 × 48 images)
-
HOG95.700.08
CLBP96.881.21
Gabor94.102.32
HOG + CLBPELM97.03 1.49
HOG + Gabor96.90GTSRB2.57
CLBP + Gabor96.403.54
HOG + CLBP + Gabor99.103.68
Table 4. Examples of deep learning-based classification methods.
Deep Learning ClassifiersCR (%)DatasetTime (s)
CNN + ELM99.40GTSRB64.8
Single CNN99.50-
2 Compact ConvNet99.61-
3 CNN99.7024.94
Table 5. Best obtained results with the GTSDB dataset.
TSD MethodsTechniquesDRs (%)Detection Time (ms)
Colour-based methodsMSER in HSV [23]96-
Shape-based methodsEDC Circles [8]84.6436
Colour and shape-based methodsHSV + HOG [2]95.03236
Machine Learning-based methodsHaar cascade [31]99.05-
Deep Learning-based methodsModified YOLOv2 [28]96.6917
Table 6. Best obtained classification results with the GTSRB dataset.
TSC MethodsCR (%)DatasetClassification Time (s)
ML method: HOG + CLBP + Gabor ELM [33]99.10GTSRB
(48 × 48 images)
3.68
DL methods: three CNN [14]99.70GTSRB24.94
Table 7. TSC_M accuracy rates trained over 30, 70, and 100 epochs.
EpochAccuracy (%)Loss (%)
TrainingValidationTestingTrainingValidationTesting
3099.8999.4398.100.003390.020.070
7099.9799.6898.560.000980.010.060
10099.9999.6398.460.000500.010.067
Table 8. TSC_M weighted avg rates trained for 70 epochs.
PrecisionRecallF1 Score
Weighted avg (%)989898
Table 9. TSC_MA accuracy rates trained for 30 and 70 epochs.
EpochAccuracy (%)Loss (%)
TrainingValidationTestingTrainingValidationTesting
3099.9999.9798.880.00550.020.091
7099.9999.6798.910.00200.0090.062
Table 10. TSC_MA model weighted avg rates trained for 70 epochs.
PrecisionRecallF1 Score
Weighted avg (%)999999
Table 11. TSC_MA accuracy rates results trained for 70 epochs on GTSRB and BTSCB.
GTSRB Dataset Accuracy Results (%)BTSCB Dataset Accuracy Results (%)
EpochTrainingValidationTestingTrainingValidationTesting
7099.9999.9799.9199.3599.3199.27
Disclaimer/Publisher’s Note: The statements, opinions and data contained in all publications are solely those of the individual author(s) and contributor(s) and not of MDPI and/or the editor(s). MDPI and/or the editor(s) disclaim responsibility for any injury to people or property resulting from any ideas, methods, instructions or products referred to in the content.

