Article

Three-Dimensional Temperature Field Simulation and Analysis of a Concrete Bridge Tower Considering the Influence of Sunshine Shadow

1
Shaanxi Union Research Center of University and Enterprise for Bridge Intelligent Construction, Xi’an 710199, China
2
School of Civil Engineering, Chongqing Jiaotong University, Chongqing 400074, China
3
CCCC Second Highway Engineering Co., Ltd., Xi’an 710065, China
4
School of Highway, Chang’an University, Xi’an 710064, China
*
Author to whom correspondence should be addressed.
Appl. Sci. 2023, 13(8), 4769; https://doi.org/10.3390/app13084769
Submission received: 5 February 2023 / Revised: 4 April 2023 / Accepted: 5 April 2023 / Published: 10 April 2023
(This article belongs to the Topic AI Enhanced Civil Infrastructure Safety)

Abstract

:
This paper forms a set of three-dimensional temperature field simulation methods considering the influence of sunshine shadow based on the DFLUX subroutine and FILM subroutine interface provided by the Abaqus platform to simulate the three-dimensional temperature field of concrete bridge towers and study its distribution law. The results show that the method has high accuracy for shadow recognition and temperature field calculation. The maximum difference between the shadow recognition results and the theoretical calculation value was only 19.1 mm, and the maximum difference between the simulated temperature and the measured temperature was 3.3 °C. The results of analyzing the temperature field of the concrete bridge tower using this algorithm show that the temperature difference between the opposite external surface of the tower column can reach 11.6 °C, which is significantly greater than the recommended temperature difference value of 5 °C in the specifications. For the concrete bridge tower, in the thickness direction of the tower wall, the temperature change was obvious only at a range of 0.3 m from the external surface of the tower wall, and the temperature change in the remaining range was small. In addition, the temperature gradient distribution of the sunshine temperature field in the direction of wall thickness conformed to the exponential function T(x) = T0eαx + C. Additionally, the data fitting results indicate that using the temperature data at a distance of 0.8 m from the external surface as the calculation parameter in the function can achieve the ideal fitting result.

1. Introduction

Cable-supported bridges (cable-stayed bridges, suspension bridges, and cable-stayed suspension bridges) with large span characteristics have become the preferred structural form to meet the growing demand for transportation and specific purposes. The height of the tower structure, as an important component of a bridge, also needs to increase with the continuous increase in the span of such bridges. Since the bridge tower structure is always exposed to the atmospheric environment, temperature differences will occur between the surfaces of the bridge tower under the influence of external environmental conditions (solar radiation, atmospheric temperature, wind, and other factors), including the overall temperature difference between the external surfaces and the local temperature difference between the internal and external surfaces in the direction of the tower wall thickness, thus forming an uneven temperature field inside the structure. The temperature difference on the external surface of the bridge tower is caused by the shadow occlusion between different surfaces under solar irradiation, and the temperature difference will cause the bridge tower to deviate. The direction and size of the deviation of the bridge tower will change with the direction of solar light irradiation, which will undoubtedly increase the difficulty of monitoring the alignment of the bridge tower during the construction stage. The local temperature difference in the thickness direction of the tower wall is due to the large change in temperature of the external surface of the bridge tower with the change in atmospheric ambient temperature and the influence of solar radiation. The air in the inner cavity of the bridge tower is not flowing and the thermal conductivity of the concrete is poor, which leads to a change in the temperature of the internal surface of the bridge tower that is far less than the change in the external surface temperature. The actual monitoring data of the temperature field of the bridge tower show that the temperature difference formed in the thickness direction of the tower wall is often greater than 10 °C, and the temperature stress generated can reach the level of the live load [1,2,3,4,5]. The General Specifications for Design of Highway Bridges and Culverts (JTG D60–2015) [6] does not give a detailed description of the calculation of the temperature field of the bridge tower, while the Specifications for Design of Highway Cable-Stayed Bridges (JTG/T 3365–01–2020) [7] only suggests that the linear temperature difference between the opposite external surface of the bridge tower can be taken as ±5 °C, but its applicability remains to be discussed. The European standard [8] suggests that the temperature difference between the opposite outer surfaces is recommended to be considered by ±5 °C in the absence of detailed information, and the temperature difference between the inner and outer surfaces of the tower wall is recommended to be considered at 15 °C, but the temperature gradient distribution mode is not described in detail. The temperature gradient distribution of the bridge tower is mostly considered according to the gradient mode of other similar projects, which may be quite different from the actual structure. Therefore, the accurate calculation of the temperature field of the bridge tower structure under the action of sunlight and the exploration of its temperature field distribution law on this basis are of great significance for the reasonable design of bridge tower structures and the assurance of the construction quality.
The temperature difference in the height direction of the bridge tower structure is often ignored, and a two-dimensional analysis method is used to calculate the temperature field to simplify the calculation in engineering. However, this method cannot accurately consider the impact of shadow shading, and the calculated results obviously cannot reflect the real structural deformation. In view of this, domestic and foreign scholars have carried out relatively extensive research on a three-dimensional temperature field calculation of the bridge tower structure, using two main research methods: an actual data analysis method based on the actual project or test model and a simulation analysis method based on the finite element theory.
Ren et al. [9,10] analyzed the change of the temperature difference along the height and thickness of the tower wall with time in different seasons and obtained the most unfavorable distribution of the positive and negative temperature difference based on the monitoring temperature data of the concrete tower of a suspension bridge, but did not give the change rule of the temperature field in different directions. Yang et al. [11] analyzed the temperature field of the bridge tower of the Anqing Yangtze River Bridge based on the monitoring data. The results show that the temperature of the shaded part is much lower than that of other parts, and the temperature of the external surface and the ambient temperature have the same trend. Additionally, the difference between the temperature of the structure and the air can be well-fitted. Zhang et al. [12] studied the temperature field of a concrete bridge tower through the monitoring data. The results show that the maximum temperature difference and the most unfavorable temperature effect on the bridge tower appear in winter. Zhou et al. [13] collected the temperature monitoring data of a bridge in one year based on the health monitoring system of a bridge, analyzed the distribution law of the sunshine temperature field of the bridge, and put forward a calculation mode of the vertical temperature gradient and temperature difference of the bridge tower.
The above method of bridge structure temperature field analysis based on the monitoring data of an actual engineering or test model can collect the real temperature data at the measuring point, but due to the limitations of the measuring point and the monitoring conditions, the data results are often unable to fully reflect the specific situation of the structure’s temperature field, and the error is large. Additionally, the temperature field data monitoring process generally lasts for a long time, and the efficiency is low. However, the numerical simulation method has been favored by many researchers and engineers and has become one of the mainstream methods for the calculation and research of the temperature field of bridge structures at this stage because it is not limited by the above conditions and can realize the rapid calculation of the temperature field.
The research on the boundary conditions of the temperature field of the bridge structure is relatively mature in the simulation analysis of the temperature field of the bridge structure. Therefore, the most critical problem is to consider the influence of real-time sunshine and shadow on the calculation results of the temperature field of the structure in the process of accurately simulating the three-dimensional temperature field of the bridge structure. However, the sunshine shadow occlusion of the structure is in the process of dynamic change with the change of the solar orientation in a day. How to accurately and quickly recognize the dynamic shadow occlusion area of the structure and apply reasonable solar radiation boundary conditions to the shadow occlusion area has become the premise for realizing the accurate simulation of the three-dimensional temperature field. In response to this problem, many scholars have carried out corresponding research. Early scholars carried out shadow shading research on relatively simple box girder structures. Imbsen and Zhang et al. [14,15] calculated the illumination angle of solar light at a specific time using astronomical knowledge and used the plane geometric relationship between the box girder structure and the solar irradiation light to determine the calculation formula for the shadow shielding height of the box girder web, but this method is difficult to use to determine the plane geometric relationship between the structure and the sunlight, and the calculation workload is large when it is used for complex structures such as bridge towers and trusses. Subsequent scholars used ray tracing in computer graphics theory to research the dynamic recognition algorithm of sunshine shadows. The core technology of the sunshine-shadow recognition algorithm is to determine the intersection between sunshine light and structural surface mesh. In the algorithm solution, it is often realized by a cross multiplication or triangle barycenter coordinate operation [16]. If the shadow is identified directly through a large number of cross-multiplication operations, the calculation process is accompanied by a large number of invalid operations, the calculation efficiency is low, and the computer’s computing power has higher requirements. When the method of shadow recognition by triangular barycentric coordinate calculation is used for models with a large number of grids, the calculation time is long, which greatly wastes computing resources. How to improve and optimize the shadow recognition algorithm to improve the calculation speed is an urgent problem for the accurate calculation of the three-dimensional temperature field of complex bridge structures. Gu and Wang et al. [17,18] effectively improved the computing efficiency of the sunshine shadow algorithm by introducing spatial subdivision technology and a grid acceleration structure, respectively. However, the number of meshes in the calculation model has also increased accordingly with the continuous increase in the span of modern bridges, further improving the efficiency of the shadow recognition algorithm, which is of great significance for the calculation of a three-dimensional sunshine temperature field, considering the influence of sunshine shadow.
This paper used the Python programming language to write a script to extract the mesh information of the structural surface based on the previous research, which greatly reduced the workload of the computer in shadow recognition. At the same time, the traditional sunshine-shadow recognition algorithm was improved and optimized by combining the cross-product judgment method and the triangle barycentric coordinate method in ray tracing, and the efficiency of the algorithm for sunshine-shadow discrimination was further improved. Finally, a set of accurate and efficient three-dimensional temperature field simulation methods was developed. The distribution characteristics of the temperature field were analyzed based on the accurate simulation of the three-dimensional temperature field of the concrete bridge tower in this paper, which provided a reference for the design and construction of the concrete bridge tower.

2. Heat Transfer Boundary Condition

The heat transfer of objects meets the law of conservation of energy and Fourier law [19]. The differential equation of heat transfer without an internal heat source is as follows [17]:
ρ c T τ = x k x T x + y k y T y + z k z T z
where ρ is the density of the material, k g / m 3 ; c is the specific heat capacity of the material, J / ( k g · C ) ; and k x , k y , and k z are the thermal conductivity of the structure in x , y , and z directions, W / ( m · C ) .
The heat exchange between the bridge structure and the external environment under the action of sunlight mainly includes three parts: direct solar radiation, convective heat transfer, and radiation heat transfer, as shown in Figure 1.
ρ q = q s + q c + q r
where q is the heat flux density for comprehensive heat transfer on the structural surface, W / m 2 ; q s is the solar radiation heat flux density absorbed by the structural surface, W / m 2 ; q c is the heat flux density for convective heat transfer between the structural surface and the external environment, W / m 2 ; and q r is the heat flux density for radiation heat transfer between the structural surface and the external environment, W / m 2 .

2.1. Solar Radiation Effect

The heat flux q s of the total solar radiation on the surface of the structure is
q s = α I S O R
where I S O R is the total intensity of solar radiation on the structure surface, W / m 2 ; and α is the short-wave radiation absorption coefficient of the concrete surface, which is generally 0.5~0.7 [20].

2.1.1. Calculation of Sun Position Parameters

The position parameters of the sun relative to the earth, such as the declination angle δ , elevation angle α s , and azimuth angle γ s , can be calculated using the law of solar operation in astronomical knowledge [21].
δ = 23.45 sin 360 365 284 + N
sin α s = c o s φ c o s δ c o s τ + s i n φ s i n δ
γ s = s i g n τ c o s 1 s i n α s s i n φ s i n δ c o s α s c o s φ
In the above formula, N is the annual accumulated day, that is, the total number of days from January 1 to the current date; α s is the solar elevation angle, which is 0 at sunrise and sunset. φ is the geographical latitude, which is positive in the Northern Hemisphere and negative in the Southern Hemisphere, and the value range is 90 ~ 90 ; τ is the solar hour angle, and the solar hour angle at noon is exactly 0 , τ = t 12 × 15 , where t is the true solar hour; the γ s is positive to the west and negative to the east, and the value range is 180 ~ 180 ; the s i g n is a symbol function.
The relative position relationship between the surface of the structure and the sun is shown in Figure 2. The angle between the sunlight and the exterior normal n of the surface, that is, the incident angle i , is calculated by the following formula:
c o s θ = s i n α s c o s β + c o s α s s i n β c o s ( γ s γ )
where β is the inclination angle of the structural surface relative to the horizontal plane, the value range is 0 ~ 180 , and when it is greater than 90 , the surface is downward; γ is the angle between the exterior normal n of the surface and the positive south direction. The direction is positive to the west and negative to the east, and the value range is 180 ~ 180 .

2.1.2. Calculation of Solar Radiation Intensity

The Bouguer Formula (8) is commonly used in engineering calculations to calculate the direct solar radiation intensity I D 0 W / m 2 that can reach the horizontal plane [22].
I D 0 = I 0 P m
P = 0.9 t u k a
where I 0 is the solar constant, 1367   W / m 2 [23]; m is the optical atmospheric mass, m = 1 / sin α s ; P is the composite atmospheric transparency coefficient [24]; t u is the Linke turbidity factor, reflecting the degree of extinction caused by aerosol scattering in the lead column of the cloudless atmosphere, and the larger the aerosol content in the lead column, the greater the atmospheric turbidity, which is related to time and geographical location; k a is the relative atmospheric pressure at different altitudes, which changes with altitude [20].
The solar scattering radiation intensity I C 0 ( W / m 2 ) on the bridge’s horizontal surface can be calculated using the following formula [25]:
I C 0 = 0.5 1 P m 1 1.4 l n P sin α s
The horizontal surface reflected radiation intensity I R ( W / m 2 ) is calculated as follows [26,27]:
I R 0 = R e I D sin α s + I C
where R e is the surface or water surface shortwave emissivity, generally 0.2 [22].

2.1.3. Calculation of Radiation Amount of Arbitrary Surface

The direct solar radiation intensity I D , the sky diffused radiation intensity I C , and the ground reflected radiation intensity I R of the structural surface with an inclination angle of β relative to the horizontal plane are:
I D = I D 0 cos θ
I C = I C 0 1 + cos β 2
I R = I R 0 1 cos β 2
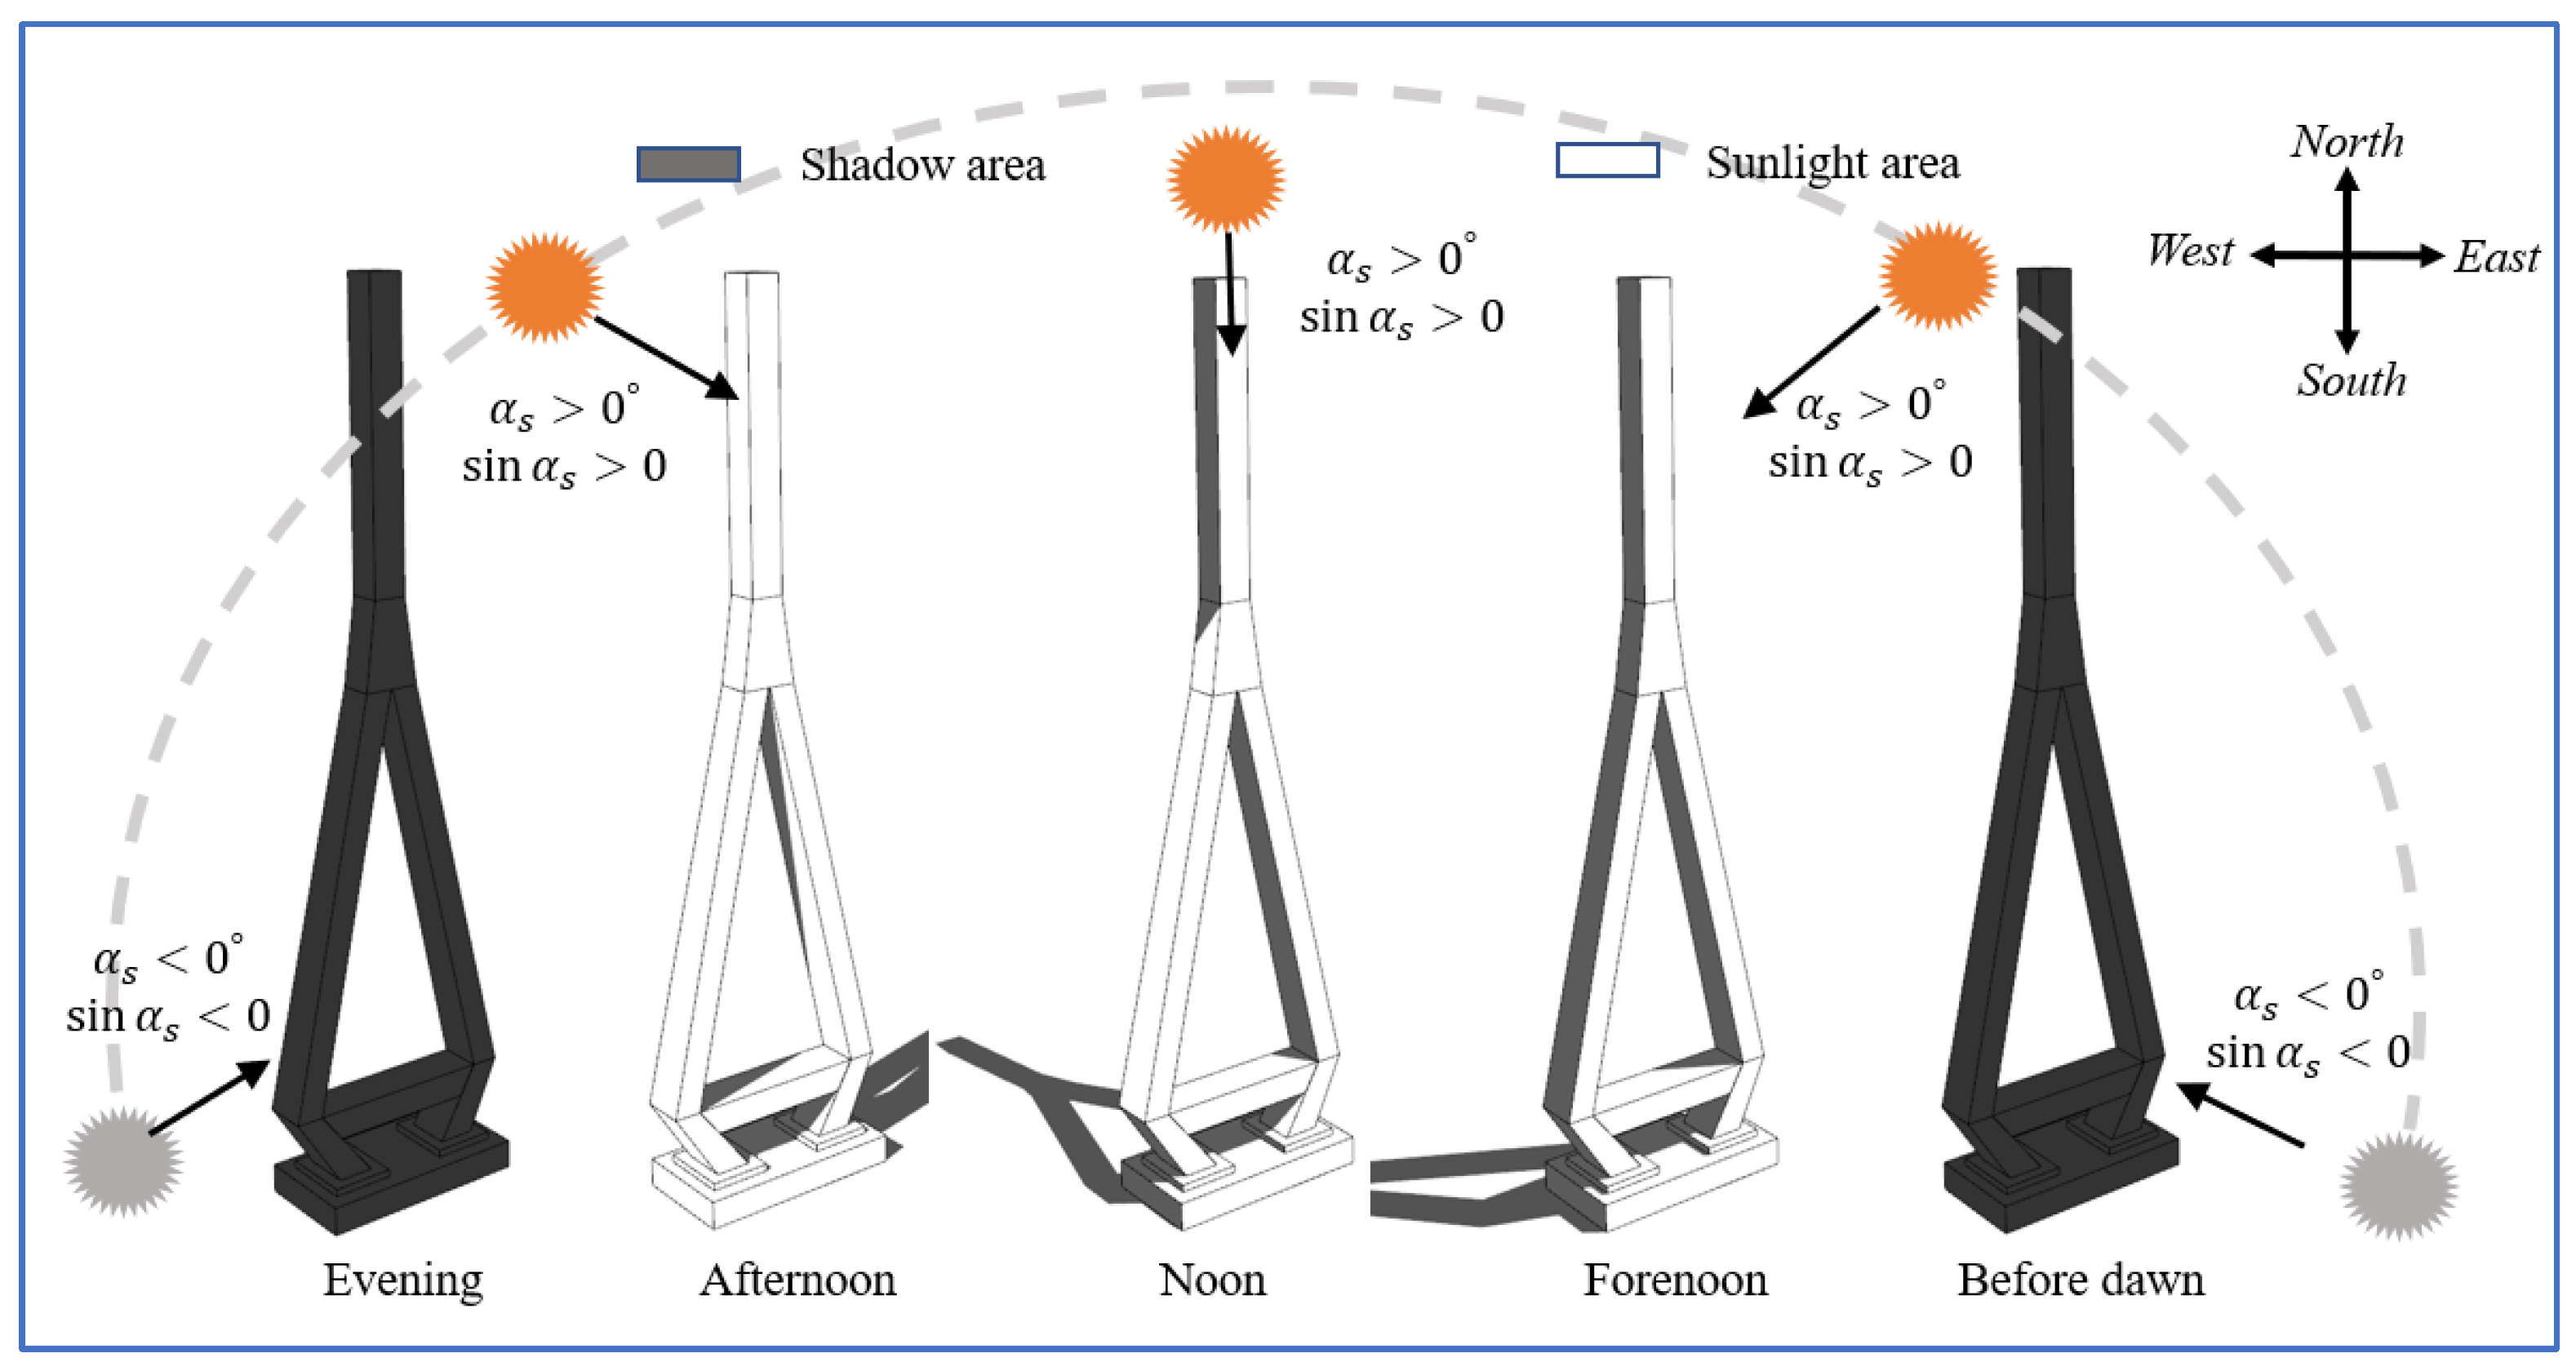
According to the shadow occlusion relationship of the structural surface shown in Figure 3, the total amount of solar radiation I S O R received by any surface is:
I S O R = I D + I C + I R                           Sunlight   area I C + I R Shadow   area

2.2. Convective Heat Transfer

The heat flux q c ( W / m 2 ) generated by the convective heat transfer between the surface and the atmospheric environment can be calculated by the Newtonian cooling law [28].
q c = h c T a T
where T a and T are the ambient temperature and the structural surface temperature, respectively, °C; h c is the convective heat transfer coefficient, W / m 2 · C .
The convective heat transfer coefficient h c is related to the shape of the structural surface, wind speed v , ambient temperature, and other factors [20]. In the calculation of the temperature field of the bridge structure, the convective heat transfer coefficient is usually calculated by Formula (17) [24,29]:
h c = 2.5 T a T 4 + 1.54 v
v = v 10 . h 10 c u
where h is the height from the calculated position to the ground or horizontal plane, m ; v 10 is the wind speed at a height of 10 m from the ground, m / s ; c u is the roughness coefficient (wind profile coefficient) [30]; and v is the wind speed at height h , m / s .

2.2.1. Internal Space Heat Transfer of Structure

The internal surface, which is different from the external surface of the structure, is not affected by solar radiation. The convective heat transfer and radiative heat transfer between the internal surface of the structure and the air in the internal space of the structure can be characterized by the heat transfer coefficient h n [20]:
h n = h n c + h n r
h n r = ε C 0 546.3 + T a i r + T s u r f T a i r + 273.15 2 + T s u r f + 273.15 2
In the formula, h n c is the natural convection heat transfer coefficient, which is taken as 3.5   W / m 2 · C [31]; h n r is the radiative heat transfer coefficient, W / m 2 · C ; ε is the radiance; T a i r and T s u r f are the temperature of the air in the internal space and the temperature of the internal surface of the structure, respectively.

2.2.2. Daily Temperature Model

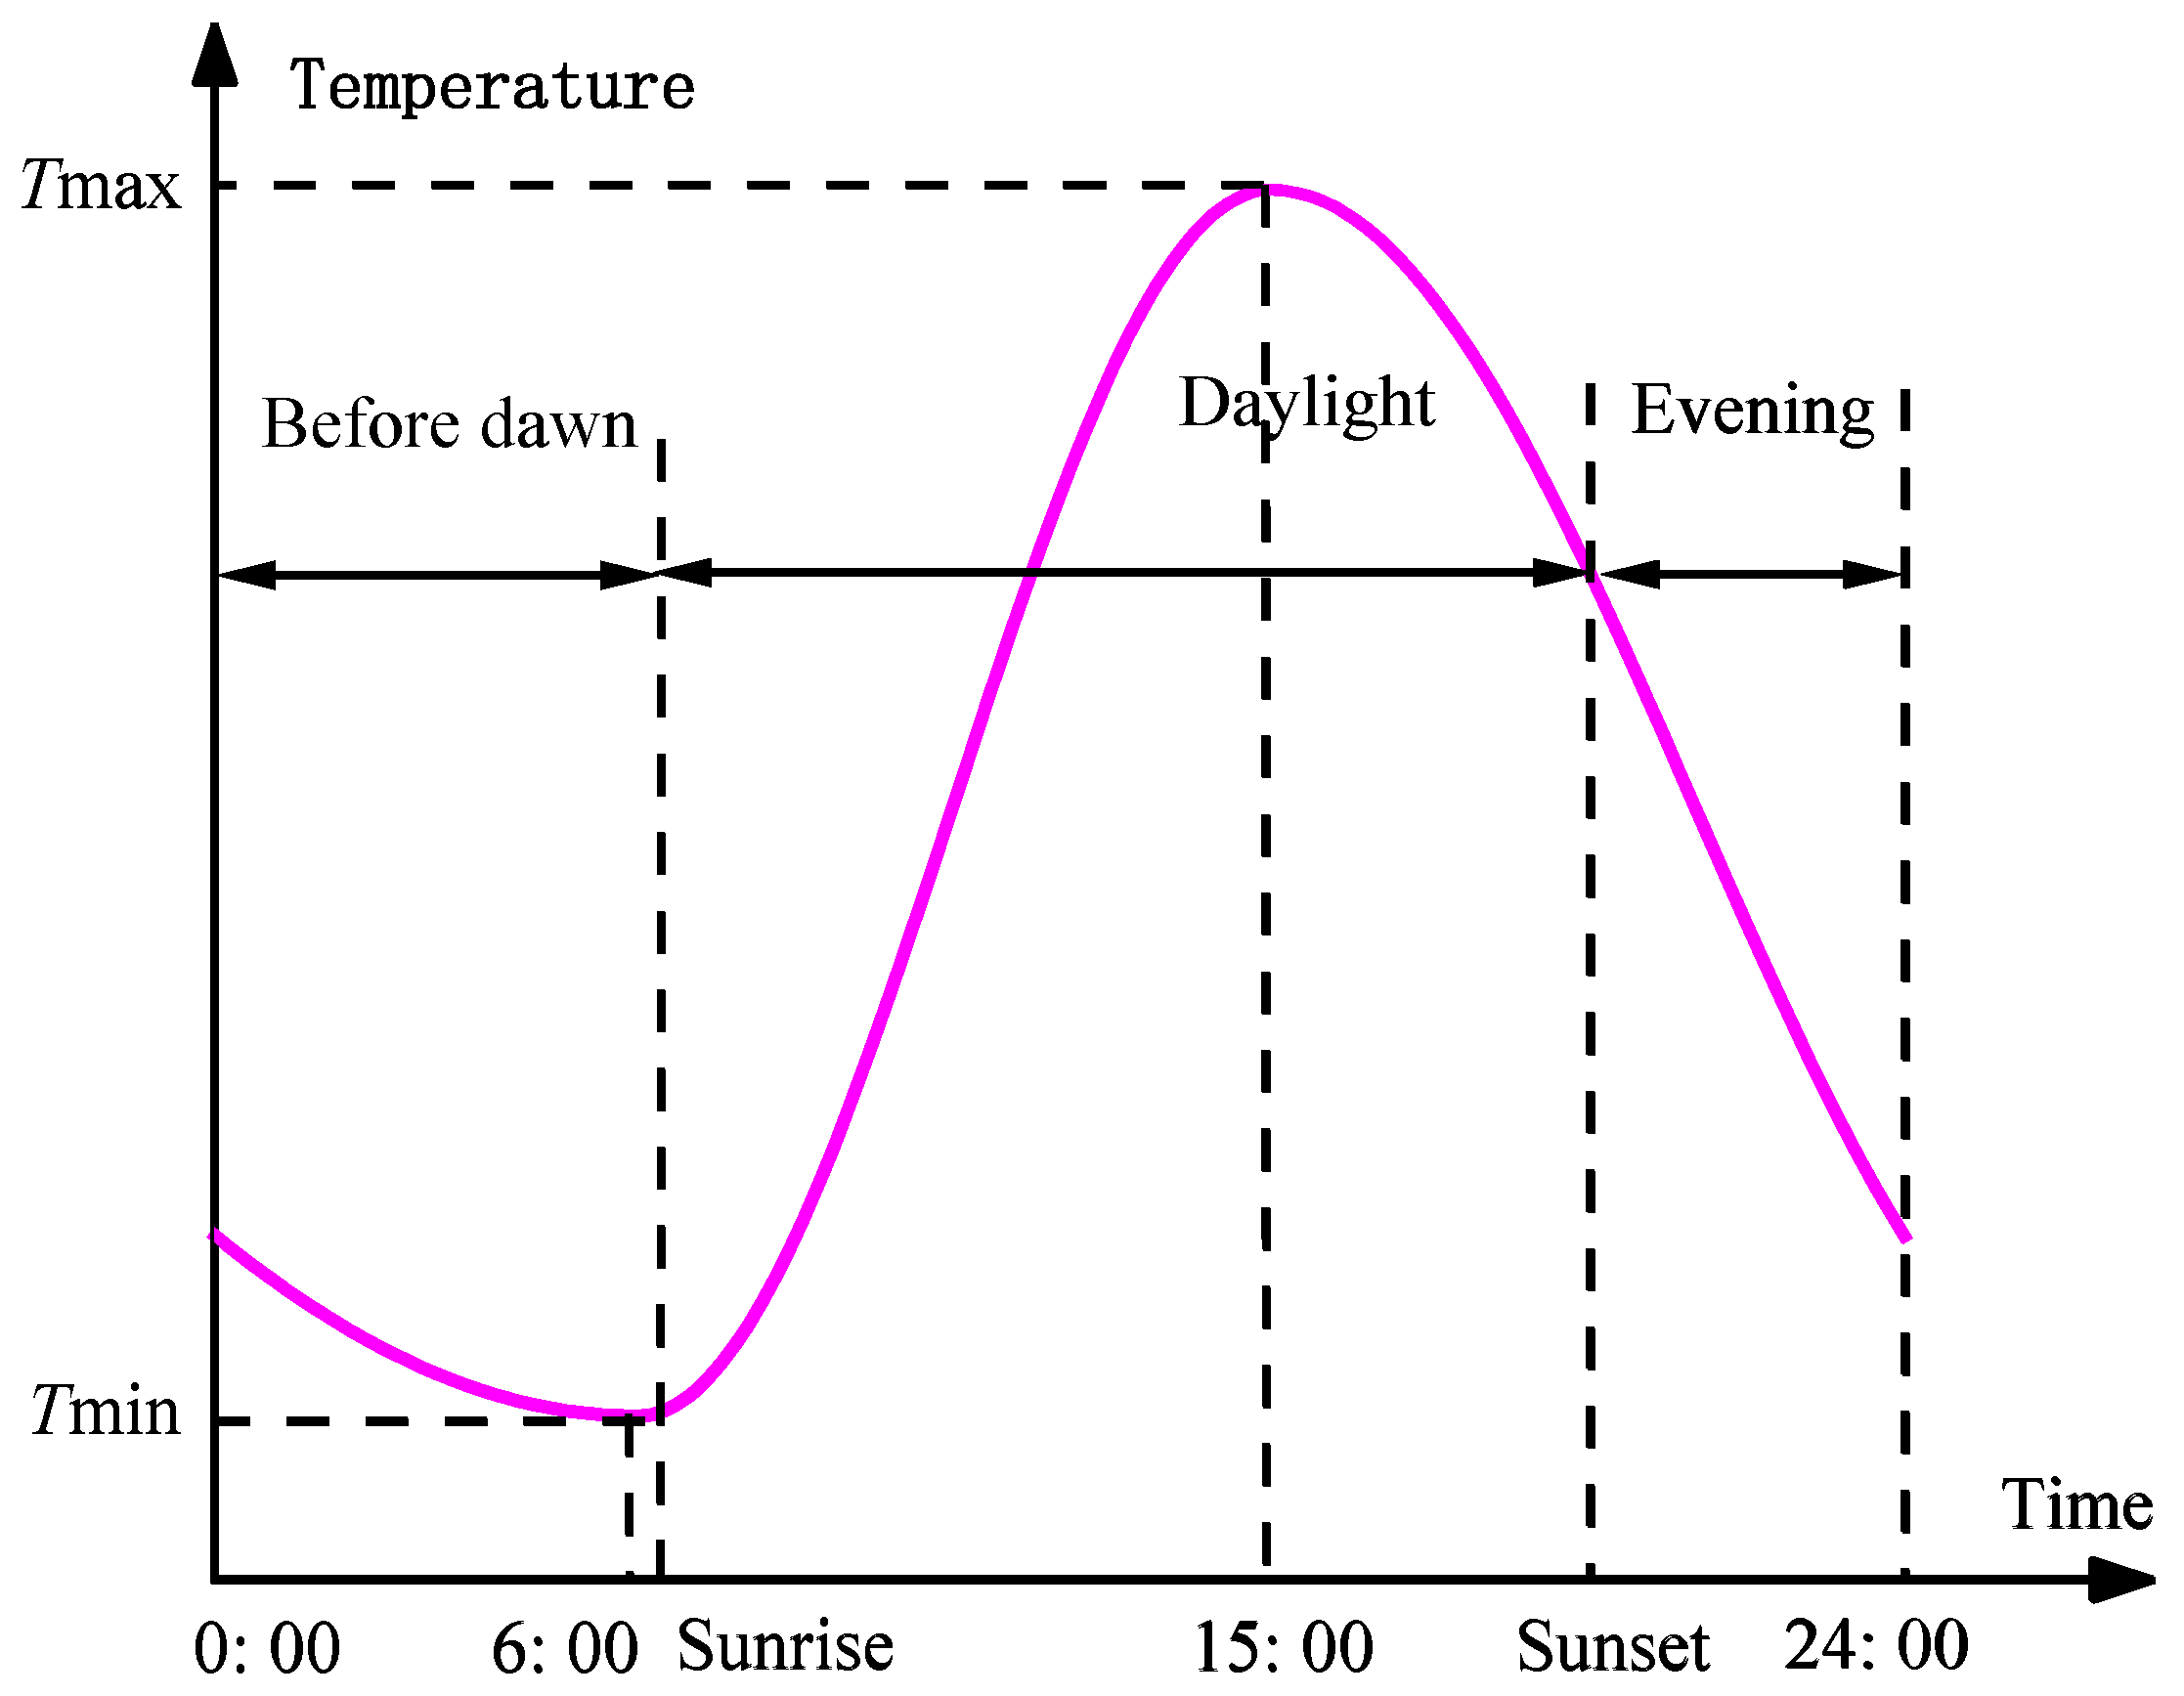
It is reasonable to assume that the atmospheric temperature of the whole day changes according to the sine function in the numerical simulation of the sunshine temperature field of the bridge structure. The piecewise sine function model shown in Figure 4 is used in this study to simulate the change in temperature in a day. The specific calculation formula is [32,33]:
T 1 = 0.5 T s u m + T sin π t + 30 24                 0 t < 6 T 1 = 0.5 T s u m + T sin π t 10.5 9 6 t < 15 T 1 = 0.5 T s u m + T sin π t 9 12 15 t 24
where t is the moment, hour; T s u m = T m a x + T m i n ; T = T m a x T m i n ; T m a x is the daily maximum temperature, taking the temperature at 3:00 pm, °C; T m i n is the daily minimum temperature, taking the temperature at 6:00 a.m., °C.
The air temperature in the closed box of a concrete bridge structure can be calculated using the empirical Formula (22) recommended in Reference [20] in the absence of measured data.
T a i r t = T a v + T a m cos π t t s 12
T a v = 0.5 T m i n + T m a x + 0.13 Q
T a m = 0.5 T m i n + T m a x + 0.07 Q
where T a i r t is the indoor air temperature, °C; t s is the time of sunset, hour; the meanings of T m a x and T m i n are the same as above; T a v is the daily average temperature in the box; T a m is the diurnal variation amplitude of temperature in the box; and Q is the total solar radiation absorbed by the horizontal surface of the structure ( M J / m 2 ), which is zero before sunrise and after sunset.
Because the solar elevation angle is zero at sunrise and sunset, the sunrise and sunset times t c and t s can be calculated using Formula (25) [20]):
t c = 12 1 15 cos 1 tan δ tan ϕ t s = 12 + 1 15 cos 1 tan δ tan ϕ
where δ is the solar declination and φ is the geographical latitude.

2.3. Radiation Heat Transfer

There is always radiation heat transfer between the bridge surface and the atmosphere, which not only absorbs radiation from the atmosphere and surface but also releases radiation into the surrounding environment. In this paper, the radiation heat transfer between the structural surface and the external environment is calculated by Formula (26) [20,34].
q r = h r T a T q r n
h r = C 0 ε T + 273.15 2 + T a + 273.15 2 T + T a + 546.3
q r n = 1 ε a 1 + cos β 2 ε C 0 T a + 273.15 4
where h r is the radiative heat transfer coefficient, W / m 2 · C ; C 0 is the Stefan–Boltzmann constant, taking 5.67 × 10 8   W / m 2 · K 4 ; ε a is the atmospheric radiation coefficient, and its value range is 0.74 ~ 0.95 , generally taken as 0.82; ε is the radiation emissivity of the structure, generally 0.85 ~ 0.95 ; and q r n is the heat flux density of the inclined plane caused by the sky radiation effect, W / m 2 .

3. Research on Sunshine Shadow Occlusion Algorithm

3.1. Three-Dimensional Light Occlusion Theory

Shadow occlusion caused by sunlight can be divided into the following four types based on the existing research: no occlusion, self-occlusion, mutual occlusion, and permanent occlusion [35], as shown in Figure 5.
If the incident angle of the sunlight projected onto a certain area of the surface of the structure is less than 90° and no other surface is projected onto the area, the area is said to be unshielded at this moment. The surface area in a no occlusion state is not affected by direct solar radiation.
If the incident angle of the sunlight projected onto a certain area of the structural surface is greater than 90°, the sunlight cannot illuminate the area due to the occlusion of the area itself. The area is said to be in a self-occlusion state at this moment. An area in the self-occlusion state does not apply a direct solar radiation load.
If the incident angle of the sunlight projected onto a certain area of the structural surface is less than 90° but the area is in the shadow area projected by other surfaces, it is considered to be in a state of mutual occlusion at this moment and cannot be directly radiated by the sun. The most commonly used method to determine whether an area is in a state of mutual occlusion is to determine whether the connection between the node and the sun in the area has an intersection with other surfaces at this moment. If it exists, it is determined that the node is in a state of mutual occlusion at this moment.
If the line between the node and the sun on the surface of the structure (generally refers to the internal surface) passes through other surfaces of the structure at any time, the surface is in a permanent occlusion state. Surfaces in permanent occlusion are generally not in direct contact with the external environment, so such surfaces are generally not directly affected by solar radiation.

3.2. Sunshine Shadow Recognition Technology Based on Ray Tracing

3.2.1. Sunshine Shadow Recognition Method

The sunshine shadow recognition method based on ray tracing in this paper adopts the process shown in Figure 6. The specific implementation steps are as follows:
(a)
Because the number of meshes in the structural solid model was generally relatively large and the calculation workload was relatively large, the Python programming language was used to write a script tool for Abaqus software Version 6.10. to extract the surface mesh information (node coordinates, surface element nodes, and normal vectors) of the calculation model during the research of the sun shadow algorithm, to avoid a large number of invalid calculations in the calculation process of sunlight and shadow recognition.
(b)
The relative position relationship between the sun and the structure at this time was determined according to the calculation theory of the position parameters of the sun described in Section 2.1.1 after the extraction of mesh information from the surface of the model.
(c)
We determined the incident angle of the sunlight projected onto the grid surface of the node to be detected, which was located through the cross multiplication operation, and judged the size of the incident angle. When the incident angle was greater than 90°, we directly determined that the node to be detected was in the self-occlusion state; otherwise, the subsequent judgment continued.
(d)
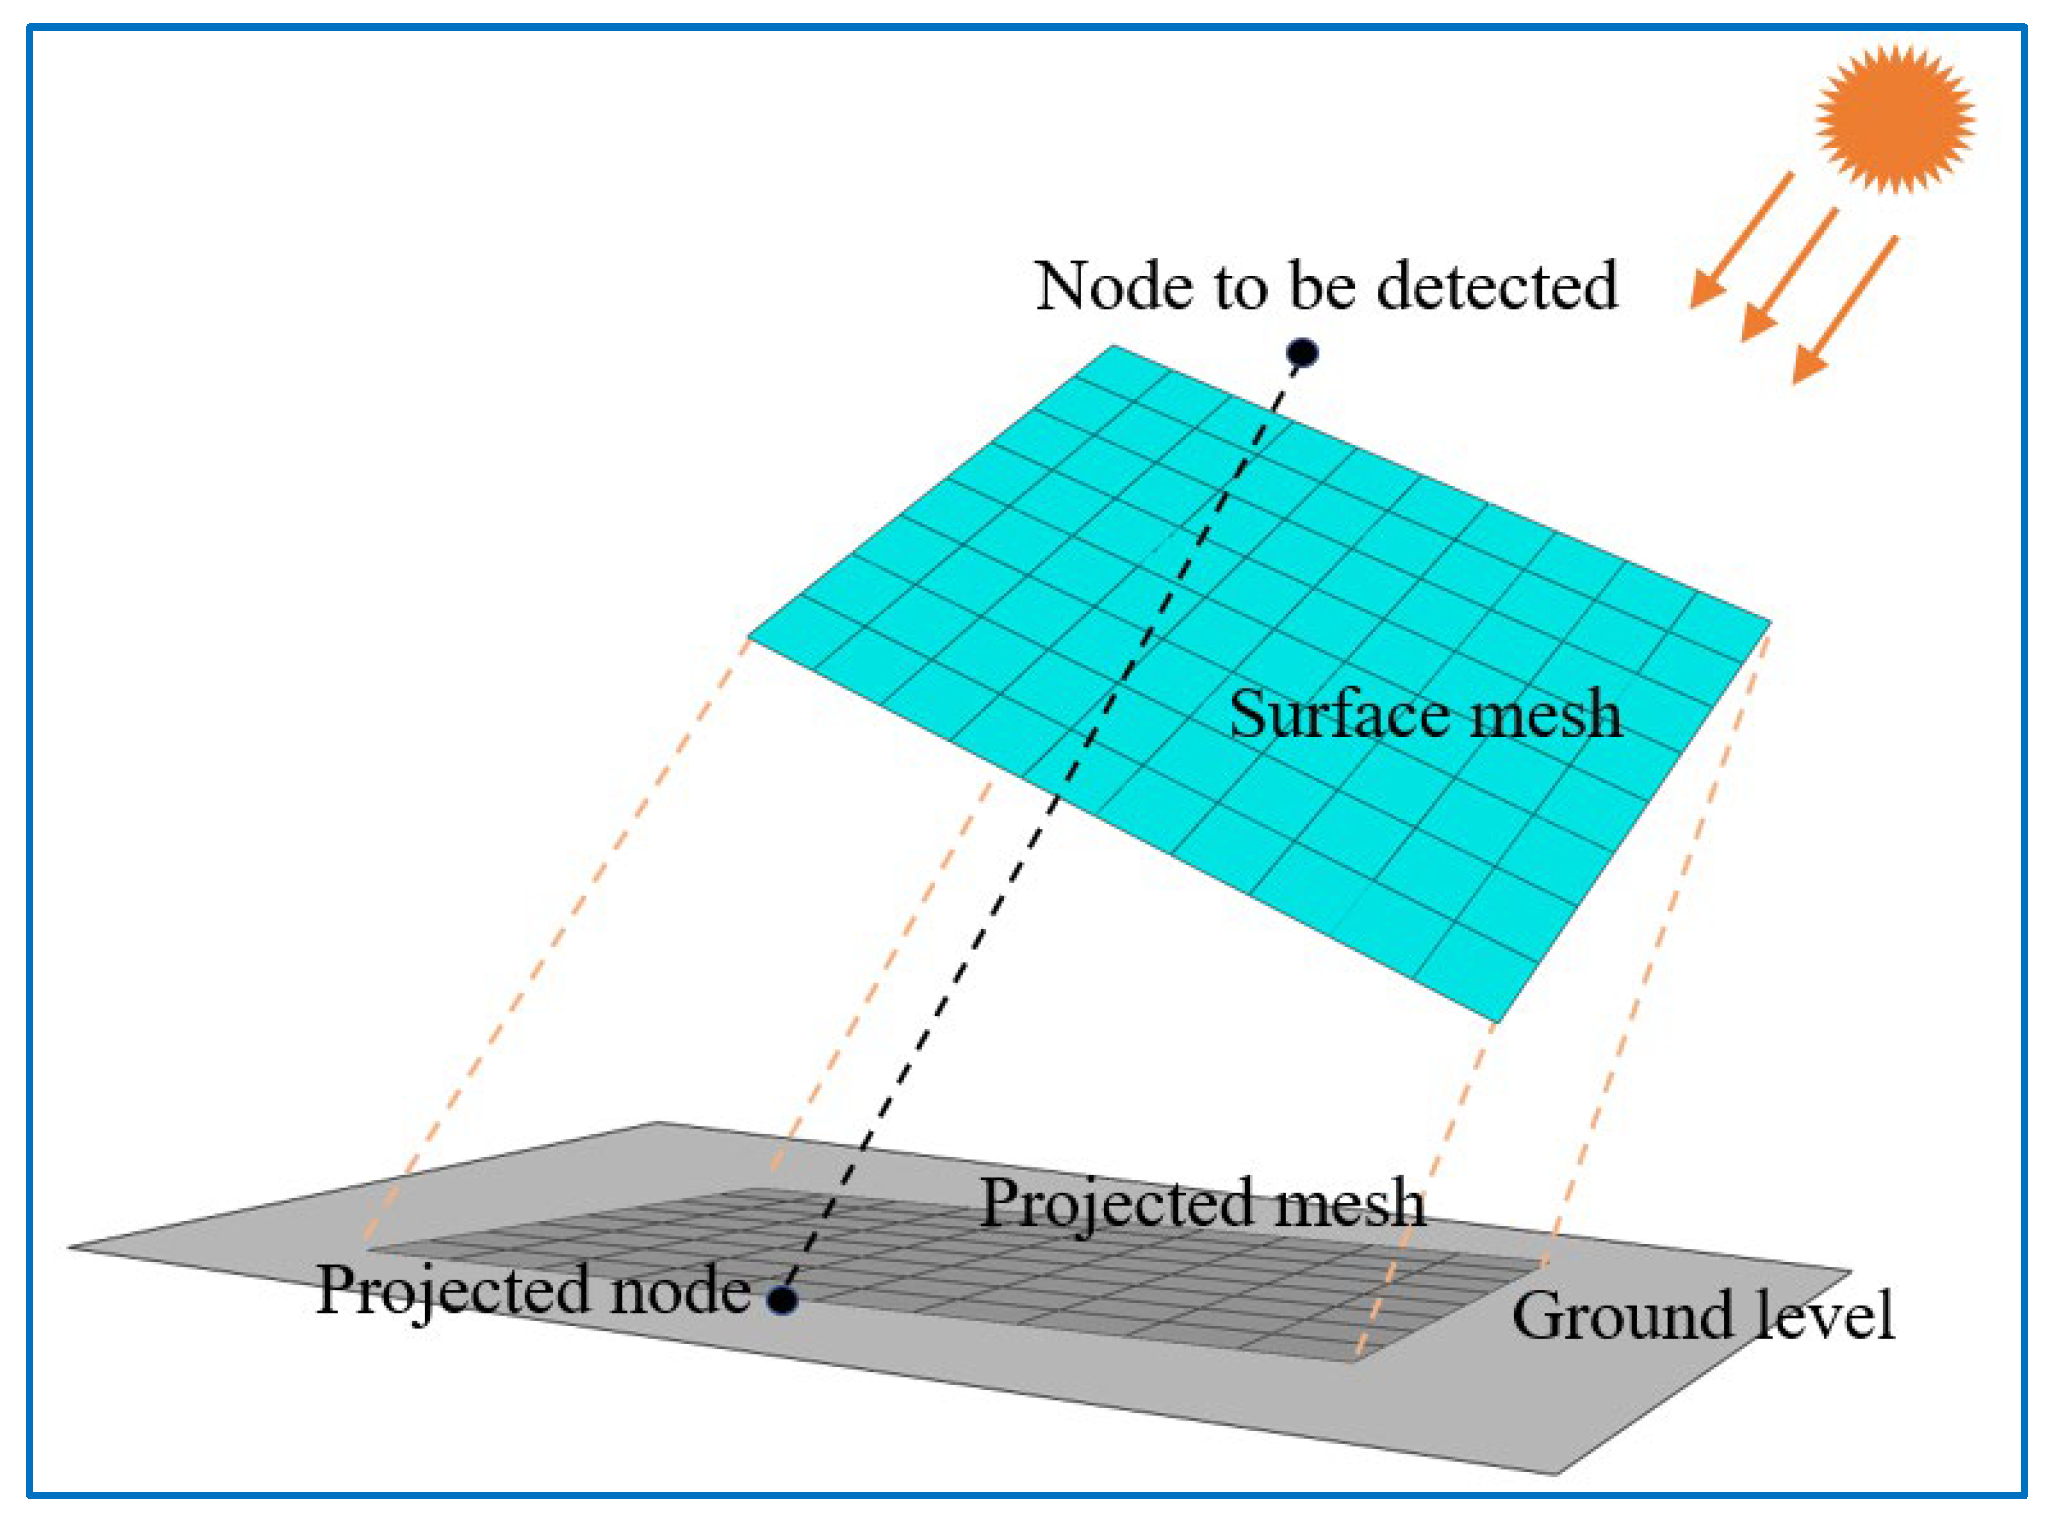
The face mesh of the 3D model was projected into a 2D plane mesh along the direction of the sunlight rays with the ground as the projection surface, The nodes to be detected were also projected in the same way.
(e)
The inclusion detection of the projection point and the projection mesh were carried out through a triangular barycentric coordinate method. The node to be detected was determined to be in a non-occluded state when the projection point was outside the projection mesh area; otherwise, the subsequent projection depth detection was carried out.
(f)
We calculated the projection depth of each node in the surface mesh used for projection and the node to be judged. The point to be detected was in a non-occluded state when the projection depth of the point to be judged was greater than the projection depth of each node in the surface mesh; otherwise, the point to be detected was in a mutual occlusion state.

3.2.2. Node Occlusion Detection

The projection method of the node to be detected and the structural surface grid are shown in Figure 7. The geodetic plane was used as the projection surface, and the illumination direction of the sunlight was used as the projection direction.
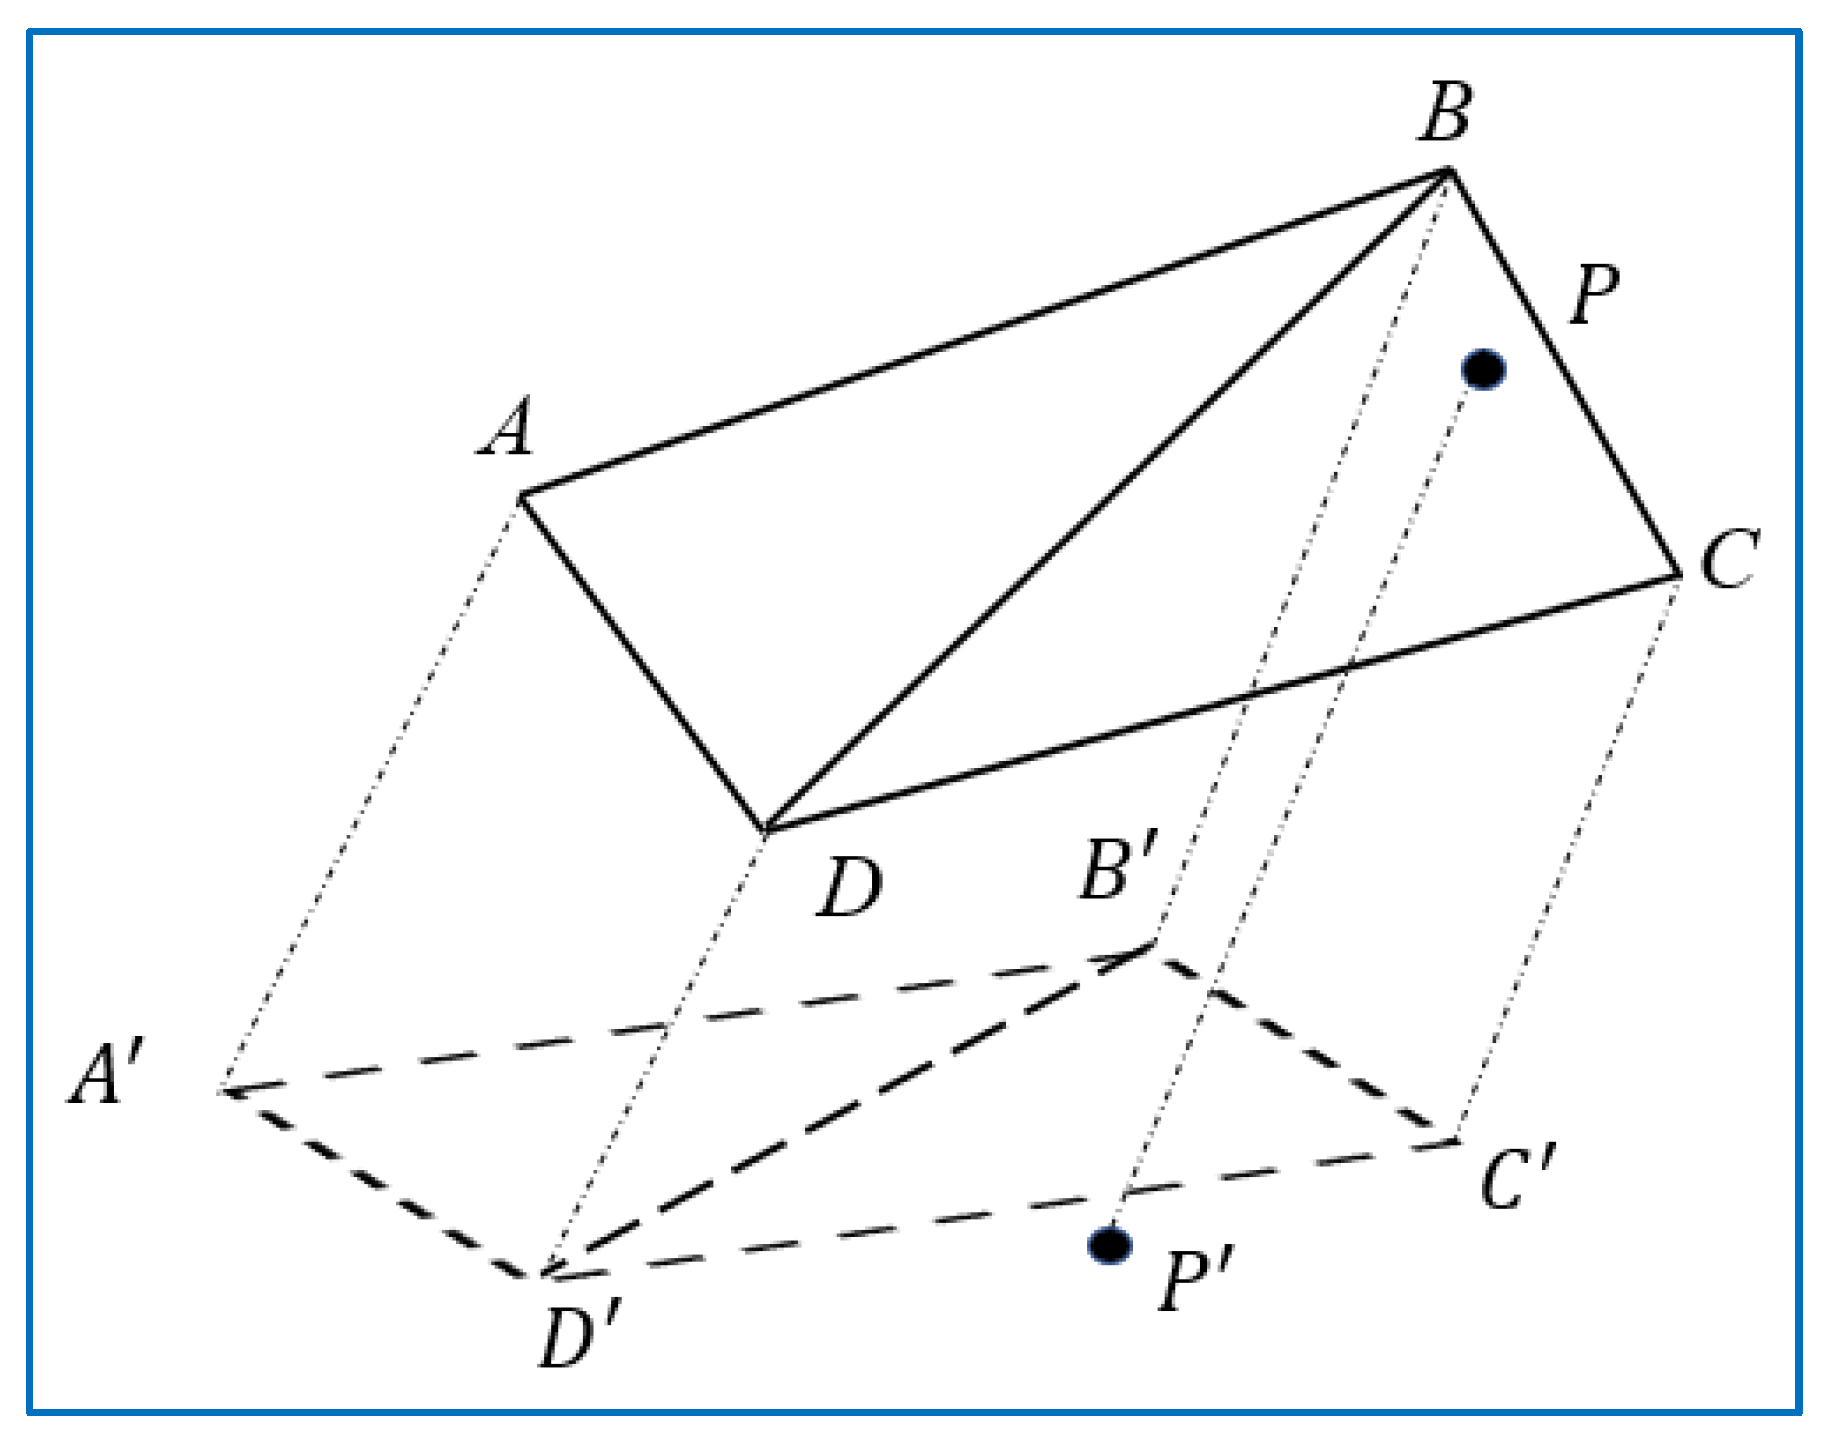
Projection point inclusion detection is a key step in the analysis of no occlusion and mutual occlusion. The primary goal was to determine the relationship between the projection node and a mesh projection. As shown in Figure 8, the projection node was outside the projection area of the surface mesh, according to the basic principle of light propagation along a straight line, which indicated that the surface mesh would not occlude the node to be detected.
In the process of projection point inclusion detection, if the quadrilateral mesh ( A B C D ) obtained by the projection in Figure 8 is directly used to determine this, the calculation process is more complicated. Therefore, the quadrilateral surface mesh obtained by projection was divided into two triangles ( A B D and B C D ) along a diagonal to determine projection point inclusion, respectively.
For the inclusion detection of projection points in triangular mesh elements, the triangle barycenter coordinate method (as shown in Figure 9) can be used for determination.
As shown in Figure 9, any point P in the planecan be expressed as:
P = D + u B D + v ( C D )
The point inside the triangle B C D should meet the conditions in Formula (30); otherwise, the point is outside the triangle B C D .
u 0 v 0 u + v 1
If the projection node is within the projection area of the mesh, the occlusion judgment needs to be made according to the projection depth of the face mesh node and the node to be detected. The projection depth is the distance between each node and its corresponding projection point, as shown in Figure 8, which is the length of D D , B B , C C , and P P .

3.3. Calculation Process of Sunshine Temperature Field

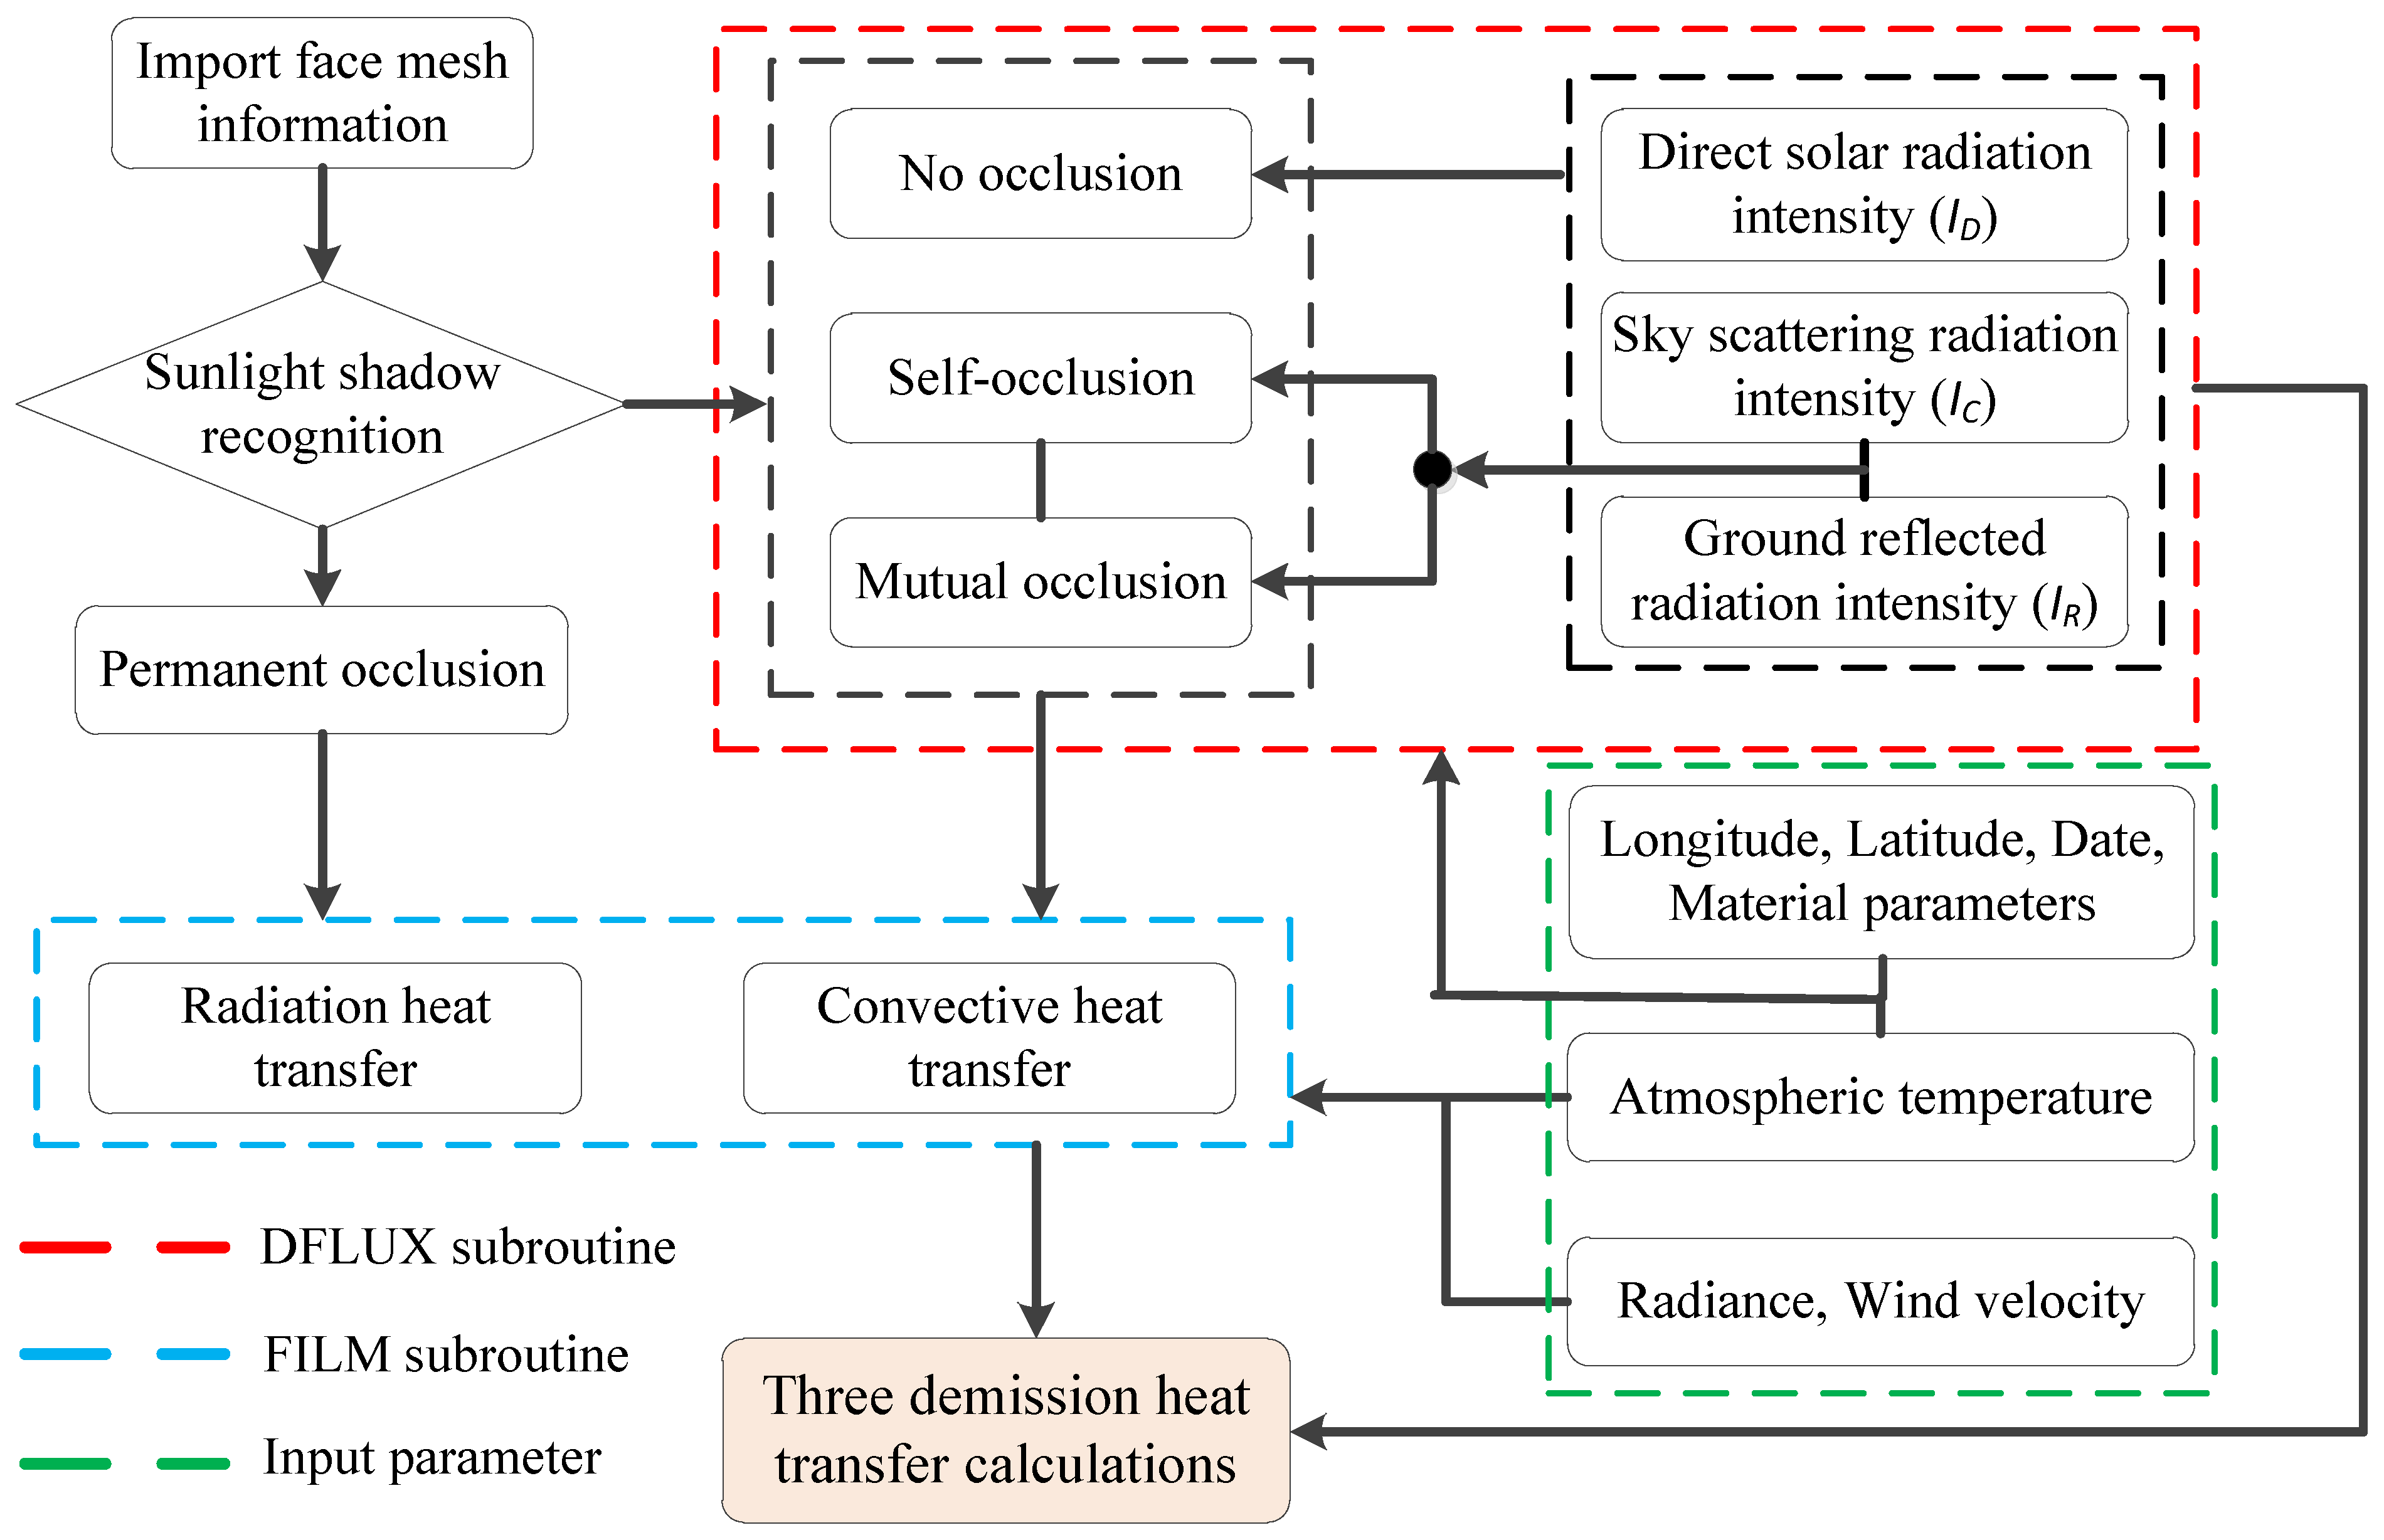
In this paper, the DFLUX subroutine and FILM subroutine provided by the Abaqus platform are used for the secondary development of the software to realize the calculation of the three-dimensional sunshine temperature field of the structure. The DFLUX subroutine can apply the surface heat source controlled by the user-defined heat source equation to the selected structural surface [36]. In the DFLUX subroutine, the sunshine shadow recognition algorithm described in Section 3.2.1 was introduced to load the solar radiation heat load according to the real-time sunshine shadow recognition results. The FILM subroutine can define the heat transfer coefficient related to the ambient temperature and model parameters [36]. Therefore, the heat transfer coefficient generated by the convection and radiation heat transfer between the structural surface and the environment was loaded by the FILM subroutine, and the specific loading is shown in Figure 10. First, we input the geographic location information: date, the extreme value of ambient temperature, wind speed, material emissivity, and other parameters. Secondly, we completed the real-time sunlight shadow recognition of the structure through the shadow occlusion recognition algorithm in Section 3.2. Finally, the corresponding boundary conditions were applied to the surface of the structure through the calculation theory of heat transfer boundary conditions in Section 2.1, Section 2.2 and Section 2.3, and the three-dimensional sunshine temperature field of the structure was calculated using the finite element method.

3.4. Sunlight Shadow Display Method

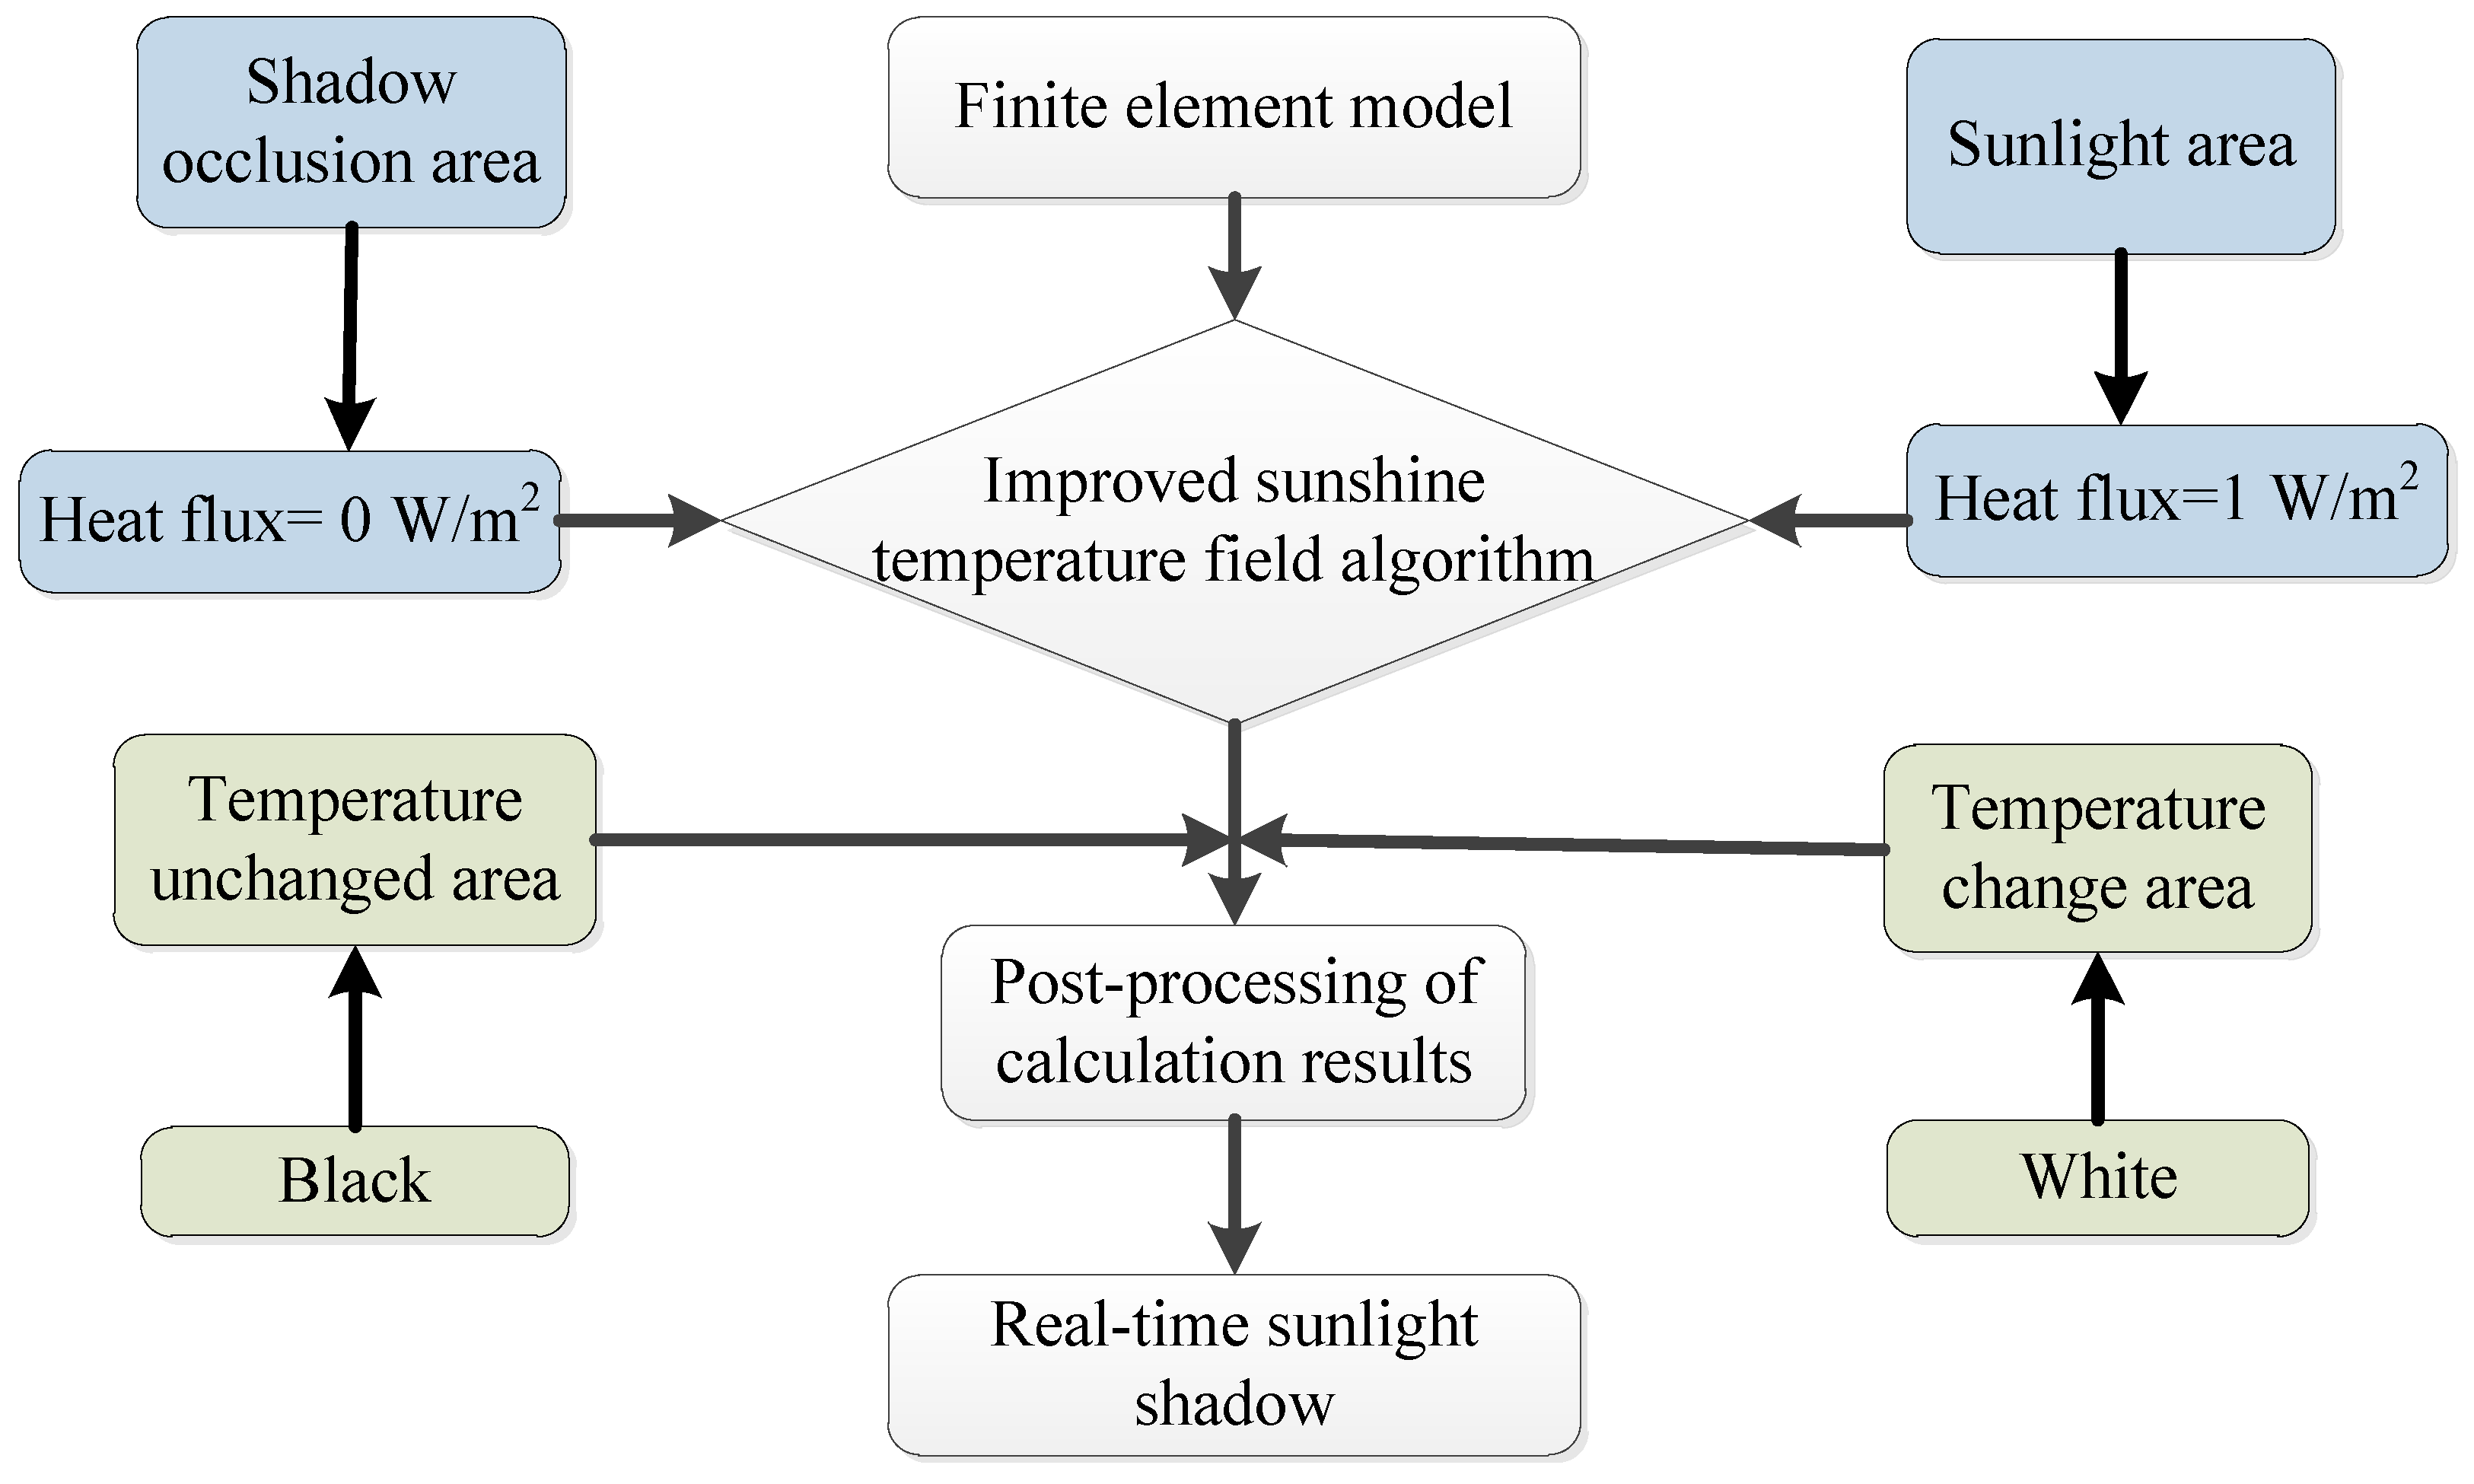
It is necessary to display the shadow occlusion of the structure in order to display and judge the recognition effect of a real-time shadow. Because of this, the three-dimensional temperature field calculation algorithm considering real-time shadow occlusion in Section 3.3 was improved, and the shadow recognition effect was displayed by combining the cloud image customization function in the post-processing part of Abaqus. The heat flux density in the sunshine area was set to 1 W/m2, and the heat flux density in the shadow area was set to 0 W/m2 in the improved calculation algorithm; in the cloud map custom setting in the post-processing part of Abaqus, the cloud map was divided into two colors: black and white. White represented the sunshine area with heat flow, and black represented the shadow occlusion area without heat flow. Then, the real-time shadow occlusion situation recognized by the algorithm was drawn. The specific operation process is shown in Figure 11.

4. Algorithm Verification

The experimental model in reference [37] was used as a calculation example for the comparative demonstration to verify the accuracy of sunshine shadow recognition and temperature field simulation in the three-dimensional sunshine temperature field calculation algorithm considering sunshine shadow occlusion proposed in this paper.

4.1. Example of Calculation Introduction

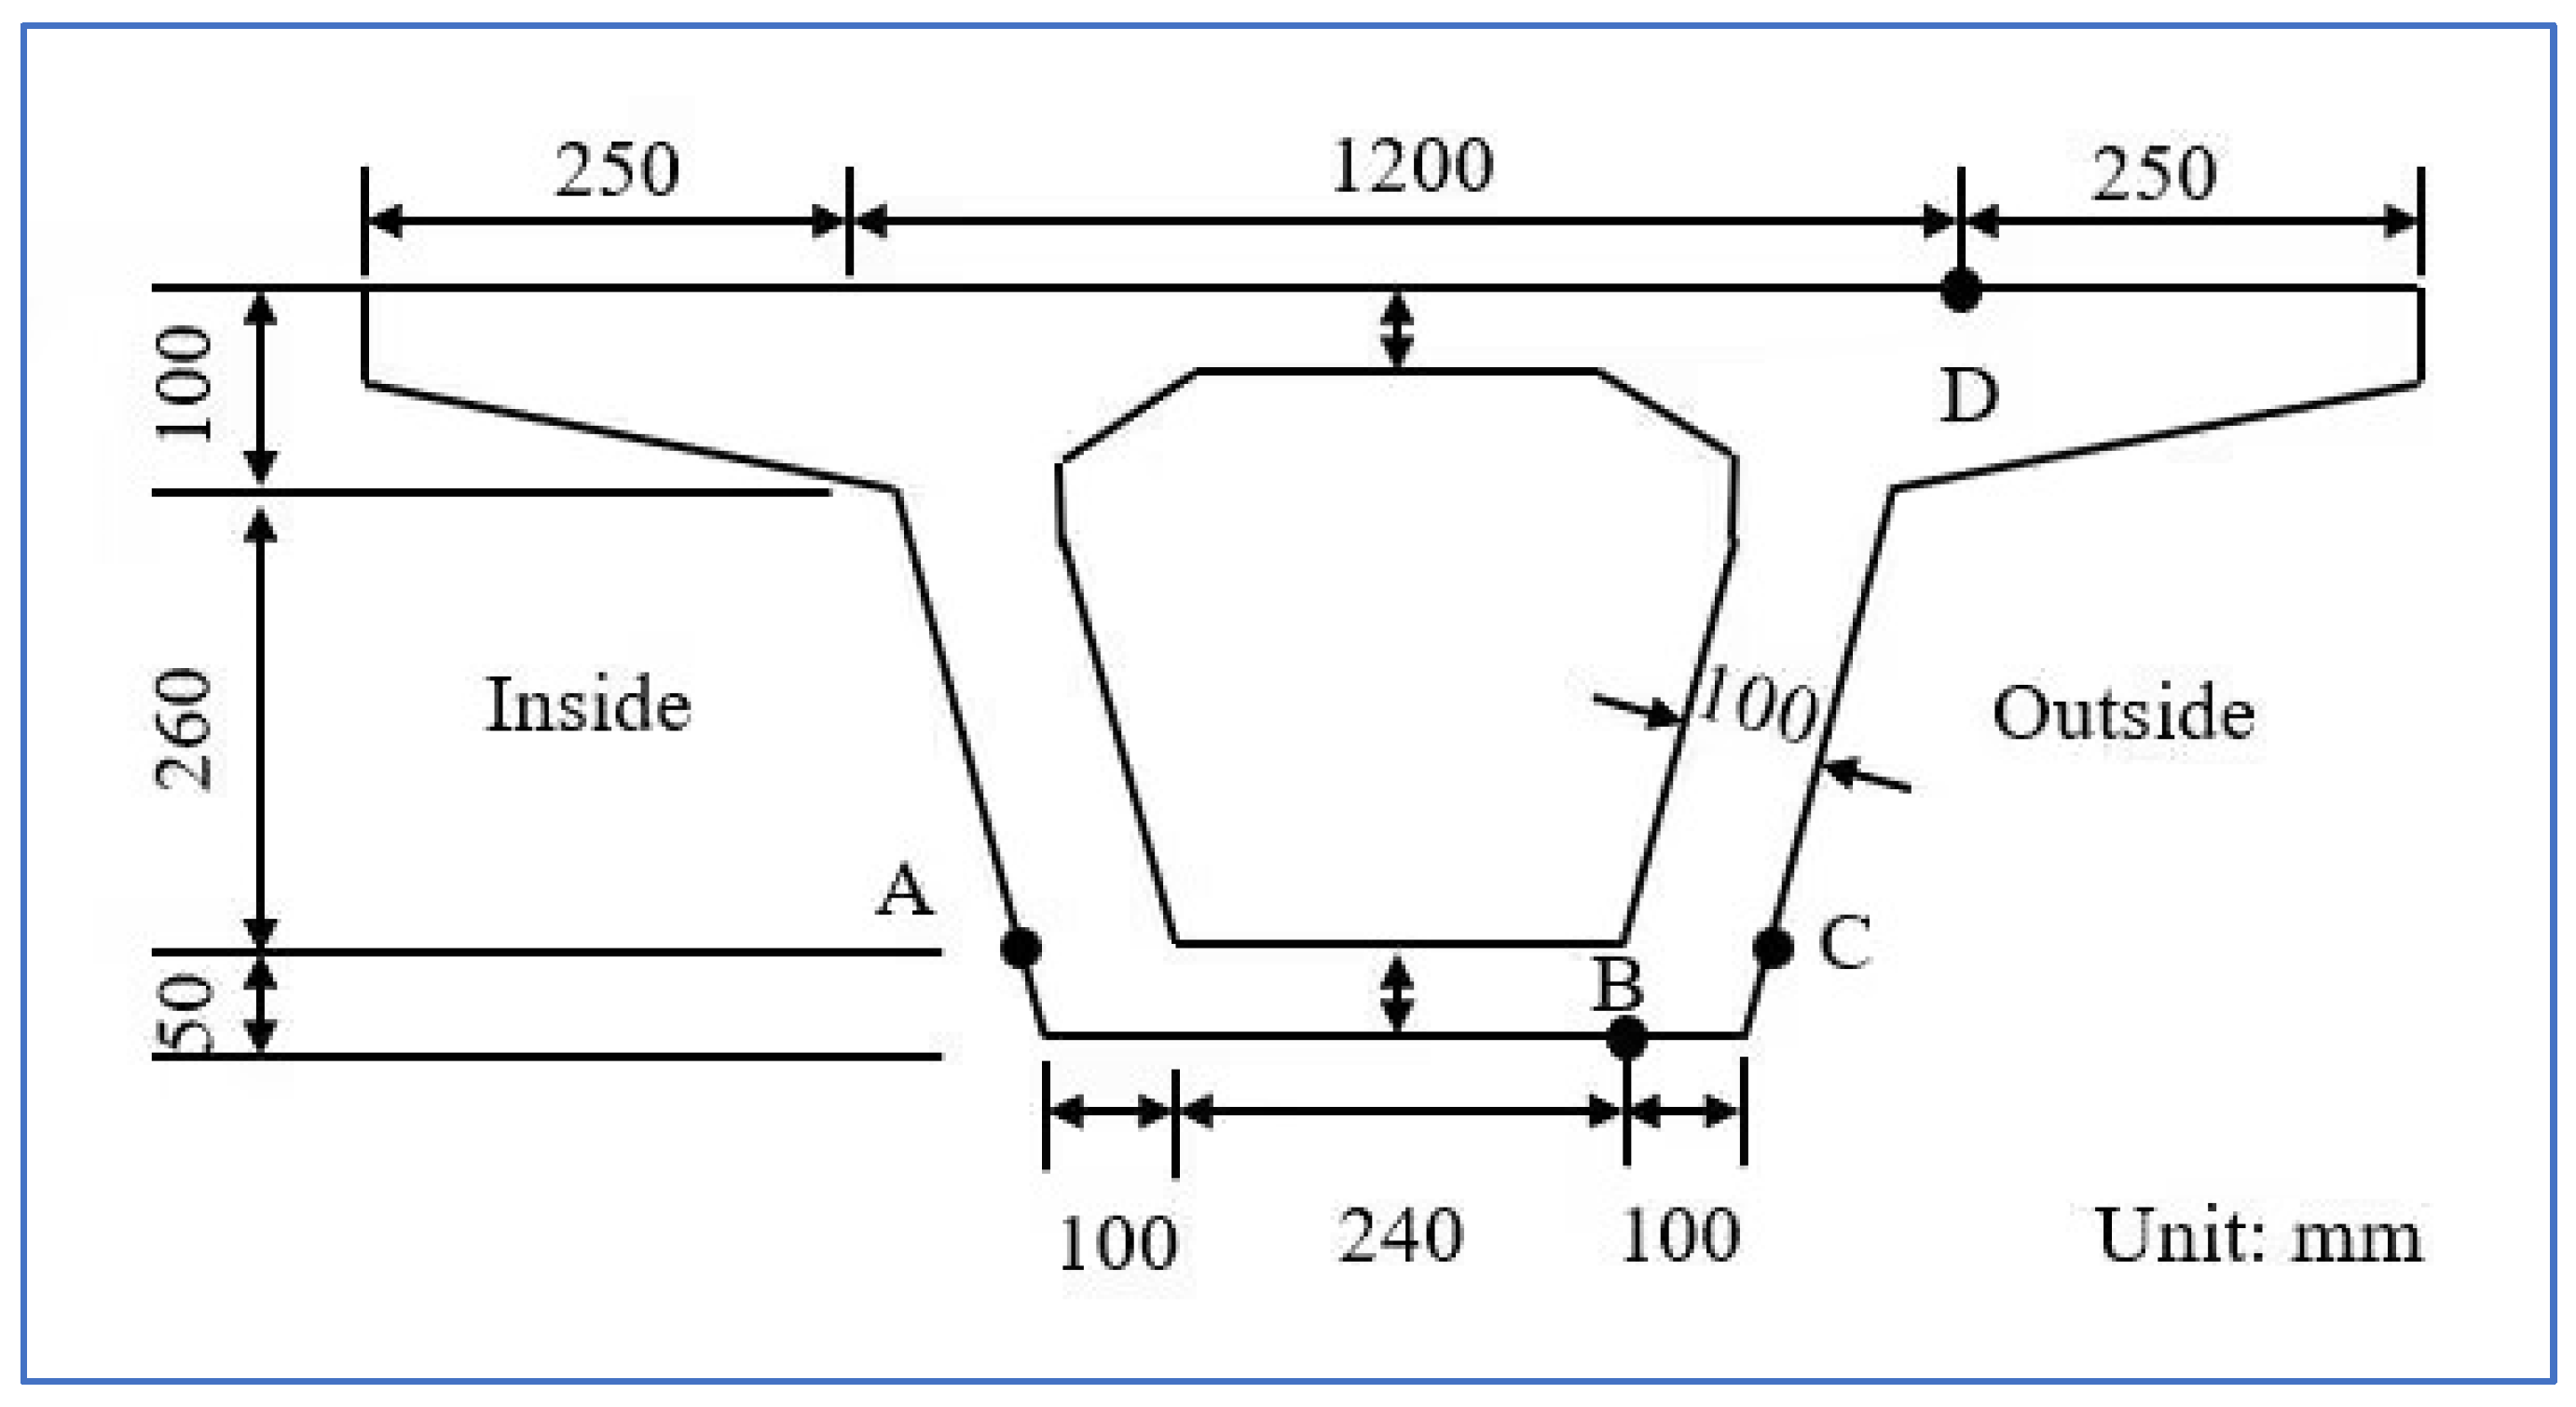
The experimental model was a concrete-curve box girder. The total span along the center line of the bridge is 10 m, the radius of curvature was 12 m, and the corresponding central angle of the center line of the bridge is 48°. The main girder was a box section with a single cell, the width of the upper roof is 1.7 m, the width of the lower floor is 0.62 m, the minimum vertical thickness of the web is 0.1 m, and the height of the box girder is 0.36 m. The measurement points of the box girder section are arranged as shown in Figure 12. The test model bridge is located at 118°38′ east longitude and 32°05′ north latitude, showing an east–west trend. The finite element model and meshing are shown in Figure 13. The thermal parameters of the concrete materials used in the model are shown in Table 1.

4.2. Data Analysis

4.2.1. Shadow Occlusion Verification

The shadow shielding relationship between the extended flange and the web of the box girder is shown in Figure 14. The following formula [38] can be used to calculate the theoretical value of the shadow shielding height of the box girder web:
L s = L c tan α s tan α s cos β + sin β cos γ γ s
where L s is the height of sunshine shadow occlusion; L c is the width of the box girder flange; α s is the solar elevation angle; β is the inclination angle of the outer surface of the box girder web relative to the horizontal plane; γ is the angle between the normal direction of the outer surface of the web and the south direction; and γ s is the solar azimuth angle.
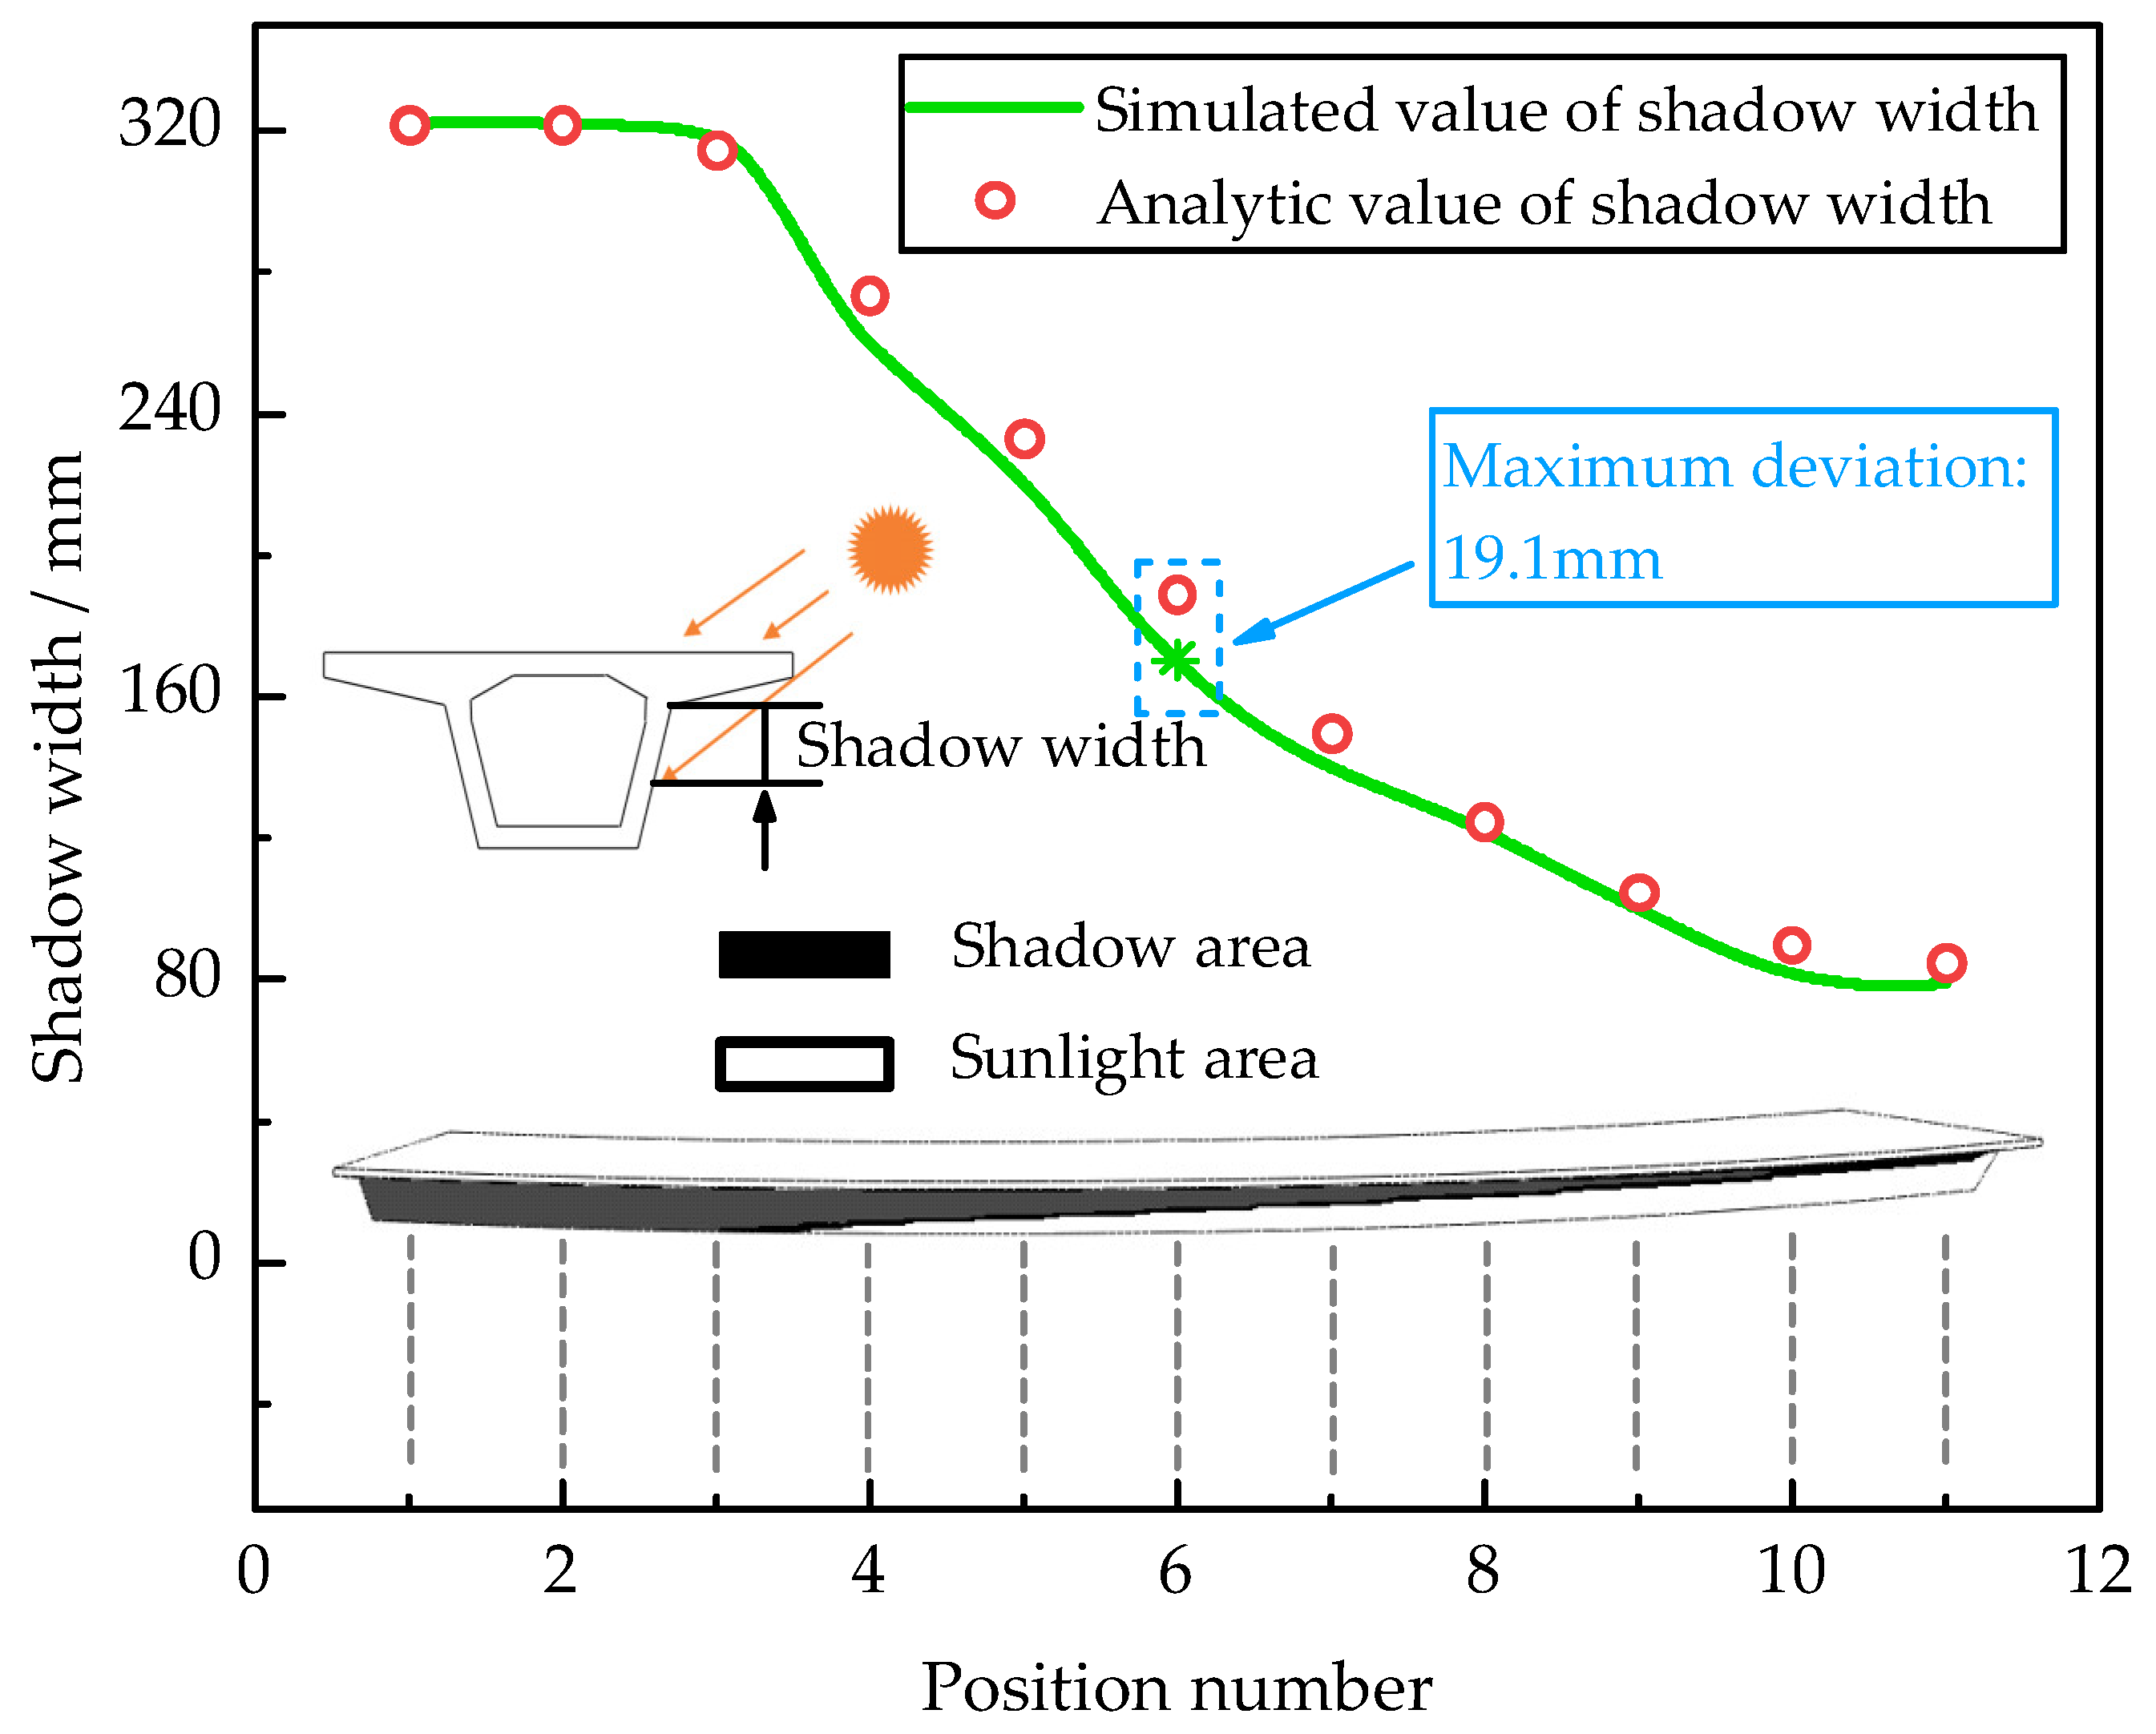
The sunshine shadow distribution of the sunny side web of the verification example at 7:00 a.m. on 14 August 2013 was displayed according to the shadow display method described in Section 3.4, and the shading height of the sunny side web shadow recognized by the algorithm in this paper was compared with the theoretical value calculated by Formula (15) to verify the accuracy of the sunshine shadow recognition algorithm proposed in this paper, as shown in Figure 15. From the diagram, it can be seen that the simulated value of sunshine shadow length was in good agreement with the theoretical value; the maximum error between the theoretical calculation value and the simulated value of sunshine shadow was only 19.1 mm. Therefore, the sunshine shadow recognition algorithm proposed in this paper can accurately identify the sunshine shadow of the structural surface.

4.2.2. Comparative Analysis of Temperature Field Calculation Results

The temperature field simulation value from 0 h on 13 August 2013 to 24 h on 14 August 2013 was compared with the measured value of the temperature field in the corresponding period in the reference to verify the accuracy of the three-dimensional sunshine temperature field algorithm proposed in this paper. At the same time, the temperature field calculation results of the first three days were imported into the calculation model as the initial temperature field to eliminate the influence of the initial temperature of the model on the simulation results. The atmospheric temperature data for the selected date are shown in Table 2. We selected the measuring points A, B, C, and D of the midspan section of the experimental model to analyze the temperature field changes of the shading side web, bottom plate, sunward side web, and top plate, respectively. The measuring point arrangement is shown in Figure 12.
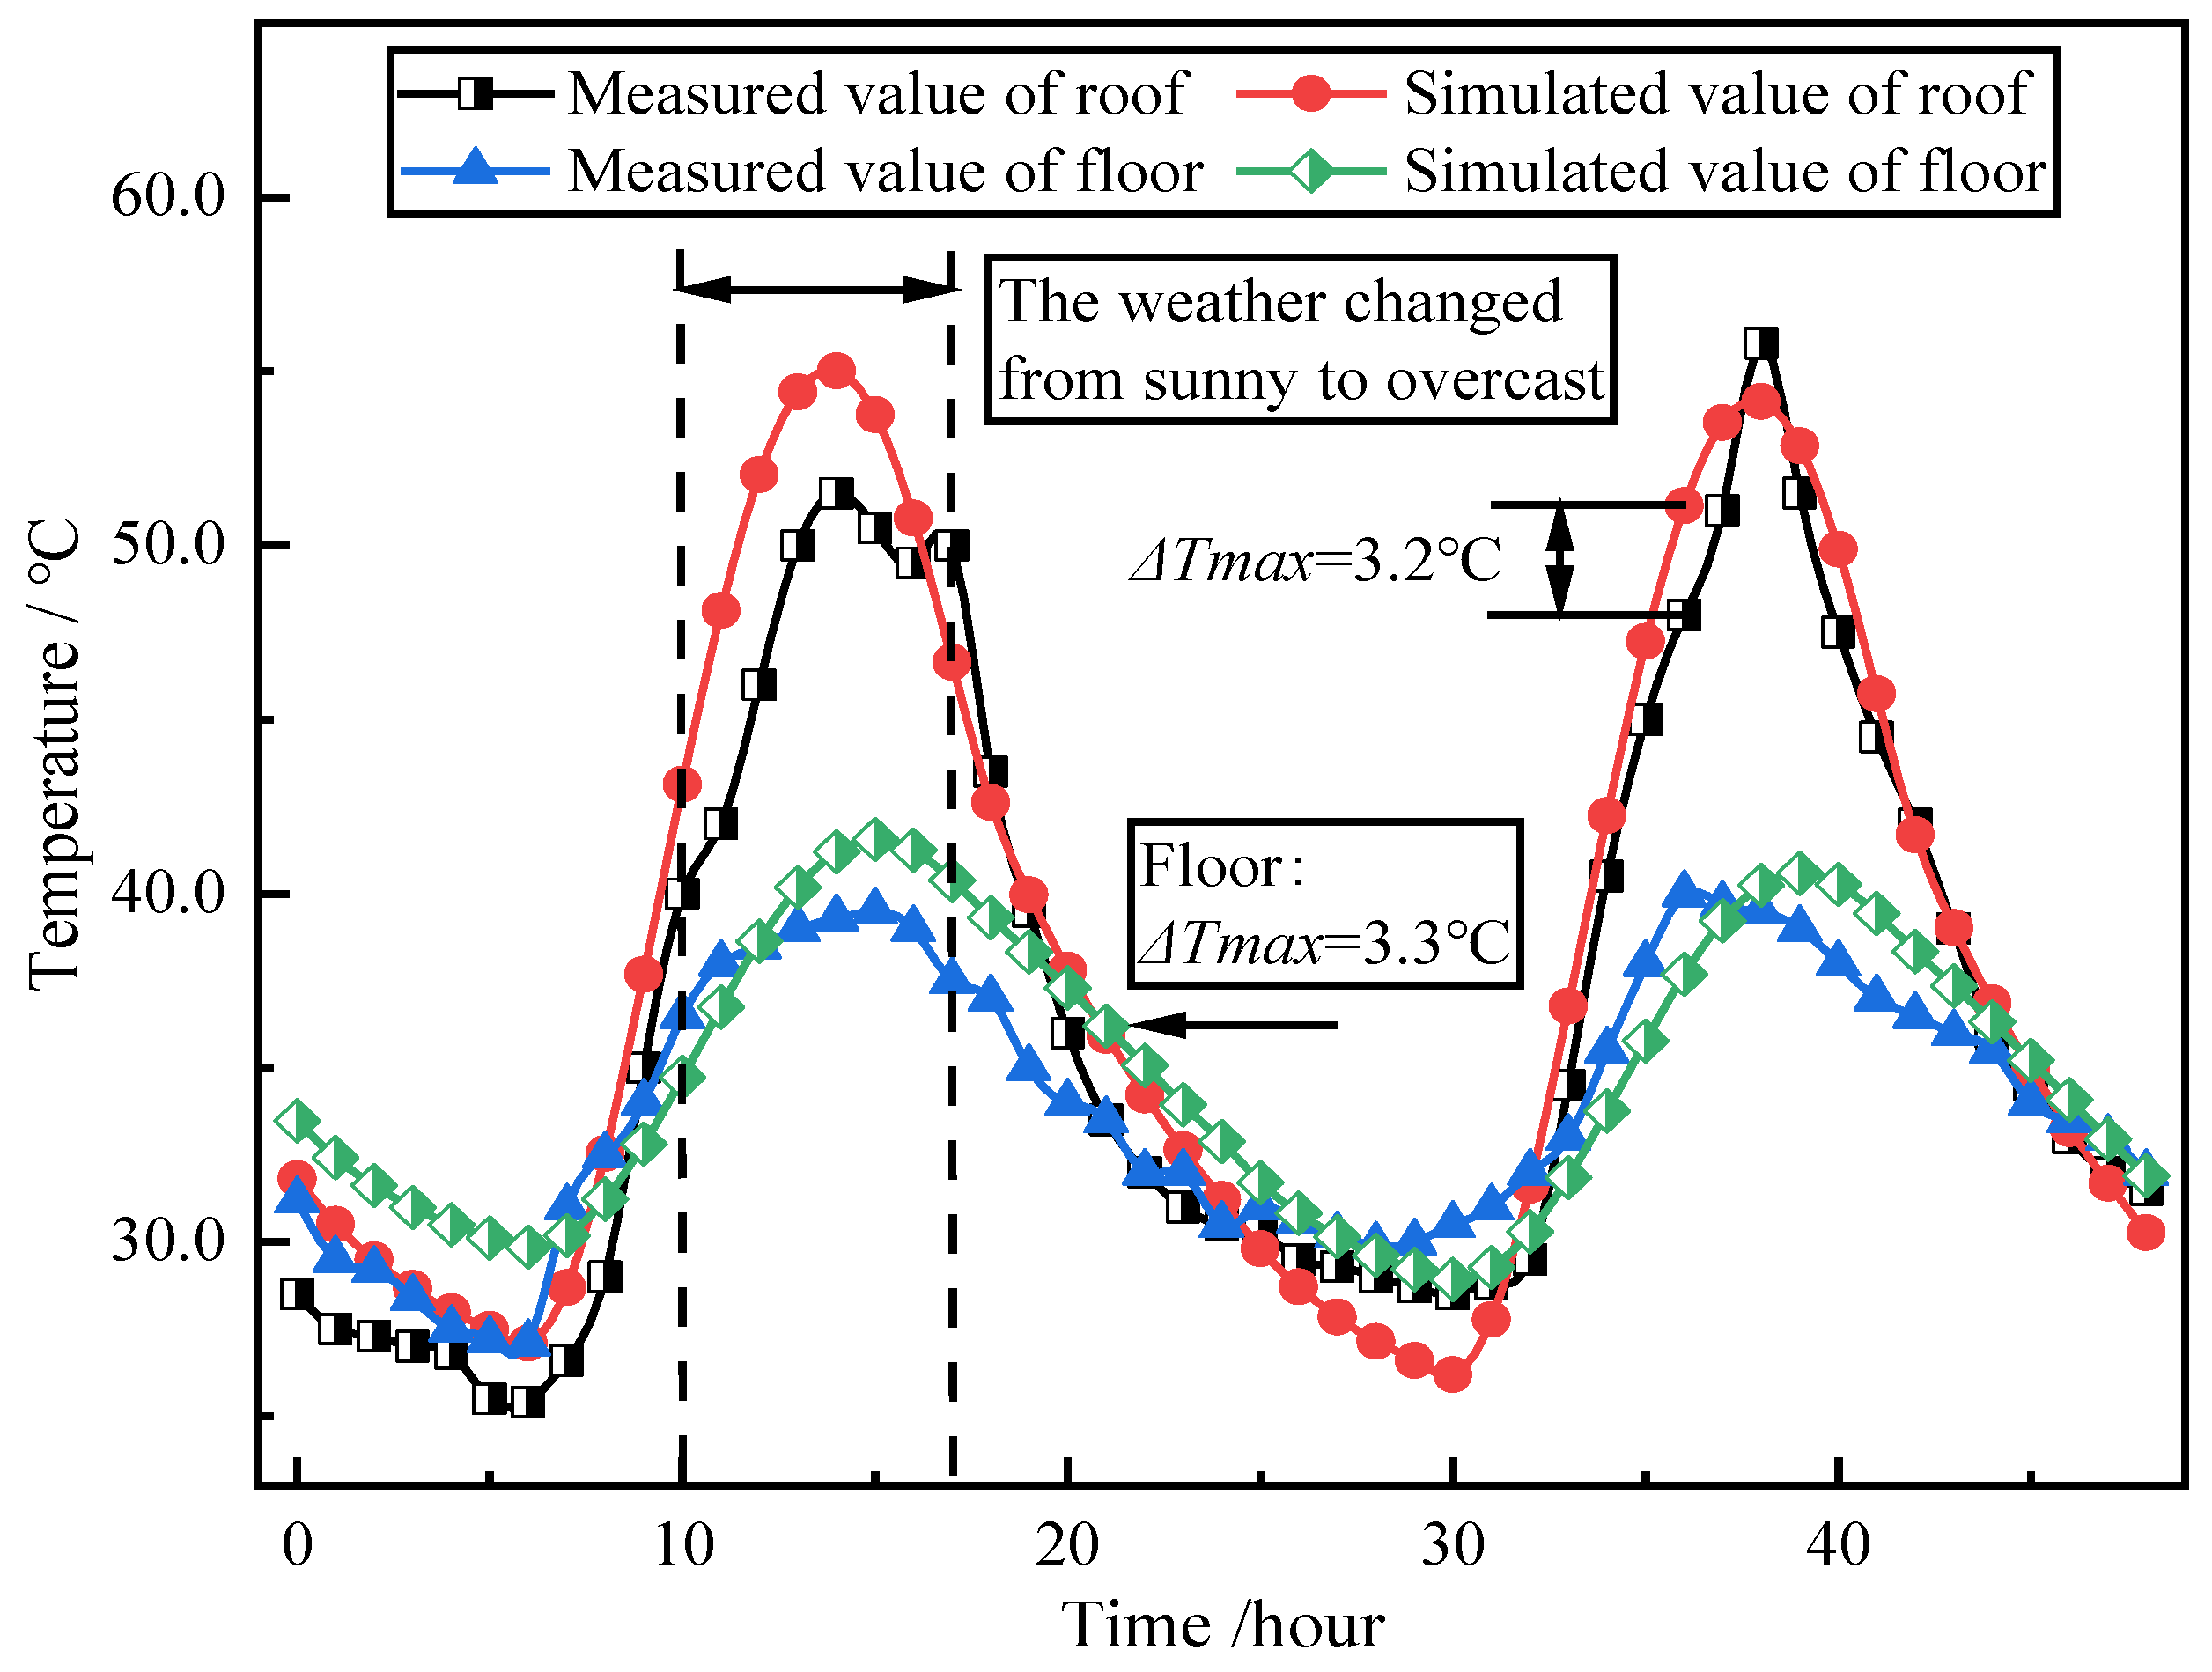
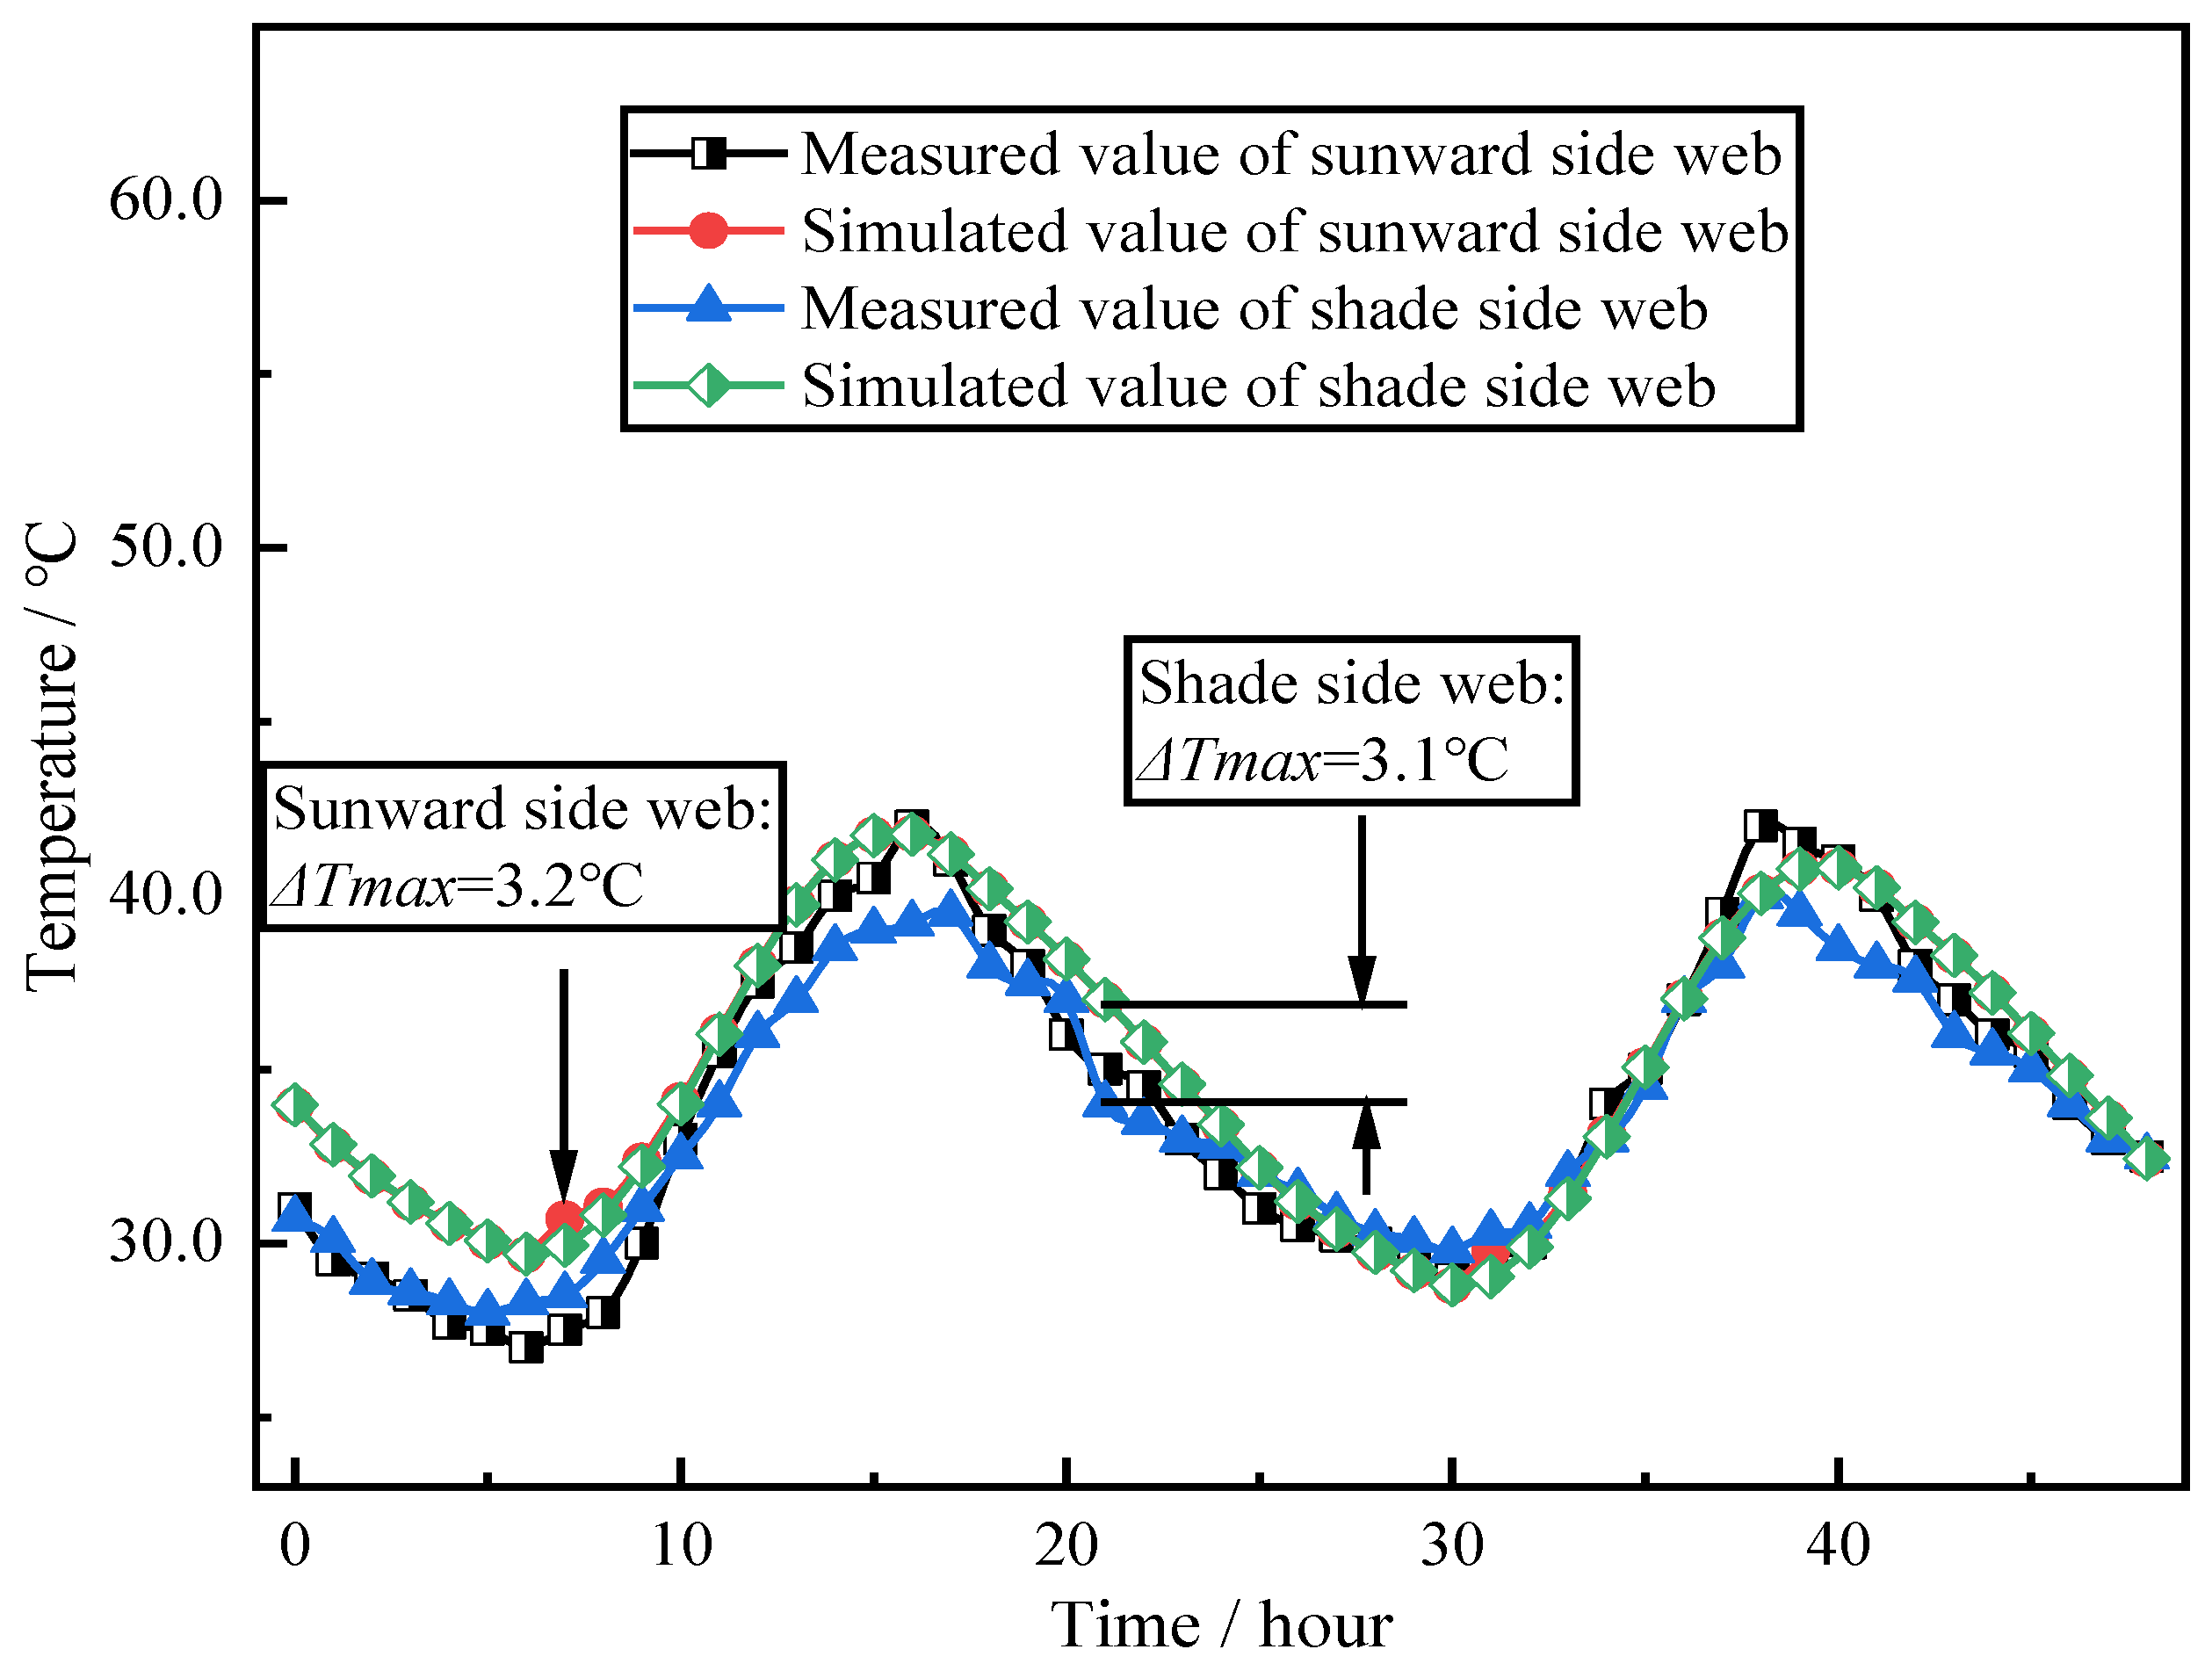
Figure 16 and Figure 17 show a comparison of temperature field simulation results from the three-dimensional sunshine temperature field algorithm proposed in this paper and measured results from reference [37]. In the figure, the simulation results of the temperature field are the same as the measured results. In addition to the period from 10 a.m. to 5 p.m. on 13 August, the simulation results of the roof were quite different from the measured results. At the other locations, the two were more consistent. The maximum errors between the simulated and measured values of the roof, floor, sunny side web, and shade side web temperatures were 3.2 °C, 3.3 °C, 3.2 °C, and 3.1 °C, respectively. During the period from 10 a.m. to 17 p.m. on 13 August, the weather turned from sunny to cloudy, and the direct solar radiation was weakened, resulting in a large difference between the simulation results and the measured results of the roof.
To sum up, the calculation results of the sunshine shadow and temperature field obtained by the calculation algorithm of the three-dimensional temperature field of the bridge structure considering the influence of the sunshine shadow proposed in this paper are consistent with the actual situation and can be used for the simulation of the three-dimensional sunshine temperature field of the actual bridge structure and the analysis of its temperature effect.

5. Temperature Field Analysis of Concrete Bridge Tower

5.1. Engineering Background

The three-dimensional sunshine temperature field research was carried out by taking the ultra-high concrete cable tower of a bridge as a calculation case to analyze the distribution law of the sunshine temperature field of a concrete bridge tower. The concrete cable tower adopts a thin-walled hollow structure. The total height of the bridge tower is 242.8 m (the height from the cushion cap to the top of the tower). The wall thickness of the upper tower column is 1.1 m, and the wall thicknesses of the middle tower column and the lower tower column are 1.2 m. The specific structural form and size are shown in Figure 18. The concrete bridge tower is located at 116°20′ E and 39°56′ N. The material characteristic parameters required for the calculation of the temperature field of the bridge tower are shown in Table 3 below.
In this paper, the time selected for the temperature field calculation of the bridge tower was 19 August 2022, and the temperature field results, calculated continuously three days before the calculation date, were used as the initial temperature field and imported into the calculation model to eliminate the impact of the initial temperature field on the calculation results. The atmospheric temperature data for the calculation period are shown in Table 4.

5.2. Temperature Field Analysis

5.2.1. Surface Temperature Difference Analysis

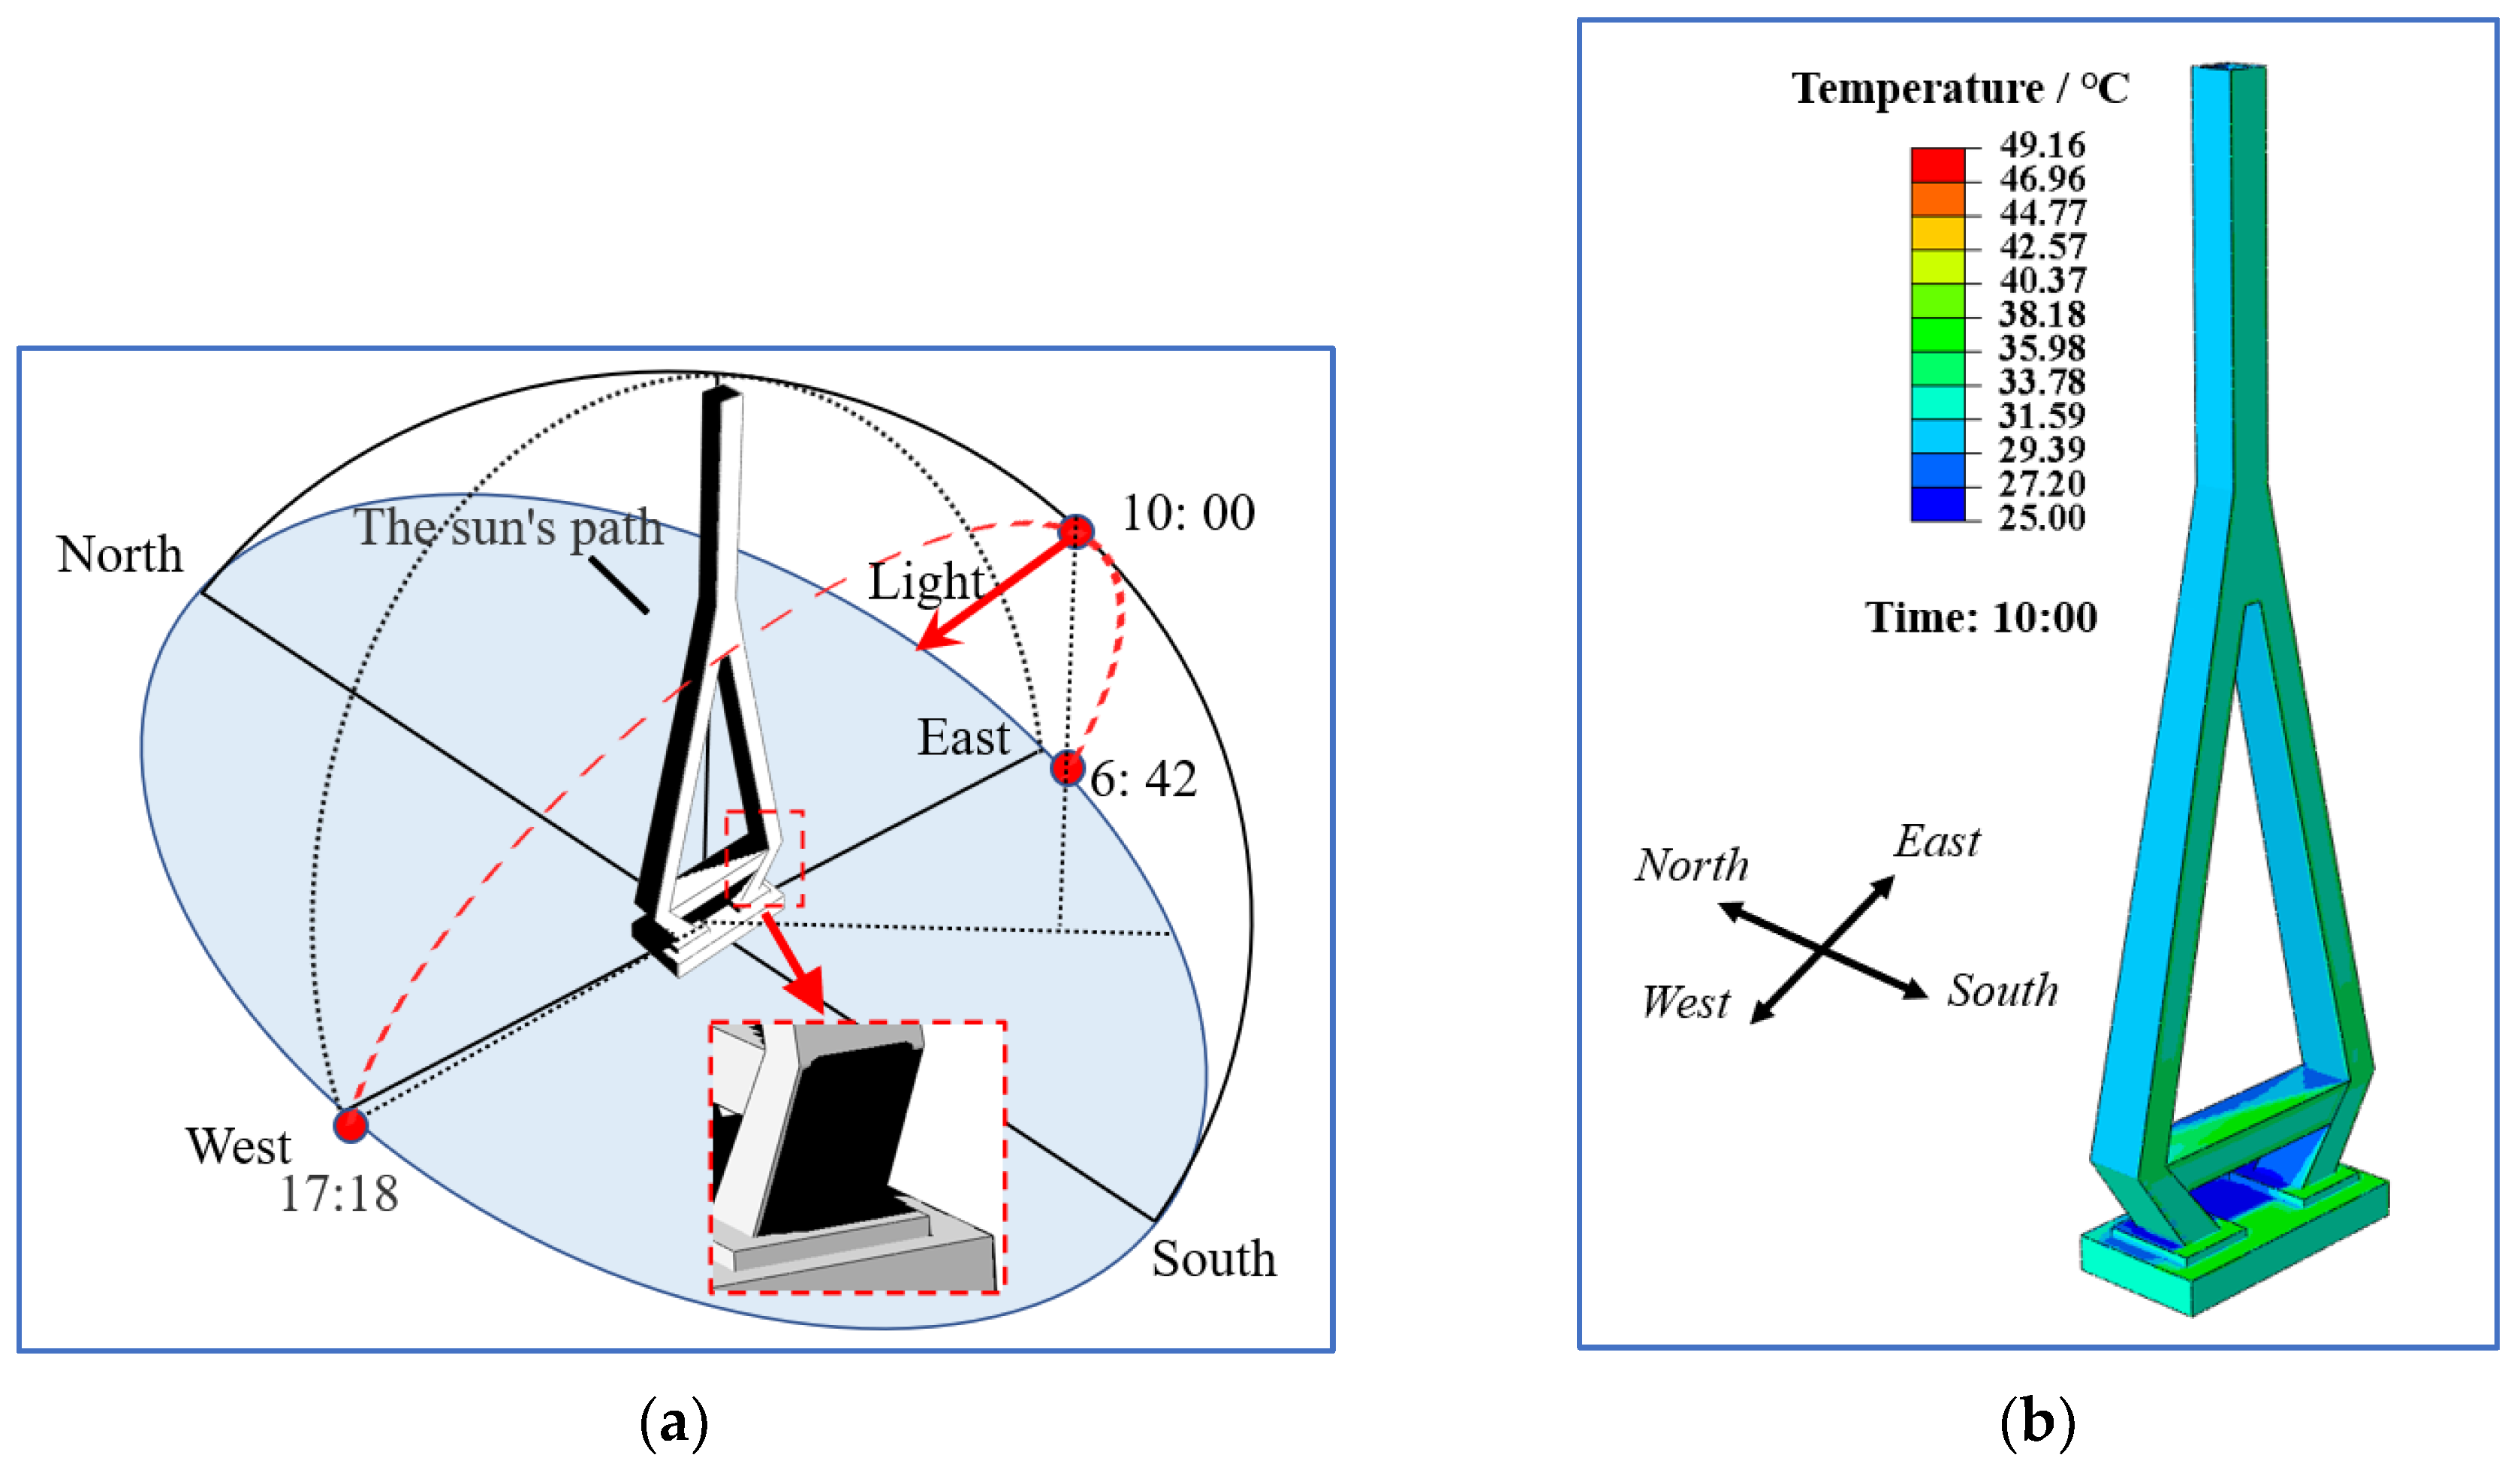
Figure 19 shows the shaded state of the bridge tower surface at 10:00 a.m. and the temperature field cloud map at this time. It can be seen from the diagram that the shadow occlusion has a significant effect on the sunshine temperature field of the structure, and the temperature difference between the sunlight area and the shadow area is large.
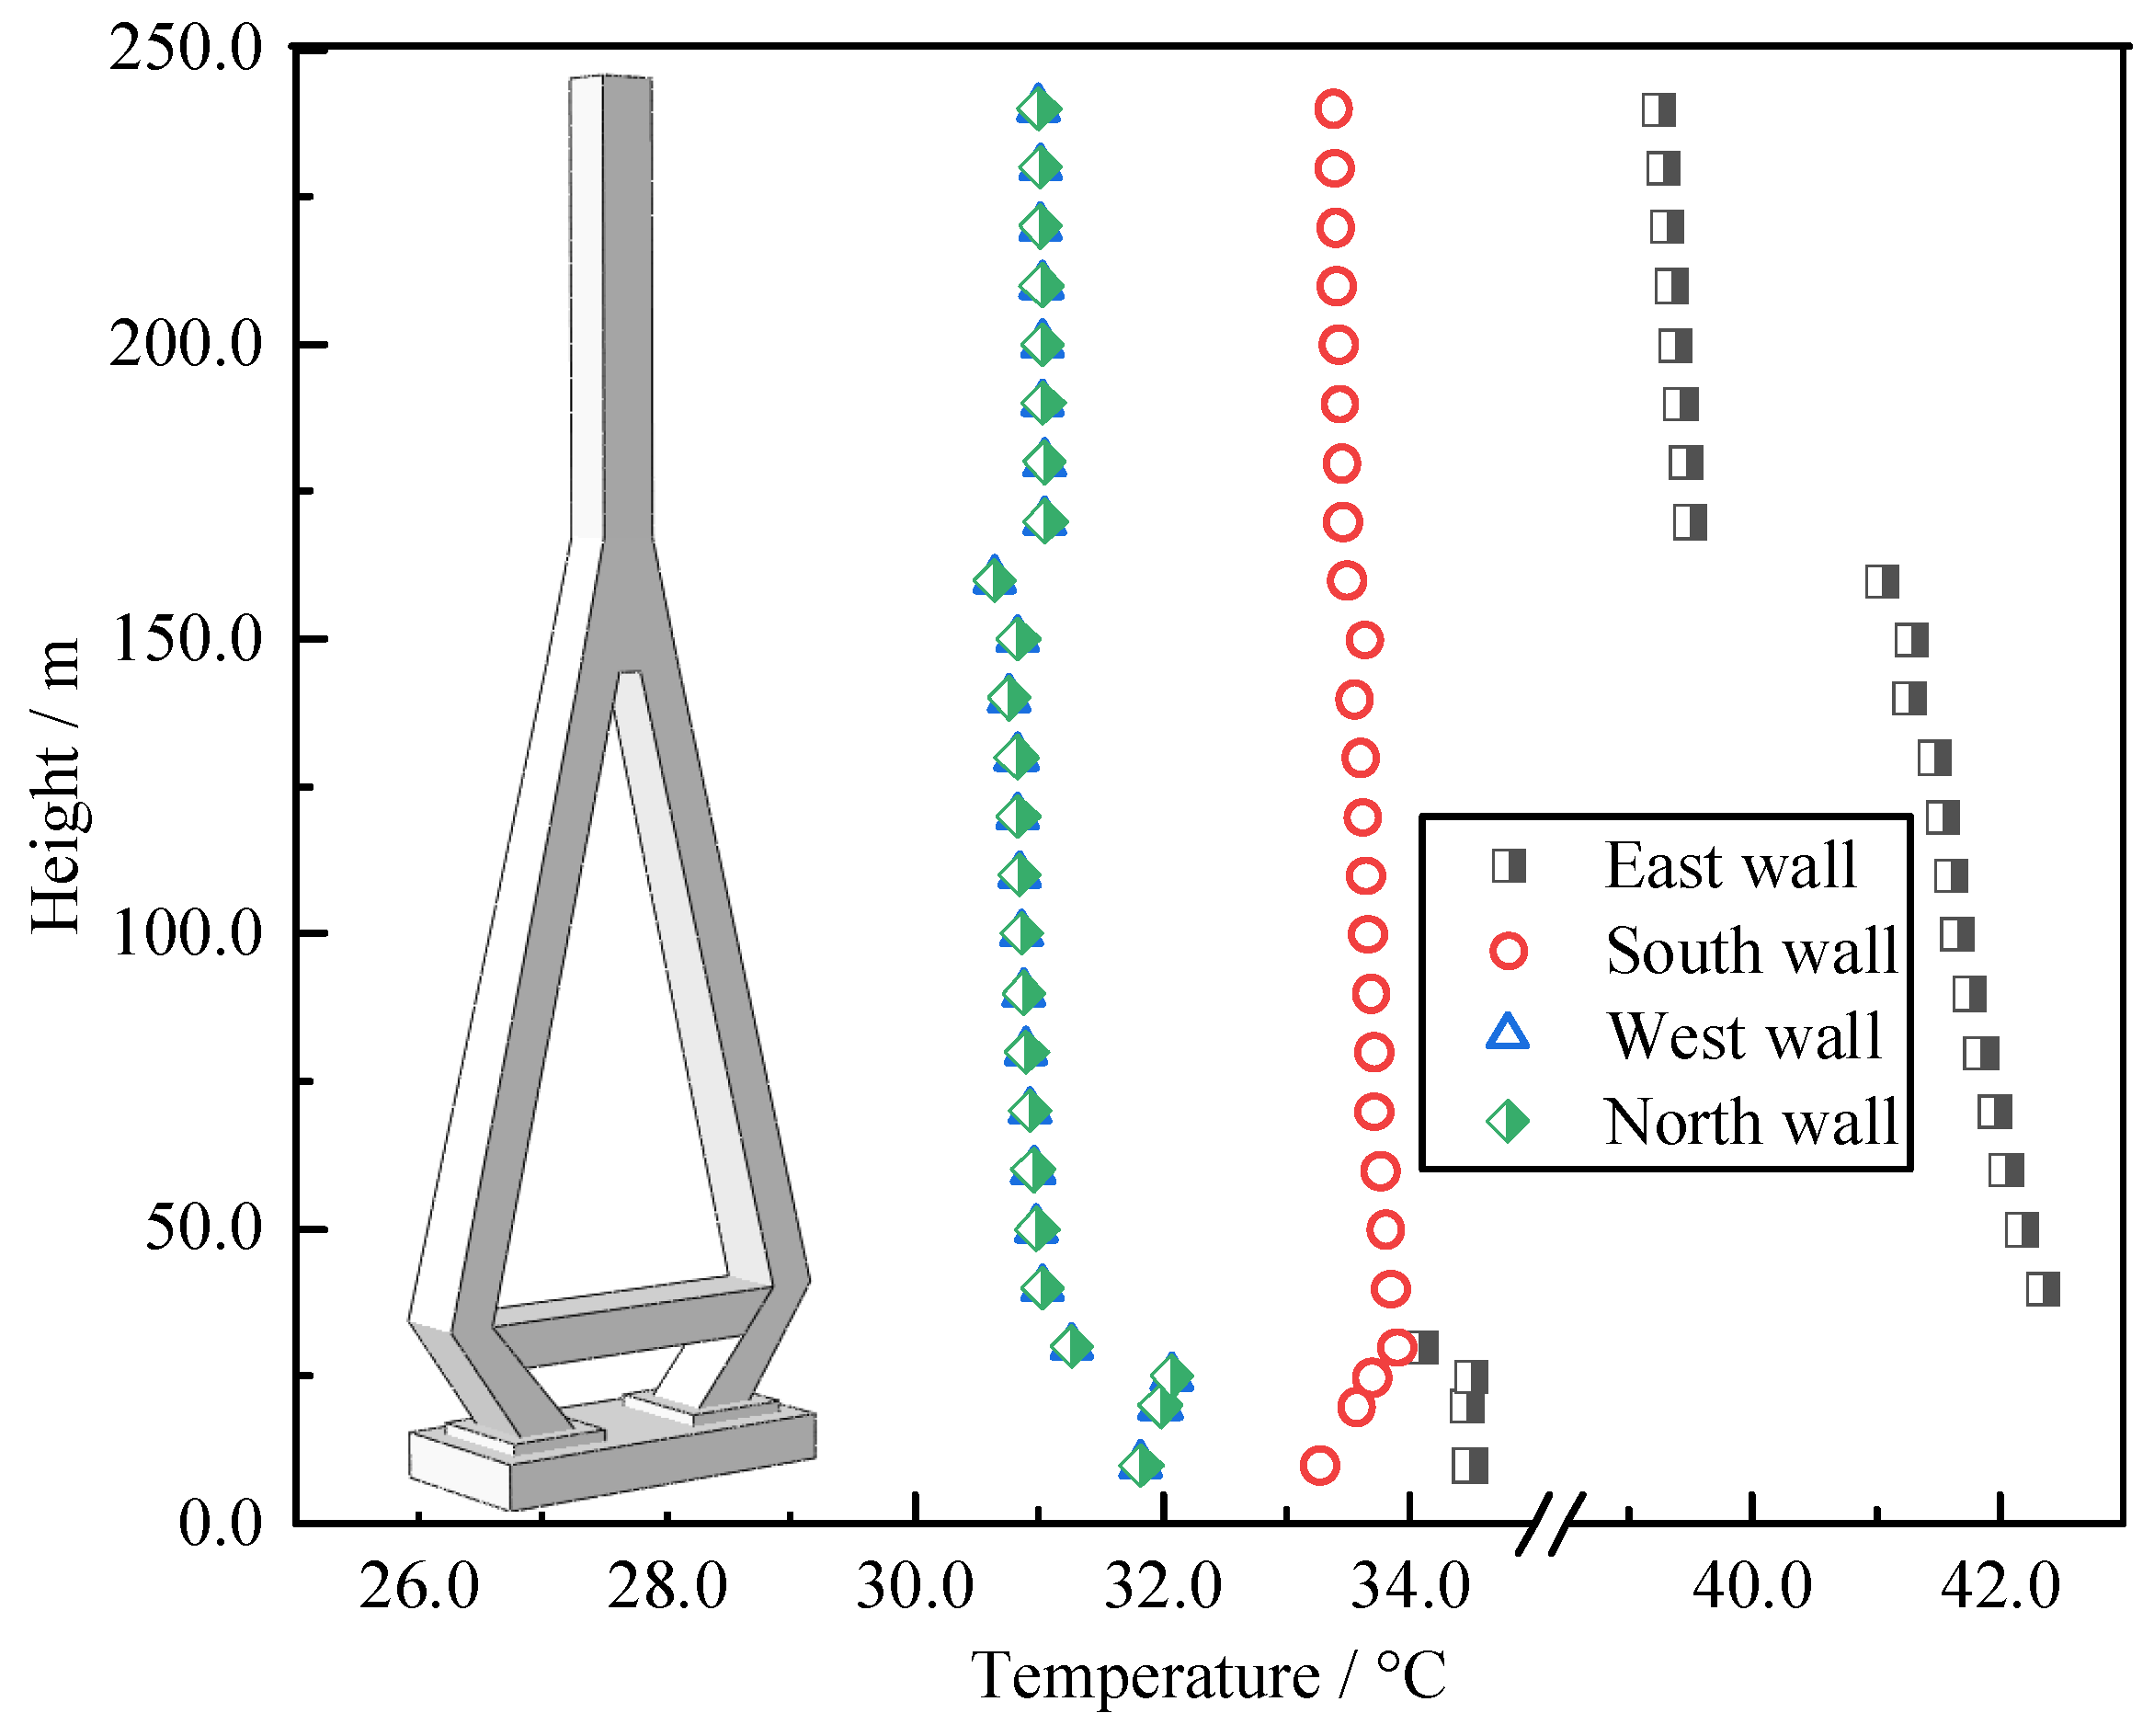
Figure 20 shows the surface temperature changes with the height of the four wall surfaces of the bridge tower (the external surface of the east tower wall, the south tower wall, the west tower wall, and the north tower wall) at 10 a.m. It can be seen from the figure that the shadow has a significant impact on the temperature change of the tower wall surface. The temperatures of the external surfaces of the east tower wall and the south tower wall irradiated by the sunlight are higher than those of the external surfaces of the west tower wall and the north tower wall, which are always in shadow. Because the incidence angle of the sunlight on the external surface of the east tower wall is smaller than that on the external surface of the south tower wall, the external surface of the east tower receives more solar radiation, and its temperature is higher than that on the external surface of the south tower wall. On the external surface of the east tower wall, the surface temperature of the lower tower column is significantly lower than that of the upper tower column and the middle tower column because the lower tower column is in shadow. It can be seen from the above that the influence of shadow shading must be considered when analyzing the three-dimensional sunshine temperature field of the bridge tower.
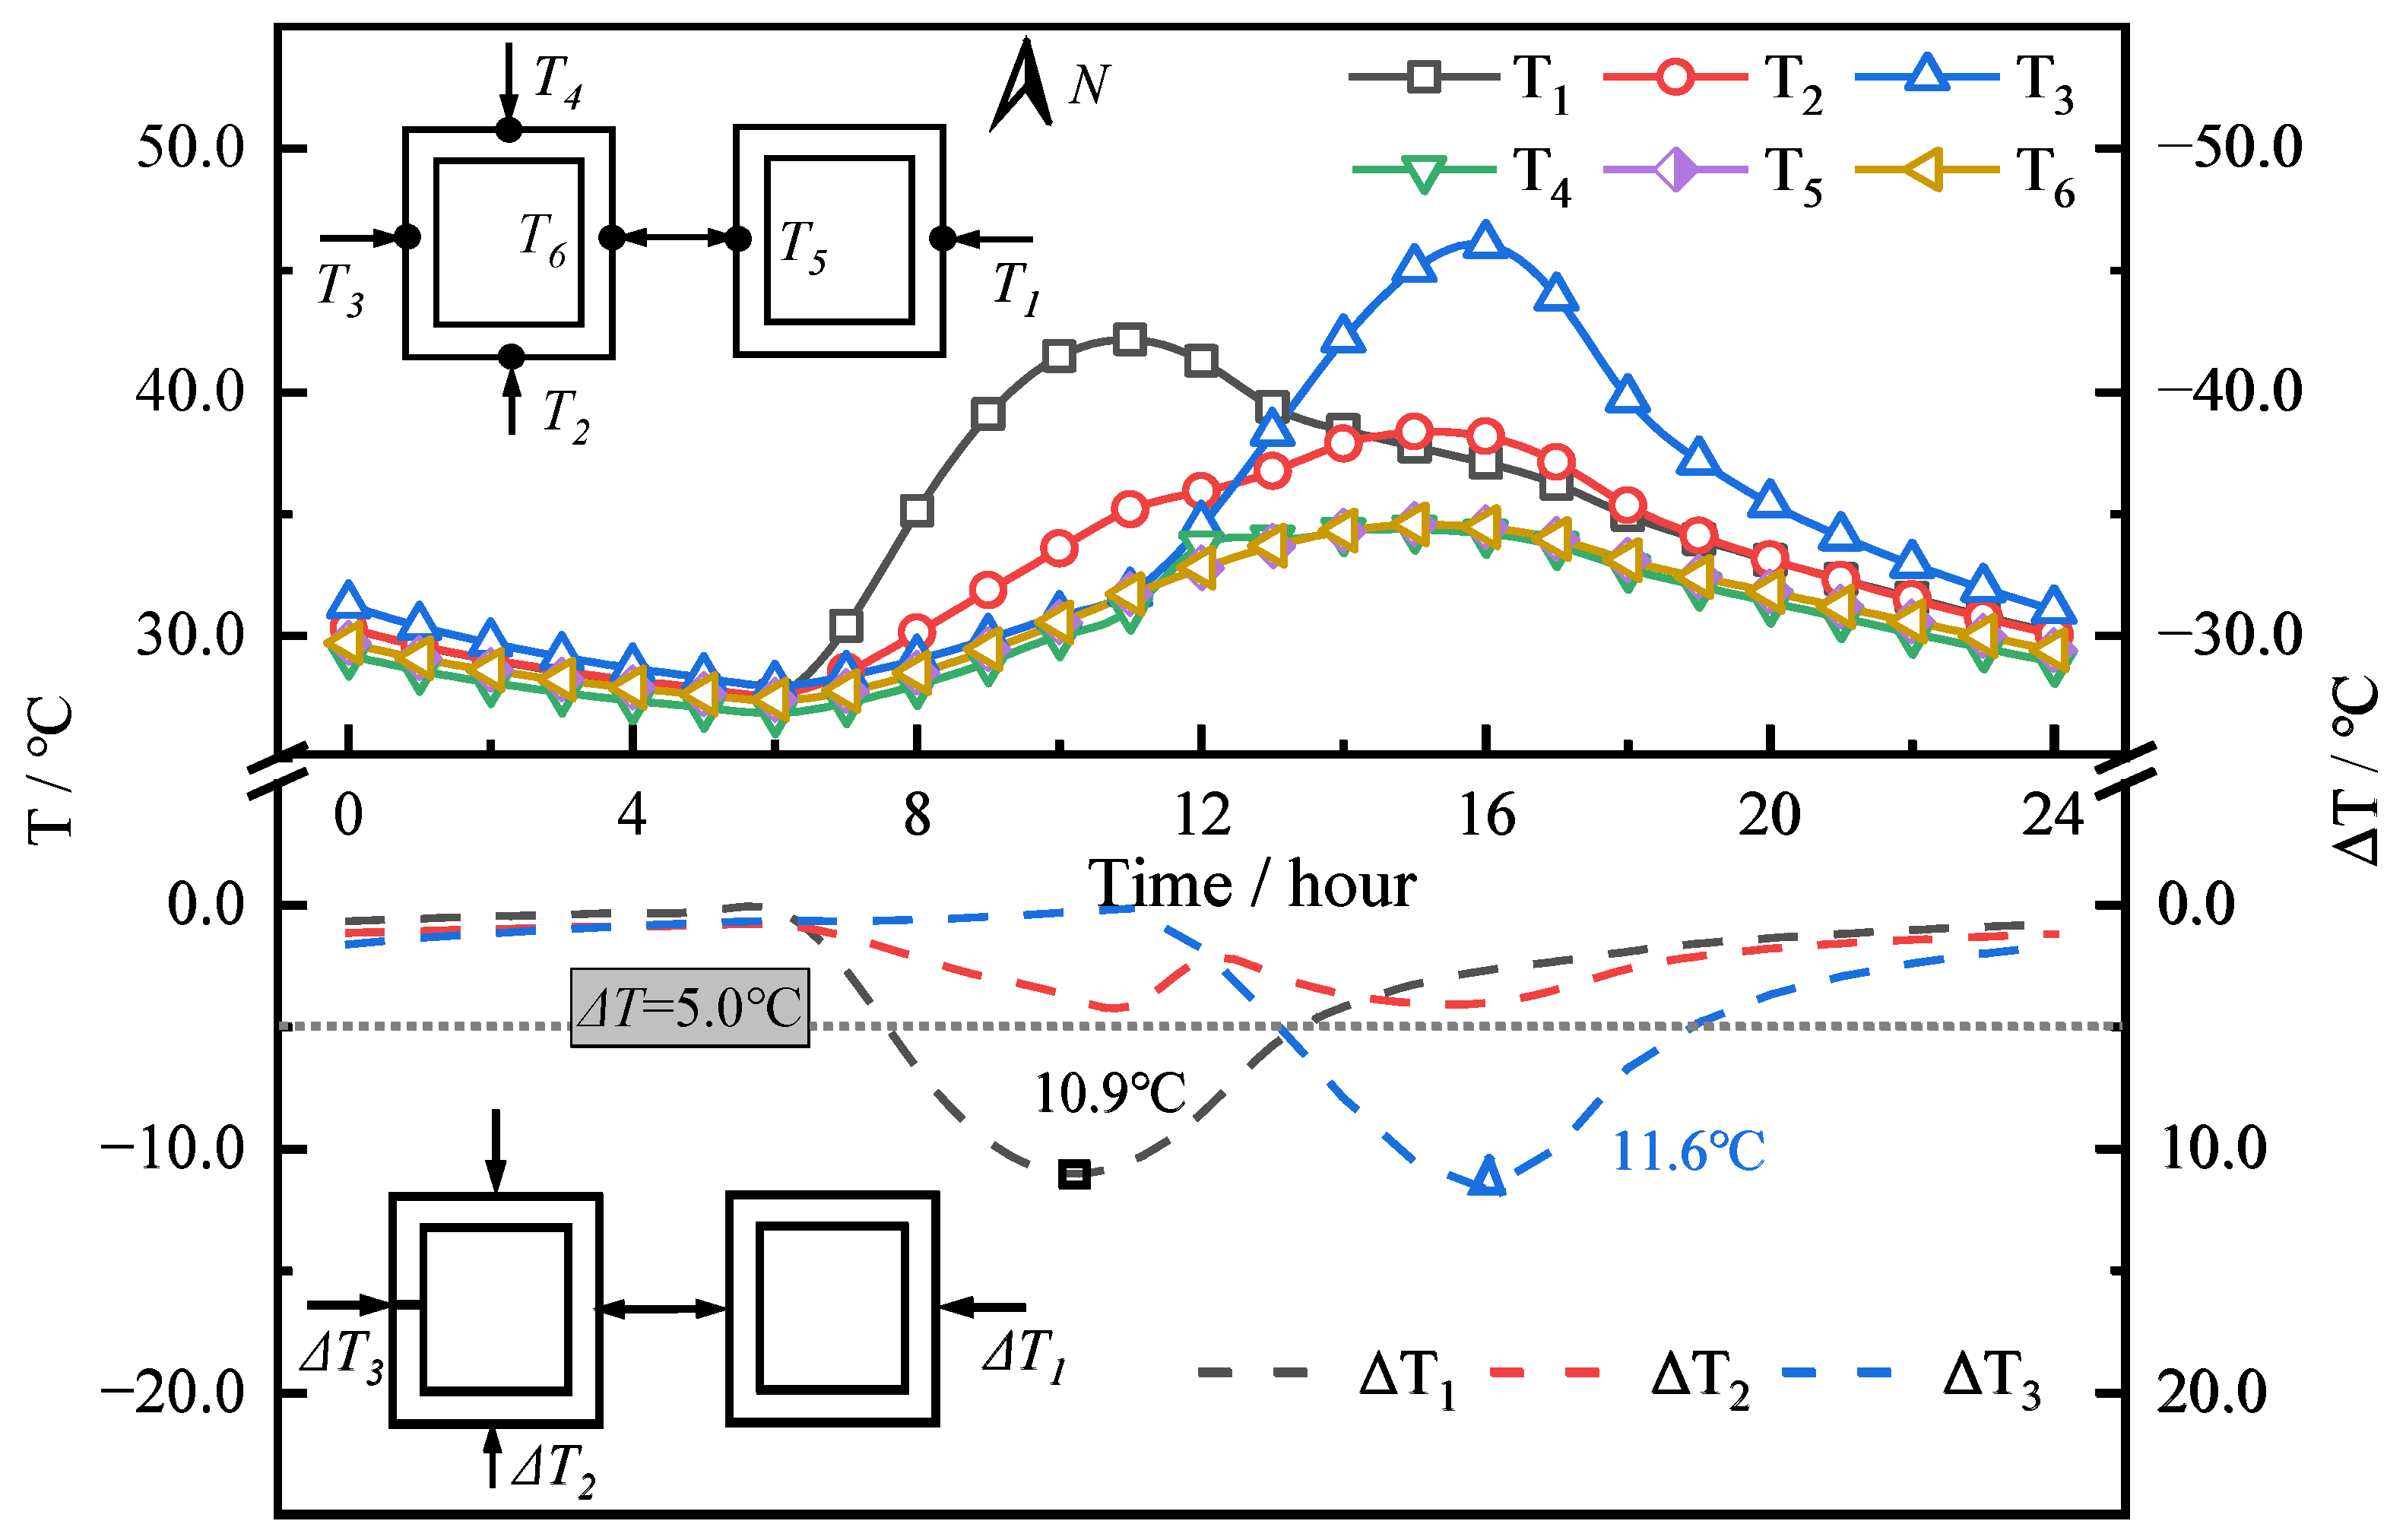
Figure 21 shows the change curve of the external surface temperature (T) of the tower wall at the 125 m height of the bridge tower and the change curve of the temperature difference (ΔT) between the opposite sides of the tower columns (the east wall, the south wall, the west wall, the north wall, the inner east side, and the inner west side refer to the wall surface of the measuring points T1, T2, T3, T4, T5, and T6 in the figure, respectively). It can be seen from the figure that in a day, the surface temperature changes are the same; from night to early morning, the surface temperature of each surface was in a state of continuous decline, but the trend of temperature reduction gradually slowed down, reaching the lowest value at about 6 a.m. In the daytime, due to the influence of solar radiation and ambient temperature changes, the temperature of each wall surface showed a trend of rising first and then falling. The temperature of the eastern wall surface, which was first irradiated by the sun, rose faster than that of other surfaces, reaching its maximum at about 10 a.m., followed by the south wall surface irradiated by the sun. However, due to the large incident angle of the sun on the south wall surface, the amount of solar radiation received by the wall surface was small, so the temperature rose slowly. Finally, the west wall surface was irradiated by the sun. Because of its small incident angle, the surface temperature rose rapidly and reached its maximum at about 4 p.m. Because the north wall was in a shaded state throughout the day, its surface was not irradiated by the sun, and only convection heat transfer and radiation heat transfer were performed with the ambient temperature. Therefore, the temperature change was relatively slow, and the temperature change throughout the day was small. The overall variation of the surface temperature of the tower was consistent with the law obtained in reference [39].
It can be seen from the variation curve of the temperature difference between the opposite faces of the tower column in Figure 21 that the temperature difference ( T 2 ) between the south wall and the north wall is small in one day, and it is within 5 °C throughout the day. The temperature difference between the east wall and the east side of the inner side ( T 1 ) and the temperature difference between the west wall and the west side of the inner side ( T 3 ) are large during the sunshine period. The maximum temperature difference between the east wall and the east side of the inner side can reach 10.9 °C, and the maximum temperature difference between the west wall and the west side of the inner side can reach 11.6 °C, which is far more than the recommended temperature difference (±5 °C) given in the ‘Design of Highway Cable-Stayed Bridge’ (JTG/T 3365-01-2020) [8] (the negative value represents the difference between the shadow shielding surface and the solar irradiation surface, and the positive value represents the difference between the temperature value of the solar irradiation surface and the temperature value of the shadow shielding surface).

5.2.2. Local Temperature Difference Analysis of Tower Wall

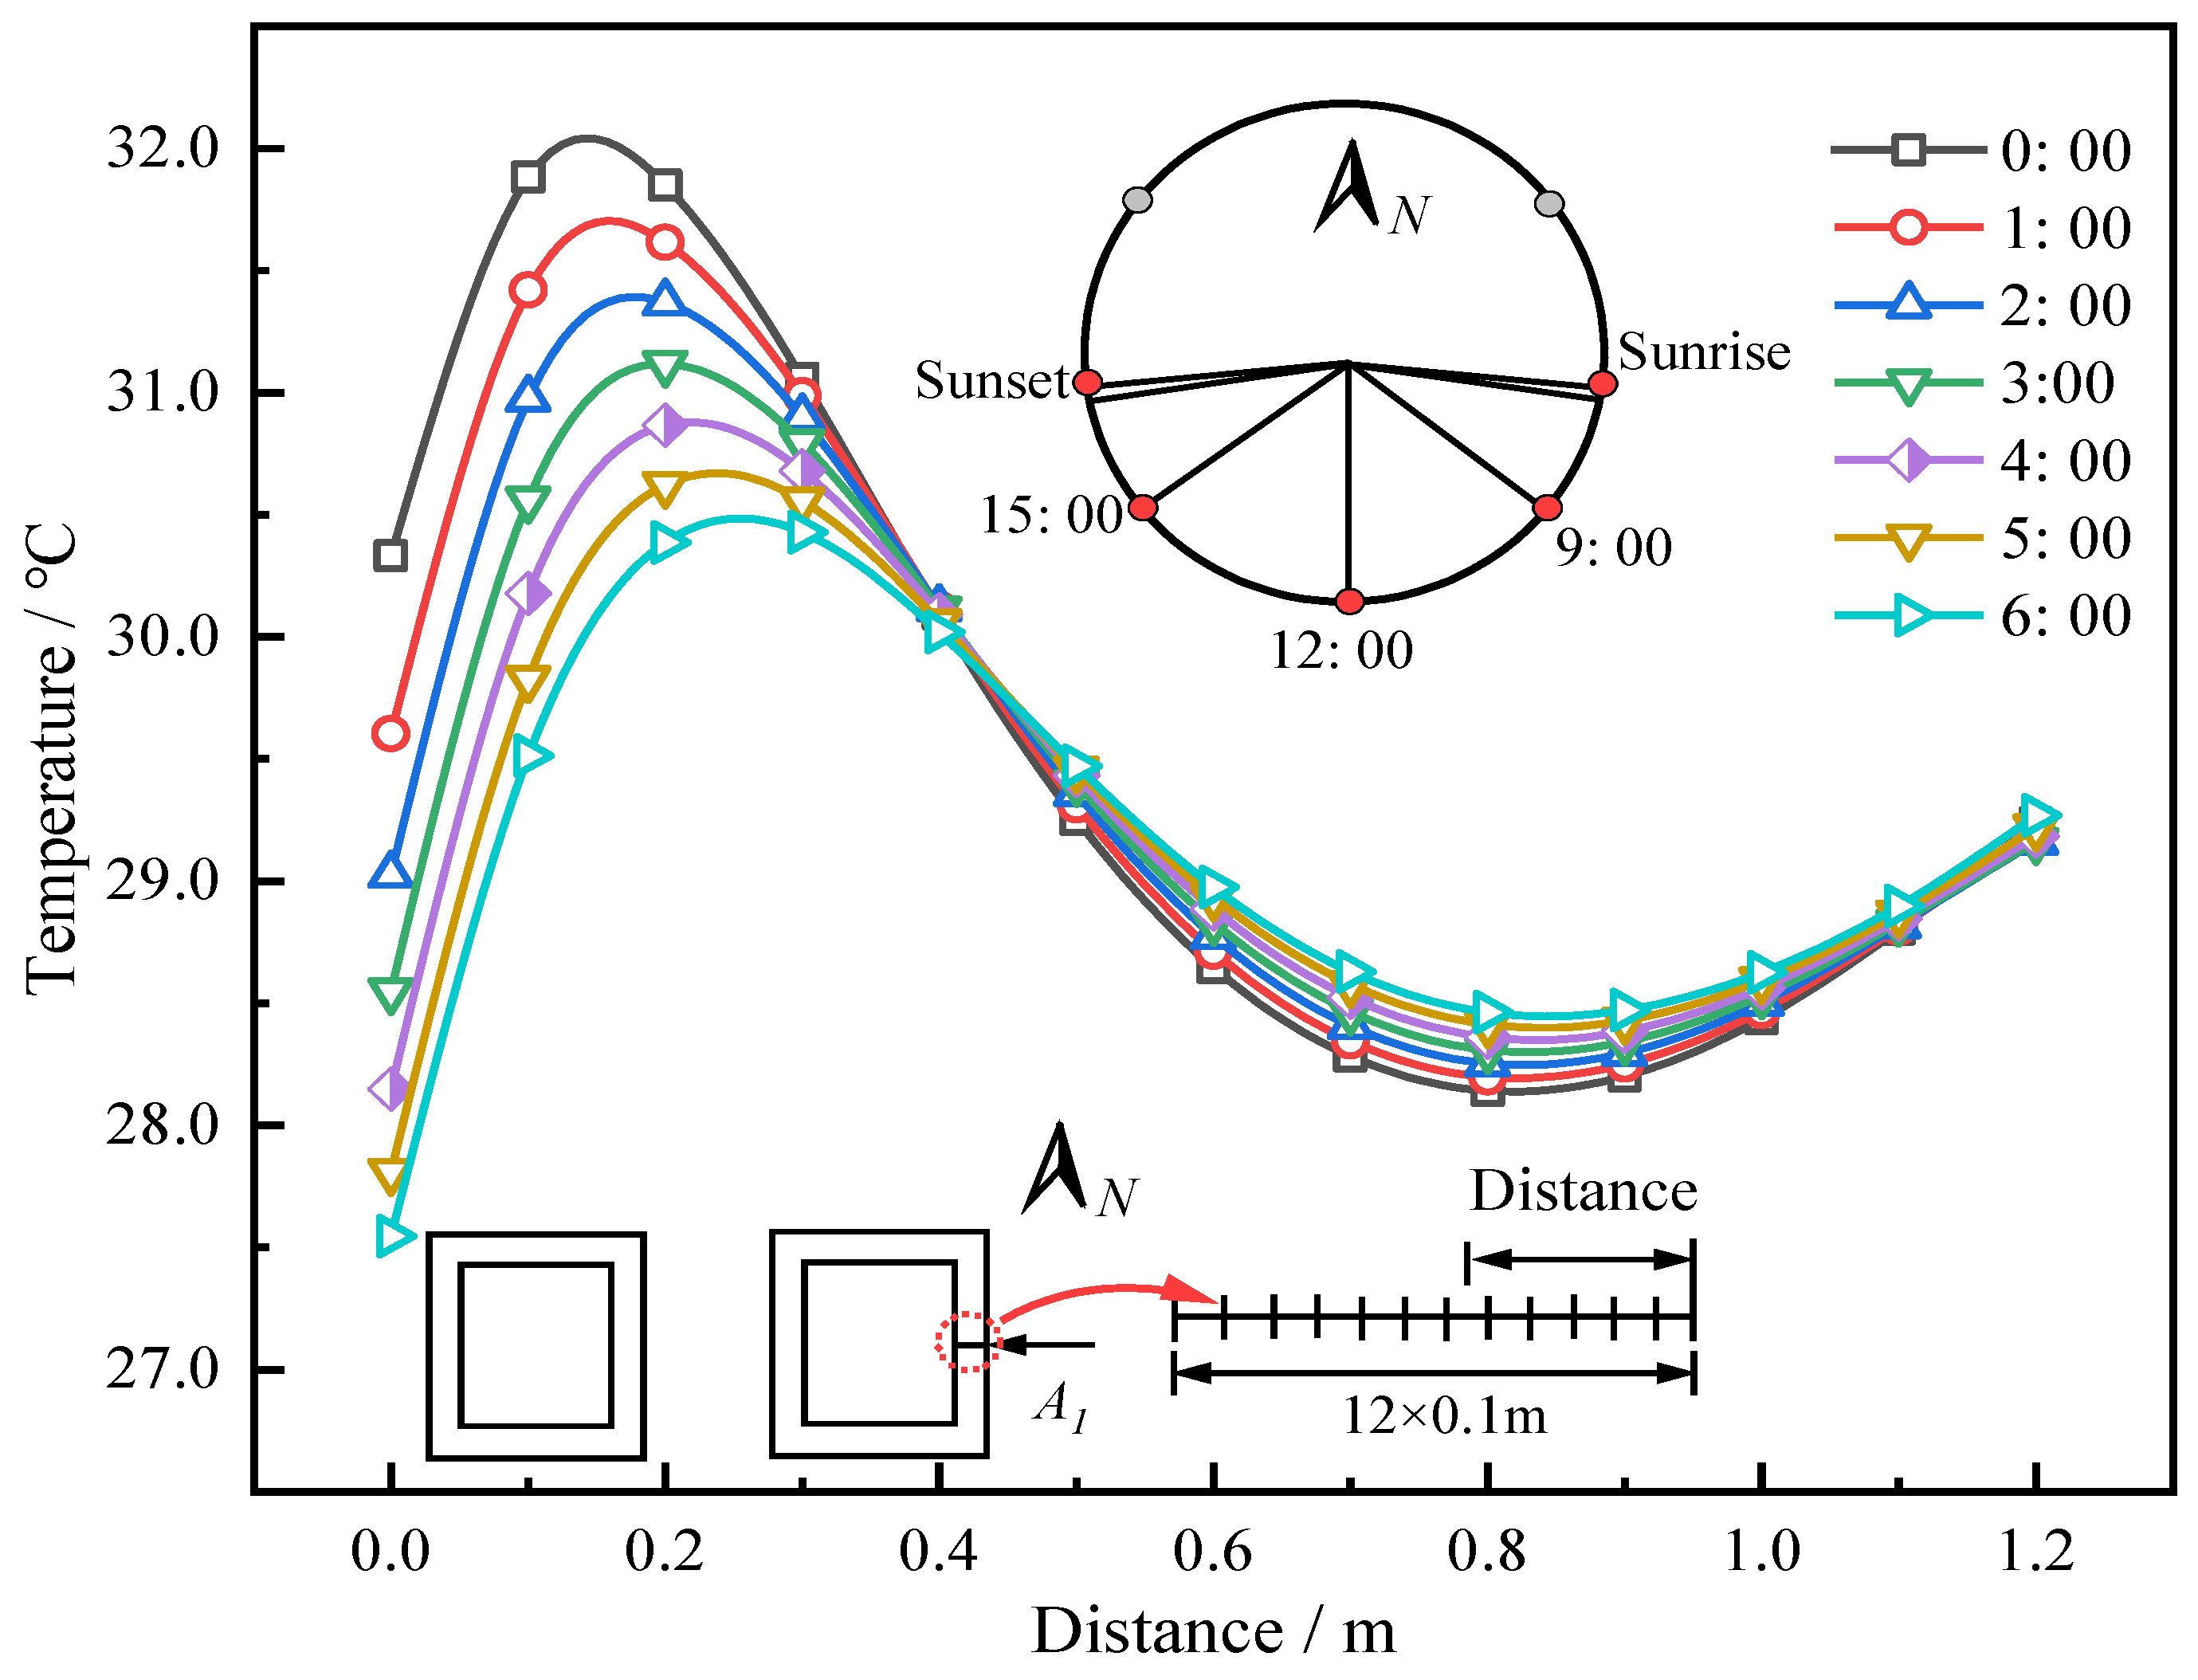
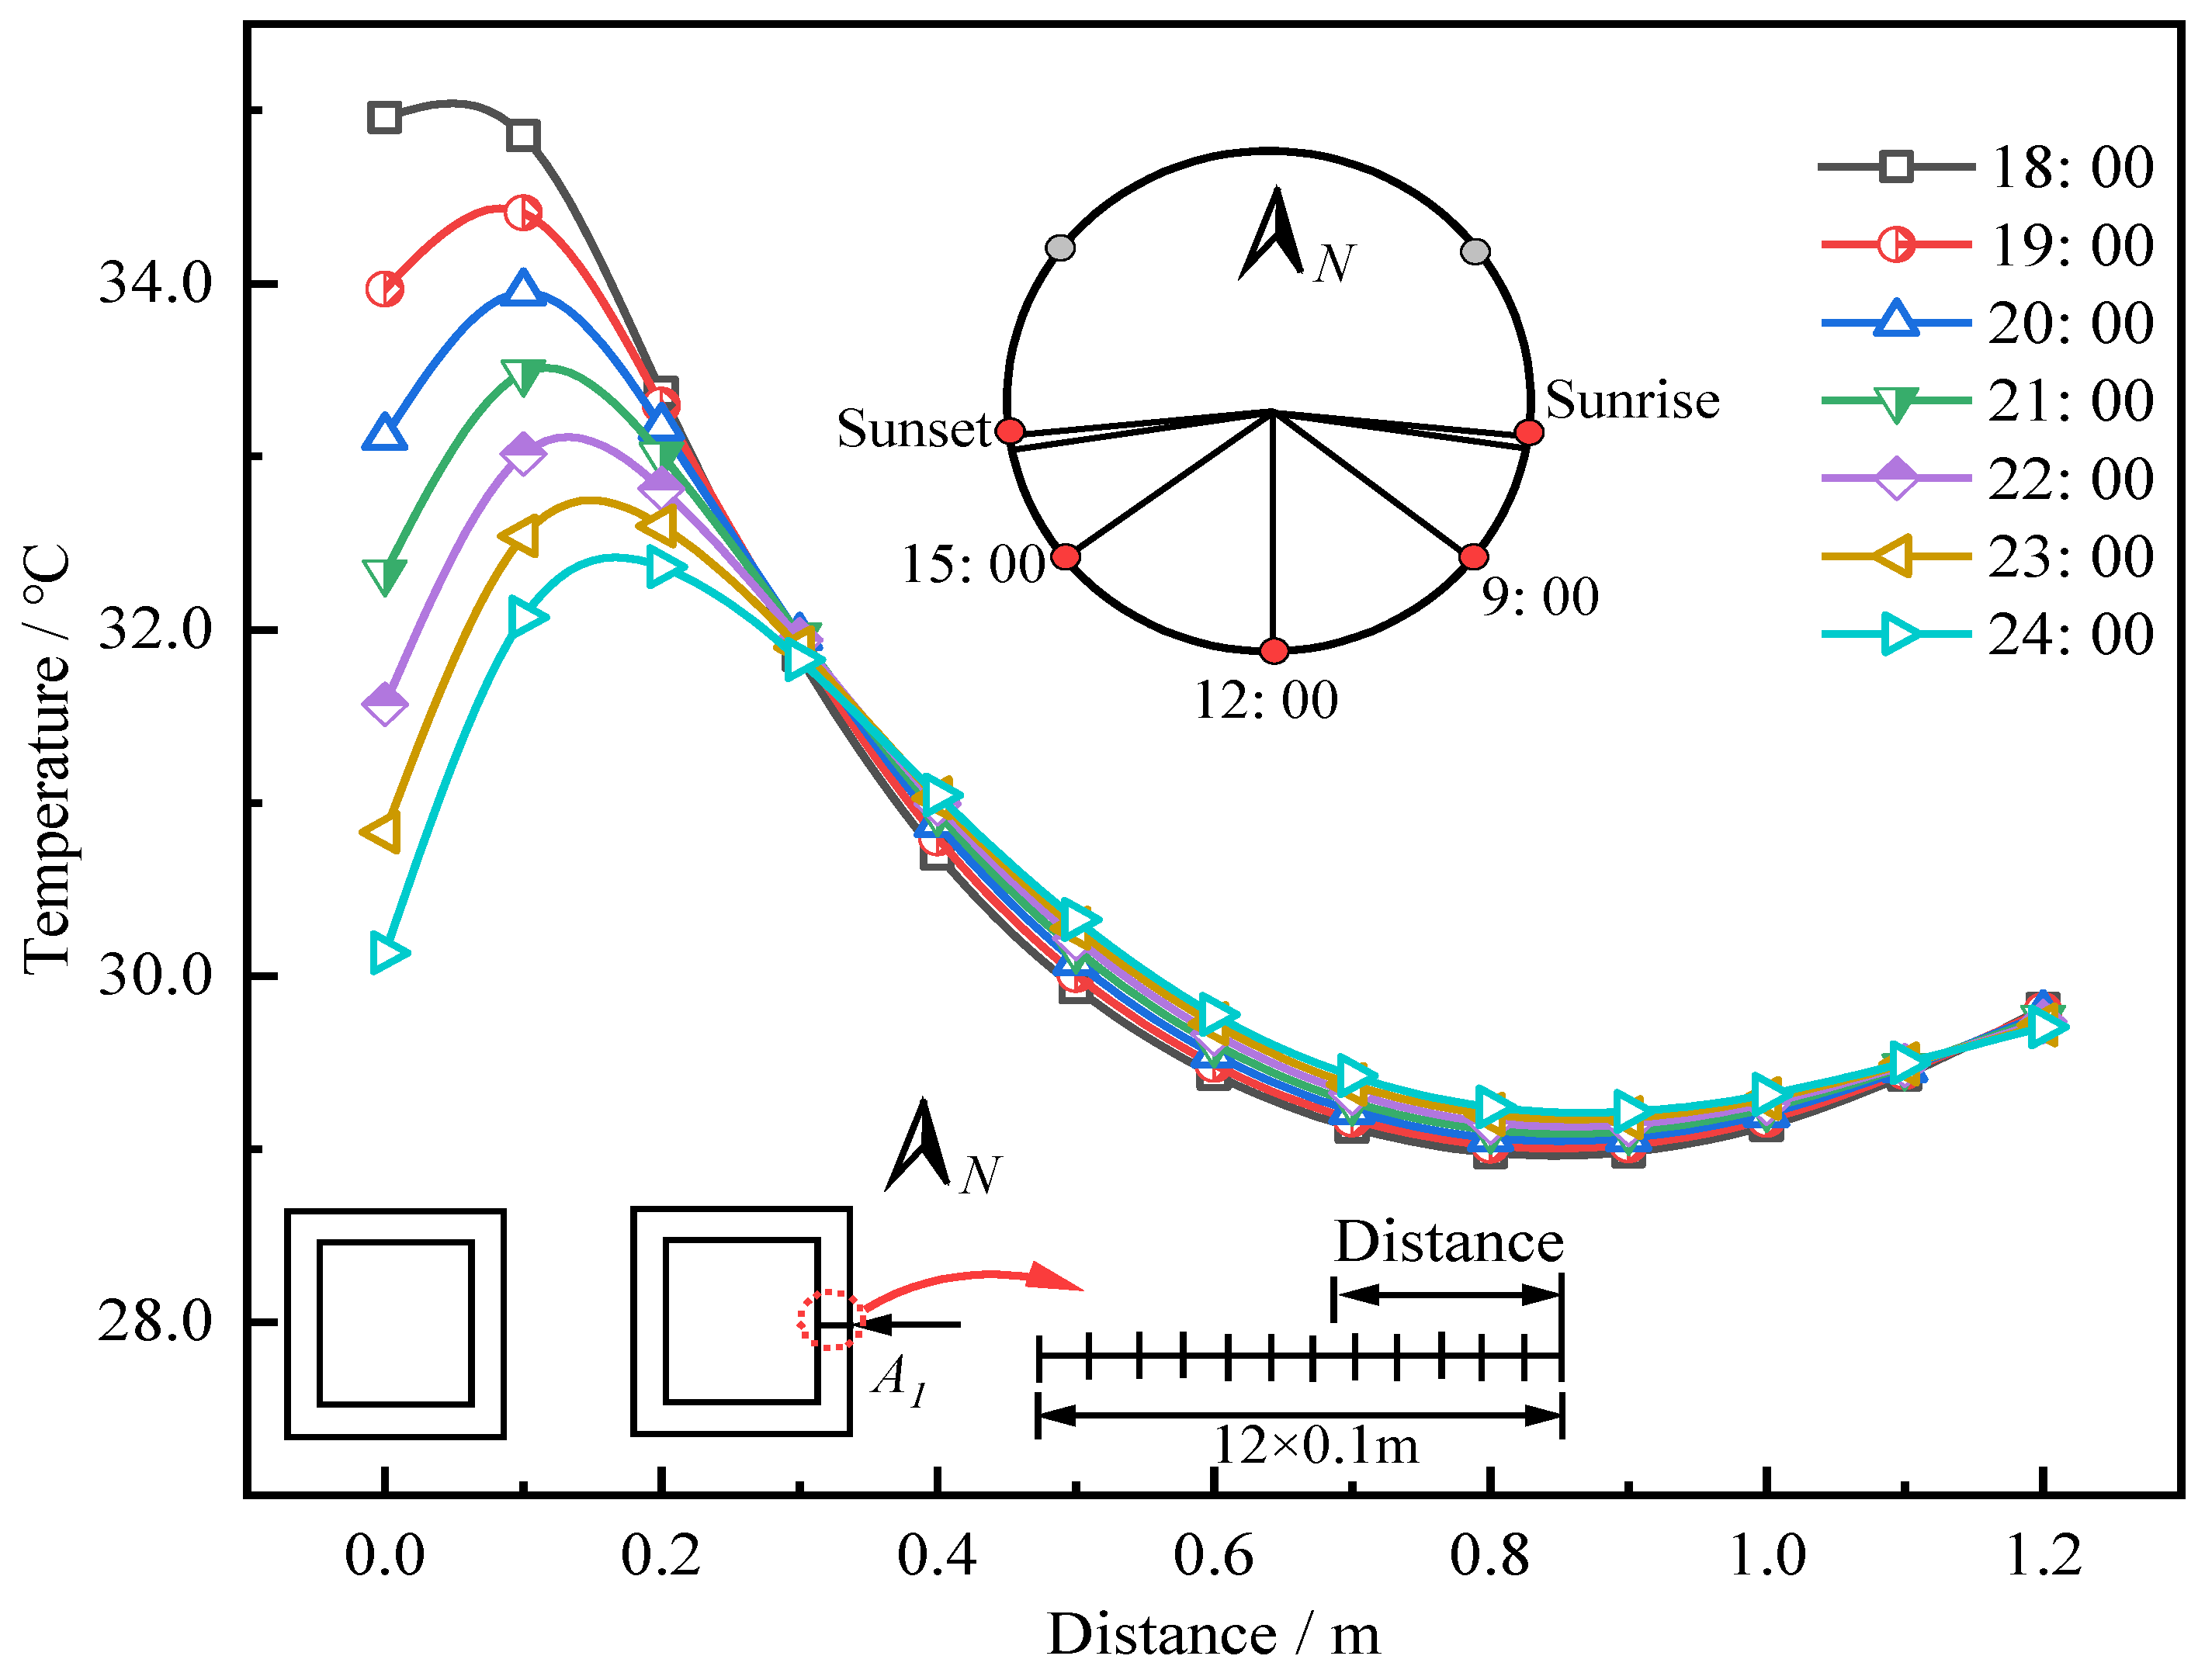
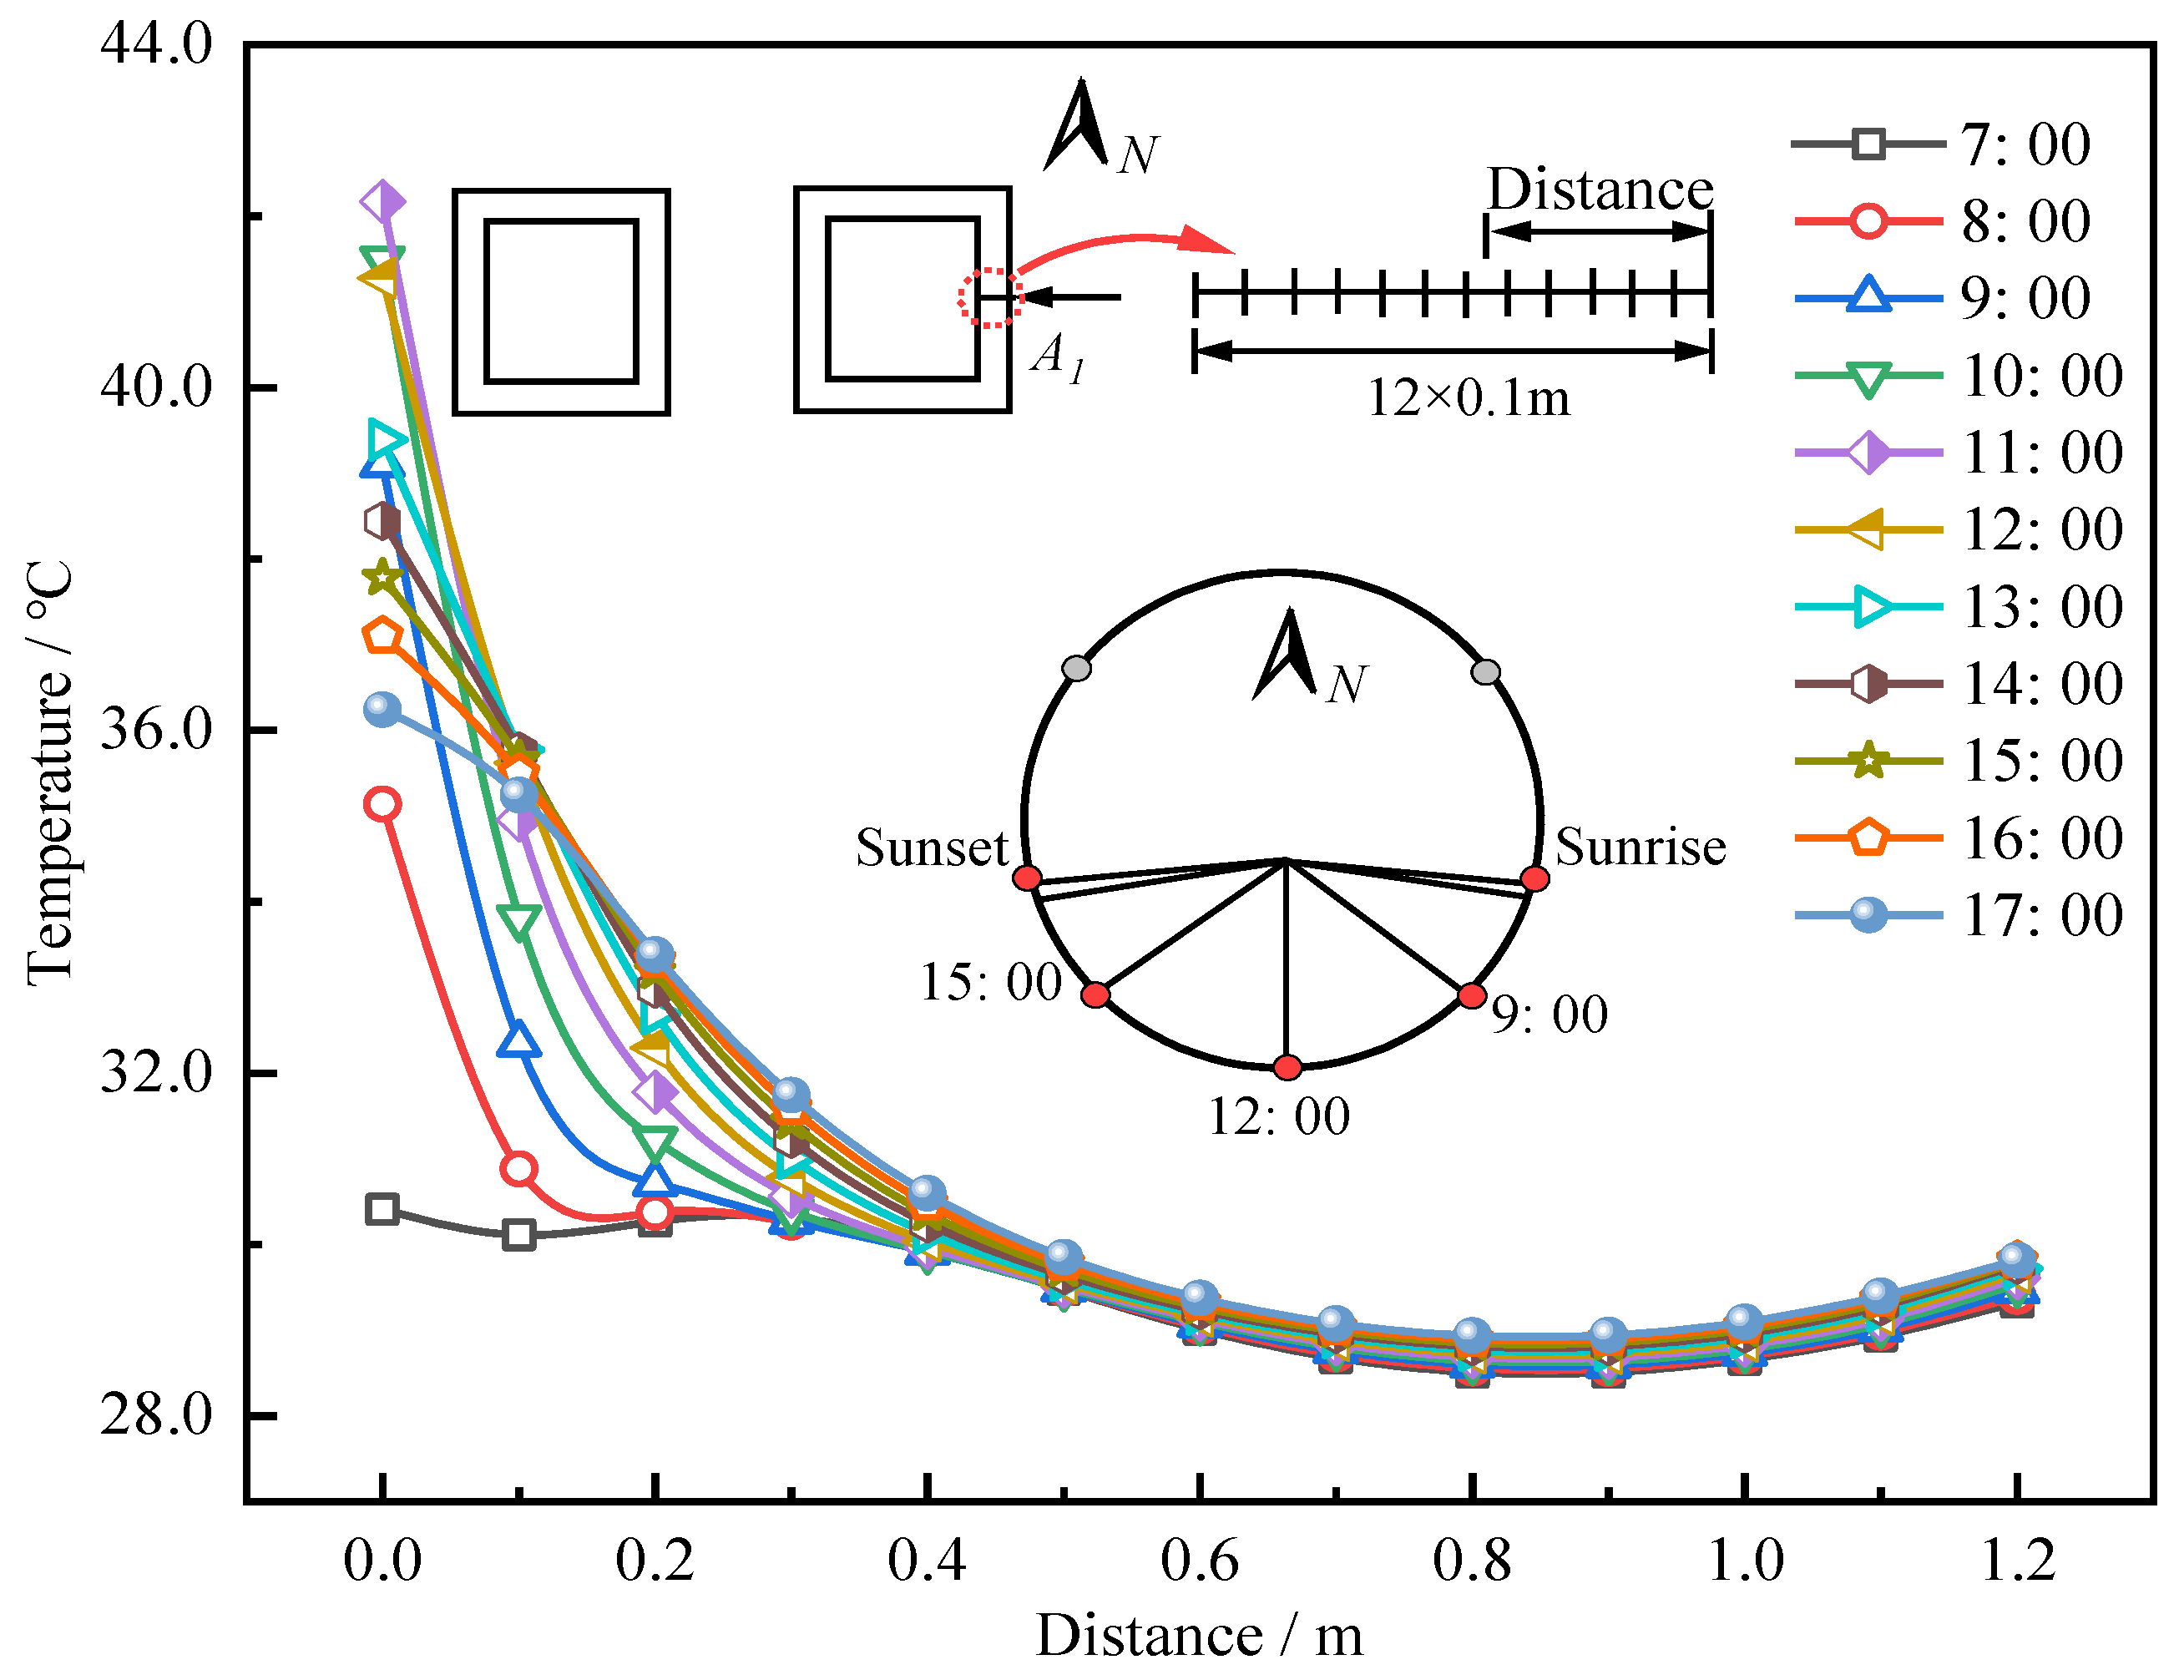
Figure 22, Figure 23 and Figure 24 show the temperature change along the thickness direction of the east tower wall at the height of 125 m. It can be seen from the figure that the temperature change was relatively obvious at a range of 0.3 m from the external surface of the tower wall, and the temperature change was small in the remaining range because of the thermal insulation effect of concrete materials during the night and early morning periods. In the daytime, the radiation of the sun and the change in the ambient temperature made the temperature at a range of 0.3 m in the thickness direction change obviously, but the weak thermal conductivity of the concrete material led to the temperature in the thickness direction of the tower wall. The temperature at a range of 0.8 m from the external surface showed a gradual downward trend, while in the area beyond 0.8 m from the external surface, the temperature rose slightly due to the heat transfer and the thermal insulation of the concrete material itself.
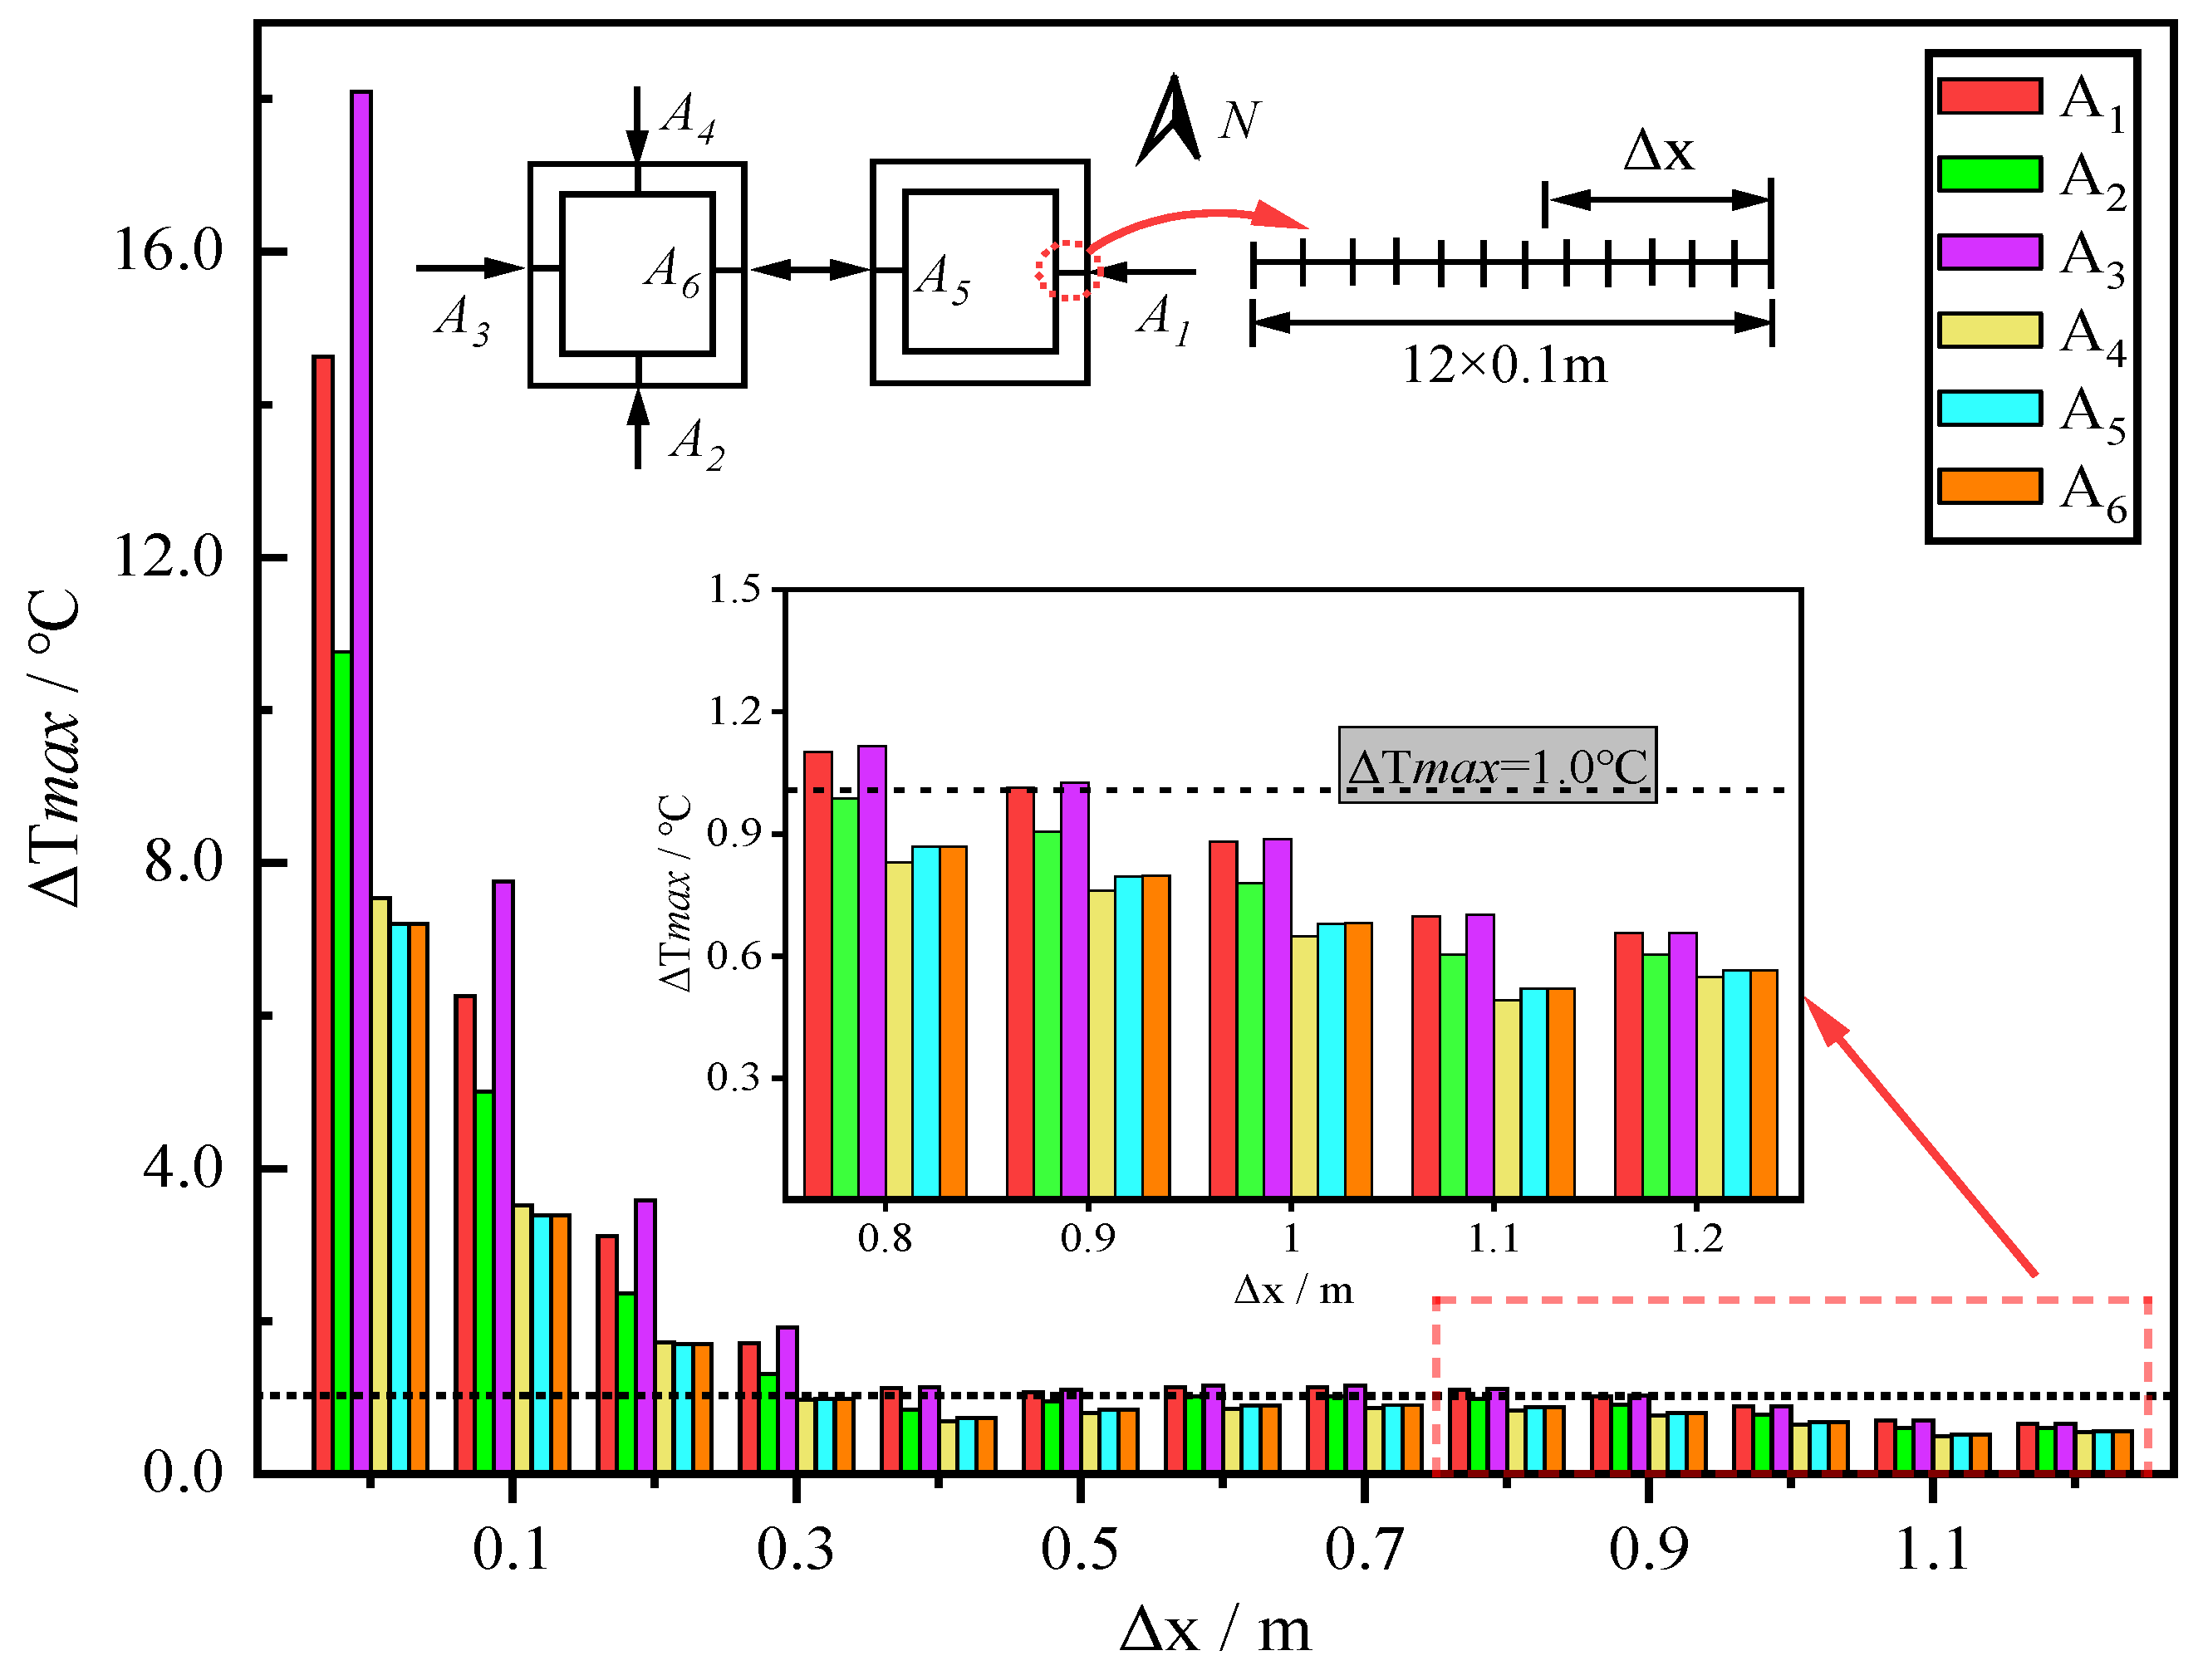
Figure 25 shows the maximum variation of temperature difference at the same distance from the outer surface in the thickness direction of each wall in a day. It can be seen from the figure that the temperature change was more significant at a range of 0.3 m from the outer surface. When measured more than 0.8 m from the outer surface, the temperature change was less than 1 °C.
The existing research shows that the temperature gradient distribution along the wall thickness direction of the concrete box structure under sunshine is close to the exponential form in Formula (32) [40,41]. In Figure 24, the distribution of the sunshine temperature field in the thickness direction of the east tower wall is similar to the formula below.
T x = T 0 e α x
where T x is the temperature gradient at the calculation point, °C; T 0 is the temperature difference between the inner and outer surfaces in the wall thickness direction, °C; x is the distance between the calculated point and the outer surface, m; and α is the attenuation coefficient of temperature in the wall thickness direction, which is used to characterize the speed of temperature gradient attenuation in the wall thickness direction.
In the direction of tower wall thickness, the temperature value at any measuring point is:
T x = T 0 e α x + C
According to the characteristics of the exponential function image, in the above Formula (33), the parameter C should be changed to the lowest temperature in the thickness direction of the tower wall where the measuring point is located, °C; T 0 is the temperature difference between the external surface and the minimum temperature in the direction of wall thickness, °C.
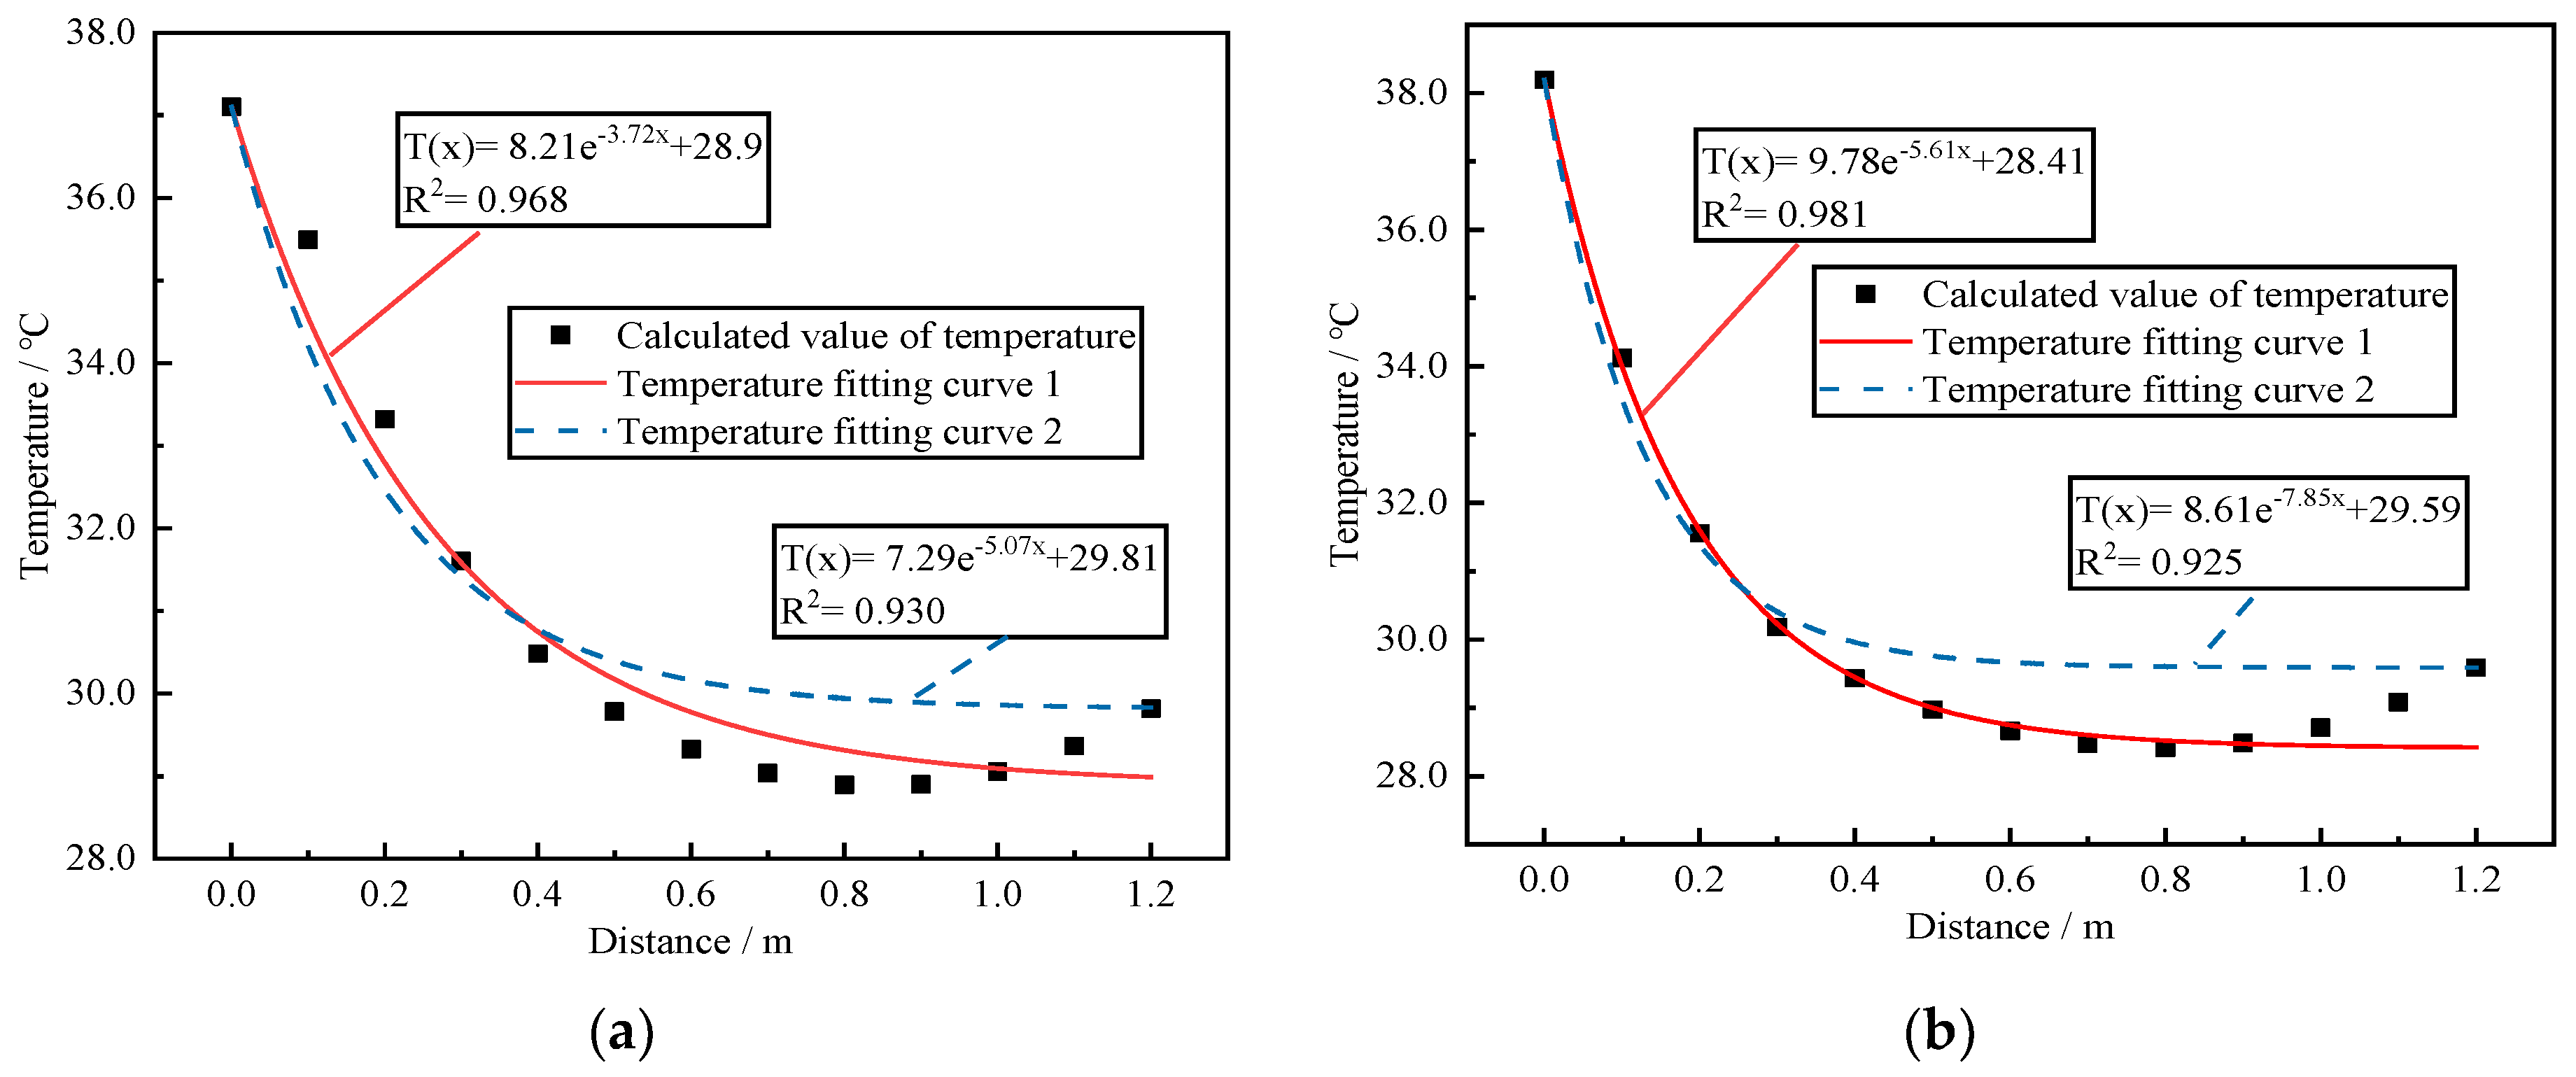
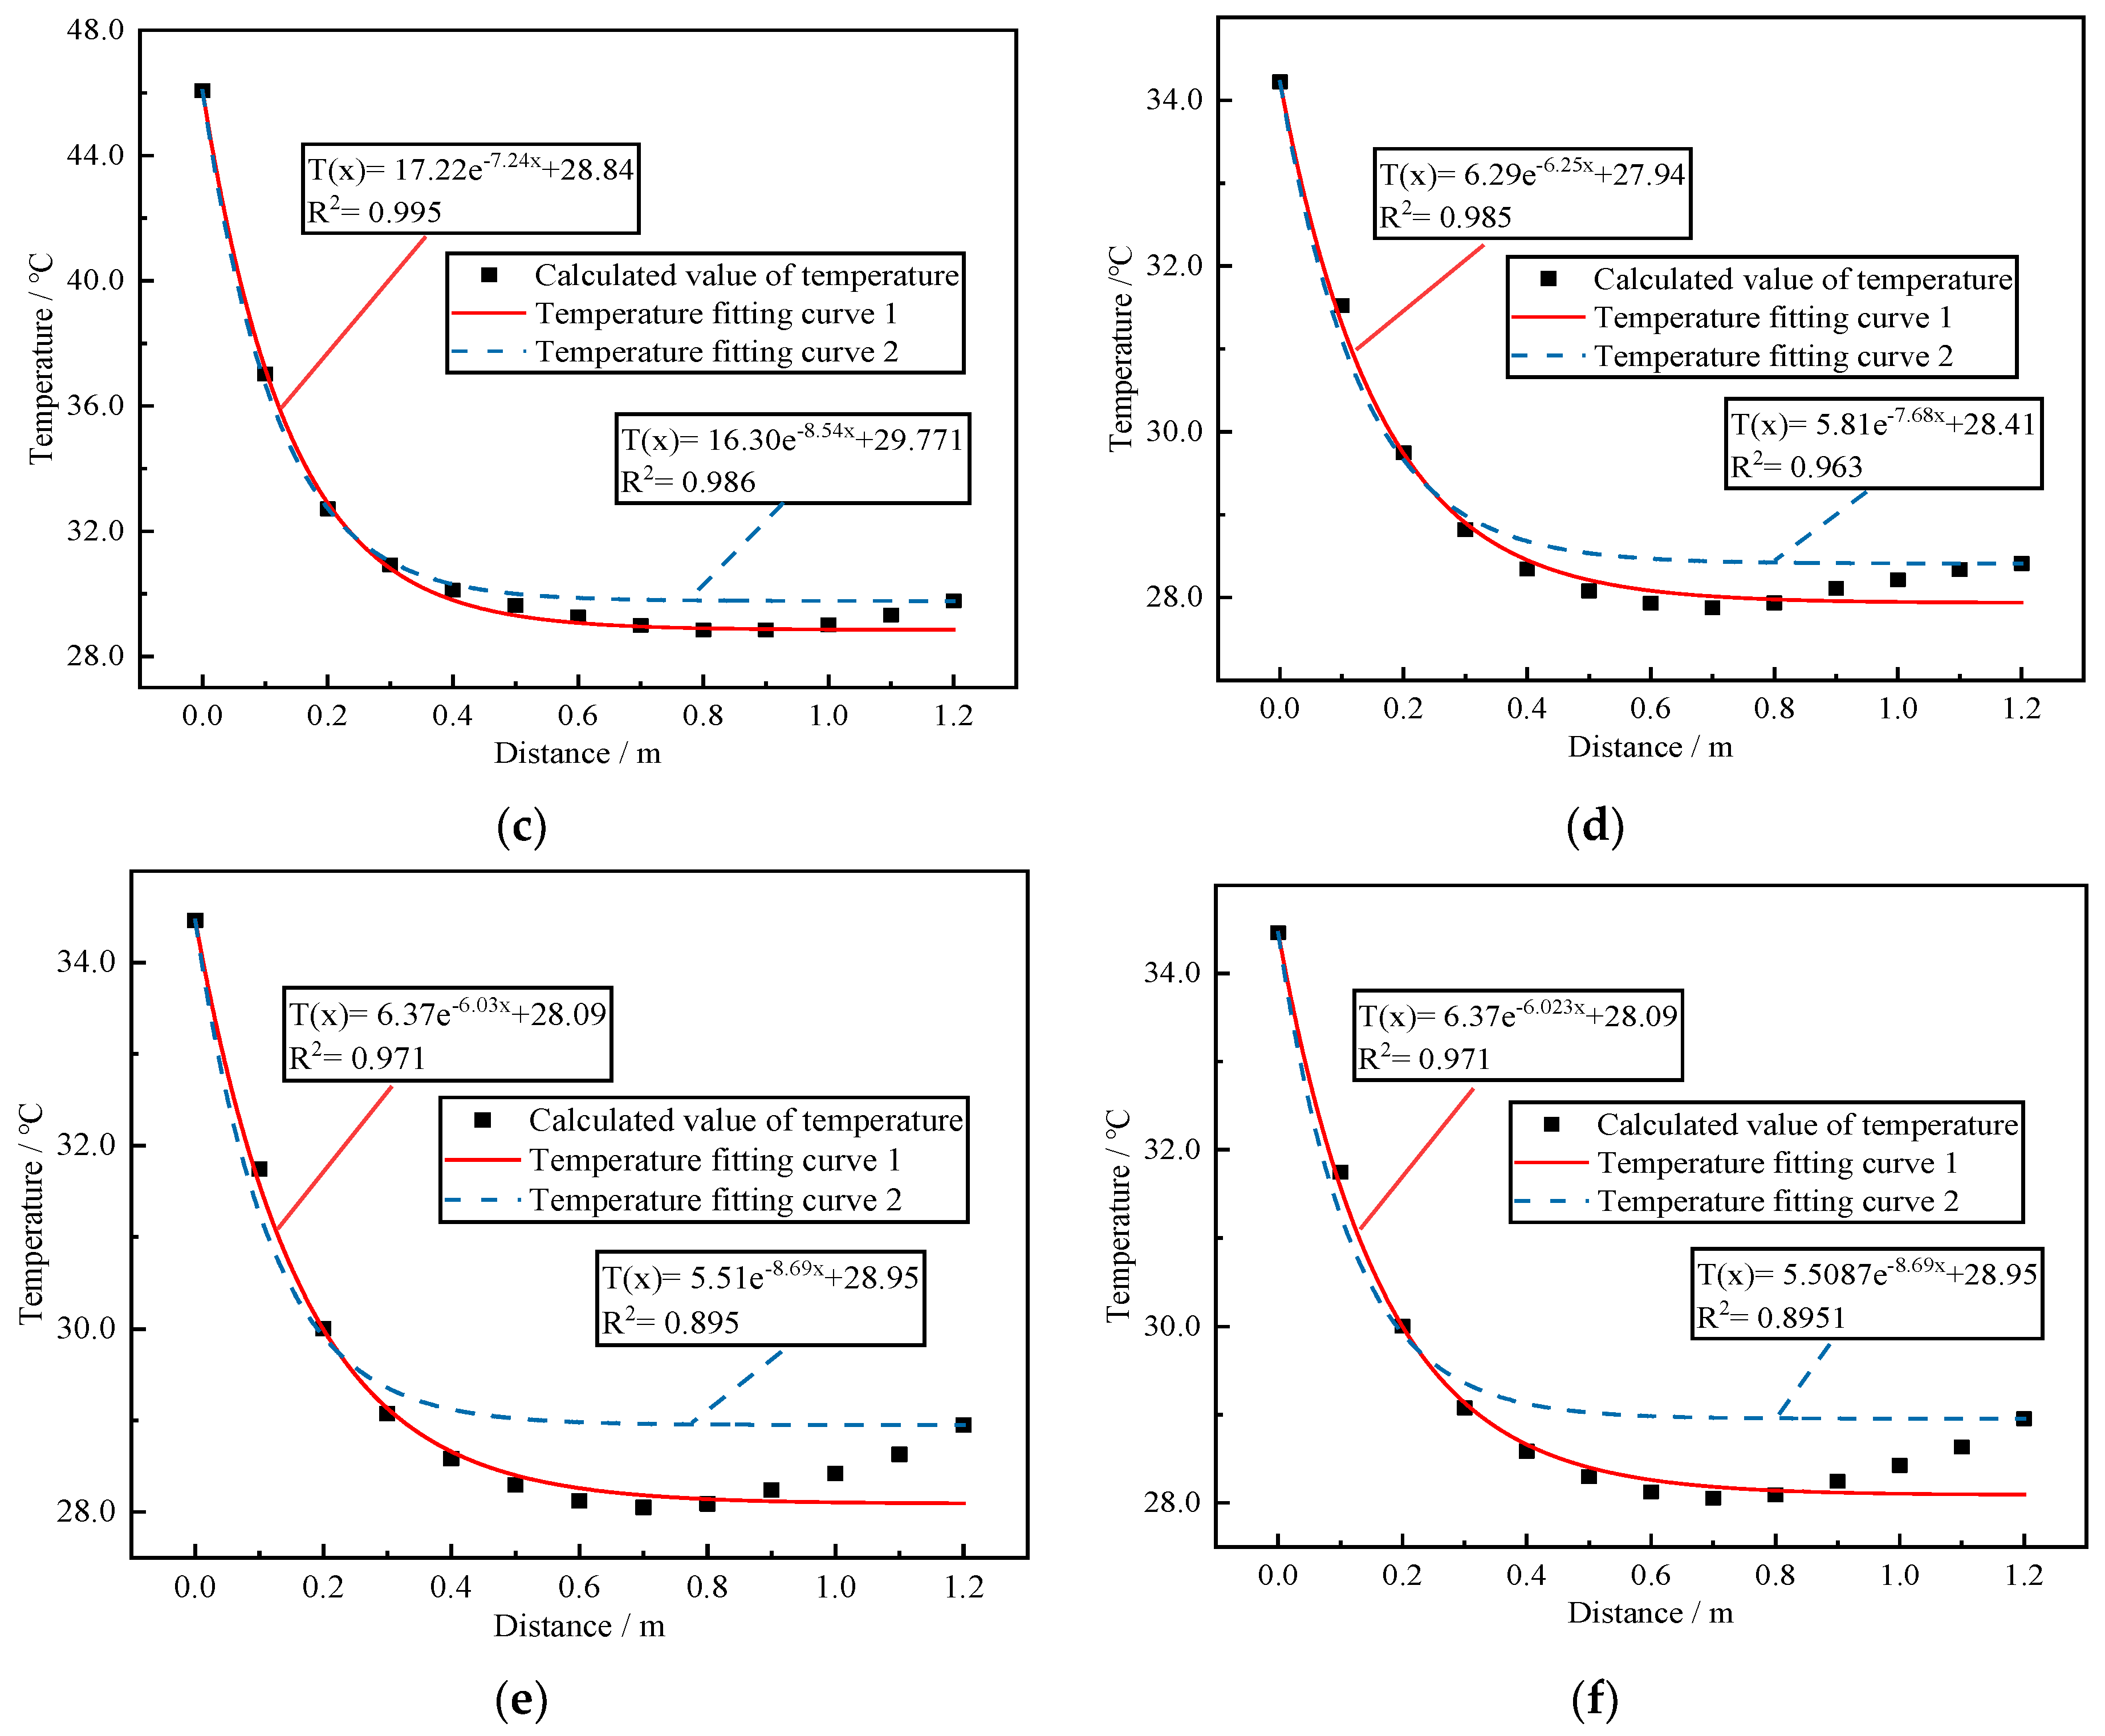
Figure 26 shows the two-dimensional temperature field cloud map of the tower column section at a 125 m height. Formula (33) was used as the fitting function, and the least squares method was used to fit the temperature field distribution in the direction of wall thickness to verify its accuracy. The temperature value at 0.8 m from the external surface and the temperature value of the internal surface were, respectively, used as parameter C in Formula (33) to fit the discrete temperature data in the wall thickness direction considering the characteristics of temperature change. The data fitting results are shown in Figure 27.
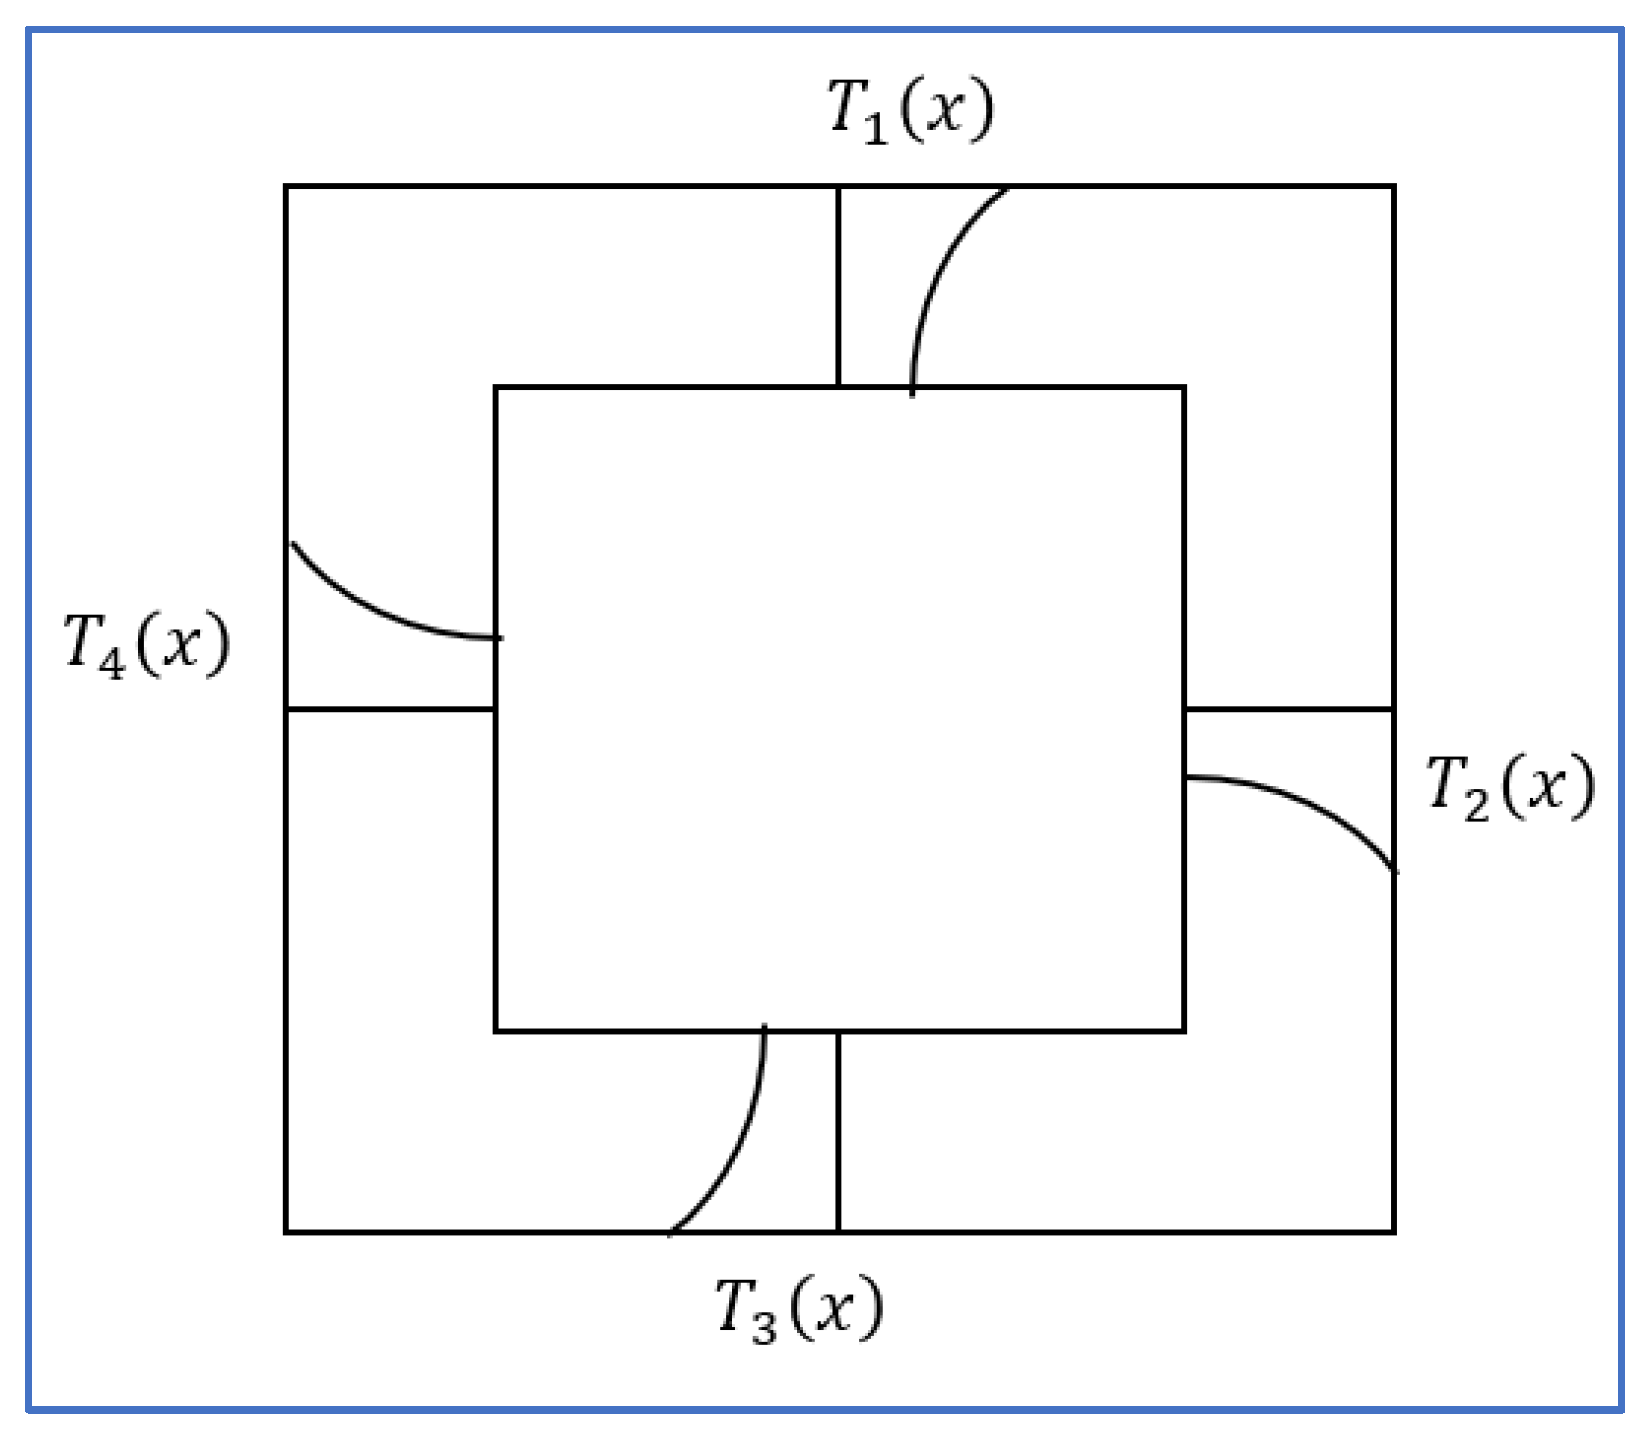
As shown in Figure 27, the exponential function was used to fit the discrete temperature data, which can express the temperature change in the wall thickness direction well. The fitting results in the figures show that when the temperature value at 0.8 m from the external surface was used as the parameter C in Formula (33) for fitting, the result was better than the fitting result obtained by using the temperature value of the internal surface as the parameter C in Formula (33). The minimum correlation coefficients of the fitting results of the two methods were 0.968 and 0.895, respectively. Therefore, it is recommended to use the temperature data at 0.8 m from the outer surface as the parameter C in Formula (33) to fit the temperature data in the thickness direction. Because of the high fitting accuracy of the discrete temperature data of the concrete bridge tower in the wall thickness direction by Formula (33), the exponential loading mode shown in Figure 28 can be used to complete the application of temperature load in the calculation of the structural temperature effect.

6. Conclusions

(1)
In this paper, a set of accurate and efficient three-dimensional temperature field simulation methods was formed by the secondary development of Abaqus software Version 6.10. The comparison results between the simulated data and the experimental data of the temperature field show that the maximum deviation between the simulated temperature value and the measured value was only 3.3 °C. The calculation accuracy of the proposed algorithm can better meet the needs of engineering applications.
(2)
The real-time shadow occlusion state was successfully displayed through the improvement of the three-dimensional sunshine temperature field simulation algorithm in this paper and the cloud image customization function in Abaqus software Version 6.10., and the real-time sunshine shadow width identified by the algorithm was compared with the theoretical value calculated by the theoretical formula. The maximum difference between the two was only 19.1 mm, which proves that the sunshine shadow recognition algorithm proposed in this paper has extremely high recognition accuracy.
(3)
The results of the surface temperature difference analysis of the concrete bridge tower show that the temperature difference between the external surfaces of the structure can reach 11.6 °C under the influence of sunshine and shadow, which is far more than the recommended temperature difference value (±5 °C) given in the “Design of Highway Cable-Stayed Bridge” (JTG/T 3365–01–2020). Therefore, the principle of “bridge-by-bridge analysis” is recommended in this paper.
(4)
For concrete bridge towers, the temperature change was relatively obvious only at a range of 0.3 m from the external surface of the tower wall, and the temperature change was small in the remaining range.
(5)
The temperature distribution of the concrete bridge tower in the direction of thickness conforms to the exponential function T(x) = T0eαx + C. Additionally, the data fitting results indicate that using the temperature data at a distance of 0.8 m from the external surface as the calculation parameter in the function can achieve the ideal result, and the minimum correlation coefficient of the fitting result was 0.968.

Author Contributions

Conceptualization, S.Z. and J.X. (Jun Xiao); methodology, S.Z. and J.X. (Jun Xiao); software, S.Z. and J.Z.; validation, J.X. (Jun Xiao), J.X. (Jianping Xian), and J.Z.; formal analysis, Y.Z. and J.Z.; investigation, J.X. (Jianping Xian); resources, J.X. (Jun Xiao); data curation, S.Z.; writing—original draft preparation, S.Z. and J.X. (Jun Xiao); writing—review and editing, J.Z.; visualization, Y.Z.; supervision, J.X. (Jun Xiao); project administration, S.Z.; funding acquisition, J.X. (Jun Xiao). All authors have read and agreed to the published version of the manuscript.

Funding

This research was funded by the Science and Technology Project of the Shaanxi Department of Transportation (grant number: No. 21–59K) and the Science and Technology Project of the Shaanxi Department of Transportation (grant number: No. 21–43K).

Institutional Review Board Statement

Not applicable.

Informed Consent Statement

Not applicable.

Data Availability Statement

Data are contained within the article.

Conflicts of Interest

The authors declare no conflict of interest.

References

  1. Tang, H. Study on Key Problems of Cable-Stayed Bridge PC Pylon. Doctor’s Thesis, Southeast University, Nanjing, China, 2006. [Google Scholar]
  2. Feng, Z.; Shen, J.; Wang, X. Finite element analysis of thermal stress for cable-stayed bridge tower with cracks. Appl. Mech. Mater. 2012, 178–181, 2085–2090. [Google Scholar] [CrossRef]
  3. Zhang, Q.; Ma, Y.; Wang, B. Analysis of temperature field and thermal stress characteristics for a novel composite bridge tower catering for plateau environment. Bridge Constr. 2020, 50, 30–36. [Google Scholar]
  4. Martucci, D.; Civera, M.; Surace, C. Bridge monitoring: Application of the extreme function theory for damage detection on the I-40 case study. Eng. Struct. 2023, 279, 115573. [Google Scholar] [CrossRef]
  5. Civera, M.; Sibille, L.; Fragonara, L.Z.; Ceravolo, R. A DBSCAN-based automated operational modal analysis algorithm for bridge monitoring. Measurement 2023, 208, 112451. [Google Scholar] [CrossRef]
  6. JTG D60–2015; General Specifications for Design of Highway Bridges and Culverts. China Communication Press: Beijing, China, 2015. (In Chinese)
  7. JTG/T 3365–01–2020; Specifications for Design of Highway Cable-Stayed Bridge. China Communication Press: Beijing, China, 2015. (In Chinese)
  8. Chapman, H.E.; Kennaird, A.R.; Huizing, J.B.S.; Stanford, P.R.; Wood, J.H. Changes in New Zealand highway bridge design. N. Z. Eng. 1974, 29, 159–168. [Google Scholar]
  9. Ren, X.; He, Q.; Tong, Y.; Huang, P. Temperature and stress fields analysis of concrete bridge tower. J. Zhengzhou Univ. 2011, 32, 62–65. [Google Scholar]
  10. Ren, X.; Huang, P. Analysis of cracking surface stress field of type I crack of concrete bridge tower under action of temperature field. Word Bridges 2011, 6, 50–53. [Google Scholar]
  11. Yang, D.; Yi, T.; Li, H.; Zhang, Y. Monitoring and analysis of thermal effect on tower displacement in cable-stayed bridge. Measurement 2018, 115, 249–257. [Google Scholar] [CrossRef]
  12. Zhang, H.; Li, J.; Liu, C.; Jiang, T.; Wei, J. Thermal effect of the cable-stayed bridge tower. Wuhan Univ. J. Nat. Sci. 2003, 8, 1121–1125. [Google Scholar]
  13. Zhou, H.; Yi, Y.; Ye, Z.; Li, M. Analysis of temperature field and thermal effect in long-span composite girder cable-stayed bridge. Bridge Constr. 2020, 50, 50–55. [Google Scholar]
  14. Imbsen, R.A.; Vandershaf, D.E.; Schamber, R.A.; Nutt, R.V. Thermal Effects in Concrete Bridge Super Structures; AASHTO: Washington, DC, USA, 1985. [Google Scholar]
  15. Zhang, C.; Liu, Y.; Liu, J.; Yuan, Z. Validation of Long-term Temperature Simulations in a Steel-concrete Composite Girder. Structures 2020, 27, 1962–1976. [Google Scholar] [CrossRef]
  16. Peter, S.; Michaei, A.; Steve, M. Fundamentals of Computer Graphics; CRC Press: Boca Raton, FL, USA, 2009. [Google Scholar]
  17. Gu, B.; Xie, F.; Lei, L.; Gao, W. Computational method for 3D sunshine temperature field of long-span bridge structures. J. Southeast Univ. 2019, 49, 664–671. [Google Scholar]
  18. Wang, Z.; Liu, Y.; Tang, Z.; Zhang, G.; Liu, J. Three-dimensional temperature field simulation method of truss arch rib based on sunshine shadow recognition. China J. Highw. Transp. 2022, 35, 91–105. [Google Scholar]
  19. Zhang, X.; Ren, Z.; Mei, F. Heat Transfer Theory; China Architecture& Building Press: Beijing, China, 2007. [Google Scholar]
  20. Peng, Y. Studies on Theory of Solar Radiation Thermal Effects on Concrete Bridges with Application. Doctor’s Thesis, Southwest Jiaotong University, Chengdu, China, 2007. (In Chinese). [Google Scholar]
  21. Duffie, J.A.; Beckman, W.A. Solar Engineering of Thermal Processes, 4th ed.; John Wiley & Sons, Inc.: Hoboken, NJ, USA, 2013. [Google Scholar]
  22. Ohvril, H.; Okulov, O.; Teral, H.; Teral, K. The atmospheric integral transparency coefficient and the Forbes effect. Sol. Energy 1999, 66, 305–317. [Google Scholar] [CrossRef]
  23. Hottel, H.C. A simple model for estimating the transmittance of direct solar radiation through clear atmospheres. Sol. Energy 1976, 18, 129–134. [Google Scholar] [CrossRef]
  24. Zhao, R.; Wang, Y. Studies on temperature field boundary conditions for concrete box-girder bridges under solar radiation. China J. Highw. Transp. 2016, 29, 52–61. [Google Scholar]
  25. Chen, B.; Sun, Y.; Wang, G.; Duan, L. Assessment on Time-Varying Thermal Loading of Engineering Structures Based on a New Solar Radiation Model. Math. Probl. Eng. 2014, 2014, 639867. [Google Scholar] [CrossRef] [Green Version]
  26. Severny, A. Solar Physics; University Press of the Pacific: Stockton, CA, USA, 2004. [Google Scholar]
  27. Kim, S.H.; Cho, K.I.; Won, J.H.; Kim, J.H. A study on thermal behavior of curved steel box girder bridges considering solar radiation. Arch. Civ. Mech. Eng. 2009, 9, 59–76. [Google Scholar] [CrossRef]
  28. Elbadry, M.M.; Ghali, A. Nonlinear temperature distribution and its effects on bridges. Struct. Eng. Int. 1983, 3, 169–191. [Google Scholar]
  29. Kelbek, K. Effects of Solar Radiation on Bridge Structures; China Railway Publishing House: Beijing, China, 1981. [Google Scholar]
  30. GB 50009-2012; Load Code for the Design of Building Structures. China Architecture & Building Press: Beijing, China, 2012. (In Chinese)
  31. Larsson, O.; Thelandersson, S. Estimating extreme values of thermal gradients in concrete structures. Mater. Struct. 2011, 44, 1491–1500. [Google Scholar] [CrossRef]
  32. Huang, X.; Zhu, J.; Li, Y. Temperature analysis of steel box girder considering actual wind field. Eng. Struct. 2021, 246, 113020. [Google Scholar] [CrossRef]
  33. Li, Y.; Huang, X.; Zhu, J.; Zhang, M. Thermal Effect and Anti-Crack Performance Optimization of Bridge Pylon under Extreme Weather Conditions. J. Southwest Jiaotong Univ. Available online: https://kns.cnki.net/kcms/detail/51.1277.u.20220426.1632.002.html (accessed on 4 April 2023).
  34. Zhang, L.; Yang, L.; Yang, Z.; Zhao, Y.; Liu, H. Temperature field analysis of long-span concrete box girders. J. Civ. Archit. Environ. Eng. 2011, 33, 36–42. [Google Scholar]
  35. Zhu, J.; Meng, Q. Effective and fine analysis for temperature effect of bridges in natural environments. J. Bridge Eng. 2017, 22, 04017017. [Google Scholar] [CrossRef]
  36. Abaqus. Abaqus Scripting User’s Manual; Version 6.10; Abaqus Inc.: Palo Alto, CA, USA, 2010. [Google Scholar]
  37. Pang, Z. The Research of Temperature Field and Effect of PC Curved Box Girder Bridge of City. Master’s Thesis, Nanjing Tech University, Nanjing, China, 2015. [Google Scholar]
  38. Gu, B.; Xie, F.; Qian, H.; Lei, L. 3D-temperature field and its effect of inverted Y-shaped concrete pylon in lower Yangtze region. J. Cent. South Univ. 2020, 50, 248–260. [Google Scholar]
  39. Zhang, N.; Liu, Y.; Liu, J.; Ji, D.; Fang, J.; Stiemer, S.F. Temperature effects of H-shaped concrete pylon in arctic-alpine plateau region. J. Traffic Transp. Eng. 2017, 17, 66–77. [Google Scholar]
  40. Zhang, Y. Studies on Temperature Effects and Its Influence on Stability for High Pier with Thin-Walled Hollow Sections. Doctor’s Thesis, China Academy of Railway Sciences, Beijing, China, 2011. (In Chinese). [Google Scholar]
  41. Dai, G.; Tang, Y.; Liu, Y.; Su, H. Numerical simulation and test analysis of three-dimensional solar temperature field of hollow tall-piers with rounded rectangular cross section. J. Railway Eng. Soc. 2016, 33, 57–62. [Google Scholar]
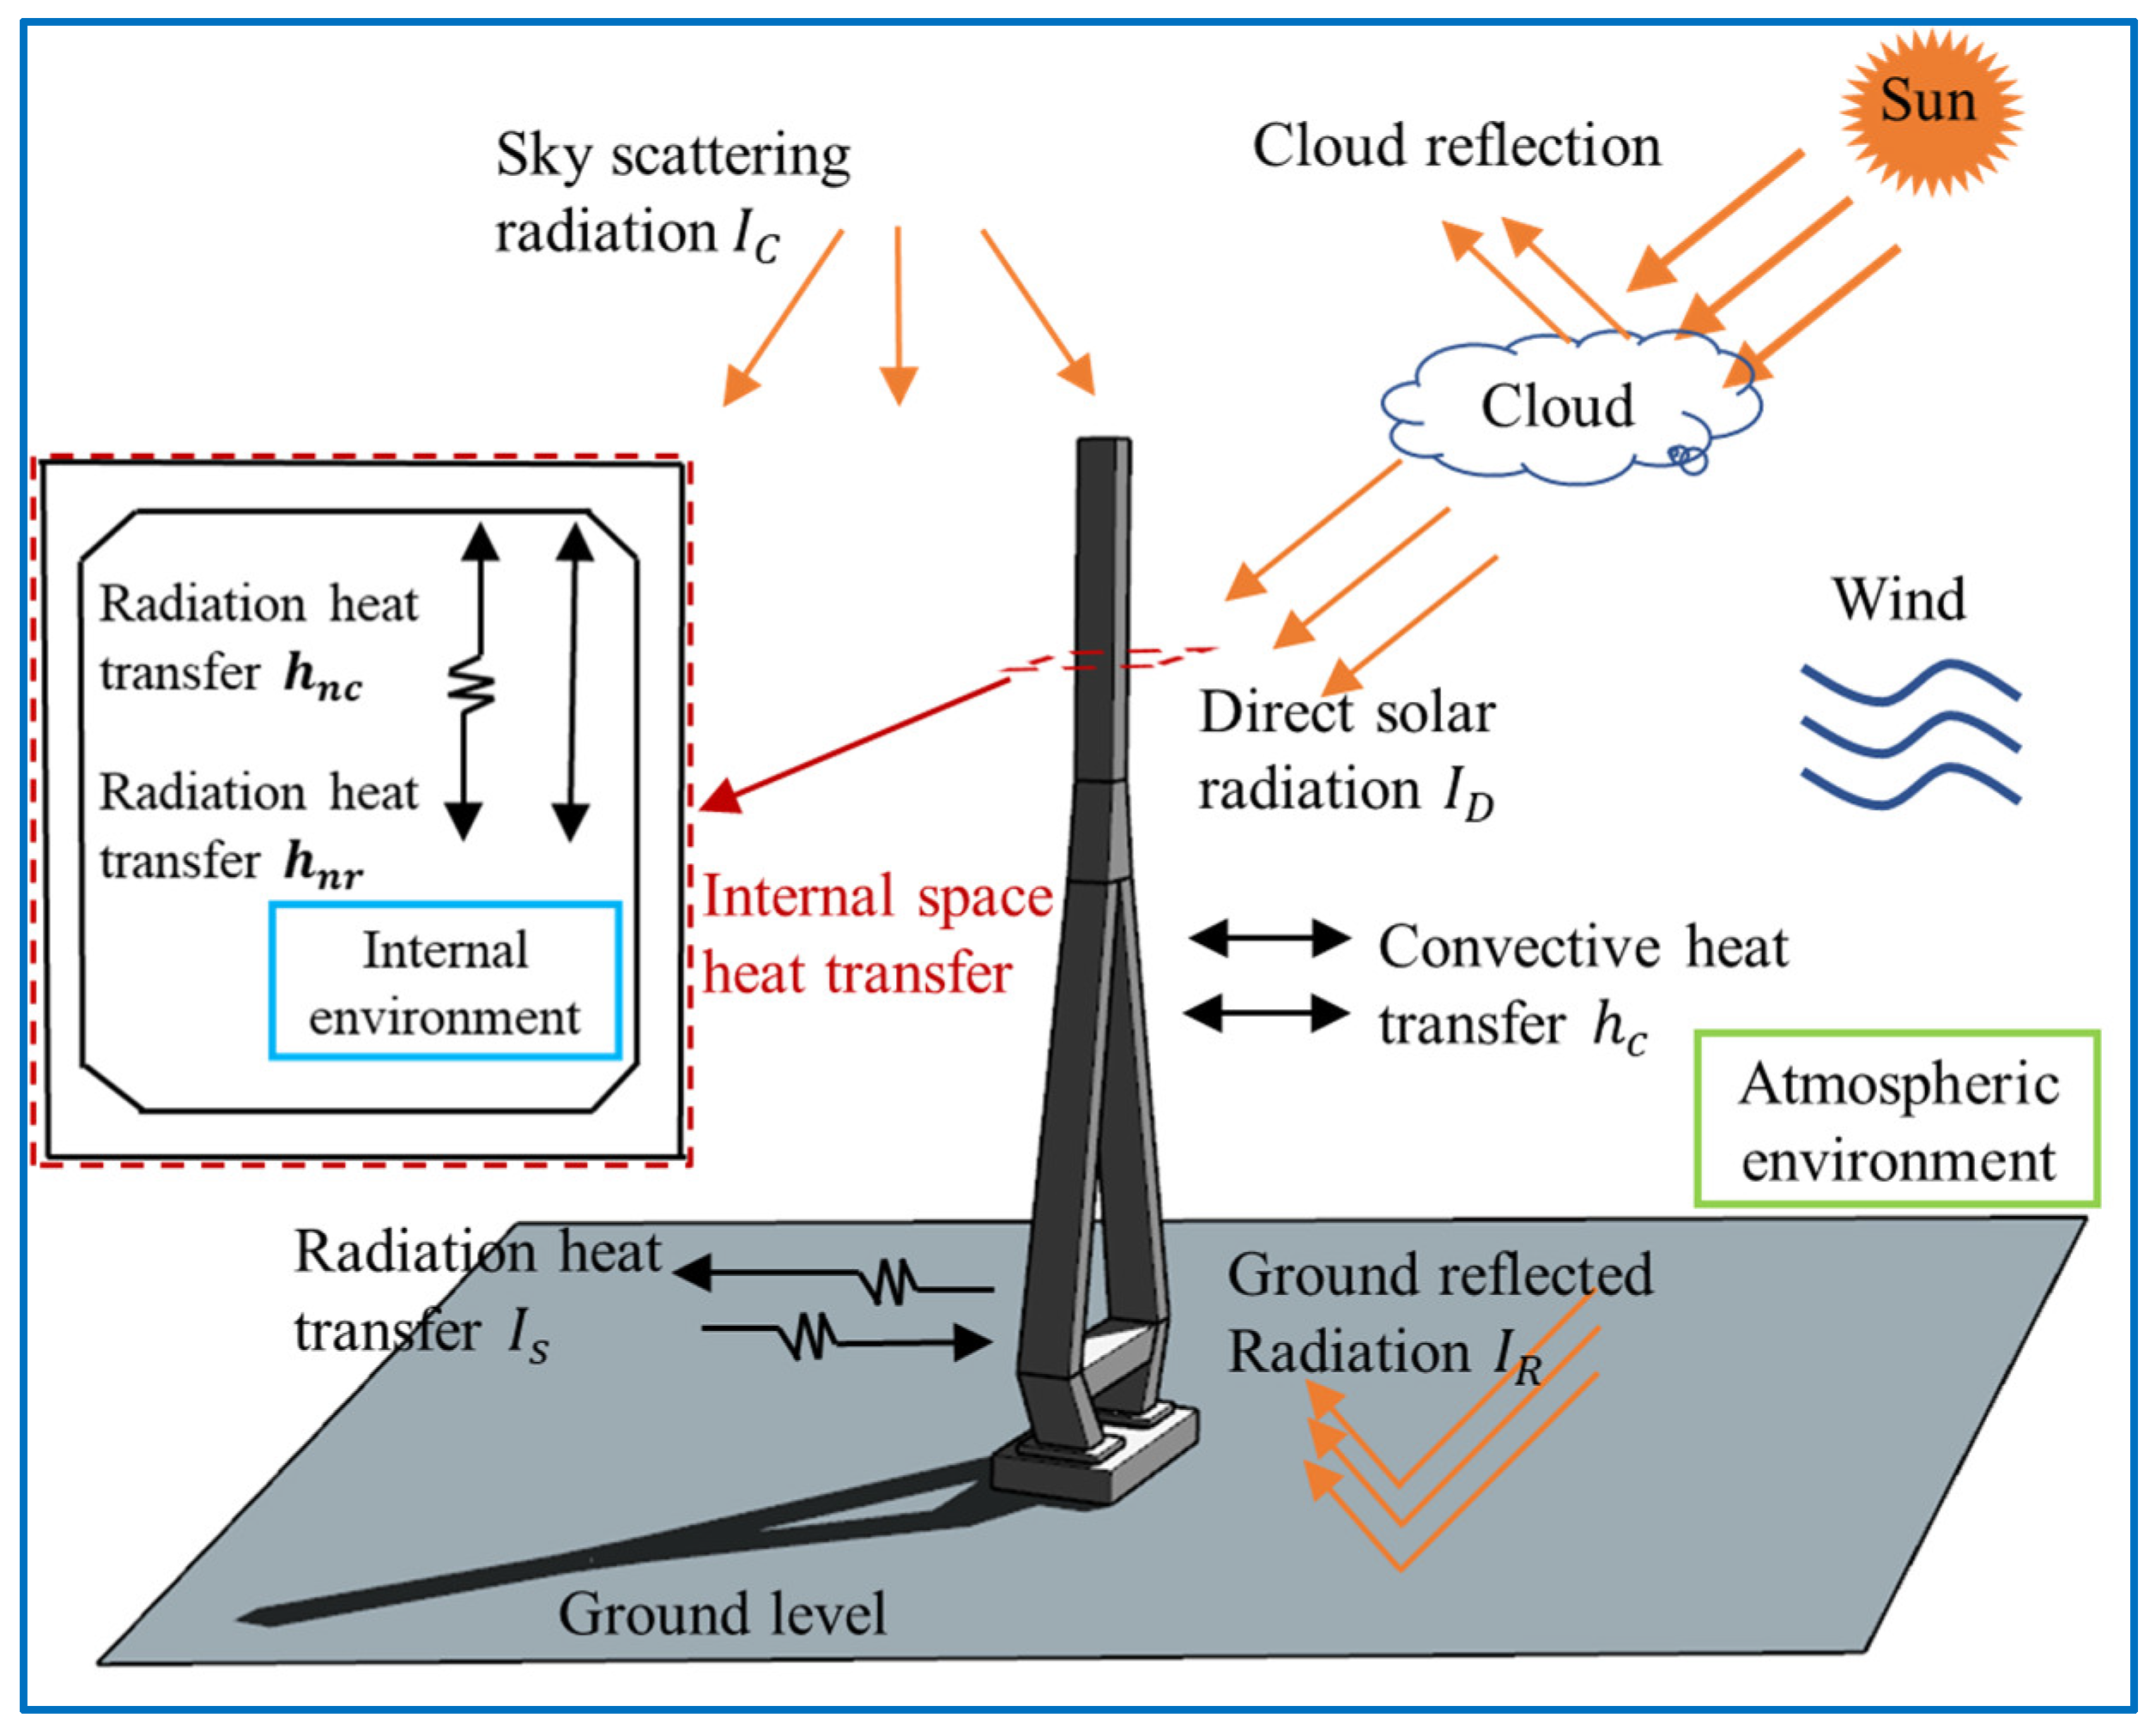
Figure 1. Schematic diagram of heat exchange between structural surfaces and the environment. Note: In the figure, I is the heat flow density and h is the heat transfer coefficient.
Applsci 13 04769 g001
Figure 2. The relative position relationship between the sun and the inclined plane.
Applsci 13 04769 g002
Figure 3. Relationship between structural surface shadow occlusion and solar radiation.
Applsci 13 04769 g003
Figure 4. Daily temperature model.
Applsci 13 04769 g004
Figure 5. Shadow occlusion classification.
Applsci 13 04769 g005
Figure 6. Sunshine shadow recognition technology implementation process.
Applsci 13 04769 g006
Figure 7. The schematic diagram of the projection mode of the node to be detected and the structural surface mesh.
Applsci 13 04769 g007
Figure 8. The principle of projection point inclusion detection.
Applsci 13 04769 g008
Figure 9. The triangular barycentric coordinate method.
Applsci 13 04769 g009
Figure 10. Three-dimensional sunshine temperature field analysis process.
Applsci 13 04769 g010
Figure 11. Sunshine shadow display operation process.
Applsci 13 04769 g011
Figure 12. Section measuring point arrangement and size diagram.
Applsci 13 04769 g012
Figure 13. The finite element model and mesh division diagram.
Applsci 13 04769 g013
Figure 14. The shadow occlusion relationship diagram of the box-girder web.
Applsci 13 04769 g014
Figure 15. Comparison of Shadow Occlusion Results.
Applsci 13 04769 g015
Figure 16. Temperature change curve of floor and roof.
Applsci 13 04769 g016
Figure 17. Temperature change curve of the web on the sunward side and shaded side.
Applsci 13 04769 g017
Figure 18. Schematic diagram of the bridge tower structure. (a) The elevation of the bridge tower; (b) Section A; (c) Section B.
Applsci 13 04769 g018
Figure 19. Shadow occlusion state and temperature field cloud of the bridge tower at 10:00 a.m. (a) The shaded state of the bridge tower surface; (b) the temperature field cloud map.
Applsci 13 04769 g019
Figure 20. The temperature change of the bridge tower surface with height at 10:00 a.m.
Applsci 13 04769 g020
Figure 21. The temperature change curve of the outer surface of the tower wall at a height of 125 m and the temperature difference curve between the opposite faces of the tower column.
Applsci 13 04769 g021
Figure 22. The temperature change curve in the thickness direction of the east tower wall at a 125 m height in the early morning.
Applsci 13 04769 g022
Figure 23. The temperature variation curve at night in the thickness direction of the east tower wall at a 125 m height.
Applsci 13 04769 g023
Figure 24. The temperature variation curve in the thickness direction of the east tower wall at a 125 m height during the day.
Applsci 13 04769 g024
Figure 25. The maximum variation of temperature at the same distance from the external surface of the tower wall at a height of 125 m.
Applsci 13 04769 g025
Figure 26. Two-dimensional temperature field cloud of tower column section at a 125 m height.
Applsci 13 04769 g026
Figure 27. The fitting results of discrete temperature data. (a) The east tower wall; (b) the south tower wall; (c) the west tower wall; (d) the north tower wall; (e) the inner east tower wall; (f) the inner west tower wall. Note: The temperature fitting curve 1 in the figure is the result of fitting the temperature value at 0.8 m from the external surface as the parameter C in Formula (33); the temperature fitting curve 2 is the result of fitting the temperature value of the internal surface as the parameter C in Formula (33).
Applsci 13 04769 g027aApplsci 13 04769 g027b
Figure 28. Temperature load loading mode. Note: T1(x), T2(x), T3(x), and T4(x) in the diagram are all the calculation relations of temperature in the thickness direction of each tower wall fitted by Formula (33).
Applsci 13 04769 g028
Table 1. Thermal parameters of materials.
Parameter Density (kg/m3)Thermal Conductivity
(W/(m·°C))
Specific Heat Capacity (J/(kg·°C))Radiation Absorption Rate
Value24002.59000.5
Table 2. Atmospheric temperature data.
DateMaximum Temperature/°C *Minimum Temperature/°C *Maximum Temperature Difference/°C
10 August 2013392910
11 August 201339309
12 August 2013392910
13 August 2013392811
14 August 2013382711
* Note: The atmospheric temperature is the air temperature measured by a thermometer away from the surface of the bridge deck/tower concrete.
Table 3. Material property parameters.
Order NumberMaterialParameterValue
1Concrete (C50)Density (kg/m3)2650
2Elastic modulus (Pa)3.45 × 10¹⁰
3Poisson ratio0.25
4Thermal expansion coefficient1.0 × 10−5
5Thermal conductivity (W/(m·°C))2.0
6Specific heat capacity (J/(kg·°C))970
Table 4. Atmospheric temperature data.
DateWeather ConditionsMaximum Temperature/°CMinimum Temperature/°C
16 August 2022Fine3427
17 August 2022Fine3628
18 August 2022Fine3727
19 August 2022Fine3728
Disclaimer/Publisher’s Note: The statements, opinions and data contained in all publications are solely those of the individual author(s) and contributor(s) and not of MDPI and/or the editor(s). MDPI and/or the editor(s) disclaim responsibility for any injury to people or property resulting from any ideas, methods, instructions or products referred to in the content.