Abstract
Emotions are a crucial part of our daily lives, and they are defined as an organism’s complex reaction to significant objects or events, which include subjective and physiological components. Human emotion recognition has a variety of commercial applications, including intelligent automobile systems, affect-sensitive systems for customer service and contact centres, and the entertainment sector. In this work, we present a novel deep neural network of the Convolutional Neural Network - Bidirectional Gated Recurrent Unit (CNN-RNN) that can classify six basic emotions with an accuracy of above 95%. The deep model was trained on human gait data captured with body-mounted inertial sensors. We also proposed a reduction in the input space by utilizing 1D magnitudes of 3D accelerations and 3D angular velocities (, ), which not only minimizes the computational complexity but also yields better classification accuracies. We compared the performance of the proposed model with existing methodologies and observed that the model outperforms the state-of-the-art.
1. Introduction
Humans have access to a wide range of verbal and nonverbal cues from nature with which to communicate their emotions. Our emotions greatly influence our social relationships. Emotions are complex mental states that comprise subjective experience, pathological and physiologic responses, and other factors [1,2]. They are consistent responses to events based on some stimuli, and the intensity of response varies from human to human. Human Emotion Recognition (HER) has several exciting application areas such as human–computer interaction to better understand and respond to human-centric events, affect-sensitive systems for autism therapy, chat-bots in call centres, in the entertainment industry, and so on. Such applications can potentially alter the way we interact with computers in our daily lives [3,4,5].
Humans can express emotions both verbally and non-verbally. The expression of verbal emotions is limited and typically indicated by known words, idioms, or phrases, whereas nonverbal emotions can be shown more diversely. Nonverbal emotions can be revealed through physiological indications, facial expressions, speech, gestures, etc. For many decades, psychologists and scientists have extensively explored the field of human sentiment analysis to understand human emotions [6,7,8,9]. On the one hand, psychologists probe human emotions from the perspective of social psychology as “emotions naturally emerge out of the core principles of evolutionary psychology” [10]. However, scientists from other fields, such as the medical sciences, hardware design engineering, computer science, etc., investigate emotions to comprehend how the brain functions, to create new, improved hardware, and to create intelligent systems to assess, forecast, and identify human affective states.
With the rapid advancement of consumer electronics, it is now feasible to capture human emotions using various technologies (including smart devices). This includes, but is not limited to, vision sensors to capture facial expressions or record human gait in the form of videos [11,12], speech-based emotions recognition [13,14,15], electroencephalograms (EEG) to record the electrical activity of the brain [16,17], and wearable inertial sensors to capture human gait data under different affective states [16]. Facial expressions, being the most prominent artefact of intimate emotions, have been extensively explored [18]. Although facial expression-based emotions prediction has improved significantly over time, environment and occlusion-invariant facial expression-based emotions recognition systems are still very challenging, especially given the COVID-19 situation where it is recommended to wear face masks. Moreover, recording facial data raises serious privacy concerns and hence cannot be used in practical applications. Furthermore, facial expressions are not trustworthy indicators of emotion since they may be manipulated and are not generated as a result of a particular feeling [19].
Wearable inertial sensors, such as smart fitness bands, smartwatches, smart in-soles, etc., have turned into a key enabling technology for a wide variety of applications. They are low cost, do not impose any environmental constraints, and have been widely used in human gait analysis, healthcare and health monitoring, and sports activities [20,21,22,23,24]. The inertial gait data collected via wearable gadgets have been analysed to better understand human motion from a variety of perspectives such as estimating soft-biometrics such as gender, age, and height [25,26], predicting emotions [19,27,28], classification of terrains and ground surfaces [29], human activity recognition [30,31], cognitive impairment and fall detection [32,33,34], and even person re-identification [35,36].
Body posture and movement are the most independent forms of expressing human emotions, as opposed to facial expressions, which may be altered and hence faked. Much research suggests that the kinematics of walking can convey emotional states [19,37,38,39,40,41]. However, most prior research either deals with a restricted range of emotions or has marginally poor classification accuracies and hence cannot be employed in practical applications [27,42,43].
The work at hand presents a CNN-RNN-based deep learning model, which can predict emotions from human gait using low-level kinematic signals. To train the model, we used an inertial-based emotions dataset collected in one of our previous studies [19]. An autobiographical memories paradigm was employed for emotional stimuli to collect the emotional data. A chest-mounted smartphone with on-board inertial sensors (tri-axial accelerometer and tri-axial gyroscope) was used to capture gait data from 40 healthy volunteers for six fundamental human emotions, including anger, happy, disgust, sad, fear, and surprise. Subjects were instructed to recollect a prior significant incident and walk straight twice for 10-meters back and forth for each emotion. This resulted in a 40-m walk for each mood.
During the design of the deep model, a key factor was reducing the model’s complexity to speed up the learning process. To this end, we proposed the computation of the magnitude of 3D accelerations () from the raw signals in the pre-processing step. This reduces the input space from 3D to 1D. Similarly, we compute the magnitude of 3D angular velocities () from the raw signals, which reduces the input space from 3D to 1D. The proposed model was separately trained and validated with and . For the sake of comparison, the proposed model was validated with a 3D input space (3D accelerations and 3D angular velocities) as well as a 6D input space (6D accelerations and angular velocities). During experimentation, it was observed that the reduction of input size to 1D ( or ) significantly reduces the computation time as compared to 3D or 6D input sizes. Furthermore, the proposed methodology also outperforms existing state-of-the-art approaches. The following are the significant contributions of this work:
- We present a CNN-RNN deep architecture (inspired by InceptionResNet CNN and BiGRU models) where we proposed a novel approach of dense connections employing 1 × 1 convolutions from raw input to the BiGRU model (see Section 4);
- The proposed deep model was trained and evaluated with different input sizes (1D–6D) for the sake of comparison and the best results are reported (Section 5);
- The proposed model was compared with the existing approaches and it was observed that the proposed model outperforms the state-of-the-art approaches (Section 6.1).
The rest of the article is organised as follows: Section 2 discusses related literature, Section 3 describes the dataset used in this study; Section 4 explains the methodology including pre-processing, the proposed model, the training procedure, and the model’s complexity; Section 5 presents the results computed with different input sizes, and Section 6 concludes the article.
2. Literature Review
Emotion recognition based on inertial sensor data and machine or deep learning entails collecting data on bodily movements and gestures associated with various emotions using sensors such as accelerometers and gyroscopes. These data are subsequently analysed by AI systems to precisely detect an individual’s emotional state.
There are various advantages of using inertial sensors and AI for emotion recognition over traditional approaches such as facial expression analysis or self-reporting. They can give a more objective and accurate assessment of emotions, even when people are attempting to conceal their emotions.
Accurate assessment of the emotional state of a user is vital for improving machine–user interactions. Smart wearable devices are the right choice for emotional estimation because of ease of use, mobility, privacy, and the ubiquity of IMUs in these devices. In this context, Zhang et al. [27] investigated the use of smart wristbands with built-in accelerometers to identify three human emotions: neutral, angry, and happy. A population of 123 subjects was used to collect emotional data and traditional machine-learning classifiers were used for training and validation. They reported the best classification accuracy of 81.2%. The dataset proposed in this study includes only the data of Chinese subjects and data on only three emotions were collected.
Piskioulis et al. [37] described a method for emotion recognition based on non-intrusive mobile sensing employing accelerometer and gyroscope sensor data supplied by cellphones. To monitor the players’ sensor data while playing the game, an Android OS sensor log app was employed, and a prototype gaming software was created. Data from 40 participants were analysed and used to train classifiers for two emotions: happiness and impatience. The validation investigation found that the accuracy for joy is 87.90% and the accuracy for frustration is 89.45%. This study only deals with two types of emotions.
Reyana et al. [38] designed a system for emotion recognition based on physiological inputs. Body sensors such as muscle pressure sensors, heartbeat sensors, accelerometers, and capacitive sensors were used to gather signals. There were four classes: happy, sad, furious, and neutral. The suggested approach achieved the following percentages of accuracy for emotional states: happy 80%, sad 70%, angry 90%, and neutral 100%. The study considered only three basic emotions.
Quiroz et al. [42] performed emotion recognition based on smart bands inertial sensors data. The dataset collected was based on 50 volunteers. The volunteers were given audio-visual stimuli to enter a state and then were requested to walk. The presented study only dealt with two classes—happy and sad. The accuracy achieved was 75%.
Gravina and Li used sensor and feature-level fusion techniques based on body-worn inertial sensors attached to users’ wrists and a pressure detection module put on the seat to construct a system that identifies and monitors in-seat actions [44]. They concentrated on four major emotional activities: frustration, sadness, curiosity, and happiness. Their findings revealed that integrating temporal and frequency-domain data from all sensors resulted in outstanding classification accuracies (about 99.0%).
A complete system for ambient assisted living was proposed by Costa et al. [8] to alter the environment of the living based on the emotions of the elderly. They developed a smart band to measure electrodermal activity, temperature, heart rate, and mobility. They proposed a neural network consisting of fully connected layers which were trained on 18 features to classify eight different emotions, i.e., happiness, contempt, anger, disgust, fear, sadness, neutral, and surprise. They reported 20% of misclassification cases. The study proposed collecting data on eight emotions but made use of multiple sensors including heart rate and temperature sensors which are usually not available in smart-wearable devices.
The study by Cui et al. [43] employed a smartphone’s onboard tri-axial accelerometer attached to the wrist and ankle of the subjects to collect data for three emotions: happy, neutral, and anger. They extracted 114 features using principal component analysis (PCA). Different classical machine learning classifiers were trained and they found that the support vector machine (SVM) performed best. They also provided a comparison of emotional identification using wrist versus ankle data. They reported the best classification accuracy of 85% and also showed that the emotions prediction from the ankle sensor is much higher than from the wrist sensor.
Hashmi et al. [19] collected emotion data from smartphones’ onboard IMUs for six different emotions: anger, sad, happy, fear, disgust, and surprise. They demonstrated a manually-built feature set that comprised elements from the time, frequency, and wavelet domains. They concluded that time, frequency, and wavelet domain characteristics may be employed to train various supervised learning models. The best classification accuracy for all six emotions is stated to be 86.45%.
In the majority of the studies above, the number of classes is limited excluding the study [19] which deals with the case of classifying six activities.
3. Emotions Dataset
The current study was an extended work of one of our previous studies [19], where extensive data collection sessions were conducted to record emotional data. A total of 40 healthy subjects participated in the data collection session (male-to-female ratio of 26:14, an average age of 25.2 ± 5.9 (years), an average height of 171.6 ± 8.4 (cm)). A chest-mounted smartphone with a built-in tri-axial accelerometer and tri-axial gyroscope was used to collect inertial data. Six basic emotions were selected as proposed by Ekman and Friesen [45] and include “happy”, “fear”, “sad”, “disgust”, “anger” and “surprise”. For emotional stimuli, an autobiographical memories paradigm was employed, where the subjects were asked to recall a past relevant emotional event before the start of each trial. The subjects walked naturally and no special instructions were given in this regard. The participants recalled a relevant event for each emotion and walked straight for 40 m. The total number of samples in the dataset is 839,800. The class distribution of different emotions is shown in Figure 1a. It can be observed from the class distribution that the dataset is not fully balanced. Figure 2 depicts the data collection process.
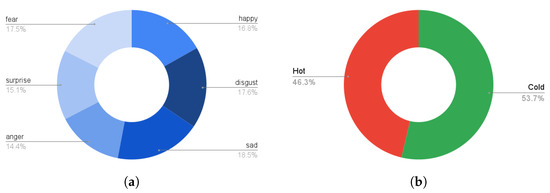
Figure 1.
Class distribution for emotions dataset used in this study is shown. (a) class distribution of six basic emotions; (b) class distribution of hot and cold emotions.
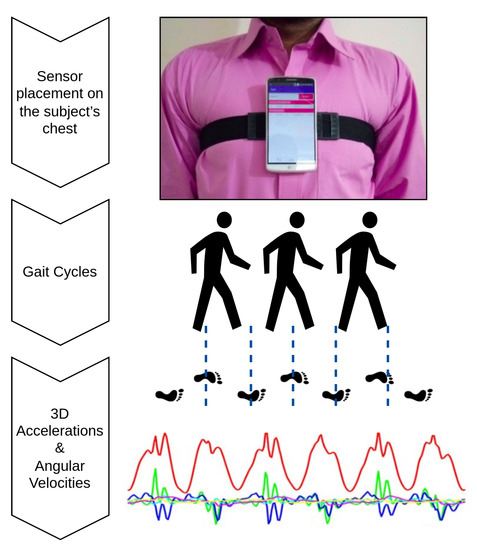
Figure 2.
Data Collection: The inertial gait data were collected in one of our previous studies [19] using a chest-mounted smartphone having an on-board tri-axial accelerometer and a tri-axial gyroscope. An autobiographical memories paradigm was employed, where the subjects were asked to recall a past relevant emotional event before the start of each trial.
Hot vs. Cold Emotions Mapping
A hot emotion is associated with a high degree of interest, passion, or activity along with a high level of arousal, from the biological context, when dopamine—a type of neurotransmitter—is released and blood pumps through the muscles. Hot emotions make us feel hotter and more active, and our skin may get red, exacerbating the feeling and look of a higher temperature. On the contrary, when the arousal level is low, humans experience cold emotions. They could have a more cognitive experience than an emotional experience. While cold, we may remain calm and in control of ourselves. We might also be bored, flat, or sluggish [46,47,48].
We categorized the emotional data into hot and cold emotion classes resulting in a binary classification problem. Table 1 maps all six emotions into two classes. The hot emotions include angry, surprise, happy, whereas the cold emotions include fear, sad, disgust. Fear is an emotion which is associated with both high arousal levels (e.g., a sudden encounter with a harmful object) and low arousal levels (e.g., a concern/worry of being unable to achieve a goal). Since an autobiographical memories paradigm was employed in the data collection, we have placed the fear emotion under the cold category. The class distribution for generated hot and cold classes is presented in Figure 1b (hot: 46.3%, cold: 53.7%).

Table 1.
Mapping of six basic emotions to hot and cold classes.
4. Methodology
In this section, we will discuss the proposed methodology. We will start with thepPre-processing (Section 4.1) where we describe the computation of the magnitudes of 3D accelerations and 3D angular velocities. Then, the proposed deep architecture is explained (Section 4.2). Afterwards, the model training process is described (Section 4.3). The complete flow of the suggested approach is depicted in Figure 3.
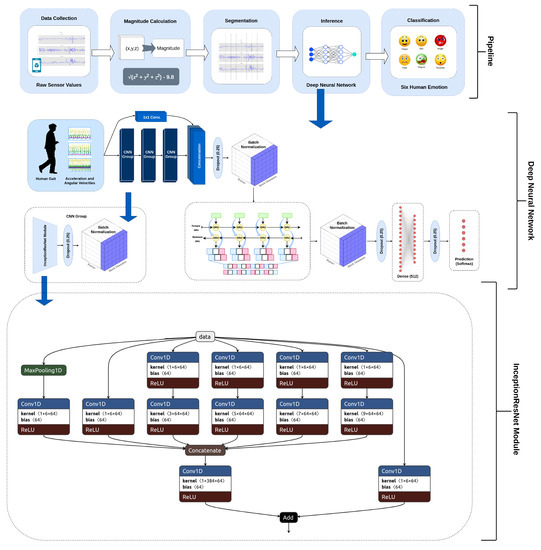
Figure 3.
The end-to-end pipeline of the presented approach. The raw sensors data are segmented. The magnitude feature is computed and used for training and inference of the presented model. Schematic presentation of the proposed CNN-RNN type model. The input vector is passed to three InceptionResNet-inspired modules. The generated feature map is concatenated with raw signals made of the same spatial dimensions using 1 × 1 convolutions and is passed to a bi-directional GRU of 128 units. Batch normalization is applied to the feature map generated by Bi-GRU. Then, the generated vector is flattened and passed to the 512 units dense layer. Dropout is used for regularization and then classification is performed. InceptionResNet inspired presented module. The input feature map is convolved with 5 different-sized kernels and a max-pool is also applied. 1 × 1 convolution is applied before applying different-sized kernels to reduce overall complexity. The generated feature maps are concatenated and added to the input feature map. The spatial dimensions are made the same using 1 × 1 convolutions.
4.1. Pre-Processing
A critical goal of the proposed work was minimizing computational complexity, making it more suitable for Internet of Things (IoT) applications and real-time systems. One way to minimize the system’s complexity is to reduce the input size [49]. The main advantage of 1D magnitudes is the removal of the sensor’s orientation effect. Such an effect is noticeable when the sensor is attached to a joint with higher degrees of freedom, e.g., a wrist-mounted smartwatch or smart band. In this context, we proposed computing a 1D magnitude from 3D accelerations and 3D angular velocities, i.e., reducing the input size from 3D to 1D. The magnitude of the three-dimensional accelerations was calculated as follows. Let , , be 3D accelerations, then the magnitude of the 3D accelerations, , is given as:
The gravitational constant, 9.8, was subtracted from the magnitude to remove the effect of gravity.
Similarly, let , , be 3D angular velocities, then the magnitude of the 3D angular velocities, , is given as:
The and were separately fed into the deep learning model for training and validation.
4.2. The Architecture
The proposed architecture for classifying human emotions consists of the Convolutional Neural Network – Recurrent Neural Network (CNN-RNN) model. The CNN-RNN models were first proposed for image-captioning applications [50], where the CNN models are used to extract visual features from images followed by the recurrent units such as the gated recurrent unit (GRU) [51] or long short term memory (LSTM) [52] to generate captions. The model we proposed comprises two InceptionResNet [53] inspired CNN modules built on a bidirectional RNN [54], consisting of a bidirectional-GRU with 128 units (see Figure 3). The feature map created by the CNN module was concatenated with the raw signals through a connection of a 1 × 1 convolutional layer. To keep the spatial dimensions identical, we used 1 × 1 convolution operations. A total of 64, 1 × 1 kernels were applied to the raw sensor data. This concatenation was inspired by DenseNet [55], which is an image classification model. The benefit of InceptionNet [56] is that it has variable-sized kernels that enable it to detect features of different sizes. Similarly, the ResNet [57], or having a residual connection, lets the model learn the identity; thus, the model is capable of bypassing a module if it does not contribute to classification. For the sequential data, RNNs perform better; therefore, the feature map generated by the CNN modules is given to the bidirectional GRU. The motivation behind introducing the dense connection was that, if CNNs are of no benefit, the raw sensor data are still processed by RNNs resulting in a better classification accuracy. To the best of our knowledge, this type of dense connection, where a feature map generated by CNNs is concatenated with the raw signals, has never before been experimented with for any kind of classification problem. In our experimentation, we found that this significantly improves the performance of the entire model. Figure 3 shows the overall proposed architecture and presents the InceptionResNet modules that are incorporated into the model.
The proposed model has five different kernels, i.e., 1 × 1, 1 × 3, 1 × 5, 1 × 7, and 1 × 9. The input is convolved with 64, 1 × 1 kernels before applying 10 kernels of sizes 1 × 3, 1 × 5, 1 × 7, and 1 × 9. This reduces the overall complexity of the model as pointed out in the existing literature [58]. We tested it by adding different-sized kernels sequentially, which improves the performance significantly. The selection of the number of kernels and their spatial dimensions were based on empirical results (see Section 5.3). Moreover, the addition of a max-pool also improves performance. The feature map generated by the kernels and max-pool was then concatenated. The final output was then passed to 64 kernels of 1 × 1 convolutions to change the spatial dimensions. The input feature map was also passed through 64, 1 × 1 kernels, and feature maps generated from both were then added. The overall architecture has three such modules in it, which were selected by empirical analysis.
The batch normalization and dropout were set to 0.25, and were applied after each module and to the feature map generated by the Bi-GRU units. This significantly reduces the training time. The feature vector generated by Bi-GRU was then reshaped and flattened before passing it to a fully connected layer of 512 neurons. The number of neurons in the dense layer was also selected empirically. A dropout of 0.25 was then applied for the sake of regularization.
4.3. Training Process
For all of the investigations, Google Colaboratory’s runtime GPUs were used. The experiment was carried out entirely with Python using Keras 2.4.3 and Tensorflow 2.4.0 to build the model. Seaborn and Sklearn were used to visualize and compute the confusion matrices and performance reports. A 10-fold cross-validation technique was employed for validation. The batch size was set to 64, and the epoch count was set at 120. The number of epochs was determined empirically by observing the accuracy and loss graphs for training and testing. To minimize loss, the neural network weights and the learning rate should be adjusted. We learned how to adjust the weights or learning rate of our neural network using an optimizer. We experimented with several optimizers, including “Adam”, “Momentum”, “RMSprob”, and others, and found that “Adam” performed the best in comparison with another optimizer.
5. Results
We trained, validated, and tested the aforementioned deep model with the emotions dataset collected in one of our previous studies (as explained in Section 3). The results are presented in the form of confusion matrices, accuracy, precision, recall, and F1-score. Since the data are unbalanced, the accuracy becomes a less accurate performance measure so the remaining assessment parameters were computed to realistically analyze the model’s behaviour. Researchers from the domain of gait analysis also emphasize and strongly advocate using these assessment parameters for the evaluation of unbalanced datasets [31,59,60,61,62,63]. A 10-fold cross-validation technique was employed for validation and was used to evaluate the models; the best results are reported.
The results section is divided into five subsections, namely multi-emotion classification, hot vs. cold emotion classification, the effect of segmentation window size (Section 5.3), accuracy and loss curves (Section 5.4), and complexity of the model (Section 5.5).
5.1. Multi-Emotion Classification
This subsection discusses the multi-emotion classification results computed from the Magnitude of 3D accelerations (Section 5.1.1), Magnitude of 3D angular velocities (Section 5.1.2), 3D accelerations (Section 5.1.3), 3D angular velocities (Section 5.1.4), and 6D accelerations and angular velocities (Section 5.1.5). The results are reported as confusion matrices, F1-Score, precision, and recall.
5.1.1. Magnitude of 3D Accelerations
The main objective of this research activity was the classification of emotions using a deep model with reduced complexity. This was achieved by reducing the input feature space by computing the 1D magnitude of 3D accelerations. Figure 4a shows the confusion matrix computed with a 1D magnitude of 3D accelerations. The average classification accuracy of 95.23% was achieved for six basic emotions. Furthermore, the F1-score, recall, and precision remained at 95% (Figure 5). A significant improvement of 8.5% in classification accuracy was observed in comparison with the results reported by Hashami et al., [19], where the best accuracy of 86.45% was reported.
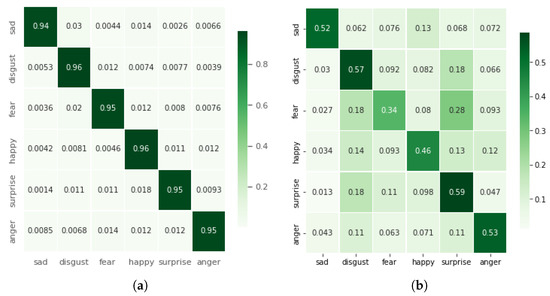
Figure 4.
(a) Confusion matrices computed from the magnitude of 3D accelerations; (b) confusion matrices computed from the magnitude of 3D angular velocities.
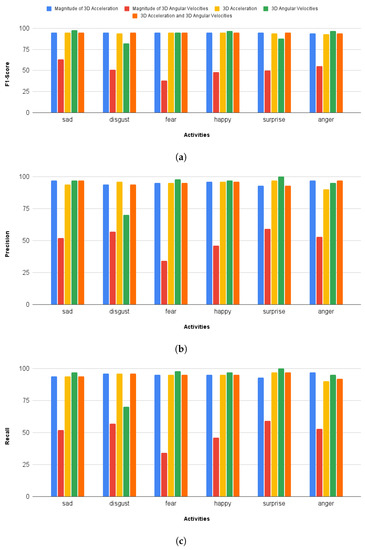
Figure 5.
A comparison of F1-score, precision, and recall computed against different input signals (1D to 6D) is presented here. (a) F1-Score computed against different input sizes (1D–6D), (b) Precision computed against different input sizes (1D–6D), (c) Recall computed against different input sizes (1D–6D).
5.1.2. Magnitude of 3D Angular Velocities
The performance with the magnitude of 3D angular velocities is not comparable with any of the other cases, especially the previous case, i.e., the magnitude of 3D accelerations which has the same computational complexity. The average classification accuracy achieved for this case was 50.15% as shown in Table 2, and the confusion matrix is given in Figure 4b. The F1 scores for sad disgust, fear, happy, surprise, and anger remained at 63%, 51%, 38%, 48%, 50%, and 55%, respectively. A comparison with other cases is shown in Figure 5.
Table 2.
Performance comparison between different input sizes used in the proposed model. The best results are produced with a magnitude of 3D accelerations. All of the values are in percentage (%).
5.1.3. 3D Accelerations
The performance for this case is comparable with the first case, i.e., the magnitude of 3D accelerations; however, the complexity of the model is increased here mainly due to the change in input size to 3D. A comparison with other cases is given in Table 2. It is observable that the accuracy for this case is 94.56%. Figure 6a shows the confusion matrix and minimal confusion is seen between different classes. The highest levels of confusion are present between anger and disgust, i.e., 3.7%.
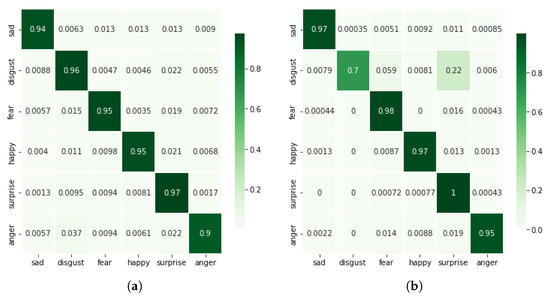
Figure 6.
Confusion matrices are computed when the proposed model is fed with 3D accelerations (a) and 3D angular velocities (b).
5.1.4. 3D Angular Velocities
Contrary to the magnitude of the 3D angular velocities, the use of 3D angular velocities results in much better classification accuracies. We have achieved 92.58% classification accuracy for this particular case. The F1 scores for sad, disgust, fear, happy, surprise, and anger are 98%, 82%, 95%, 97%, 88%, and 97%, respectively. Figure 6b shows the confusion matrix and most of the confusion is observable between disgust and fear, i.e., 5.9%.
5.1.5. 6D Acceleration and Angular Velocities
This case used the highest input size, i.e., 6D accelerations and angular velocities, and hence it is the computationally least efficient case. Since all of the 6D components were fed into the proposed deep model, as expected it produced a comparable performance. The average classification accuracy remained at 95% (similar to the first case, i.e., the 1D magnitude of 3D accelerations). The F1-Score, precision, and recall remained at 95% as well. The best case for classification for all six emotions in the competitive study [19] had a classification accuracy of 86.45%. This was the case for the 200 top contributing features and the classification model used was support vector machine (SVM). The confusion matrix for their study is presented in Figure 7b for the sake of this case, as given in Figure 7a.
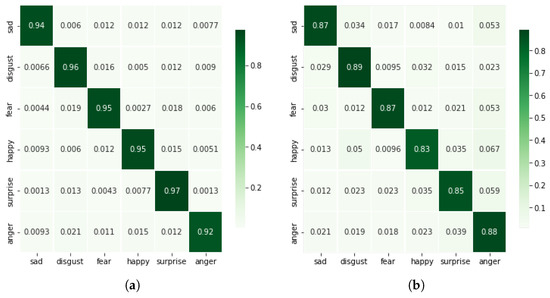
Figure 7.
A comparison of confusion matrices computed with the proposed approach using 6D acceleration and angular velocities (a) and computed by [19] et al., using SVM trained with top 150 features (b).
5.2. Hot vs. Cold Emotion Classification
This section presents the results of binary emotion classification (hot vs cold emotions) for the case of the magnitude of 3D accelerations () only. It is observable from the previously presented multi-emotion classification results that the magnitude of 3D accelerations yields the best results in terms of performance and complexity. A similar trend was observed in the binary classification case and a classification accuracy of 98.08% is noted. The performance report is given in Figure 8 and as a heatmap. The F1-score, precision, and recall remained at 98%. The confusion matrix is given in Figure 8b. The loss and accuracy curves are presented in Figure 9. It can be seen that the model fits the data well and no over-fitting is seen.
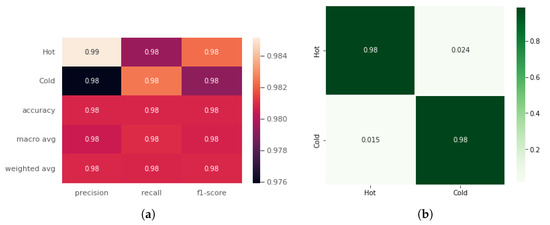
Figure 8.
Performance report (a) and Confusion matrix (b) for hot vs. cold emotions classification. The average classification accuracy, precision, recall, and F1-score remain at 98%.
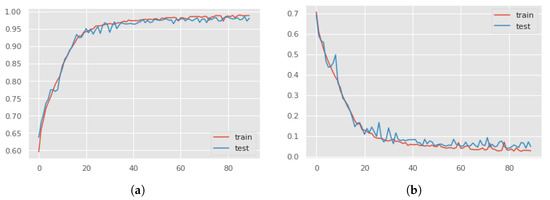
Figure 9.
The accuracy curves (a) and the loss curves (b) computed with the magnitude of 3D accelerations as input signal using hot–cold mapping. The training and testing curves show a good fit, ruling out over-fitting.
5.3. Effect of Segmentation Window Size
The size of the signal’s segmentation window is a critical element in the case of inertial sensors-based classification. The importance of this has been highlighted in [35,64]. The selection of window sizes and step sizes was inspired by [35], where they used the segmentation size of 200 with the same stepping size, i.e., 200 resulting in 0% overlap in two segments. The motivation was to align the step size of 200 samples with the walking frequency of a normal human gait. For our case, we experimented with different segmentation window sizes and step sizes, and the results are given in Table 3. The optimal values are 256 for the window size and 16 for the step size. The experiment for the selection of these parameters was performed only for the case of the magnitude of 3D accelerations.
Table 3.
Comparison of different segmentation window sizes and step sizes and their effect on test accuracies. A window size of 256 and a step size of 16 produce the best test accuracies.
5.4. Accuracy and Loss Curves
Figure 10 depicts the training and testing accuracy and loss curves computed using the magnitude of 3D accelerations (1D input size). The training and testing accuracy and loss curves converge decently, indicating a satisfactory fit and ruling out over-fitting.
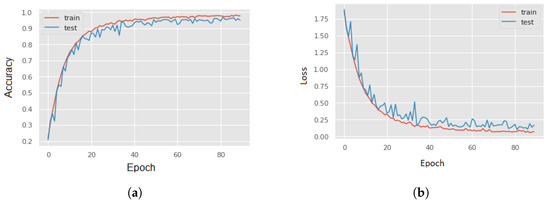
Figure 10.
The Accuracy curve (a) and Loss curves (b) computed with the magnitude of 3D accelerations as input signal using multi-emotion classes (six emotions). The training and testing curves show a good fit, ruling out over-fitting.
5.5. Complexity of the Model
Table 4 shows a comparison of the complexity of the models trained on different input features, in terms of trainable and non-trainable parameters. Similarly, Figure 11 compares the complexity of models trained on different input features in terms of trainable and non-trainable parameters. It is evident that the reduction in input space (i.e., 1D input size) requires lesser trainable parameters and, hence, it reduces the complexity of the model by minimizing model training time.
Table 4.
Comparison of trainable and non-trainable parameters for different cases of multi-emotion classification.
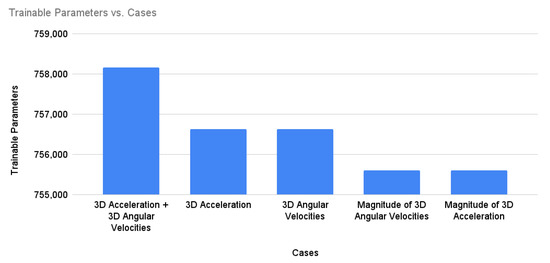
Figure 11.
Trainable parameters for different cases of multi-emotion classification.
Table 5 and Figure 12 present the computation time required by the proposed model for the training and inference under different sizes of input signals, i.e., 1D (), 3D (), and 6D (). With a 1D input size (), the model was trained in 147,615 ms, whereas the inference took only 67 ms. When the input size was 3D (), the model took 269,682 ms for training and 229 ms for inference. With a 6D input size (), the training time of the model was 286,227 ms and inference time was 385ms. In sum, the training and inference time required by the proposed 1D input size is faster than 3D and 6D by a factor of about 3.4 and 6.4, respectively. With these findings, it can be concluded that the 1D input size, being efficient and lightweight, is appropriate for the real-time classification of human emotions using wearable inertial sensor data. The experiment was conducted on a single Google Colab instance, equipped with a Tesla T4 GPU, two CPU cores, and 12.68 GB of RAM.
Table 5.
Computation time required by the proposed model for the training and inference under different sizes of input signals.
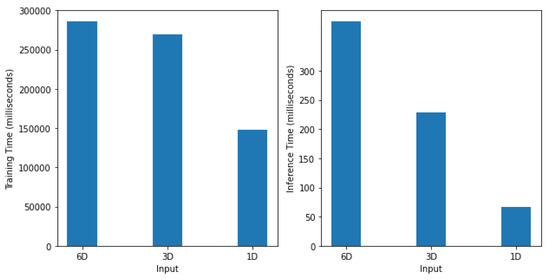
Figure 12.
Computation time required by the proposed model for the training (left) and inference (right) under different sizes of input signals, i.e., 1D (), 3D () and 6D (). With a 1D input size, the model is trained in 147,615 ms whereas the inference took only 67 ms.
6. Conclusions
We presented a unique CNN-RNN deep learning model for classifying human emotional states using body-mounted inertial sensors. Our experiments have demonstrated that decreasing the input space not only reduces the model’s complexity but also gives the best classification accuracies. The input space can be reduced by computing the magnitude of 3D accelerations or 3D angular velocities. Our results show a classification accuracy above 95% with the magnitude of 3D accelerations (), i.e., 1D input signal. For the sake of comparison, we also trained and validated the proposed deep model with 3D input signals (3D accelerations, 3D angular velocities) and 6D input signals (6D accelerations and angular velocities). The results were computed on a multi-emotions inertial dataset collected in one of our previous studies, which covers six basic emotions, i.e., disgust, happy, anger, surprise, sad, and fear.
6.1. Comparison with Existing Approaches
A detailed comparison with the existing studies is given in Table 6. It can be observed that the most related work is [19], in which they proposed a set of manually-crafted features which are used to train different supervised learning models. We have used the same dataset to train our proposed deep learning model and achieved the best classification accuracy of 95% using the 1D input signal.
Table 6.
Performance comparison of the proposed work with previous studies.
6.2. Limitations and Future Work Directions
We essentially worked on six basic emotions–disgust, happy, anger, surprise, sad, fear. However, a variety of micro-expressions such as pain, pleasure, joy, etc., exist. Extending the dataset with a wider range of emotions is an important future direction, which will help in developing better deep models to estimate and understand human emotions on the fly. Similarly, the demographic diversity of the subject is another important direction of future work to analyze emotions from a demographic perspective. Additionally, for practical applications, developing a real-time, edge-based emotions prediction system developed over the node (e.g., a smartwatch) is another crucial aspect to be worked on in the future.
Author Contributions
Conceptualization, Q.R. and M.Z.; methodology, H.A.I., Q.R., M.Z., M.H. and R.A.; software, H.A.I., Q.R. and M.Z.; validation, H.A.I., Q.R., M.H. and R.A.; investigation, H.A.I., Q.R. and M.H.; writing—original draft preparation, H.A.I., Q.R., M.Z. and M.H.; writing—review and editing, Q.R., M.H. and R.A.; visualization, H.A.I.; supervision, Q.R.; project administration, Q.R. All authors have read and agreed to the published version of the manuscript.
Funding
This research received no external funding.
Informed Consent Statement
Informed consent was obtained from all subjects involved in the study.
Data Availability Statement
No new data were created or analyzed in this study.
Conflicts of Interest
The authors declare no conflict of interest.
References
- Mauss, I.B.; Robinson, M.D. Measures of emotion: A review. Cogn. Emot. 2009, 23, 209–237. [Google Scholar] [CrossRef] [PubMed]
- Inguscio, B.M.S.; Cartocci, G.; Palmieri, S.; Menicocci, S.; Vozzi, A.; Giorgi, A.; Ferrara, S.; Canettieri, P.; Babiloni, F. Poetry in Pandemic: A Multimodal Neuroaesthetic Study on the Emotional Reaction to the Divina Commedia Poem. Appl. Sci. 2023, 13, 3720. [Google Scholar] [CrossRef]
- Brave, S.; Nass, C. Emotion in Human-Computer Interaction. In The Humancomputer Interaction Handbook: Fundamentals, Evolving Technologies, and Emerging Applications; Jacko, J.A., Sears, A., Eds.; Lawrence Erlbaum Associates: Mahwah, NJ, USA, 2003. [Google Scholar]
- Beale, R.; Peter, C. The role of affect and emotion in HCI. In Affect and Emotion in Human-Computer Interaction; Springer: Berlin/Heidelberg, Germany, 2008; pp. 1–11. [Google Scholar]
- Chen, L.; Wang, K.; Li, M.; Wu, M.; Pedrycz, W.; Hirota, K. K-Means Clustering-Based Kernel Canonical Correlation Analysis for Multimodal Emotion Recognition in Human–Robot Interaction. IEEE Trans. Ind. Electron. 2023, 70, 1016–1024. [Google Scholar] [CrossRef]
- Wagner, J.; Kim, J.; André, E. From physiological signals to emotions: Implementing and comparing selected methods for feature extraction and classification. In Proceedings of the 2005 IEEE International Conference on Multimedia and Expo, Amsterdam, The Netherlands, 6–9 July 2005; pp. 940–943. [Google Scholar]
- Jerritta, S.; Murugappan, M.; Nagarajan, R.; Wan, K. Physiological signals based human emotion recognition: A review. In Proceedings of the 2011 IEEE 7th International Colloquium on Signal Processing and its Applications, Penang, Malaysia, 4–6 March 2011; IEEE: Piscataway, NJ, USA, 2011; pp. 410–415. [Google Scholar]
- Costa, A.; Rincon, J.A.; Carrascosa, C.; Julian, V.; Novais, P. Emotions detection on an ambient intelligent system using wearable devices. Future Gener. Comput. Syst. 2019, 92, 479–489. [Google Scholar] [CrossRef]
- Manikowska, M.; Sadowski, D.; Sowinski, A.; Wrobel, M.R. DevEmo—Software Developers’ Facial Expression Dataset. Appl. Sci. 2023, 13, 3839. [Google Scholar] [CrossRef]
- Cosmides, L.; Tooby, J. Evolutionary psychology and the emotions. Handb. Emot. 2000, 2, 91–115. [Google Scholar]
- Samadiani, N.; Huang, G.; Hu, Y.; Li, X. Happy Emotion Recognition From Unconstrained Videos Using 3D Hybrid Deep Features. IEEE Access 2021, 9, 35524–35538. [Google Scholar] [CrossRef]
- Zhang, L.; Hong, X.; Arandjelović, O.; Zhao, G. Short and Long Range Relation Based Spatio-Temporal Transformer for Micro-Expression Recognition. IEEE Trans. Affect. Comput. 2022, 13, 1973–1985. [Google Scholar] [CrossRef]
- Kakuba, S.; Poulose, A.; Han, D.S. Attention-Based Multi-Learning Approach for Speech Emotion Recognition with Dilated Convolution. IEEE Access 2022, 10, 122302–122313. [Google Scholar] [CrossRef]
- Santoso, J.; Yamada, T.; Ishizuka, K.; Hashimoto, T.; Makino, S. Speech Emotion Recognition Based on Self-Attention Weight Correction for Acoustic and Text Features. IEEE Access 2022, 10, 115732–115743. [Google Scholar] [CrossRef]
- Jo, A.H.; Kwak, K.C. Speech Emotion Recognition Based on Two-Stream Deep Learning Model Using Korean Audio Information. Appl. Sci. 2023, 13, 2167. [Google Scholar] [CrossRef]
- Yang, G.; Jiao, R.; Jiang, H.; Zhang, T. Ground Truth Dataset for EEG-Based Emotion Recognition with Visual Indication. IEEE Access 2020, 8, 188503–188514. [Google Scholar] [CrossRef]
- Lin, W.; Li, C. Review of Studies on Emotion Recognition and Judgment Based on Physiological Signals. Appl. Sci. 2023, 13, 2573. [Google Scholar] [CrossRef]
- Shojaeilangari, S.; Yau, W.Y.; Nandakumar, K.; Li, J.; Teoh, E.K. Robust Representation and Recognition of Facial Emotions Using Extreme Sparse Learning. IEEE Trans. Image Process. 2015, 24, 2140–2152. [Google Scholar] [CrossRef]
- Hashmi, M.A.; Riaz, Q.; Zeeshan, M.; Shahzad, M.; Fraz, M.M. Motion Reveal Emotions: Identifying Emotions from Human Walk Using Chest Mounted Smartphone. IEEE Sens. J. 2020, 20, 13511–13522. [Google Scholar] [CrossRef]
- Imran, H.A. Khail-Net: A Shallow Convolutional Neural Network for Recognizing Sports Activities Using Wearable Inertial Sensors. IEEE Sens. Lett. 2022, 6, 7003104. [Google Scholar] [CrossRef]
- Syed, Z.F.; Aggarwal, P.; Niu, X.; El-Sheimy, N. Civilian vehicle navigation: Required alignment of the inertial sensors for acceptable navigation accuracies. IEEE Trans. Veh. Technol. 2008, 57, 3402–3412. [Google Scholar] [CrossRef]
- Lee, J.K.; Robinovitch, S.N.; Park, E.J. Inertial sensing-based pre-impact detection of falls involving near-fall scenarios. IEEE Trans. Neural Syst. Rehabil. Eng. 2014, 23, 258–266. [Google Scholar] [CrossRef] [PubMed]
- Zhang, Y.; Liang, W.; He, H.; Tan, J. Wearable heading estimation for motion tracking in health care by adaptive fusion of visual–inertial measurements. IEEE J. Biomed. Health Inform. 2018, 22, 1732–1743. [Google Scholar] [CrossRef]
- Lin, C.L.; Chiu, W.C.; Chen, F.H.; Ho, Y.H.; Chu, T.C.; Hsieh, P.H. Fall Monitoring for the Elderly Using Wearable Inertial Measurement Sensors on Eyeglasses. IEEE Sens. Lett. 2020, 4, 6000804. [Google Scholar] [CrossRef]
- Riaz, Q.; Vögele, A.; Krüger, B.; Weber, A. One small step for a man: Estimation of gender, age and height from recordings of one step by a single inertial sensor. Sensors 2015, 15, 31999–32019. [Google Scholar] [CrossRef]
- Riaz, Q.; Hashmi, M.Z.U.H.; Hashmi, M.A.; Shahzad, M.; Errami, H.; Weber, A. Move your body: Age estimation based on chest movement during normal walk. IEEE Access 2019, 7, 28510–28524. [Google Scholar] [CrossRef]
- Zhang, Z.; Song, Y.; Cui, L.; Liu, X.; Zhu, T. Emotion recognition based on customized smart bracelet with built-in accelerometer. PeerJ 2016, 4, e2258. [Google Scholar] [CrossRef] [PubMed]
- Suhaimi, N.S.B.; Mountstephens, J.; Teo, J. Emotional State Classification with Distributed Random Forest, Gradient Boosting Machine and Naïve Bayes in Virtual Reality Using Wearable Electroencephalography and Inertial Sensing. In Proceedings of the 2020 IEEE 10th Symposium on Computer Applications & Industrial Electronics (ISCAIE), Penang, Malaysia, 18–19 April 2020; pp. 12–17. [Google Scholar]
- Hashmi, M.Z.U.H.; Riaz, Q.; Hussain, M.; Shahzad, M. What lies beneath one’s feet? terrain classification using inertial data of human walk. Appl. Sci. 2019, 9, 3099. [Google Scholar] [CrossRef]
- Imran, H.A. UltaNet: An Antithesis Neural Network for Recognizing Human Activity Using Inertial Sensors Signals. IEEE Sens. Lett. 2022, 6, 7000304. [Google Scholar] [CrossRef]
- Imran, H.A.; Latif, U. HHARNet: Taking inspiration from Inception and Dense Networks for Human Activity Recognition using Inertial Sensors. In Proceedings of the 2020 IEEE 17th International Conference on Smart Communities: Improving Quality of Life Using ICT, IoT and AI (HONET), Charlotte, NC, USA, 14–16 December 2020; pp. 24–27. [Google Scholar]
- Kamil, R.J.; Bakar, D.; Ehrenburg, M.; Wei, E.X.; Pletnikova, A.; Xiao, G.; Oh, E.S.; Mancini, M.; Agrawal, Y. Detection of Wandering Behaviors Using a Body-Worn Inertial Sensor in Patients with Cognitive Impairment: A Feasibility Study. Front. Neurol. 2021, 12, 148. [Google Scholar] [CrossRef] [PubMed]
- Kang, G.E.; Yang, J.; Najafi, B. Does the presence of cognitive impairment exacerbate the risk of falls in people with peripheral neuropathy? An application of body-worn inertial sensors to measure gait variability. Sensors 2020, 20, 1328. [Google Scholar] [CrossRef]
- Desai, R.; Fritz, N.E.; Muratori, L.; Hausdorff, J.M.; Busse, M.; Quinn, L. Evaluation of gait initiation using inertial sensors in Huntington’s Disease: Insights into anticipatory postural adjustments and cognitive interference. Gait Posture 2021, 87, 117–122. [Google Scholar] [CrossRef]
- Gohar, I.; Riaz, Q.; Shahzad, M.; Zeeshan Ul Hasnain Hashmi, M.; Tahir, H.; Ehsan Ul Haq, M. Person re-identification using deep modeling of temporally correlated inertial motion patterns. Sensors 2020, 20, 949. [Google Scholar] [CrossRef]
- Henschel, R.; Von Marcard, T.; Rosenhahn, B. Accurate long-term multiple people tracking using video and body-worn IMUs. IEEE Trans. Image Process. 2020, 29, 8476–8489. [Google Scholar] [CrossRef]
- Piskioulis, O.; Tzafilkou, K.; Economides, A. Emotion Detection through Smartphone’s Accelerometer and Gyroscope Sensors. In Proceedings of the 29th ACM Conference on User Modeling, Adaptation and Personalization, Utrecht, The Netherlands, 21–25 June 2021; pp. 130–137. [Google Scholar]
- Reyana, A.; Vijayalakshmi, P.; Kautish, S. Multisensor fusion approach: A case study on human physiological factor-based emotion recognition and classification. Int. J. Comput. Appl. Technol. 2021, 66, 107–114. [Google Scholar] [CrossRef]
- Li, B.; Zhu, C.; Li, S.; Zhu, T. Identifying Emotions from Non-Contact Gaits Information Based on Microsoft Kinects. IEEE Trans. Affect. Comput. 2018, 9, 585–591. [Google Scholar] [CrossRef]
- Roether, C.L.; Omlor, L.; Christensen, A.; Giese, M.A. Critical features for the perception of emotion from gait. J. Vis. 2009, 9, 15. [Google Scholar] [CrossRef] [PubMed]
- Michalak, J.; Troje, N.F.; Fischer, J.; Vollmar, P.; Heidenreich, T.; Schulte, D. Embodiment of sadness and depression—Gait patterns associated with dysphoric mood. Psychosom. Med. 2009, 71, 580–587. [Google Scholar] [CrossRef]
- Quiroz, J.C.; Yong, M.H.; Geangu, E. Emotion-recognition using smart watch accelerometer data: Preliminary findings. In Proceedings of the 2017 ACM International Joint Conference on Pervasive and Ubiquitous Computing and Proceedings of the 2017 ACM International Symposium on Wearable Computers, Maui, HI, USA, 11–15 September 2017; pp. 805–812. [Google Scholar]
- Cui, L.; Li, S.; Zhu, T. Emotion detection from natural walking. In Proceedings of the International Conference on Human Centered Computing, Colombo, Sri Lanka, 7–9 January 2016; Springer: Berlin/Heidelberg, Germany, 2016; pp. 23–33. [Google Scholar]
- Gravina, R.; Li, Q. Emotion-relevant activity recognition based on smart cushion using multi-sensor fusion. Inf. Fusion 2019, 48, 1–10. [Google Scholar] [CrossRef]
- Ekman, P.; Friesen, W.V. Constants across cultures in the face and emotion. J. Personal. Soc. Psychol. 1971, 17, 124. [Google Scholar] [CrossRef]
- Velasco, C.; Motoki, K.; Byrne, D.; Wang, Q. The temperature of emotions. PloS ONE 2021, 16, e0252408. [Google Scholar]
- Raheel, A.; Majid, M.; Alnowami, M.; Anwar, S.M. Physiological sensors based emotion recognition while experiencing tactile enhanced multimedia. Sensors 2020, 20, 4037. [Google Scholar] [CrossRef] [PubMed]
- Zhang, C.; Yu, J.; Chen, Z. Music emotion recognition based on combination of multiple features and neural network. In Proceedings of the 2021 IEEE 4th Advanced Information Management, Communicates, Electronic and Automation Control Conference (IMCEC), Chongqing, China, 18–20 June 2021; Volume 4, pp. 1461–1465. [Google Scholar] [CrossRef]
- Riaz, Q.; Tao, G.; Krüger, B.; Weber, A. Motion reconstruction using very few accelerometers and ground contacts. Graph. Model. 2015, 79, 23–38. [Google Scholar] [CrossRef]
- Johnson, J.; Karpathy, A.; Fei-Fei, L. Densecap: Fully convolutional localization networks for dense captioning. In Proceedings of the IEEE Conference on Computer Vision and Pattern Recognition, Las Vegas, NA, USA, 27–30 June 2016; pp. 4565–4574. [Google Scholar]
- Cho, K.; Van Merriënboer, B.; Gulcehre, C.; Bahdanau, D.; Bougares, F.; Schwenk, H.; Bengio, Y. Learning phrase representations using RNN encoder-decoder for statistical machine translation. arXiv 2014, arXiv:1406.1078. [Google Scholar]
- Felix, A. Gers, J urgen Schmidhuber, and Fred Cummins. Learning to forget: Continual prediction with LSTM. Neural Comput. 2000, 12, 2451–2471. [Google Scholar]
- Szegedy, C.; Ioffe, S.; Vanhoucke, V.; Alemi, A.A. Inception-v4, inception-resnet and the impact of residual connections on learning. In Proceedings of the Thirty-First AAAI Conference on Artificial Intelligence, San Francisco, CA, USA, 4–9 February 2017. [Google Scholar]
- Schuster, M.; Paliwal, K. Networks bidirectional reccurent neural. IEEE Trans. Signal Process 1997, 45, 2673–2681. [Google Scholar] [CrossRef]
- Huang, G.; Liu, Z.; Van Der Maaten, L.; Weinberger, K.Q. Densely connected convolutional networks. In Proceedings of the IEEE Conference on Computer Vision and Pattern Recognition, Honolulu, HI, USA, 21–26 July 2017; pp. 4700–4708. [Google Scholar]
- Szegedy, C.; Liu, W.; Jia, Y.; Sermanet, P.; Reed, S.; Anguelov, D.; Erhan, D.; Vanhoucke, V.; Rabinovich, A. Going deeper with convolutions. In Proceedings of the IEEE Conference on Computer Vision and Pattern Recognition, Boston, MA, USA, 7–12 June 2015; pp. 1–9. [Google Scholar]
- He, K.; Zhang, X.; Ren, S.; Sun, J. Deep residual learning for image recognition. In Proceedings of the IEEE Conference on Computer Vision and Pattern Recognition, Las Vegas, NA, USA, 27–30 June 2016; pp. 770–778. [Google Scholar]
- Nafea, O.; Abdul, W.; Muhammad, G.; Alsulaiman, M. Sensor-Based Human Activity Recognition with Spatio-Temporal Deep Learning. Sensors 2021, 21, 2141. [Google Scholar] [CrossRef] [PubMed]
- Mehmood, K.; Imran, H.A.; Latif, U. HARDenseNet: A 1D DenseNet Inspired Convolutional Neural Network for Human Activity Recognition with Inertial Sensors. In Proceedings of the 2020 IEEE 23rd International Multitopic Conference (INMIC), Bahawalpur, Pakistan, 5–7 November 2020; pp. 1–6. [Google Scholar]
- Lockhart, J.W.; Weiss, G.M.; Xue, J.C.; Gallagher, S.T.; Grosner, A.B.; Pulickal, T.T. Design considerations for the WISDM smart phone-based sensor mining architecture. In Proceedings of the Fifth International Workshop on Knowledge Discovery from Sensor Data, San Diego, CA, USA, 21 August 2011; pp. 25–33. [Google Scholar]
- Weiss, G.M.; Yoneda, K.; Hayajneh, T. Smartphone and smartwatch-based biometrics using activities of daily living. IEEE Access 2019, 7, 133190–133202. [Google Scholar] [CrossRef]
- Xu, C.; Chai, D.; He, J.; Zhang, X.; Duan, S. InnoHAR: A deep neural network for complex human activity recognition. IEEE Access 2019, 7, 9893–9902. [Google Scholar] [CrossRef]
- Zhang, H.; Xiao, Z.; Wang, J.; Li, F.; Szczerbicki, E. A novel IoT-perceptive human activity recognition (HAR) approach using multihead convolutional attention. IEEE Internet Things J. 2019, 7, 1072–1080. [Google Scholar] [CrossRef]
- Banos, O.; Galvez, J.M.; Damas, M.; Pomares, H.; Rojas, I. Window size impact in human activity recognition. Sensors 2014, 14, 6474–6499. [Google Scholar] [CrossRef] [PubMed]
Disclaimer/Publisher’s Note: The statements, opinions and data contained in all publications are solely those of the individual author(s) and contributor(s) and not of MDPI and/or the editor(s). MDPI and/or the editor(s) disclaim responsibility for any injury to people or property resulting from any ideas, methods, instructions or products referred to in the content. |
© 2023 by the authors. Licensee MDPI, Basel, Switzerland. This article is an open access article distributed under the terms and conditions of the Creative Commons Attribution (CC BY) license (https://creativecommons.org/licenses/by/4.0/).