Article

Analysis of Pressure Effect on Three-Dimensional Flame Surface Density Estimation

State Key Laboratory of Multiphase Flow in Power Engineering, Xi’an Jiaotong University, Xi’an 710049, China
*
Author to whom correspondence should be addressed.
Appl. Sci. 2023, 13(8), 4691; https://doi.org/10.3390/app13084691
Submission received: 17 February 2023 / Revised: 21 March 2023 / Accepted: 6 April 2023 / Published: 7 April 2023
(This article belongs to the Section Energy Science and Technology)

Abstract

:
In experiments, flame surface density (FSD), defined as flame area per volume, is usually approximated by its two-dimensional (2D) value, as flame length per area. However, this approximation may underestimate the flame wrinkle due to the presence of a fluctuating component outside the measurement plane. Obtaining a three-dimensional (3D) flame surface density (FSD) from experiments is challenging, but it can be estimated from low-dimensional measurements under certain assumptions. Models used to estimate 3D FSD can be significantly affected by ambient pressure, as high pressure can cause a substantial decrease in small flame front scales. In this study, a CH 4 /air premixed turbulent flame is stabilized on a Bunsen burner and measured using the OH-PLIF technique at pressures up to 1.0 MPa. The flame front is extracted with an in-house auto adaptive threshold binarization code. Different models estimating 3D FSD with the corresponding assumptions are summarized from the definition of FSD. The reliability of the assumptions under different pressures is investigated and analyzed. The models are compared through analyzing the assumptions, and are tested in terms of global fuel consumption. The pressure’s effect on the reliability of the models could provide an essential improvement in the context of modeling turbulent combustion.

1. Introduction

Flame surface density (FSD or expressed as ), defined as flame surface area per unit volume, is a vital parameter under the flamelet concept for turbulent premixed combustion [1]. It can evaluate the fuel consumption rate of the combustion system, which is of primary practical importance when designing the combustor. In terms of large-scale premixed turbulent combustion, the flame thickness is much smaller than the characteristic length of the combustion system. Therefore, the significant increase in turbulent flame speed S T is mainly due to the enlargement of the flame surface area caused by the wrinkled or corrugated flame surface, as firstly described by Damköhler [2]. Thus, FSD is regarded as an effective measure of S T , i.e., S T / S L = d η [3], as well as of the fuel consumption rate of the combustion system, i.e., W ¯ = δ T max [4], in which S L is the laminar flame speed and δ T represents the flame brush thickness. In theory, FSD is a well-developed approach for turbulent premixed combustion modeling on the basis of Reynolds averaged Navier Stokes theory [5]. In experiments, FSD could be calculated by detecting and extracting the turbulent flame front with planar laser-induced florescence (PLIF) [4,6,7,8] or Rayleigh scattering [9,10]. However, these laser diagnostic approaches can only provide flame information within a two-dimensional measurement plane, while the flame is three-dimensional in nature. As a result, estimating the flame surface density using its two-dimensional (2D) value as flame length per area would lead to underestimation of the fuel consumption rate. This is because the flame wrinkles have a fluctuating component that is not measurable in the measurement plane. The direct three-dimensional flame structure measurement requires a very complicated experimental apparatus, with high resource costs [11,12]. Therefore, it is of primary importance to analyze various assumptions in FSD calculations invoked in the interpretation of 2D planar measurements. For instance, the 2D FSD approximation from 2D laser measurement technique assumes that the flame front is only wrinkled on the measurement plane.
To obtain more reasonable approximations of 3D FSD, different models were proposed under the following basic assumptions: (1) The turbulent flow is isotropic; (2) The turbulent flow and flame wrinkles is axisymmetric; (3) The characteristics of the wrinkled/corrugated flame front out of the measurement plane similar with that on the plane. Starting from the definition of flame surface density, it can be deduced that the measured 2D FSD and 3D FSD value on the measurement plane is related to the surface averaged cosine value of the orientation angle of the measurement plane [13,14,15]. Numerous models in the literature were proposed to evaluate this parameter, including algebraic formulation from the statistical analysis of a Bunsen burner [16], isotropic wrinkled flame surface and the analysis of the flame front normal vector [13,14], as well as numerical investigations [17]. The models show the ability to capture 3D FSD while they are mostly performed and verified under atmosphere pressure. Furthermore, the real combustors are in generally operated at high pressure. This will significantly affect the flame front character, laminar flame speed and laminar flame thickness, which, in turn, influence the reliability of the assumptions described above. There are still issues regarding of the pressure’s effect on the reliability of the assumptions and the models.
Based on the previous work and motivation above, the overall objective of this paper was to investigate pressure’s effect on the 3D FSD estimation models. The CH4/air premixed turbulent flame was stabilized on a Bunsen burner and the measurement was performed with the OH-PLIF technique at a pressure up to 1.0 MPa. An in-house auto adaptive threshold binarization code was used to extract the flame front. The paper is composed as follows. Section 2 describes the experimental methodology and Section 3 introduces the equations of the flame surface density and formulations of the models. Section 5 discusses and analyzes the results. Lastly, Section 6 concludes the paper.

2. Experimental Methodology

Experimental Setup and Measurements

The high-pressure experiment was conducted in a high-pressure facility, which can provide a pressure up to 3.0 MPa, and has been introduced elsewhere [18,19]. To maintain a high ambient pressure in the chamber, a large amount of highly compressed fresh air is charged from the bottom of the chamber, and the internal pressure is regulated manually through a pressure gauge. The chamber is equipped with several quartz windows, allowing for laser diagnostics to be conducted. A small portion of compressed air is quantitatively controlled by a mass flow meter, as the oxidizer mixes with fuel. There are several modules in the experimental set-up, i.e., the air supply system, the Bunsen burner and the OH-PLIF laser detection system.
The flame is stabilized on a turbulent Bunsen burner with a weak annulus CH4/air co-flame at the burner rim. The burner was introduced in detail elsewhere [8,15], and a brief introduction is given here. A sketch of the burner is depicted in Figure 1. To obtain a well-mixed unburned mixture and to prevent flash back, the fuel and air supplied to the burner are firstly impinged to a plate and then pass through two sintered metals, with the characteristic dimension decreasing in order. Turbulence is generated by a perforated plate installed 40 mm upstream of the burner exit, as designated in Figure 1. The burner is water-cooled to avoid water vapor condensation on the burner’s surface. Three pressures have been investigated, namely P = 0.1, 0.5 and 1.0 MPa, and the equivalence ratio is fixed at ϕ = 1.0. The bulk inlet velocity is kept constant at 3 m/s and the mass flow increases linearly with pressure.
The instantaneous OH radical of the flame, which is used to identify the flame front, was measured with OH-PLIF. The OH-PLIF measurement system consists of a Nd:YAG laser (Quanta-Ray Lab-190),a pumped dye laser (Sirah PRSC-G-3000) and an ICCD camera (LaVision Image ProX). The laser source is generated by Nd:YAG laser at 532 nm with the repetition rate of 10 Hz and pulse energy of 500 mW. The dye laser doubles the laser frequency, resulting in a wavelength of 282.769 nm, which corresponds to the peak excitation wavelength of the OH radical in the flame. A laser sheet with a height of 50 mm and a thickness of approximately 0.5 mm is formed at the flame position through the use of optical elements. After the excitation, the flame releases an OH fluorescence signal of 308 nm. The fluorescence signal is captured with a CCD camera, which is equipped with intensified Relay Optics (LaVision VC08-0094) and an OH bandpass filter (LaVision VZ08-0222). Detailed information regarding the OH-PLIF measurements can be found in our previous work [8].
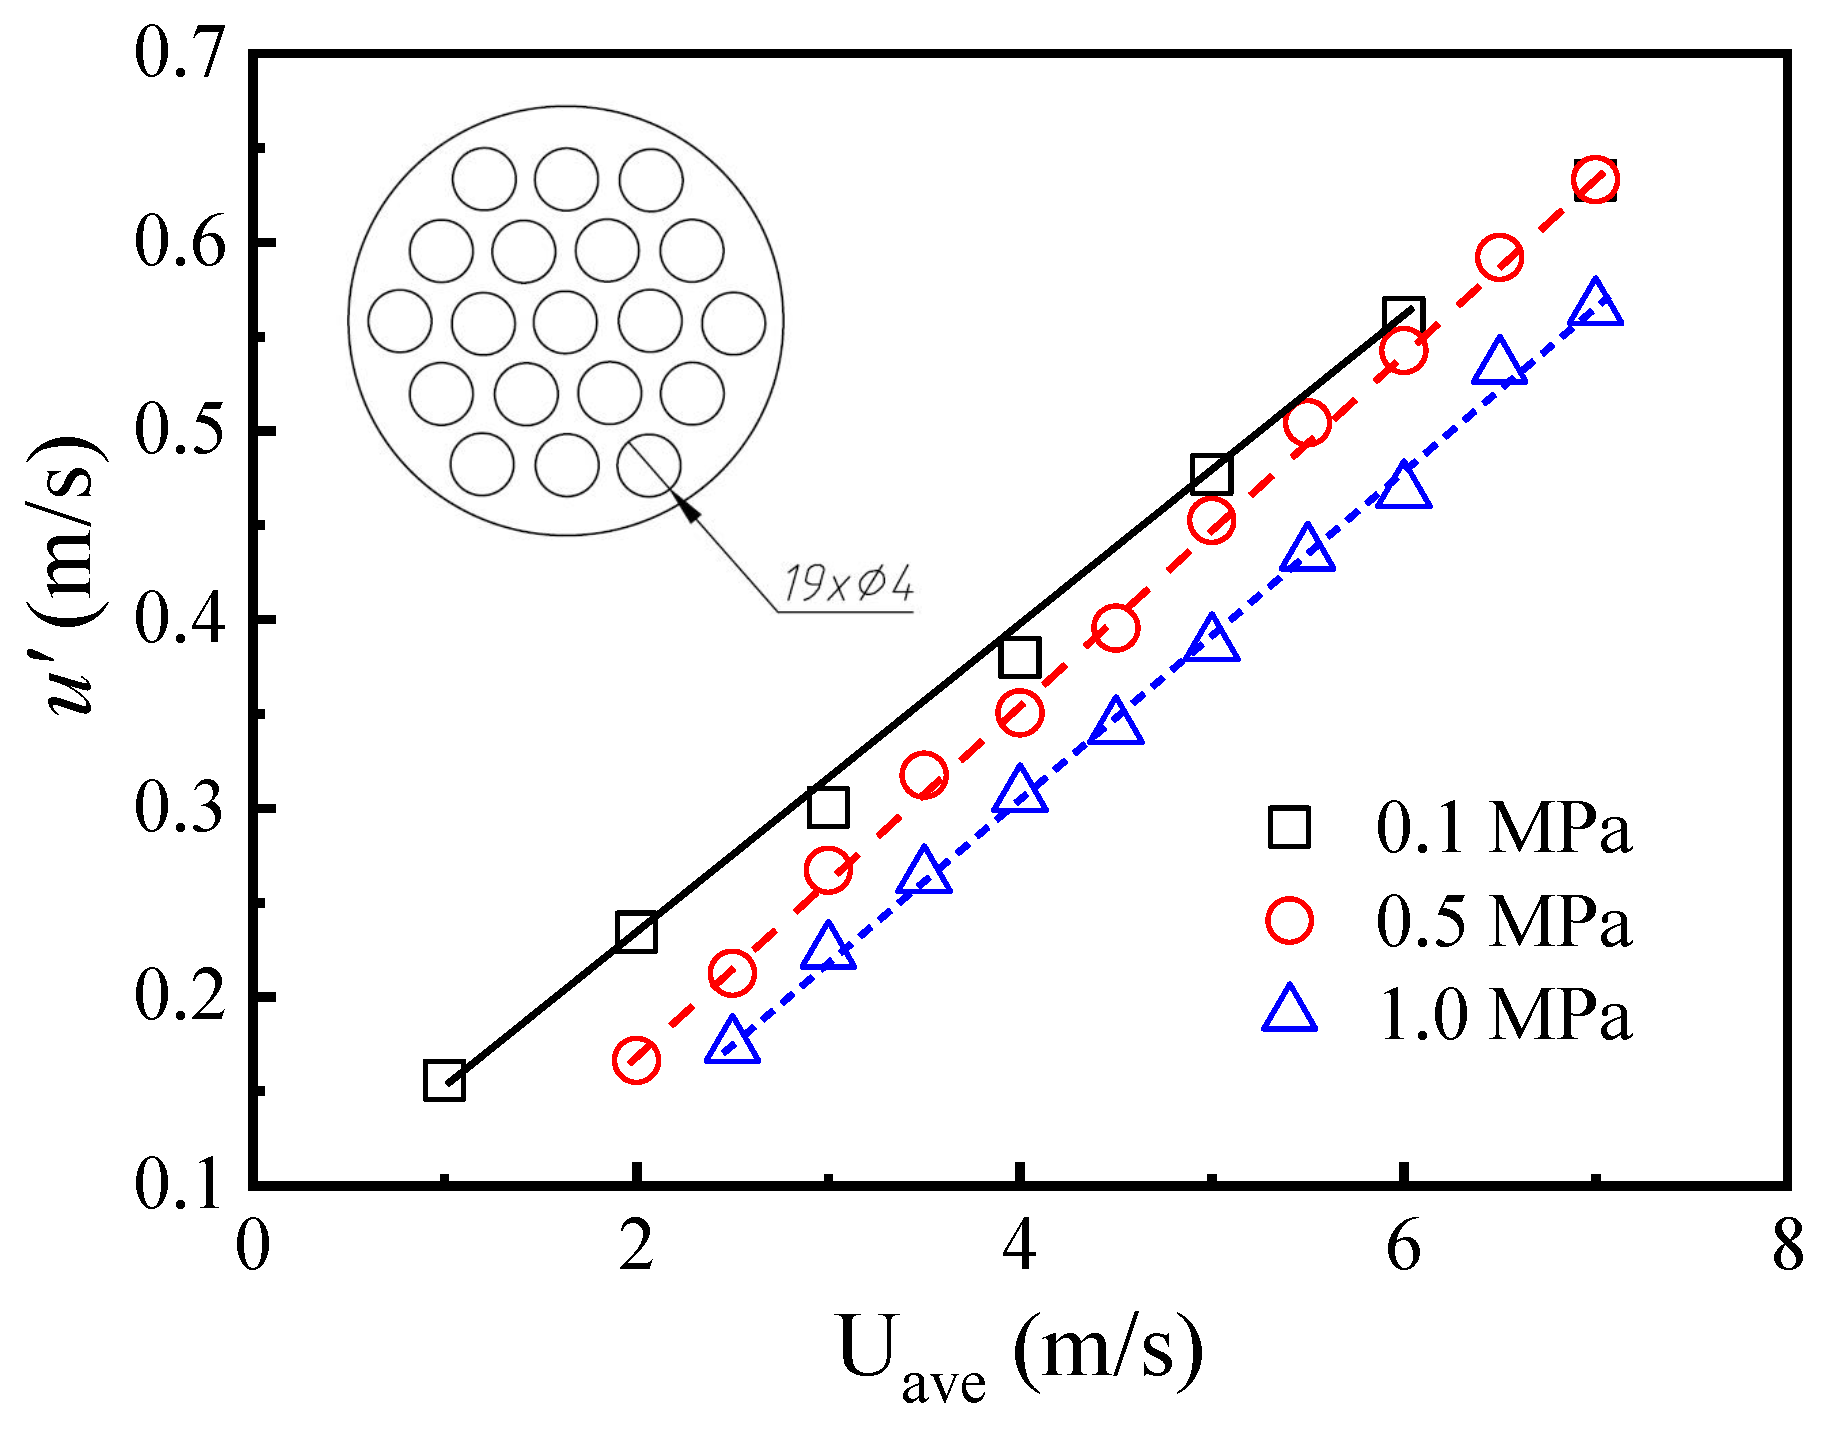
To obtain reliable turbulence intensity u , the instantaneous flow field was measured at 10 positions, by a single hot-wire anemometer (Dantec 55P11), along the burner’s diameter, 10 mm above the nozzle [8,15]. The plate geometry used in the experiment and the relation of turbulence intensity with bulk inlet velocity are illustrated in Figure 2. The Figure shows that the perforated plate exhibits a turbulence level of about 10%.

3. Flame Surface Density

3.1. Definition

In premixed combustion, the surface to volume ratio of the iso c * surface, denoted as flame surface density, can be determined from the conditional gradient of the progress variable c [20] by
( c * ) = | c | δ ( c c * ) ¯
where ( · ) ¯ denotes the ensemble average. δ ( x ) is the Dirac delta function and δ ( c c * ) measures the local probability of the isosurface c = c * . Equation (1) can be applied in both two or three dimensions. However, it is worth noting that ( c * ) depends on the choice of c * . When the flames are not thin, a generalized flame surface density may be defined over c = 0 1 [21] by
= 0 1 ( c * ) d c * = | c | ¯
which is widely used in DNS studies [21,22,23]. However, within the flamelet concept of turbulent premixed flames, the flame is assumed to be thin and is identified as an interface. In this case, c and ( c * ) do not depend on c * and are physically well-defined.
For instance, when a turbulent flame is operated in wrinkled/corrugated flamelet regime, the chemical reactions are too fast when compared with the turbulent flow, and the flame is confined within a very thin zone. In this situation, the flame is so thin that its front position can be determined by the sharp change of any progress variable, i.e., fuel or OH concentration, and the flame’s surface density can be determined by Equation (1). However, in 2D experimental measurements, only the 2D flame surface is available and flame surface density is calculated based on the surface to volume definition,
= lim Δ x 0 A f ¯ Δ x 3 2 D = lim Δ x 0 L f ¯ Δ x 2
2 D represents the two-dimensional flame surface density. The above equation assumes that there are no wrinkles present in the direction perpendicular to the measurement plane of the flame. This methodology is widely used experimentally [15,19,24,25], in which the flame is extracted from the border of the unburned and burned region, denoted by OH intensity. 2 D in Equation (3) can be obtained as follows:
2 D = 1 N i = 1 N Δ L Δ A ¯
where N is the number of realizations, and Δ L and Δ A are the flame surface length and control area, respectively.

3.2. Notations and 3D/2D Exact Relation

For the sake of clarity on describing and 2 D , Figure 3a shows a surface given by three-dimensional Cartesian coordinates, measured by a two-dimensional plane. The 2D measurement of the surface is a curve, which is illustrated as the red curve in Figure 3a. n and n 2 D represent the normal vectors of the surface and the measured curve at location p , respectively. n p corresponds to the projection of n on the measuring plane. θ is the angle between n p ( n 2 D ) and the y axis in the measuring plane (in-plane angle), denoted in Figure 3b. ϕ is the angle between n and the measurement plane (out-of-plane angle), also denoted in Figure 3b. θ is defined as 0 when n 2 D aligns with the positive direction of the y axis, and increases (decreases) counter-clockwise (clockwise) from 0 to 180 ( 180 ), as illustrated in Figure 3c. ϕ is defined as 0 when n is in the measuring plane, and is positive (negative) when n z > 0 ( n z < 0 ) . By definition, θ and ϕ are in the interval of [ π , π ) and [ π / 2 , π / 2 ) , respectively, and are given by
θ = arctan ( n x , n y ) , ϕ = arcsin ( n z )
With the notation defined above, n p and n 2 D has the relation of
n p = n 2 D cos ϕ
For a scalar c, | c | 2 D is the measured value of | c | in the measuring plane, which can be established mathematically as follows:
| c | 2 D = cos ϕ | c | .
Applying Equation (1) in its 3D and 2D form to Equation (7) yields [15],
= 1 cos ϕ s 2 D
where Q s is the surface-averaged quantities, defined as
Q s = Q | c | δ ( c c * ) ¯ | c | δ ( c c * ) ¯
For detailed derivations on Equation (8), interested readers can refer to Refs. [13,15]. Specifically, Equation (8) is the exact relation of the 3D/2D flame surface densities. It is readily seen that 2 D and both flame surface densities are identical if a two-dimensional flame front is assumed (no flame front wrinkling perpendicular to the measurement plane). The models of cos ϕ s are summarized in [15], and are briefly described in the following section.

4. Modeling and Approximations of cos ϕ s

4.1. DNS Results and the Measurements

The direct way to evaluate cos ϕ s is through Direct Numerical Simulation (DNS). Bell et al. [26] firstly tested the difference of 2D and 3D flame surface density using their 3D DNS results. They first computed , and then identified one plane to compute 2 D as the approximation, to mimic the planar laser measurement in experiments. Their conclusion is that from 2D approximation underestimates the real value and it should be multiplied by a coefficient of 1.35 to yield 3D values. Deschamps et al. [16] proposed a cosine value of the flame front orientation angle of 0.69, based on the experimental measurements in a Bunsen burner and an optical engine. This cosine value will be larger at lower engine speed, namely:
= 1 0.69 2 D
The DNS data only provide a global coefficient to distinguish the deficiency of 2D approximation, while the measurement can only provide an averaged 2D value.

4.2. Isotropic Normal Vector

Isotropic normal vector assumption was made by Hawkes et al. [17,27] to evaluate the scalar dissipation rates and 3D flame surface density from low-dimension measurements. When combined with the assumption that the distributions of ϕ and θ are independent with each other, the following relations are derived,
p ( θ ) = 1 2 π ; p ( ϕ ) = cos ϕ 2
Then, cos ϕ s will be
cos ϕ s = π / 2 π / 2 cos ϕ p ( ϕ ) d ϕ = π 4
The above deviation implies that if the flame orientation angle ϕ at all positions within the flame brush follows the probability density function of ( cos ϕ ) / 2 , then
= 4 π 2 D
However, for more practical scenarios, such as Bunsen flames or V-shape flames, the isotropy of the wrinkled flame highly depends on the position and the combustion condition, indicated by the turbulence intensity u . Thus, the p ( ϕ ) may differ at each position.

4.3. Analysis of the Fluctuations of Normal Vectors

Based on the analysis of a vector by Cant et al. [28], the local flame front normal vector is composed by two components, the mean and fluctuation, which can be written as
n i = n i s + m i with m i s = 0 .
Since n and n 2 D are the unit vector, their norms are unity, which will give | n | s = 1 and | n 2 D | s = 1. Written with the index notation, it will give
n i n i s = 1
Equation (14) is satisfied for both 2D and 3D, i.e., i = 1 , 2 for 2D and i = 1 , 2 , 3 for 3D. Substituting Equations (6) and (13) into Equation (14) was accompanied by with additional assumptions, discussed in [13,15], which is listed in Appendix A, it results
cos ϕ s 2 + m z m z s = 1
m z denotes the fluctuating component of n z . Equation (15) establishes a relationship between the surface-averaged cosine value and the fluctuating component on the transverse direction that is not accessible directly from the measurement plane. If m z m z s is assumed to be identical to the fluctuating component in other two directions, i.e., m z m z s m x 2 D m x 2 D s or m z m z s m y 2 D m y 2 D s , then we have
= 1 + m x 2 D m x 2 D s 2 D
or
= 1 + m y 2 D m y 2 D s 2 D .
The models of Equations (10), (12), (16) and (17) are designated as Method1 to Method4, which will be referred to as M1, M2, M3 and M4 in the later sections.

5. Results and Discussion

5.1. OH-PLIF Image and Processing Method

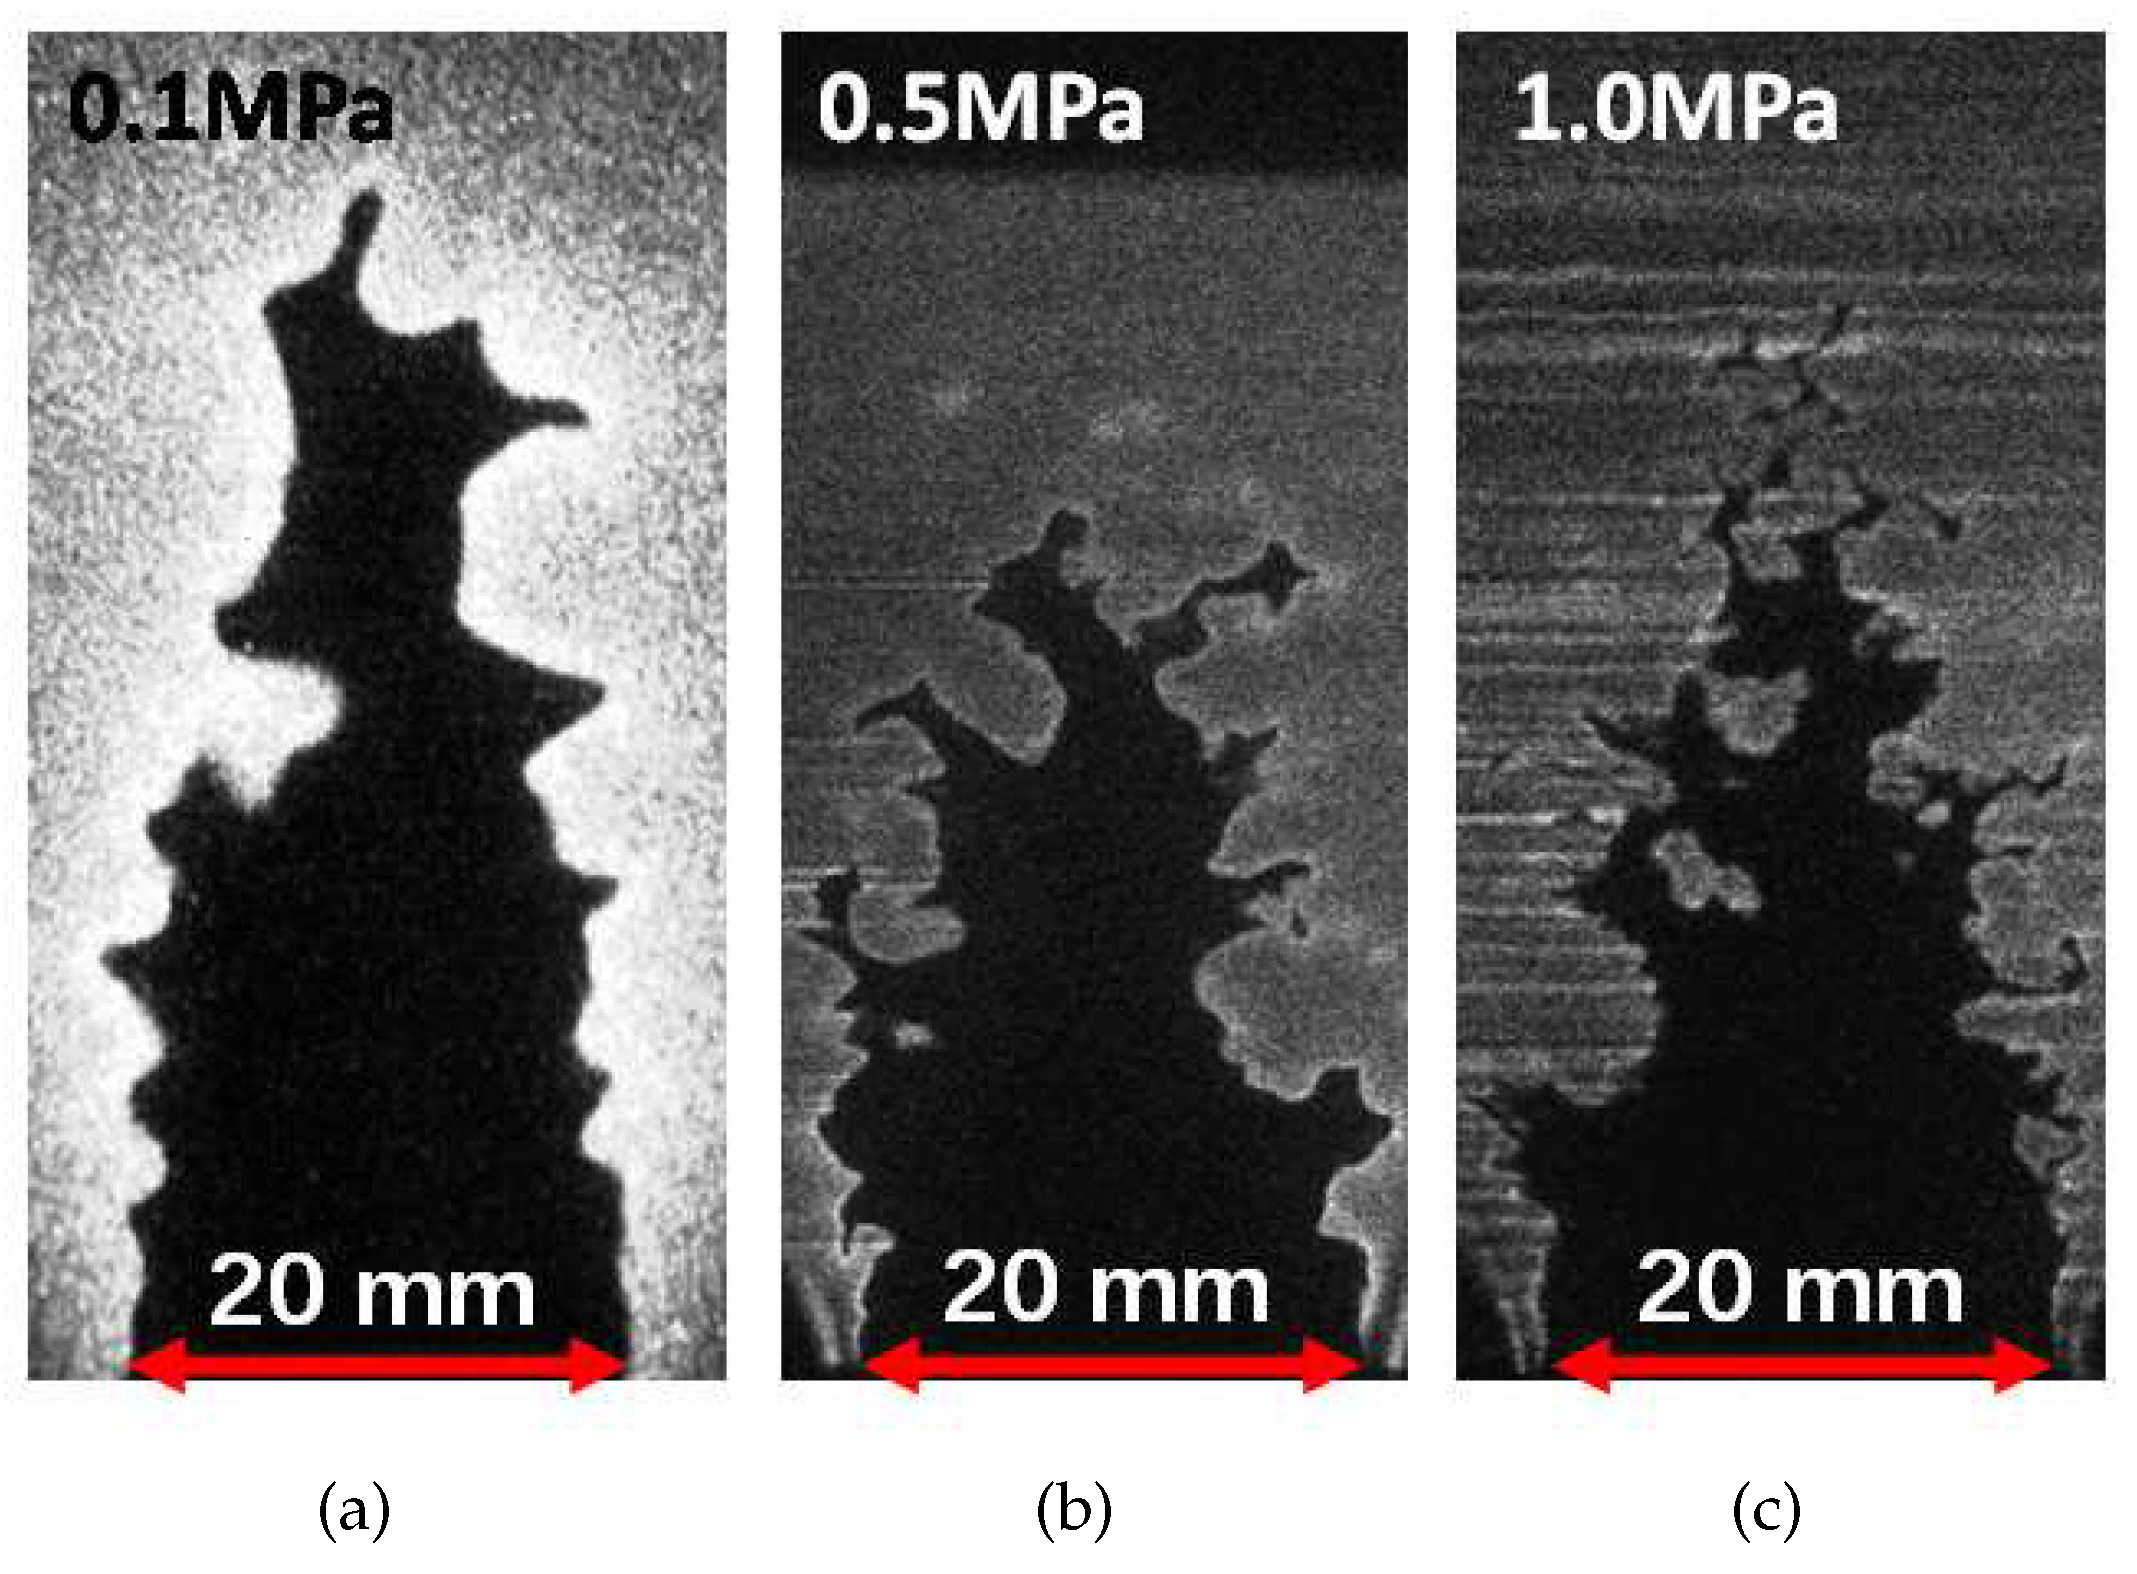
Figure 4 displays typical single-shot OH-PLIF images of turbulent premixed flames at varying pressures. The images clearly indicate that the flame front wrinkles are finer at high pressure. Furthermore, at high pressure, small scale wrinkled structures superimpose on the large scale convex structure, which is a general characteristic of high-pressure flames [19,29]. However, due to the high pressure and the optical window, the energy of the laser sheet sharply decreases, resulting in a very low signal-to-noise ratio OH-PLIF image. To obtain a clear and continues flame front, an adaptive threshold method was developed [30,31] to binarize the OH-PLIF image and the processing steps are briefly summarized here. Firstly, the OH-PLIF images are transferred to 8-bit gray images, as shown in Figure 5a. Then, a median filter is applied to remove the pixel noise and a local threshold matrix is obtained, based on the local gray intensity of the image, as shown in Figure 5b,c. Once the threshold matrix is obtained, the gray image is binarized and the flame front can be extracted, as shown in Figure 5d,e. The adaptive threshold method is designed for the high-pressure OH-PLIF image with a low signal-noise ratio and has already been applied successfully. Lastly, 2D flame surface density can be calculated by boxing method [8,15,31] after the flame brush is obtained, which is shown in Figure 5f.

5.2. Three-Dimensional Evaluation at Different Pressures

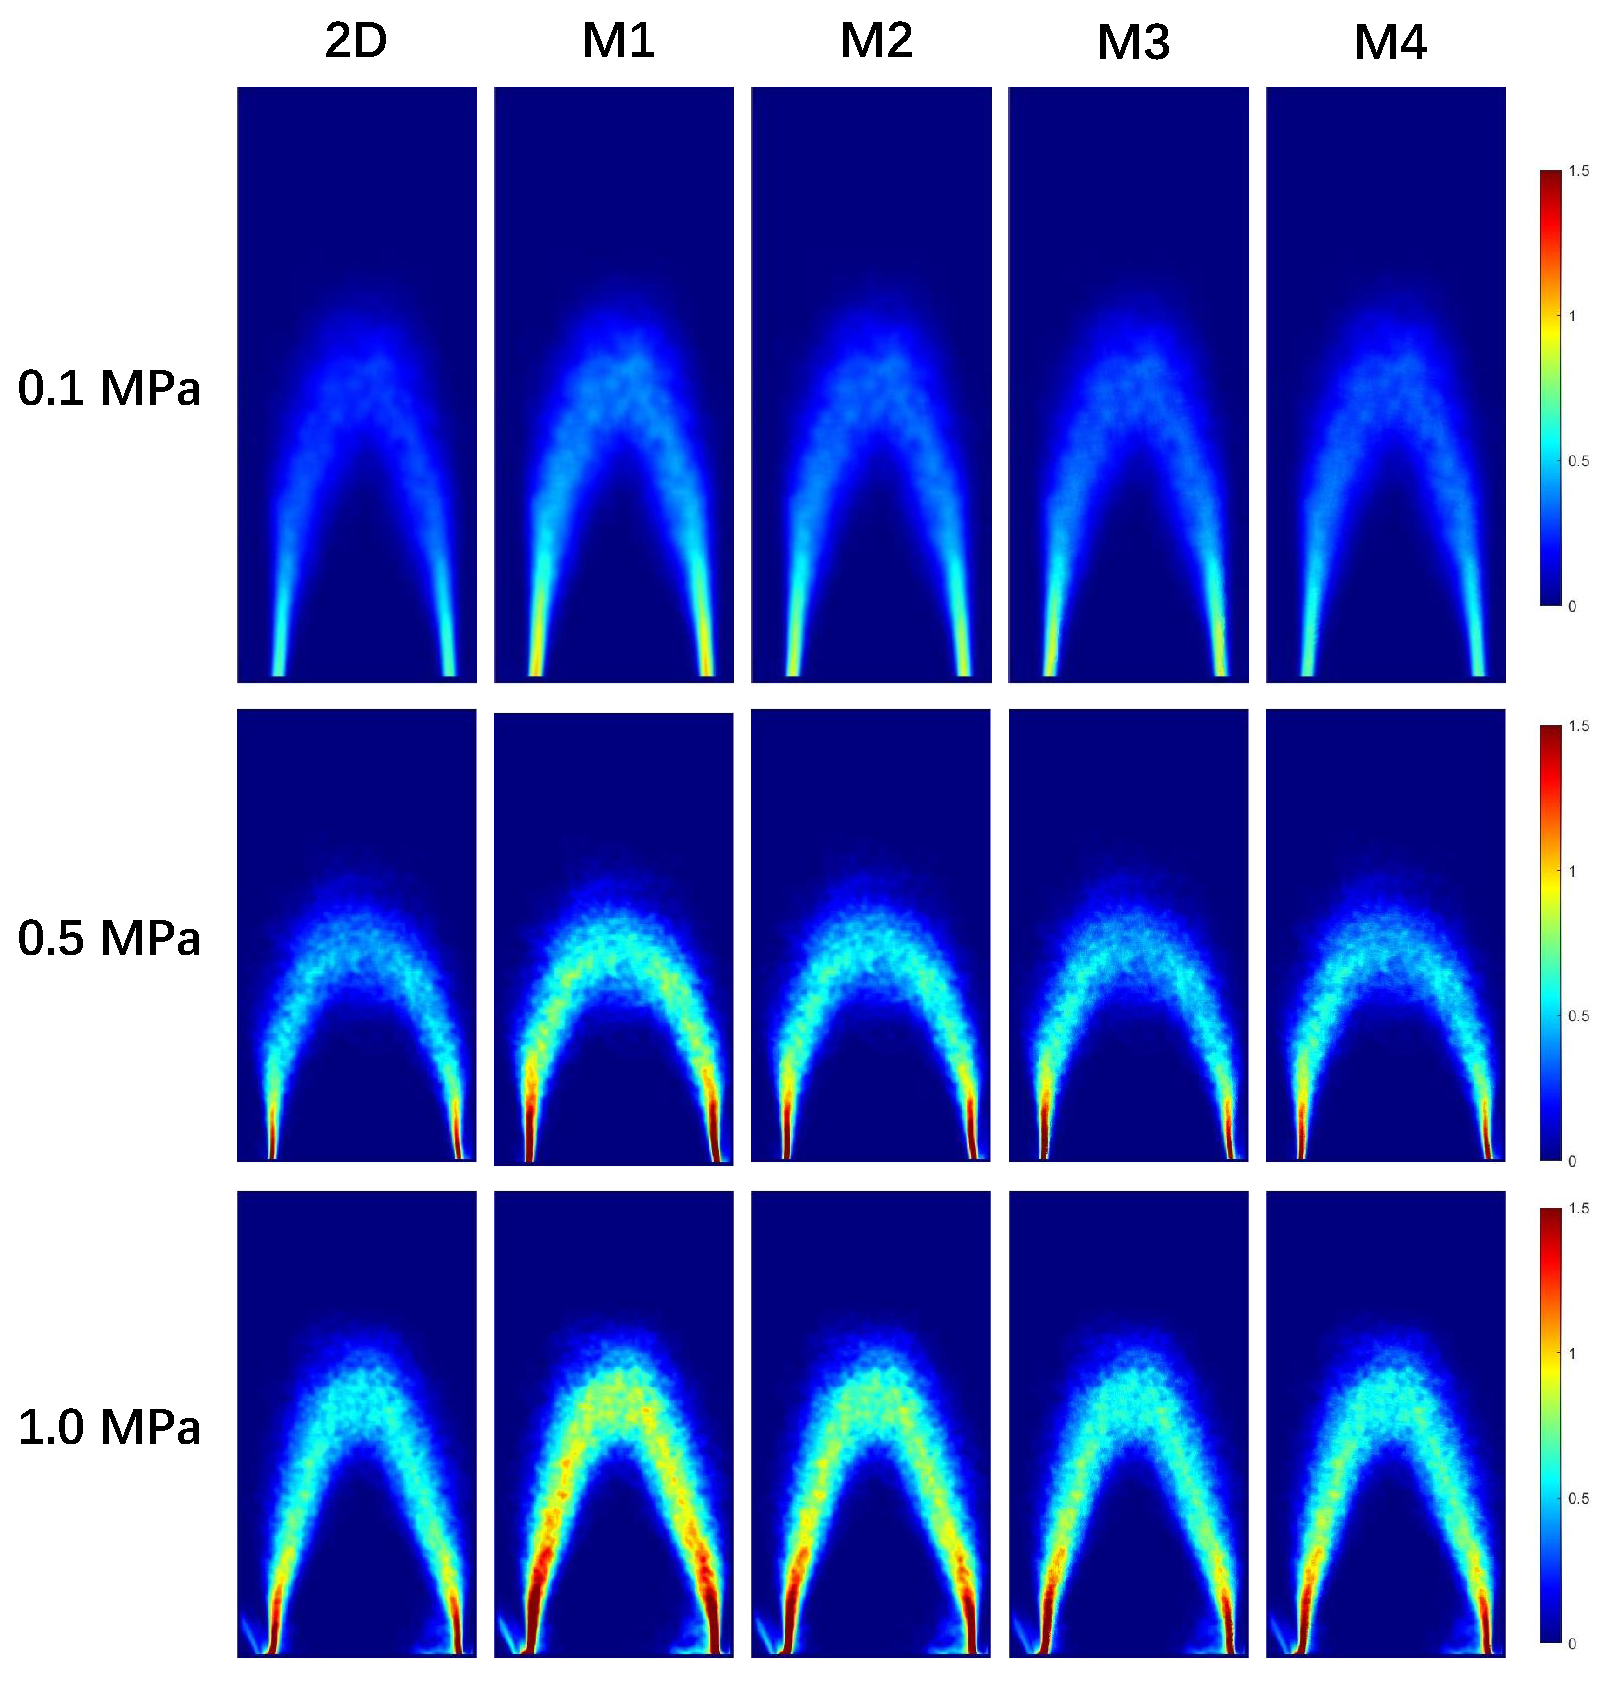
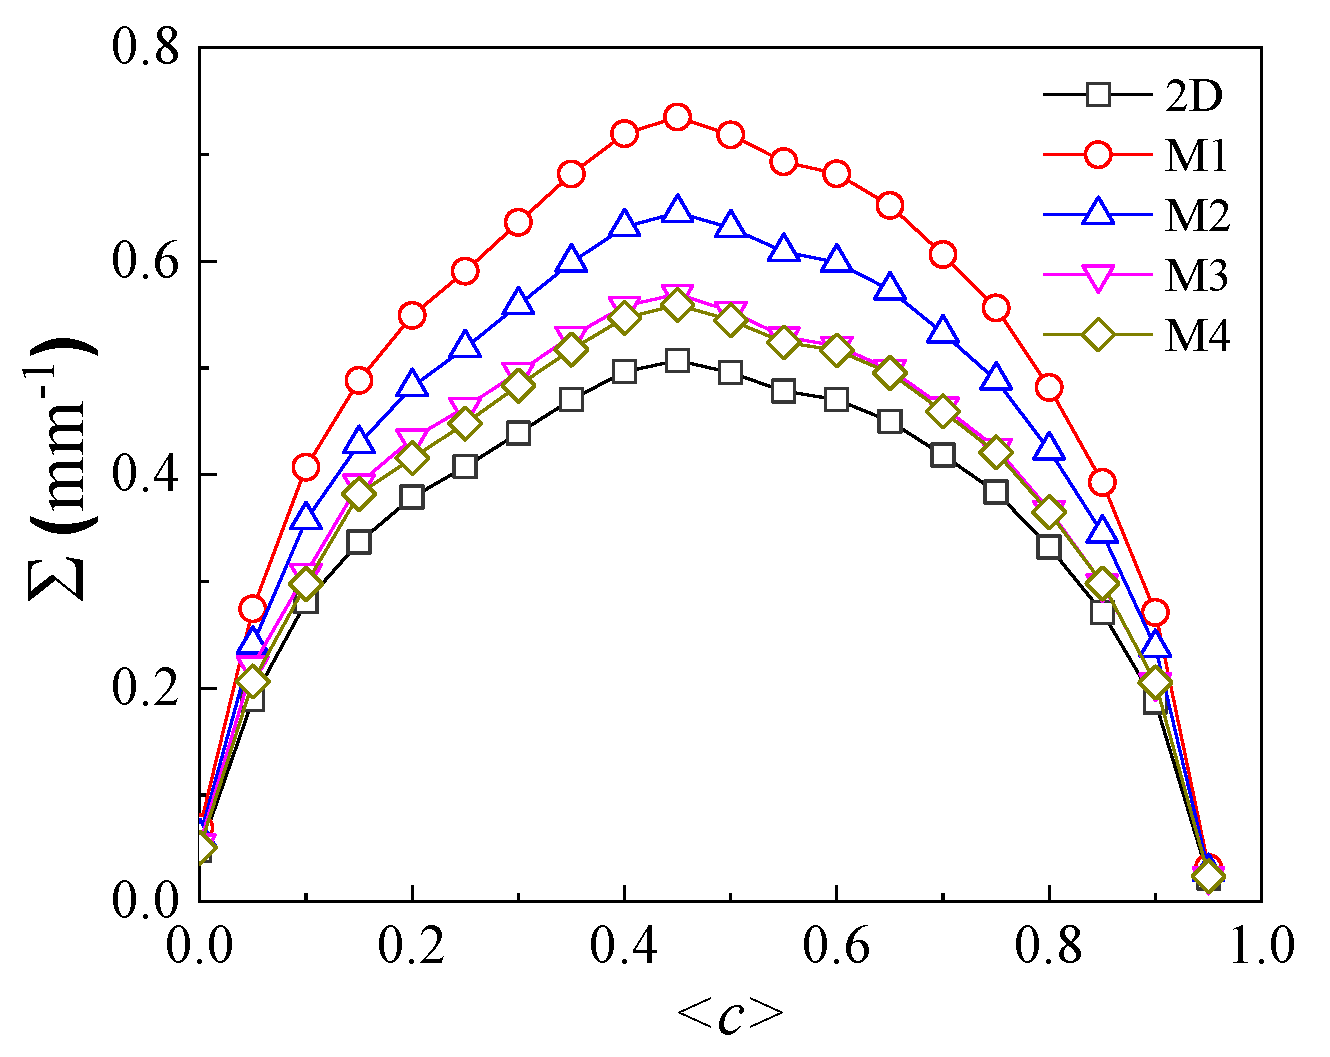
Figure 6 displays the processed two-dimensional flame surface density (2D FSD) and a comparison with the evaluation of 3D FSD by M1~M4. It is evident that the 2D FSD increases significantly with pressure due to the significant decrease of small flame front structures, as analyzed in the previous section. Moreover, it is clearly seen that the 3D-evaluated flame surface densities from the above models are larger than that of the 2D values, indicating the underestimation by the 2D measurement, which is also verified by Figure 7. This discrepancy was due to the fact that the 2D FSD calculation ignores the corrugation perpendicular to the measurement plane (the third direction). However, since the flames are three-dimensional in nature, the flame corrugation the third direction plays a very important role determining the true flame surface density (3D FSD). Additionally, it is highly dependent on the wrinkled flame front structure, which is greatly affected by pressure. The influence of pressure on the evaluation of 3D FSD is presented in the coming section.

5.3. Three-Dimensional Analysis

To further clarify the isotropic assumption of the flame front, the probability density function (PDF) angles θ extracted from the OH-PLIF images, as depicted in Figure 3c, are displayed in Figure 8. For easy comparison, the PDF of the isotropic unit normal vector, i.e., p ( θ ) = 1 / ( 2 π ) , is also plotted in the Figure. Firstly, the profiles are nearly symmetrical, verifying the turbulent Bunsen flame as being a roughly cylindrical shape. Secondly, there are clearly two peaks in the PDF distribution at θ = π / 2 and θ = π / 2 , respectively. As illustrated in Figure 3c, θ = π / 2 ( π / 2 ) corresponds to the flame front propagating outwards from the burner axis. Therefore, this bimodal shape indicates that the flame structure can be viewed as small-scale wrinkles superimposed on large-scale wrinkles, which are then superimposed on a laminar Bunsen flame. At last, and very importantly, it is evident that the PDF profile of θ is very different from isotropy assumption and the deviation from isotropy is smaller for flames at higher pressures. This indicates that the wrinkled flame front is closer to being isotropic at high pressures. Thus we expect that the 3D FSD models described in earlier section are more reliable at high pressures.
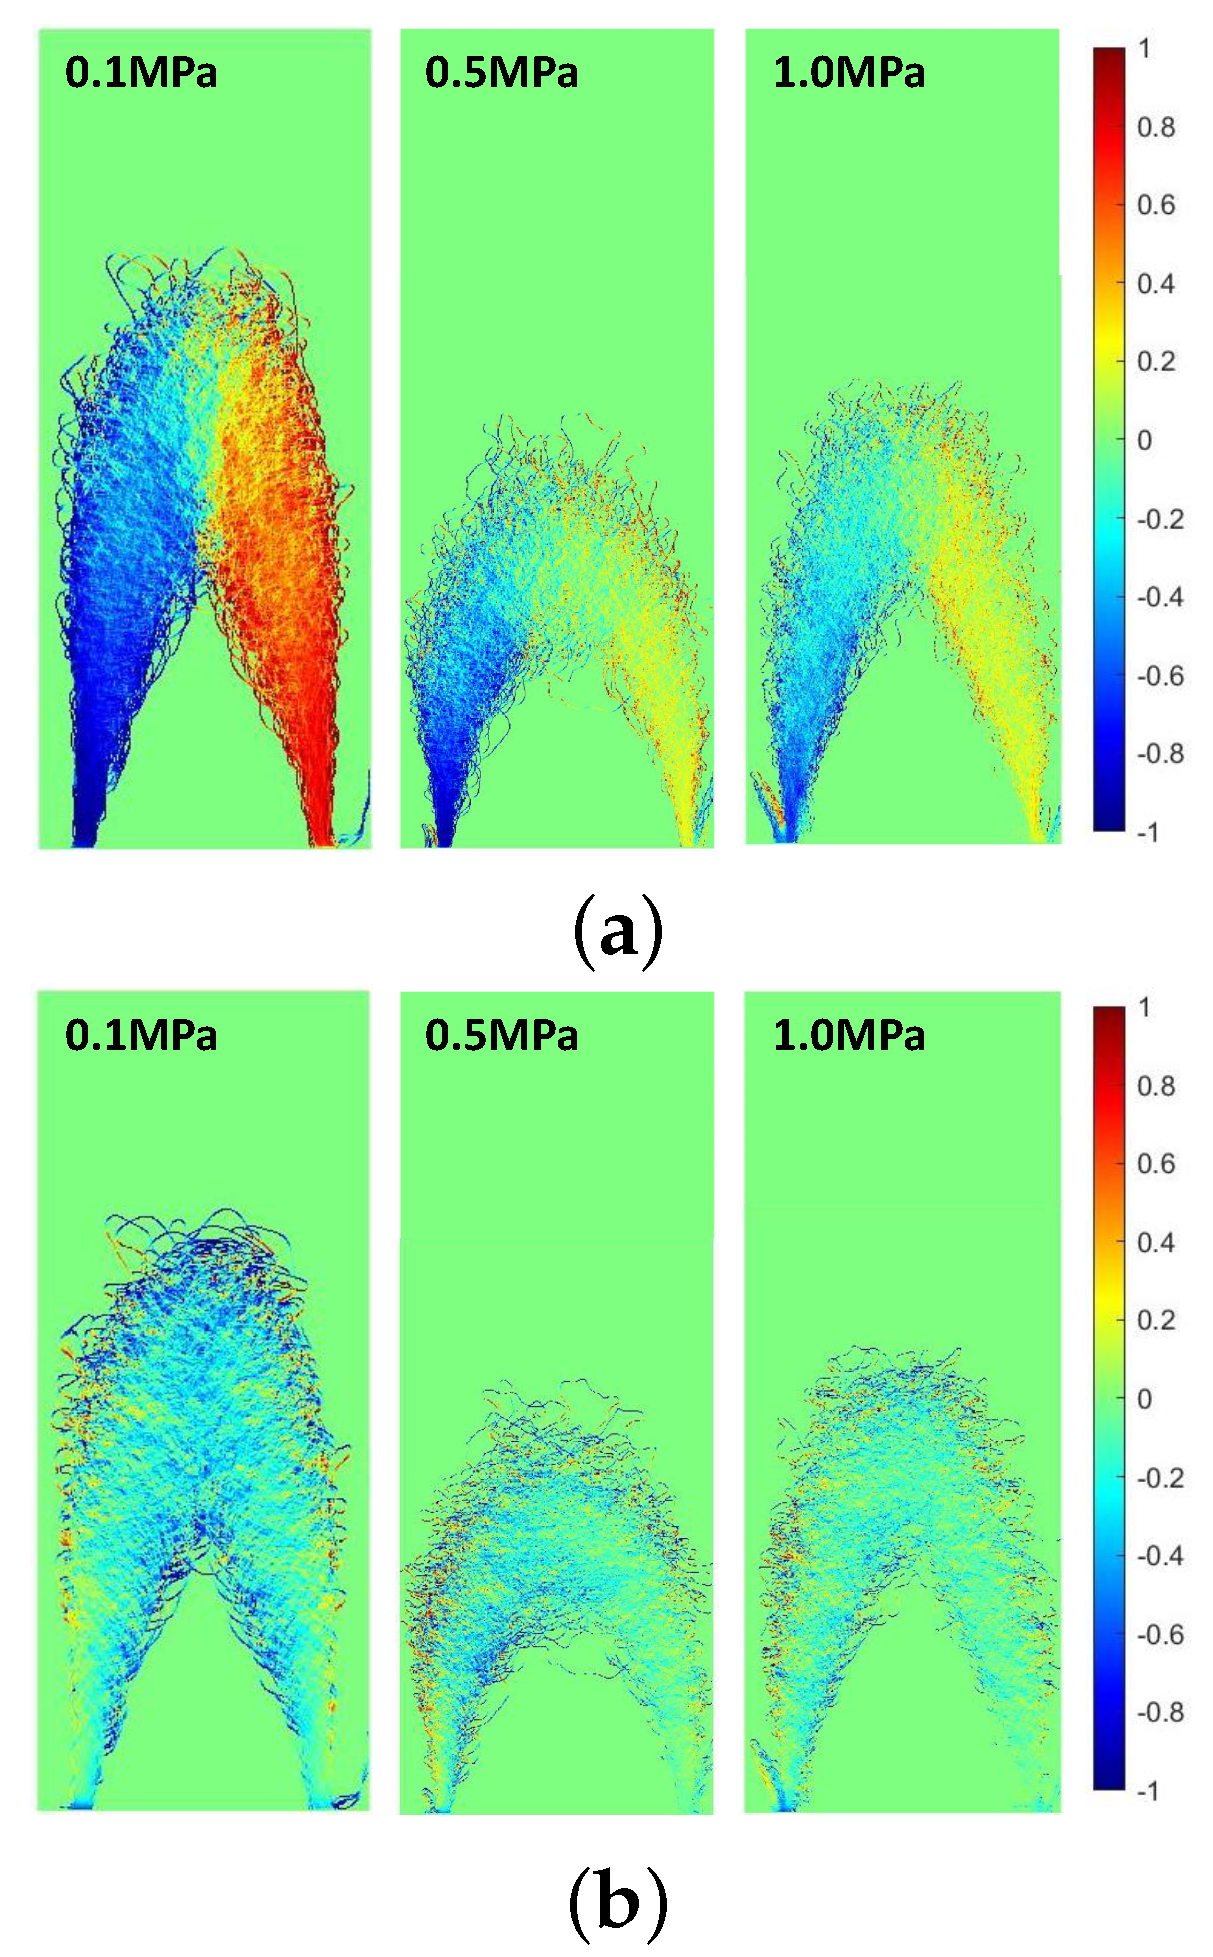
Figure 9 presents the mean components of the normal vectors for different pressures. For all pressures, both n x 2 D and n y 2 D are not uniform within the flame zone and are both virtually symmetric. Moreover, the mean components decrease with pressure because the flame front is more wrinkled and isotropic [15,32]. This indicates the flame front is more wrinkled at high pressure. When comparing the two components in Figure 9, we can see that n y 2 D is much smaller and more uniform for all pressures. This would be due to the following: (1) Triangle geometry of the Bunsen flame resulting from the high tangential velocity downstream; (2) The fact that the flame fluctuation in y direction is relative weak compared to that in x direction.
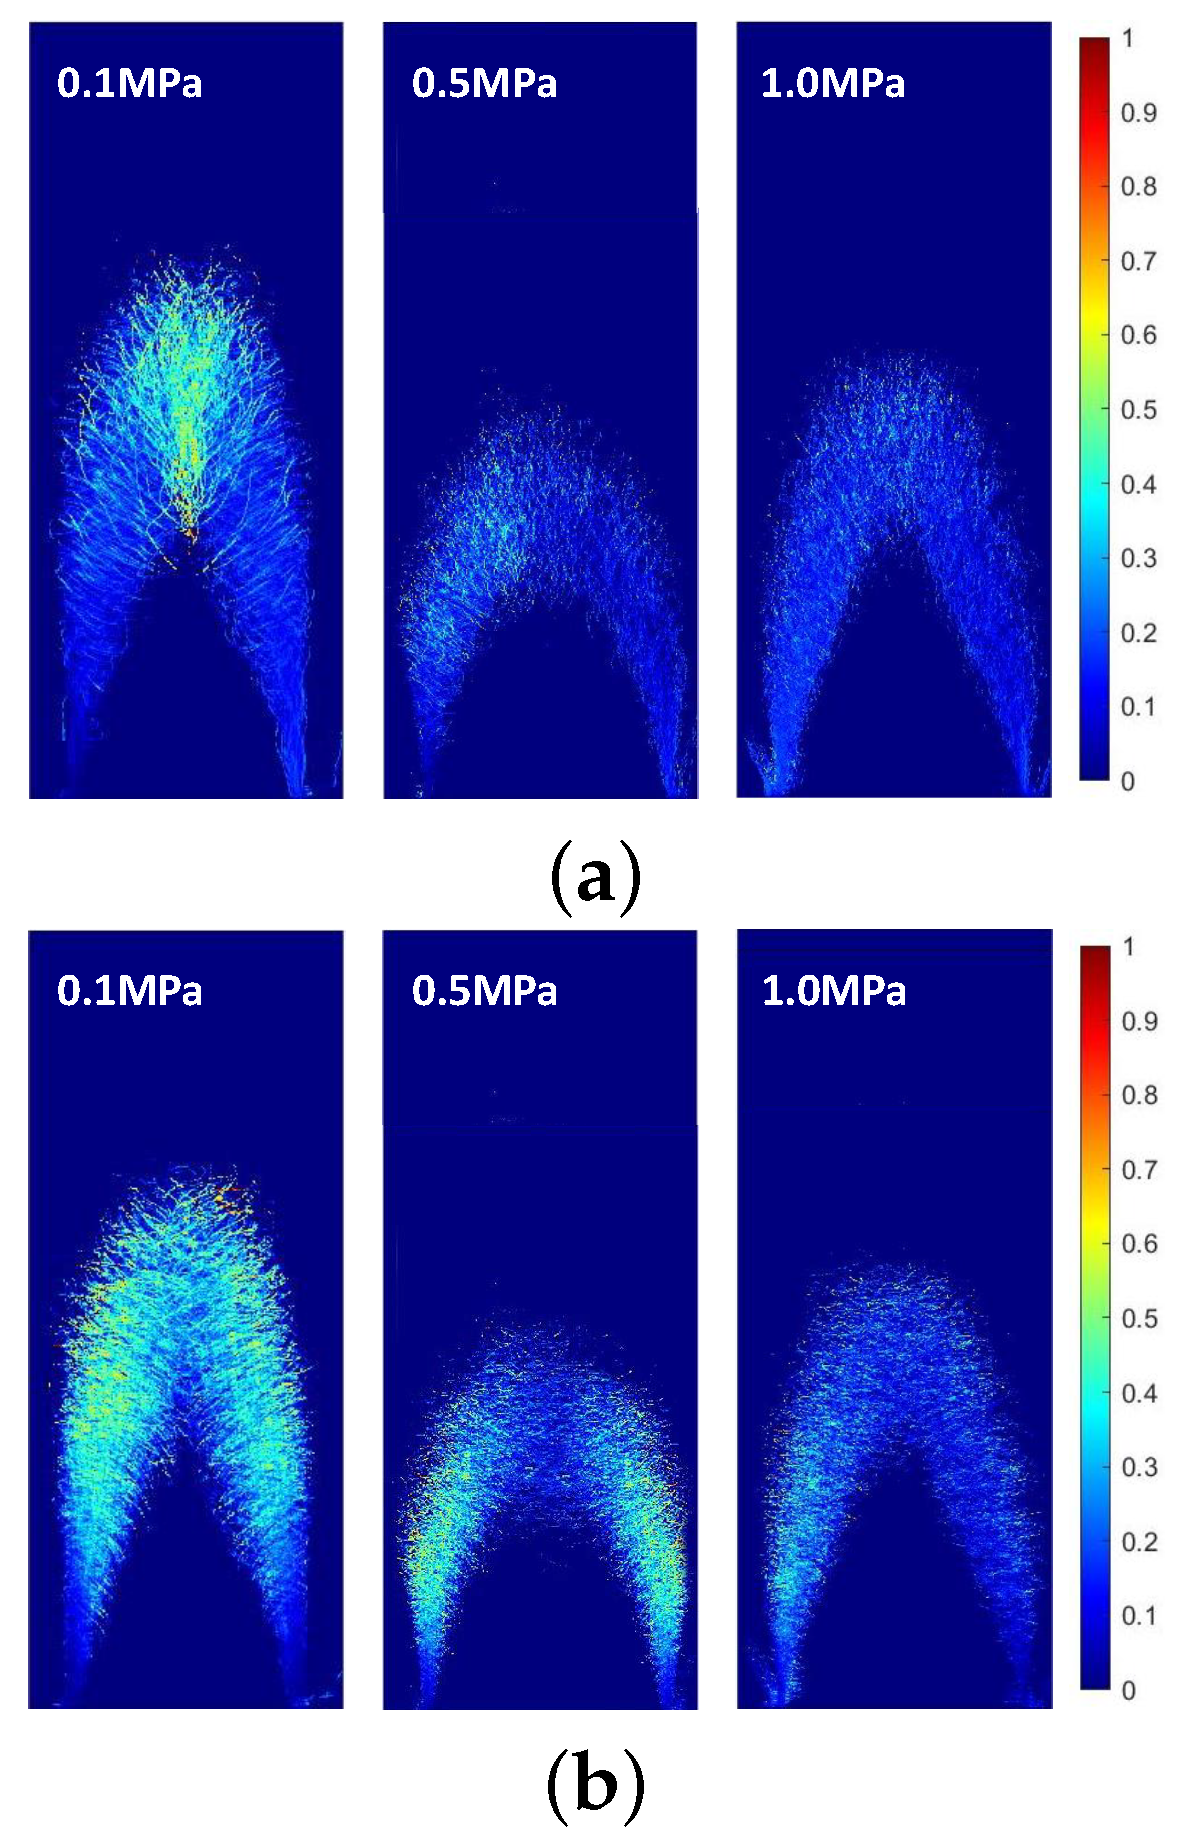
The surface averaged products n i 2 D n i 2 D s for different pressures are shown in Figure 10. n x 2 D n x 2 D s is predominant, indicating that the Bunsen flame can be viewed as cylindrical and the assumption n z s = 0 is reasonable. However, n x 2 D n x 2 D s is close to unity and apparently decreases downstream. This further verifies that (1) The flame wrinkles are not uniform; (2) The flame is less wrinkled near the flame’s base due to the non-developed flame–turbulence interaction, which is verified by the results obtained from the high-Karlovitz-number jet flame [22]. Moreover, n y 2 D n y 2 D s is close to zero since n y 2 D is small.
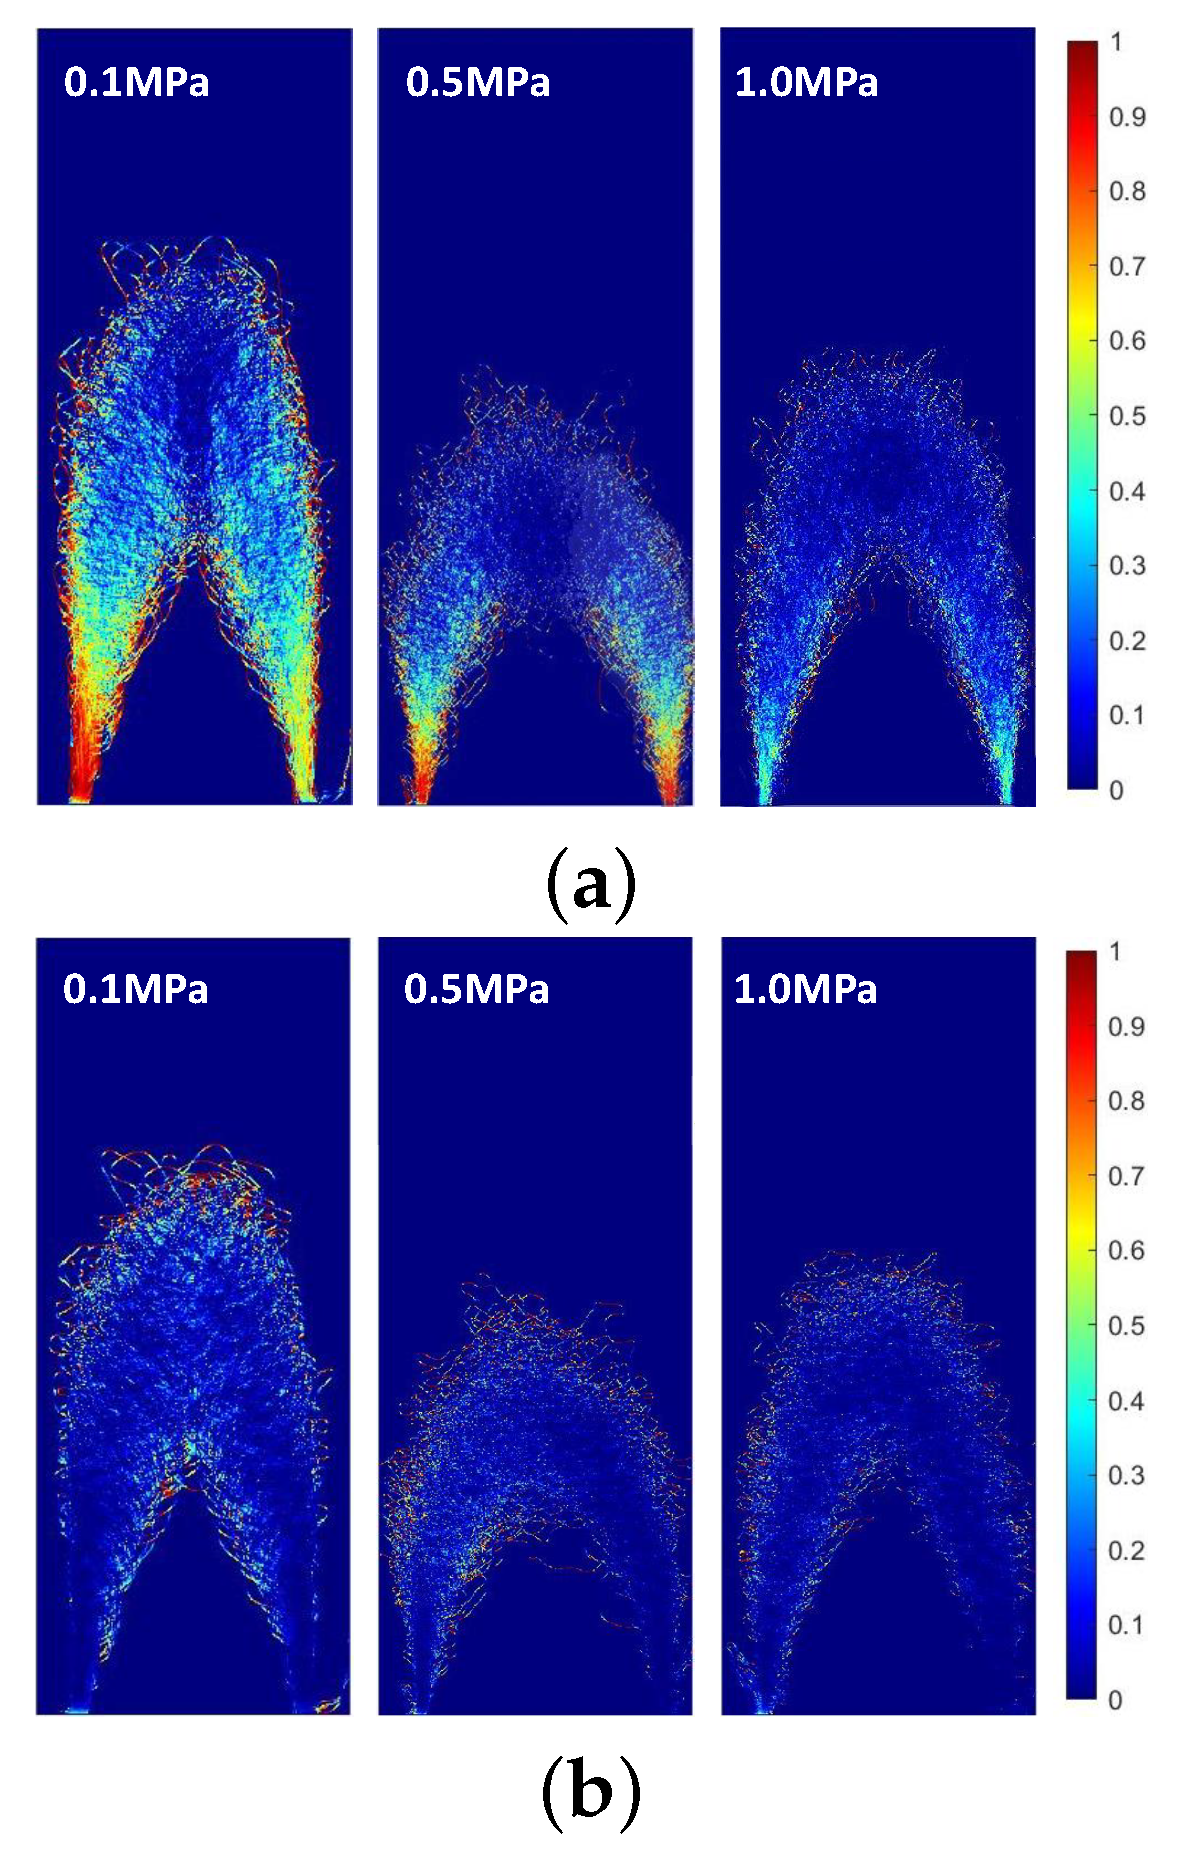
The fluctuating components m i 2 D m i 2 D s under different pressures are shown in Figure 11. According to Equations (16) and (17), m i 2 D m i 2 D s represents the contribution of the fluctuating in the third direction. m x 2 D m x 2 D s under ordinary pressure at the flame’s tip is larger than other parts of the flame, while m y 2 D m y 2 D s is predominant nearly within the whole flame region. Moreover, a more uniform value of m i 2 D m i 2 D s is observed under high pressure. This also verifies that the wrinkled flame front is closer to being isotropic at high pressure.

5.4. Global Fuel Consumption Rate Tests

Once three-dimensional flame surface density on the measurement plane is estimated, the global fuel consumption rate of the burner, W, can be obtained by the integration of the over the flame brush [3],
W = 0 + 0 + ρ 0 S L π x d x d y
where ρ 0 is the density of the unburned mixture and S L represents the unstretched laminar flame speed. S L and ρ 0 are obtained by CHEMKIN II [33] with the GRI 3.0 [34] mechanism in the current study. The properties and the parameters of the tested mixtures for different pressures are summarized in Table 1. We can see that the laminar flame speed decreases with pressure, with its value halved under 1.0 MPa compared to 0.1 MPa. Moreover, the unburned gas density increases linearly with pressure, since we consider the unburned mixture as an ideal gas. The global fuel consumption rate W integrated from Equation (18) represents the fuel consumption speed of the system. Therefore, W should be identical to the fuel supply from the burner outlet ρ 0 U S 0 , with U being the bulk outlet velocity from the burner exit and S 0 measuring the area of the burner exit. Thus, the ratio of global fuel consumption rate to the amount of unburned mixture supplied to burner R can be viewed as a parameter that can be used to test the 3D flame surface density correction.
R = 0 + 0 + ρ 0 S L π x d x d y ρ 0 U S 0
In current study, the area of the burner exit is 3.14 × 10 4 m 2 and the outlet velocities are listed in Table 1. Table 2 lists the ratios obtained from models described in earlier sections at different pressures.
We can see that the R values obtained by M1 and M2 are larger than those of M3 and M4 for atmospheric-pressure flames, indicating that M3 and M4 represent more reasonable methods to evaluate flame surface density and the fuel consumption rate. This would be due to the fact that the 3D FSD obtained by M1 and M2 only considers the difference between 3D and 2D through a common proportional constant within the flame brush. In other words, these two models neglect the difference between the flame wrinkles at different positions within the turbulent flame zone. However, flames often acquire more wrinkled structures at the flame’s tip, while having less wrinkled structures at the flame’s base; this could be the main cause of the overestimation. Moreover, the models from the normal vector analysis can obtain more satisfactory results for the flame at atmospheric pressure. For M3 and M4, the 3D FSD is overestimated only by about 10% on average, which can be considered as a good result.
In comparison, when the flame is operated at 0.5 MPa, R shows a clear decrease for all models. the global fuel consumption rate estimated by 2D FSD is still the smallest compared with that of the other models, as shown in Table 2. It can be seen that R is gradually decreased in the order of M1, M2, M3 and M4, which is with the same order as that seen for the flame under 0.1 MPa. When the pressure is increased to 1.0 MPa, R is even smaller, while the order is still preserved. Moreover, R at high pressures is less than unity, indicating the underestimation of 3D FSD. This would be due to the fact that (1) As mentioned earlier, laminar flame speed decreases with pressure. According to Equation (19), to maintain R close to unity, FSD should increase by a large amount, i.e., the FSD under 1.0 MPa should be two times as large as that under 0.1 MPa. (2) The flame thickness decreases with pressure and the measurement needs higher resolution to resolve the thinner flame at high pressure. (3) There may exist some discrepancies between the models at high pressures, which need further reconsiderations.

6. Conclusions

In premixed turbulent flames, flame surface density is defined as the ratio of surface-to-volume and provides a model for evaluating turbulent burning velocity and establishing turbulent combustion models. However, in experiments, it is usually approximated with its two-dimensional value from 2D laser measurements, leading to an underestimation of the flame surface area due to the lack of information on flame wrinkles in the direction perpendicular to the measurement plane. This work describes different models for estimating 3D flame surface density from its original definition and investigates the effect of pressure on the robustness of the models using a CH4/air premixed turbulent Bunsen flame. The flame was operated at the high pressure up to 1.0 MPa. The flame front was indicated by the sharp increase of OH distribution, as detected by the OH-PLIF technique. Results show that the models considering local flame wrinkles are more reasonable and reliable. Moreover, the flame front wrinkles are closer to being isotropic at high pressure due to having smaller scales, resulting an underestimation of the global burning rate. The possible reasons are low flame speed at high pressures, requiring finer resolution in terms of flame thickness, and more accurate analysis in terms of the normal vector analysis. Further steps towards improving FSD at high pressures would refine FSD analysis, allowing one to obtain information on the third direction and verify the assumptions through DNS results.

Author Contributions

M.Z.; resources, writing—review and editing, J.W.; supervision, Z.H.; funding acquisition. All authors have read and agreed to the published version of the manuscript.

Funding

This research was funded by National Key Research and Development Program (2021YFA0716202) and National Natural Science Foundation of China (No. 52176130).

Institutional Review Board Statement

Not applicable.

Informed Consent Statement

Not applicable.

Data Availability Statement

Not applicable.

Acknowledgments

The high pressure experiment was performed by Jinhua Wang at Institute of Fluid Science, Tohoku University, Japan under the support of the Japan Society for the Promotion of Science for a Postdoctoral Fellowship (JSPS) grant. The authors acknowledged the group members contributed to the experiments.

Conflicts of Interest

The authors declare no conflict of interest.

Sample Availability

Samples of the compounds are available from the authors.

Abbreviations

The following abbreviations are used in this manuscript:
PSDFlame Surface Density
PLIFPlanar Laser Induced Florescence

Appendix A

According to the definition, the norm of n equals to unity. Therefore its surface averaged value is also unity. We have
n s = 1 .
Substituting three components in the form of n i = n i s + m i with i = 1 , 2 , 3 to above equation, we have
( n i s + m i ) ( n i s + m i ) s = 1 .
Since m i s = 0 and n i s is an averaged value, we have
n i s m i s = 0 .
Thus,
n i s n i s + m i m i s = 1 .
The flame is symmetric with the measurement plane resulting n z s = 0 . Substituting n i = n i 2 D cos θ to above equation gives
n i 2 D cos ϕ s 2 + m i 2 D m i 2 D s + m z m z s = 1 .
in which i = 1 , 2 . The first two terms at left hand side in Equation (A5) can be obtained from the 2D measurement and the third term is the fluctuating component in the third direction which needs to be modelled. This equation connects the normals on the measurement plane and out of the measurement plane and can be further simplified to
cos ϕ s 2 + m z m z s = 1 .
based on the approximations listed below.
n i 2 D cos ϕ s n i 2 D s cos ϕ s             cos 2 ϕ s cos ϕ s 2

References

  1. Peters, N. Laminar flamelet concepts in turbulent combustion. In Proceedings of the Symposium on Combustion, Seattle, WA, USA, 14–19 August 1988; Volume 21, pp. 1231–1250. [Google Scholar]
  2. Damköhler, G. Der einfluss der turbulenz auf die flammengeschwindigkeit in gasgemischen. Z. Elektrochem. Angew. Phys. Chem. 1940, 46, 601–626. [Google Scholar]
  3. Driscoll, J.F. Turbulent premixed combustion: Flamelet structure and its effect on turbulent burning velocities. Prog. Energy Combust. Sci. 2008, 34, 91–134. [Google Scholar] [CrossRef]
  4. Shepherd, I. Flame surface density and burning rate in premixed turbulent flames. In Proceedings of the Symposium (International) on Combustion, Houston, TX, USA, 13–17 October 1996; Volume 26, pp. 373–379. [Google Scholar]
  5. Veynante, D.; Vervisch, L. Turbulent combustion modeling. Prog. Energy Combust. Sci. 2002, 28, 193–266. [Google Scholar] [CrossRef]
  6. Lee, G.G.; Huh, K.Y.; Kobayashi, H. Measurement and analysis of flame surface density for turbulent premixed combustion on a nozzle-type burner. Combust. Flame 2000, 122, 43–57. [Google Scholar] [CrossRef]
  7. Kobayashi, H.; Otawara, Y.; Wang, J.; Matsuno, F.; Ogami, Y.; Okuyama, M.; Kudo, T.; Kadowaki, S. Turbulent premixed flame characteristics of a CO/H2/O2 mixture highly diluted with CO2 in a high-pressure environment. Proc. Combust. Inst. 2013, 34, 1437–1445. [Google Scholar] [CrossRef]
  8. Zhang, M.; Wang, J.; Wu, J.; Wei, Z.; Huang, Z.; Kobayashi, H. Flame front structure of turbulent premixed flames of syngas oxyfuel mixtures. Int. J. Hydrogen Energy 2014, 39, 5176–5185. [Google Scholar] [CrossRef]
  9. Halter, F.; Chauveau, C.; Gkalp, I. Characterization of the effects of hydrogen addition in premixed methane/air flames. Int. J. Hydrogen Energy 2007, 32, 2585–2592. [Google Scholar] [CrossRef]
  10. Guo, H.; Tayebi, B.; Galizzi, C.; Escudi, D. Burning rates and surface characteristics of hydrogen-enriched turbulent lean premixed methane air flames. Int. J. Hydrogen Energy 2010, 35, 11342–11348. [Google Scholar] [CrossRef] [Green Version]
  11. Hult, J.; Omrane, A.; Nygren, J.; Kaminski, C.; Axelsson, B.; Collin, R.; Bengtsson, P.-E.; Aldén, M. Quantitative three-dimensional imaging of soot volume fraction in turbulent non-premixed flames. Exp. Fluids 2002, 33, 265–269. [Google Scholar] [CrossRef]
  12. Karpetis, A.N.; Barlow, R.S. Measurements of flame orientation and scalar dissipation in turbulent partially premixed methane flames. Proc. Combust. Inst. 2005, 30, 665–672. [Google Scholar] [CrossRef]
  13. Veynante, D.; Lodato, G.; Domingo, P.; Vervisch, L.; Hawkes, E.R. Estimation of three-dimensional flame surface densities from planar images in turbulent premixed combustion. Exp. Fluids 2010, 49, 267–278. [Google Scholar] [CrossRef]
  14. Halter, F.; Chauveau, C.; Gkalp, I.; Veynante, D. Analysis of flame surface density measurements in turbulent premixed combustion. Combust. Flame 2009, 156, 657–664. [Google Scholar] [CrossRef]
  15. Zhang, M.; Wang, J.; Jin, W.; Huang, Z.; Kobayashi, H.; Ma, L. Estimation of 3D flame surface density and global fuel consumption rate from 2D PLIF images of turbulent premixed flame. Combust. Flame 2015, 162, 2087–2097. [Google Scholar] [CrossRef]
  16. Deschamps, B.; Smallwood, G.; Prieur, J.; Snelling, D.; Gülder, Ö. Surface density measurements of turbulent premixed flames in a spark-ignition engine and a bunsen-type burner using planar laser-induced fluorescence. In Proceedings of the Symposium (International) on Combustion, Houston, TX, USA, 13–17 October 1996; Volume 26, pp. 427–435. [Google Scholar]
  17. Hawkes, E.R.; Sankaran, R.; Chen, J.H. Estimates of the three-dimensional flame surface density and every term in its transport equation from two-dimensional measurements. Proc. Combust. Inst. 2011, 33, 1447–1454. [Google Scholar] [CrossRef]
  18. Kobayashi, H. Experimental study of high-pressure turbulent premixed flames. Exp. Therm. Fluid Sci. 2002, 26, 375–387. [Google Scholar] [CrossRef]
  19. Wang, J.; Zhang, M.; Huang, Z.; Kudo, T.; Kobayashi, H. Measurement of the instantaneous flame front structure of syngas turbulent premixed flames at high pressure. Combust. Flame 2013, 160, 2434–2441. [Google Scholar] [CrossRef]
  20. Pope, S.B. The evolution of surfaces in turbulence. Int. J. Eng. Sci. 1988, 26, 445–469. [Google Scholar] [CrossRef]
  21. Boger, M.; Veynante, D.; Boughanem, H.; Trouvé, A. Direct numerical simulation analysis of flame surface density concept for large eddy simulation of turbulent premixed combustion. In Proceedings of the Symposium (International) on Combustion, Boulder, CO, USA, 2–7 August 1998; Volume 27, pp. 917–925. [Google Scholar]
  22. Wang, H.; Hawkes, E.R.; Chen, J.H. Turbulence-flame interactions in DNS of a laboratory high Karlovitz premixed turbulent jet flame. Phys. Fluids 2016, 28, 91–134. [Google Scholar] [CrossRef] [Green Version]
  23. Wang, H.; Hawkes, E.R.; Chen, J.H.; Bo, Z.; Li, Z.; Marcus, A. Direct numerical simulations of a high karlovitz number laboratory premixed jet flame—An analysis of flame stretch and flame thickening. J. Fluid Mech. 2017, 815, 511–536. [Google Scholar] [CrossRef]
  24. Kobayashi, H.; Tamura, T.; Maruta, K.; Niioka, T.; Williams, F.A. Burning velocity of turbulent premixed flames in a high-pressure environment. In Proceedings of the Symposium on Combustion, Houston, TX, USA, 13–17 October 1996; Volume 26, pp. 389–396. [Google Scholar]
  25. Tamadonfar, P. Experimental Investigation of Premixed Turbulent Hydrogen/Air Bunsen Flames. Ph.D. Thesis, Greduate Department of Arospace and Engineering, University of Toronto, Toronto, ON, Canada, July 2016. [Google Scholar]
  26. Bell, J.B.; Day, M.S.; Grcar, J.F.; Lijewski, M.J.; Driscoll, J.F.; Filatyev, S.A. Numerical simulation of a laboratory-scale turbulent slot flame. Proc. Combust. Inst. 2007, 31, 1299–1307. [Google Scholar] [CrossRef] [Green Version]
  27. Hawkes, E.R.; Sankaran, R.; Chen, J.H.; Kaiser, S.A.; Frank, J.H. An analysis of lower-dimensional approximations to the scalar dissipation rate using direct numerical simulations of plane jet flames. Proc. Combust. Inst. 2009, 32, 1455–1463. [Google Scholar] [CrossRef]
  28. Cant, R.; Pope, S.; Bray, K. Modelling of flamelet surface-to-volume ratio in turbulent premixed combustion. In Proceedings of the Symposium (International) on Combustion, Washington, DC, USA, 25–28 March 1991; Volume 23, pp. 809–815. [Google Scholar]
  29. Wang, J.; Matsuno, F.; Okuyama, M.; Ogami, Y.; Kobayashi, H.; Huang, Z. Flame front characteristics of turbulent premixed flames diluted with CO2 and H2O at high pressure and high temperature. Proc. Combust. Inst. 2013, 34, 1429–1436. [Google Scholar] [CrossRef]
  30. Zhang, M.; Wang, J.; Yu, S.; Jin, W.; Huang, Z.; Yong, H.; Meng, D. Flame front tracking of turbulent premixed flames using adaptive threshold binarization. Combust. Sci. Technol. 2016, 33, 212–217. (In Chinese) [Google Scholar]
  31. Zhang, W.; Wang, J.; Yu, Q.; Jin, W.; Zhang, M.; Huang, Z. Investigation of the fuel effects on burning velocity and flame structure of turbulent premixed flames based on leading points concept. Combust. Sci. Technol. 2018, 190, 1354–1376. [Google Scholar] [CrossRef]
  32. Lachaux, T.; Halter, F.; Chauveau, C.; Gkalp, I.; Shepherd, I. Flame front analysis of high-pressure turbulent lean premixed methaneair flames. Proc. Combust. Inst. 2005, 30, 819–826. [Google Scholar] [CrossRef]
  33. Kee, R.; Rupley, F.; Miller, J. Chemkin-II: A Fortran Chemical Kinetics Package for the Analysis of Gas-Phase Chemical Kinetics; Technical Report; Sandia National Lab. (SNL-CA): Livermore, CA, USA, 1989.
  34. Smith, G.P.; Golden, D.M.; Frenklach, M.; Moriarty, N.W.; Eiteneer, B.; Goldenberg, M.; Bowman, C.T.; Hanson, R.K.; Song, S.; Gardiner, W.C., Jr.; et al. Available online: http://combustion.berkeley.edu/gri-mech/version30/text30.html (accessed on 5 April 2023).
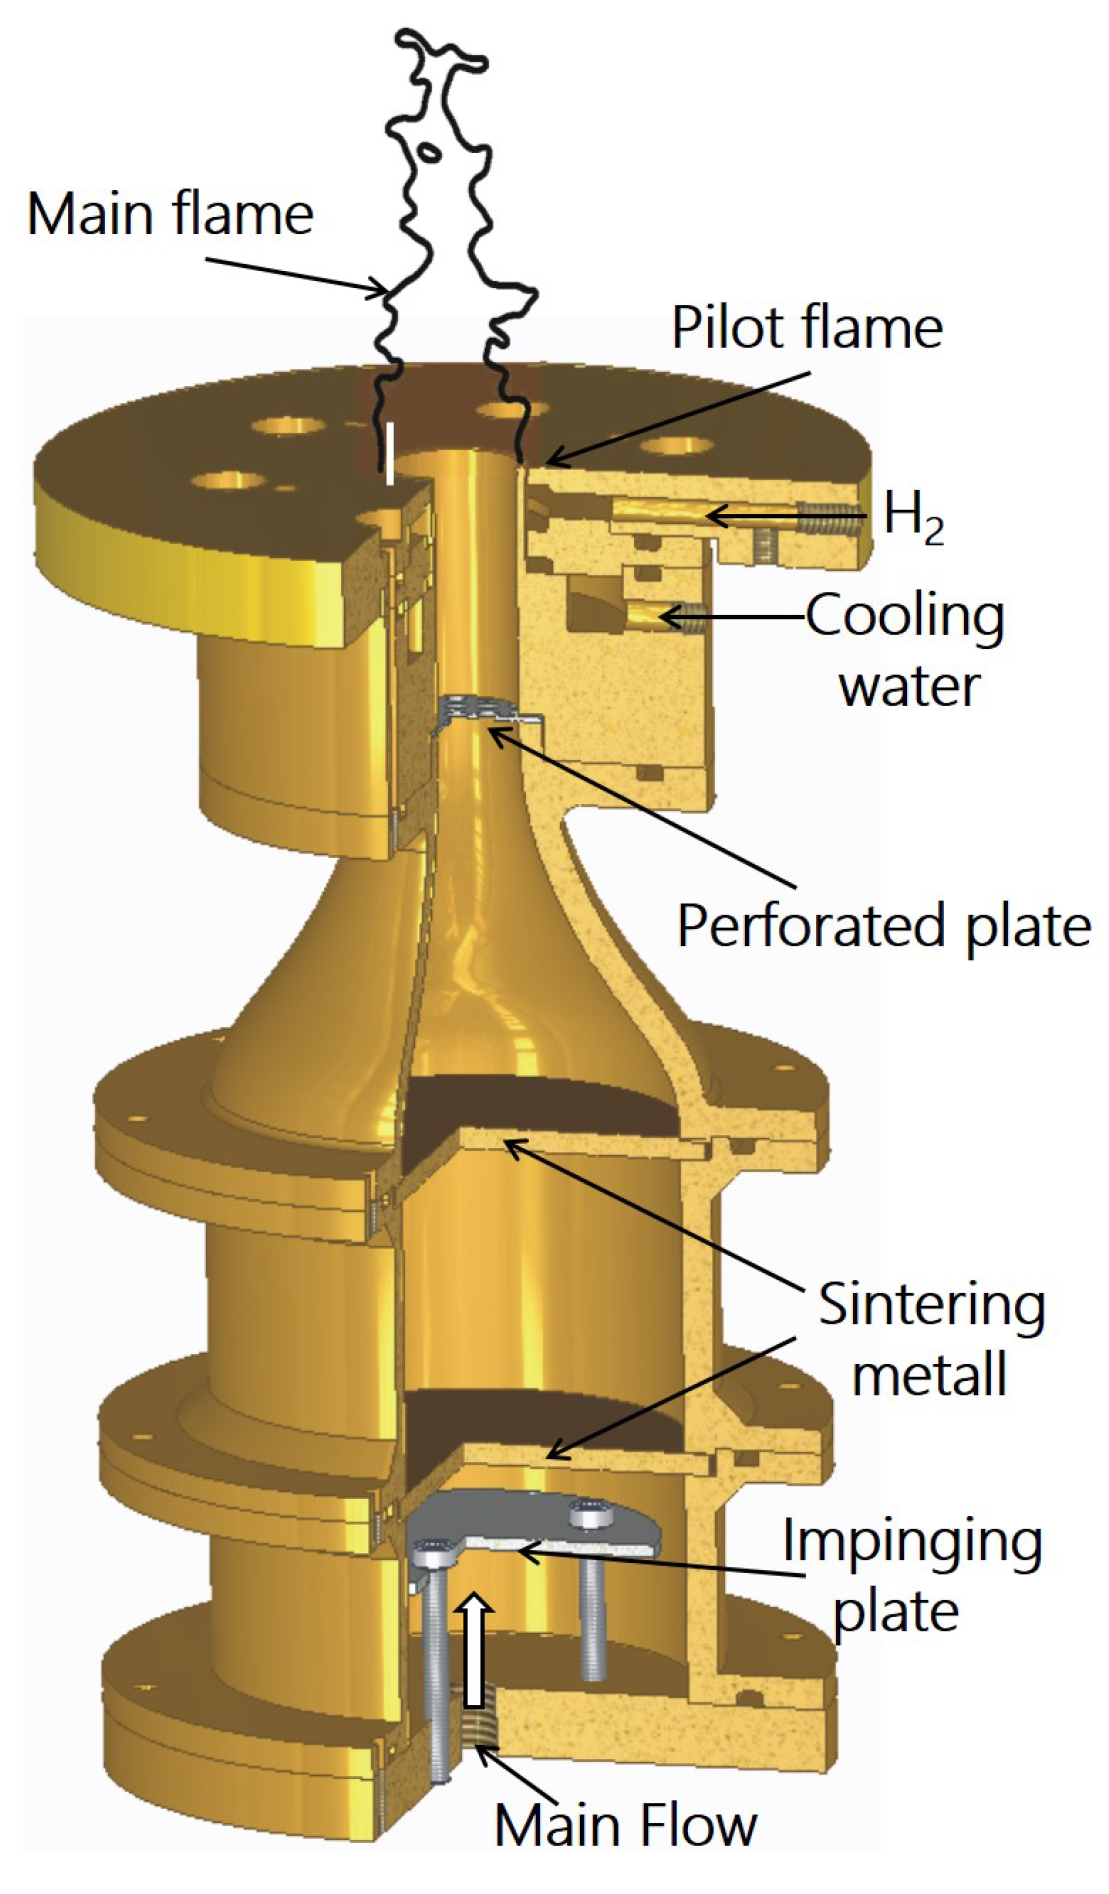
Figure 1. The sketch of the premixed turbulent Bunsen burner.
Applsci 13 04691 g001
Figure 2. The schematic of the perforated plate used and the relationship between turbulence intensity and bulk inlet velocity.
Applsci 13 04691 g002
Figure 3. (a) The sketch of a 3D surface measured on a 2D plane; (b) the relation of 3D and 2D normals; (c) the definition of θ . x o y represents the measurement plane and z is the normal direction of x o y .
Applsci 13 04691 g003
Figure 4. Typical OH-PLIF images at U = 3.0 m/s: (a) 0.1 MPa; (b) 0.5 MPa; (c) 1.0 MPa.
Applsci 13 04691 g004
Figure 5. OH-PLIF image processing method for high pressure flame with a low signal-noise ratio. (a) Raw OH-PLIF image; (b) image with median filter; (c) the local threshold of image binaryzation; (d) the binary image; (e) the flame front (border of binary image); (f) flame brush. The flame shown above was operated under 1.0 MPa with a bulk inlet velocity of 3 m/s.
Applsci 13 04691 g005
Figure 6. Two-dimensional flame surface density and its comparison with the evaluation by M1~M4. Upper panel: 0.1 MPa; middle panel: 0.5 MPa; lower panel 1.0 MPa.
Applsci 13 04691 g006
Figure 7. The variation in two–dimensional flame surface density and the evaluation with the mean progress variable, at 0.5 MPa. Only this case is shown here due to brevity, since the behaviors observed under three pressures are the same.
Applsci 13 04691 g007
Figure 8. Probability density function (PDF) of angles θ obtained from the flame front, as defined in Figure 3c, under different pressures. The PDF of the isotropic unit normal vector p ( θ ) = 1 / ( 2 π ) is also plotted in the figure.
Applsci 13 04691 g008
Figure 9. Pressure effect on the averaged normal vector in x and y direction. (a) n x 2 D s ; (b) n y 2 D s .
Applsci 13 04691 g009
Figure 10. Pressure effect on the evaluation of n i 2 D n i 2 D s . (a) n x 2 D n x 2 D s ; (b) n y 2 D n y 2 D s .
Applsci 13 04691 g010
Figure 11. Fluctuating components of the normal vector for different pressures. (a) m x 2 D m x 2 D s ; (b) m y 2 D m y 2 D s .
Applsci 13 04691 g011
Table 1. Parameters of the CH4/air mixtures at different pressures.
Mixture ϕ P (MPa) S L (cm/s) ρ ( kg / m 3 ) U (m/s) U π r 2 ( m 3 / s )
CH 4 /air0.90.130.971.122.920.000917
CH 4 /air1.00.518.785.573.00.000917
CH 4 /air1.01.014.4911.143.00.000917
Table 2. The value of R obtained by different models at pressure of 0.1, 0.5 and 1.0 MPa.
P (MPa)2DM1M2M3M4
0.10.961.401.231.191.09
0.50.520.750.660.570.56
1.00.450.650.580.510.49
Disclaimer/Publisher’s Note: The statements, opinions and data contained in all publications are solely those of the individual author(s) and contributor(s) and not of MDPI and/or the editor(s). MDPI and/or the editor(s) disclaim responsibility for any injury to people or property resulting from any ideas, methods, instructions or products referred to in the content.