Article

A Hierarchical Parallel Graph Summarization Approach Based on Ranking Nodes

School of Computer Science, Nanjing University of Posts and Telecommunications, Nanjing 210023, China
*
Author to whom correspondence should be addressed.
Appl. Sci. 2023, 13(8), 4664; https://doi.org/10.3390/app13084664
Submission received: 5 February 2023 / Revised: 29 March 2023 / Accepted: 5 April 2023 / Published: 7 April 2023

Abstract

:
Graph summarization techniques are vital in simplifying and extracting enormous quantities of graph data. Traditional static graph structure-based summarization algorithms generally follow a minimum description length (MDL) style, and concentrate on minimizing the graph storage overhead. However, these methods also suffer from incomprehensive summary dimensions and inefficiency problems. In addition, the need for graph summarization techniques often varies among different graph applications, but an ideal summary method should generally retain the important characteristics of the key nodes in the final summary graph. This paper proposes a novel method based on ranking nodes, called HRNS, that follows a hierarchical parallel graph summarization approach. The HRNS first preprocesses the node ranking using a hybrid weighted importance strategy, and introduces the node importance factor into traditional MDL-based summarization algorithms; it then leverages a hierarchical parallel process to accelerate the summary computation. The experimental results obtained using both real and simulated datasets show that HRNS can efficiently extract nodes with high importance, and that the average importance over six datasets ranges from 0.107 to 0.167; thus, HRNS can achieve a significant performance gain on speedups, as the sum error ratios are also lower than the methods traditionally used.

1. Introduction

Nowadays, the amount of highly interactive applications is increasing rapidly. Graph structures can model entities and their complex relations, and are therefore widely deployed in various applications, such as social network analysis, citation networks, and protein biological network synthesis, etc. With the significant growth of interactive analysis applications, the scale and complexity of graph data are also increasing. In 2021, the number of web pages in China reached 335 billion [1], and the number of social network connections reached tens of billions [2,3]. Meanwhile, the number of active users of Facebook in early 2022 was over 2.93 billion, with over 100 billion emails being delivered every day [4]. This voluminous user base incurs an overwhelming quantity of interaction data and is generally represented as graph data by researchers. Moreover, discovering ways in which to create simplified and efficient processing methods for massive graphs is becoming one of the most crucial issues in many fields [5].
Large graphs often contain billions of edges and vertices, which often exceed the memory limit and introduce high I/O expenses. Moreover, these graphs often contain a small proportion of vital information and lead to a waste of computing resources. Some researchers have proposed graph simplification techniques, such as graph compression, graph clustering, and graph summary [6], in order to reduce the storage cost and improve computation efficiencies.
Graph clustering [7] aggregates together nodes with a similar structure, attributes, or other dimensions, while graph compression [8] mainly focuses on compact storage-saving techniques, such as the k2-tree, adjacency list, and lexicographic order. These two simplifying technologies both shrink the graph data size; however, graph compression mainly focuses on reducing the storage cost, while graph clustering concentrates more on grouping similar nodes together, and is insufficient for expressing globally important features.
Although graph clustering and graph summarization both have similar operations in terms of grouping vertices, graph clustering is more focused on the densely connected nodes, while graph summarization compresses a series of interconnected nodes and links to obtain a “hyper-graph”, which can efficiently abstract the topology, attributes, and other information included in the original graph; this benefits a plethora of graph applications. Traditional graph summarization approaches, such as greedy or random algorithms, are mostly based on the topology structure or on the abstraction of attributes, both of these algorithms share the same MDL (Minimum Description Length) principle [9], but differ in their node-pair-choosing strategy. However, real-world graphs always have special characteristics, such as a small-world network [10], random network [11], or a power law distribution [12], which often leads to significant differences in the node importance; meanwhile, users expect to maximize the key information of the original graph with as few nodes as possible, especially for the analysis of visual graphs, such as Wikipedia’s opinion-editing network [13], heterogeneous RDF visualization [14,15], the financial risk network [16,17] and other graph applications [18,19].
In summary, these motivate the creation of novel techniques for graph contraction. This paper proposes a hierarchical parallel graph summarization approach that leverages the node importance factor and simultaneously avoids the low efficiency and incomprehensive summary dimension that exists in traditional graph summarization algorithms.
Firstly, the shortcomings of the traditional summarization algorithms are addressed by quantitative analysis and via a comparison of the importance metrics on the summary graph, which shows that these methods ignore some key information during the summarizing phase. Then, the importance factor is introduced to optimize the classic MDL-based edge cost model and is applied to a hierarchical parallel summarization abstraction to densely retain the important characteristics of key nodes in the summary results. The impact of the novel approach on the resultant average importance, performance, and accumulated errors is also compared and analyzed. Finally, we discuss several extensions to accelerate the proposed method.
The rest of the paper is organized as follows. Section 2 firstly introduces the related works on graph contraction, then describes the motivation for the research, the hierarchical parallel model, and the implementation of the algorithm, respectively. Section 3 provides the experiment evaluation, and Section 4 concludes this paper.

2. Materials and Methods

2.1. Related Work

The rapidly growing scale of graph data poses serious challenges to researchers. Some researchers mainly focus on the key characteristics of complex networks, such as small-world networks or scale-free properties, and address the node-mining and ranking algorithms, such as PageRank [20], k-shell [21], and betweenness centrality [22]. Other researchers group different importance metrics together, and propose a mixed degree decomposition (MDD) [23,24] method, which employs a hybrid approach that fully mixes different ranking algorithms.
Generally, efficient solutions for large-scale graph processing can be grouped into two categories: high computing capability and data reduction. Most computing capability approaches promote performance acceleration through distributed computing or parallel processing [25,26,27], which divides the huge original graph into multiple machines, and leverages the “think like a vertex + BSP (Bulk Synchronous Parallel)” style for parallelization. However, the prevalence of strongly connected nodes often leads to serious inter-node communication, often wasting a great quantity of expensive I/O resources. In the literature, Maiter [28] follows an asynchronous approach, which avoids redundant iterative computation, and can efficiently accelerate the processing operation based on a delta-accumulation model. Further, Kusum [29] combines both the parallelization and data reduction methods, presents a unified algorithm to make the graph reduction transformation efficient, and provides guaranteed approximation results for both structural and non-structural graphs. Meanwhile, the graph reduction approach aims to simplify the large graph to an appropriate scale. A representative data reduction technique is graph compression [8,30], which makes space savings based on special applications. For example, web pages are mostly characterized by a lexicographical order, while social network graphs often behave sparsely and have a power law distribution. However, these lossless or lossy compression results only focus on compact storage, without retaining the key features of the original graph.
Current graph summarization techniques aim at condensing graphs, both in terms of their structure and attributes. Liu [5] categorizes graph summarization algorithms into two classes: static and dynamic. Static graph summarization algorithms operate summaries on plain graphs and labeled graphs [31], while dynamic graph summarization algorithms mainly study the classification and influence of diffusion on dynamic networks. Mahdi [32] introduced G-SCIS, a graph-summarizing method that is based on the clique and independent set decomposition, and a scalable lossy graph-summarizing algorithm, called T-BUDS, which is based on a Maximum Spanning Tree (MST); however, these decomposition-based approaches are more frequently applied to certain graph query scenarios. Kang [33] proposed PEGASUS, a personalized and linear time complexity summarization algorithm, aiming to both generate the connection relationship of the summary graph using given target nodes, and also maintain the additional overhead for personalized error computation. Zhou [34] introduced a degree-preserving graph abstract model (DPGS) that optimized the minimum description length based on the characteristics of graph degree abstraction; however, degree-centered approaches may also result in the loss of other important graph features. A fast and scalable algorithm (LDME) was proposed by Yong [35]; this algorithm reduces the merging cost by using weighted and locality-sensitive hashing, and provides node-compression functionality, but the choosing strategy based on locality-sensitive hashing may also lead to potential accuracy problems. Slugger [36] proposes a scalable lossless hierarchical summarization approach, which maintains and exploits the hierarchy of the original node, and also accelerates the process by sampling, approximation, and memorization; however, the encoding operation of the edges after each merging and the completion of additional pruning steps also degrade the performance.
Some researchers focus on stream graph summarization algorithms. These methods often prefer hash-based methods to distribute graph representations evenly in the matrixes. MoSSo [37] provides an incremental and lossless summarization method by moving sub-nodes between super-nodes to update summary graphs and correction edge sets; however, the overhead on similar neighborhood searching also slows down the performance, and it thus barely meets the high dynamic updating demand. Graph Stream Sketch (GSS) [38] is a dynamic graph summarization framework that is based on the traditional TCM model [6], which applies to high-speed graph stream scenarios with a linear time overhead; however, the snapshots of graph sketches also lead to lossy query efficiency.
In conclusion, these summarization techniques all face a series of problems, particularly in terms of their large scale, data heterogeneity (attributes, time series), and lack of ability to target specific scenarios. This paper proposes a hierarchical parallel graph summarization approach that is based on the nodes’ importance factor, which retains the key important features in the contraction phase, and avoids the low-efficiency process in large graph applications, such as visual analysis or calculations.

2.2. Problem Statement

Traditional graph summarization algorithms [9] mostly concentrate on minimizing the edge storage overhead, and aggregate nodes into “super-nodes” that are recursively based on a two-hop candidate strategy; they also lack the ability to consider the essential factors of the graph, especially in some special distributions. As a result, the traditional algorithms often lead to the early merging of partial important vertices and miss the key information.
Figure 1 describes the four-step execution of the sample graph on the random algorithm, which only follows the random candidates and the maximum edge-cost-saving strategy, and ignores the characteristics of key nodes. Here, we have utilized the eigenvector centrality to measure the significance of each node in the sample graph. Eigenvector centrality (https://en.wikipedia.org/wiki/Eigenvector_centrality (accessed on 15 September 2022)) reflects the contributions of connections, and the more important the nodes that are connected with the node are, the higher the eigenvector value of the node is. As a metric for assessing a node’s influence on a network, eigenvector centrality considers not only its degree, but also the significance of its neighboring nodes. As shown in Figure 1, I–IV are the process of graph summarization. Green nodes in the figure represent original nodes, and purple nodes represent super nodes. As shown in II, purple node 67 represents two original nodes 6 and 7 merged into one super node. C represents the correction set of summary graph. The average eigenvector value of nodes should generally increase with the deepening of graph compression. However, due to the concentration on minimizing the graph storage overhead, the average eigenvector value of the nodes irregularly changes in four steps.
Figure 2 describes the comparison of the importance metrics in the summary graph for both greedy and random algorithm execution on the Ca-GrQc (https://snap.stanford.edu/data/ca-GrQc.html (accessed on 5 December 2022)) dataset. The eigenvector centrality value of the summary graph is chosen as the measure of importance metrics. Theoretically, the probability density distribution of the summary graph should mostly retain the key characteristics of higher regions and have a regular positive growth with the compression ratio. However, as the evaluation results show in Figure 2a, the greedy and random algorithm extracted little features of the key nodes, and the probability density distribution, represent less deviation from the original graph. Figure 2b shows the average node importance variation trends. Due to the lack of the importance factor, the algorithms exhibit irregular changes, which leads to a significant loss of node information.
Motivated by these analyses, this paper proposes a graph summarization algorithm that is based on ranking nodes, which follows a hierarchical parallel approach, and contracts the importance characteristics efficiently.

2.3. Hierarchical Parallel Model

Given a graph G = (V, E) and summary graph Gs = (Vs, Es), let V denote the vertices set, E denote the edges set, vs. denote the summary vertices set and Es denote the summary edges set. For ∀ vsVs, vs. is called a super-node, which represents a set of vertices of G. For ∀ esEs, es is referred to as a super-edge if the initiation node and destination node both belong to Vs.

2.3.1. Hybrid Weighted Importance

Generally, the node-ranking strategy depends on the application scenario. Here, we follow a hybrid weighted approach. Let Ii denote the metric, then I i = i = 0 n m i , j × w j , as shown in Equation (1), where mi,j denotes the jth importance metric of ith node and wj denotes the weight of the jth importance metric.
m 1,1 m 1,2 m 1 , n m n , 1 m n , n w 1 w n = I 1 I n .

2.3.2. Node Ranking Based Strategy

Inspired by the traditional MDL-style graph summarization method [9], this paper introduces node importance to balance the factor of importance information retainment and storage efficiency. The two-hop candidate node strategy in graph summarization can be uniformly expressed as follows:
p u , v = max α × s u , v + 1 α × 1 min I u , v , s u , v > 0 .
The s(u, v) denotes the edge cost reduction in the merging node pair (u, v), where I(u, v) is based on the importance results mentioned in the previous section, and denotes the importance factor of node pair (u, v) in the merging phase, and α denotes the proportion of two controllable factors. The purpose of Equation (2) is to choose the min(I(u, v)) strategy and merge nodes by importance priority. In addition, I u , v = I ( u ) I ( v ) , where can be customized based on special node-ranking scenarios.

2.3.3. Hierarchical Parallel Graph Summarization Abstraction

Given graph G = (V, E), then hierarchical parallel graph summarization can be abstracted as two phases: (1) the parallel intra-partitions graph summarization phase; and (2) the inter-partitions summary merging phase, as shown in Figure 3.
Let n denote the iteration number and mk denote the total partition number in the kth iteration. Assume that P i k   a n d   P j k denote different partition subgraphs in the kth iteration and I, j ∈ (0, mk). For P i k   a n d   P j k , there is G = P i k ∪…∪ P j k , P i k P j k = Ø. Let S denote the summary function of partition and let G s k denote the final summary graph in the kth iteration, then the hierarchical parallel summarization model can be denoted as (3). For ∀ (u, v) ∈ S ( P i k ) , there is u, v P i k . The hierarchical merging phase follows a pairwise strategy based on the greedy principle and maximizes the reduction in edges across partitions.
G s k = i , j ( 0 , m k ) k ( S ( P i k ) S ( P j k ) ) .
Let e P i k and e P j k denote the accumulated errors in the parallel summarization of partition P i k and P j k , because the merging phase only occurs inside the partition, then the sum error of partition P i k and P j k after merging can be defined as T i , j k = e P i k + e P j k , and the total accumulated errors in the kth iteration after merging can be defined as follows:
T k = i = 1 m e P i k .

2.3.4. Performance Complexity Analysis

For graph G, let T denote the total time complexity; then, the summarization mainly contains two phases: (1) parallel intra-partition summarization: (2) inter-partition summary merging.
Let p denote the partition numbers in the first iteration; then, the total iteration number is log 2 p , and S k denotes the total time complexity in the kth iteration, d denotes the average number of neighbors in graph G, and V i k and E i k denote the number of vertices and edges set at the ith partition in the kth iteration. Assume that the probability of neighbors for each node that is assigned to other partitions is s (s ∈ [0, 1]), then the average neighbor number of each node in the same partition is d × (1 − s). Since the main cost in the summary is the two-hop neighbor matching, the time complexity of parallel summarization in the kth iteration is as follows:
S k = max i ( 0 , m ) d × ( 1 s ) 2 × | V i k | .
The main computation during the partitions merging involves calculating the number of edges across the partition. Let Mk denote the time complexity of partitions merging in the kth iteration, then Mk is as follows:
M k = max i ( 0 , m ) { | V i k | + | E i k | } .
Overall, the total time complexity T is as follows:
T = k = 1 l o g 2 p S k + M k = k = 1 l o g 2 p max m d × ( 1 s ) 2 × | V i k | + { | V i k | + | E i k | } .
Assume that the number of nodes and edges in each partition are uniformly distributed, then the average V i k and E i k in the kth iteration can be derived as V i k = | V | 2 log p k and E i k = | E | 2 log p k , respectively. Then, the average time complexity of HRNS can be derived as follows:
T = 1 2 log p k × k = 1 log 2 p d × 1 s 2 × V + V + E .

2.4. Method Implementation

The RHNS implementation is shown in Figure 4, the blue dots in the figure represent the merged super nodes, and the black dots represent the original nodes. The RNHS is constructed in two phases: 1. Hybrid importance metric generation; 2. Parallel graph summarization execution.
Step1: This phase firstly performs node importance ranking, then applies weighted sums for normalized ranking results. The pseudocode is shown in Algorithm 1.
Algorithm 1 Hybrid Weighted Nodes Importance Ranking
  • Input: Graph G
  • Output: Final sequence of weighted sums for node importance
    /* Let Vg denote the nodes of G, Is* denote the set of the node’s importance with different metrics, and Sr denote the final weighted and sorted ranking results. The algorithm uses parallel calculation for three different weighted node importance policies, as examples. */
  • ThreadPool.start();
  • Is1 = satrtThread1(Vg, Pagerank); /* Importance metrics based on PageRank */
  • Is2 = satrtThread1(Vg, ClusteringCoefficient); /* Importance metrics based on Clus- teringCoefficient */
  • Is3 = satrtThread1(Vg, EigenvectorCentrality); /* Importance metrics based on EigenvectorCentrality */
  • ThreadPool.stop();
  • avgResults = Normalized_weighted(Is1, Is2, Is3); /* Normalize and weighted sums. */
  • Sr = Rank (avgResults);            /* Sort the ranking results */
  • Ouput Sr
Step 2: Based on the prior results, the second phase performs hierarchical parallel summarization, as described in Algorithm 2, and comprises two sub-phases:
  • Initialization
The original graph is divided into multiple partitions, and each partition adds the candidate pairs into the max heap in parallel.
  • Parallel summarization
Each partition owns a max heap and performs the following steps when the heap is not empty: (1) Each partition updates its own super-nodes set vs. and super-edges set Es in parallel; (2) Based on the importance strategy of Equation (2), each partition picks a candidate node and pushes it into its own max heap; (3) The partitions are merged in pairs based on a “maximizing edges across the partitions” strategy; (4) The summarization continues iteration until the compression ratio reaches the boundary threshold.
Moreover, HRNS retains a configurable interface for the importance merging strategy, is applied to different scenarios, such as union or accumulation, and follows the union strategy by default.
Algorithm 2 Hierarchical Parallel Graph Summarization
  • Input: Origin graph G
  • Output: Summary graph Gs
    /* Let G i k denote the origin ith partition in k iteration, G i k denote the ith partition after summary in k iteration, G s k denote the final merged summary graph in k iteration, and Hi denote the maxheap of the ith partition. */
  • H i = Ø ;    /* Parallel initialization */
  • (G1,…Gi) = graphPartition(G);  /* partition G */
  • ThreadPool.start();
  • for all Gi do  /* parallel execution */
  • for (node u : Gi)
    Su = all 2 hops neighbors set of u;
    for(node v : Su)
    p(u, v) = calCost(u, v);
    findMaxPair(p(u, v));
    end for
    insert max(u, v) to Hi
  • end for
  • end for
    /* Parallel Summarization */
  • while i > 1
  • for all G i k do
  •   while Hi != Ø && compression_ratio > threshold do
  •   p(u, v) = Hi.poll();  /* poll the smallest pair of Hi */
  •   w = uv; /* merge node pair(u, v) into new node w */
  •    V i k .update(u, v, w);  /* Update nodes and edges in current Gs */
  •    E i k .update(u, v, w);
  •   Sw = all 2 hops neighbors set of w;
  •   for (node m : Su) /* pick up the most appropriate 2 hops node m from w */
  •    p(w, m) = cal_Importance(w, m);
  •    findMaxPair(p(w, m));
  •   end for
  •   for (pair s: Hi)
  •    if (s.contains(m)) Hi.remove(s);  /* remove duplicate nodes */
  •   end for
  •   Hi.insert(p(w, m));
  •   end while
  • end for
  • for all G i k do
  • if ( m a x   ( G i k G j k ))  /* pairwise merging */
  •      G j k = G j k G j k
  • G s k = G i k ;
  • i = i/2;
  • end while
  • ThreadPool.stop();
  • Ouput Gs

3. Results and Discussion

3.1. Experimental Setup

The HRNS was implemented based on an open-source version of greedy summarization (https://github.com/mgiridhar/graph_summarization_for_query_evaluation (accessed on 2 November 2021)). The experiments were performed on a machine with 40xIntel Intel(R) Xeon(R) CPU E5-2450L (1.7 GHz, 10 cores), 132 GB RAM, and 3.7 TB hard disks, running CentOS release 7.5.1804 (64 bit). The HRNS sets 8 parallel threads by default. To compare these in different conditions, we also evaluated the sequential version of HRNS (noted as SRNS). Moreover, we implemented the greedy and random summarization algorithms [9], and followed the classic metis graph partition algorithm [39] to minimize the overhead and error loss across partitions. The metis version used was gpMetis 5.1.0. The node’s importance ranking is composed of four widely used graph metrics, which are Pagerank, Clustering Coefficient, Degree Centrality, and Eigenvector Centrality, respectively.
Table 1 lists the open-source graph datasets. The evaluation chooses both real and synthetic datasets, including different domains such as social networks, citation networks, and text links. The 2000-2 and 2500-2 include synthesized data that were obtained via the SNAP (https://snap.stanford.edu/snappy/index.html (accessed on 15 October 2022)) toolkit for UCforum (https://toreopsahl.com/datasets/#online_forum_network (accessed on 10 October 2022)) and Facebook (https://snap.stanford.edu/data/ego-Facebook.html (accessed on 18 September 2022)), which are both social networks, for Cora (https://linqs.org/datasets/#cora (accessed on 18 September 2022)), Ca-GrQc and Daily Kos (http://archive.ics.uci.edu/ml/datasets/Bag+of+Words (accessed on 17 March 2023)), which belong to the publication network, and for Bible (http://moreno.ss.uci.edu/data.html#names (accessed on 6 October 2022)) and Blogs (http://moreno.ss.uci.edu/data.html#blogs (accessed on 10 October 2022)), which are text networks. The sources of Wikipedia elections (http://snap.stanford.edu/data/wiki-Vote.html (accessed on 15 March 2023)), Wikipedia edits (jbo) (http://dumps.wikimedia.org/ (accessed on 17 March 2023)), Wikipedia edits (glk), and Wikipedia edits (nso) were all derived from Wikipedia. Wikipedia elections refers to a network of administrator elections. Wikipedia edits (jbo) represents an author network of the Lojban encyclopedia that is linked together by edit events. Additionally, Wikipedia edits (glk) and Wikipedia edits (nso) are hyperlink networks that showcase articles in the Gilaki and Northern Sotho languages, respectively. Reactome (http://www.reactome.org/pages/download-data/ (accessed on 16 March 2023)) is a Metabolic network.

3.2. Node Importance with Compression Ratio

Figure 5 shows the average changes in node importance with respect to the compression ratio; it is clear that the four node importance measures are equally distributed. Since the HRNS compresses the unimportant nodes first, the average importance extracted by the HRNS appears to be significantly higher than the greedy and random strategy, as the compression ratio rises. The node’s average importance in HRNS over six datasets ranges from 0.107 to 0.167, and is slightly lower than that in SRNS due to accumulated error in parallelization. It can be concluded that HRNS can efficiently summarize the vertices with high importance.

3.3. Node Importance Distribution
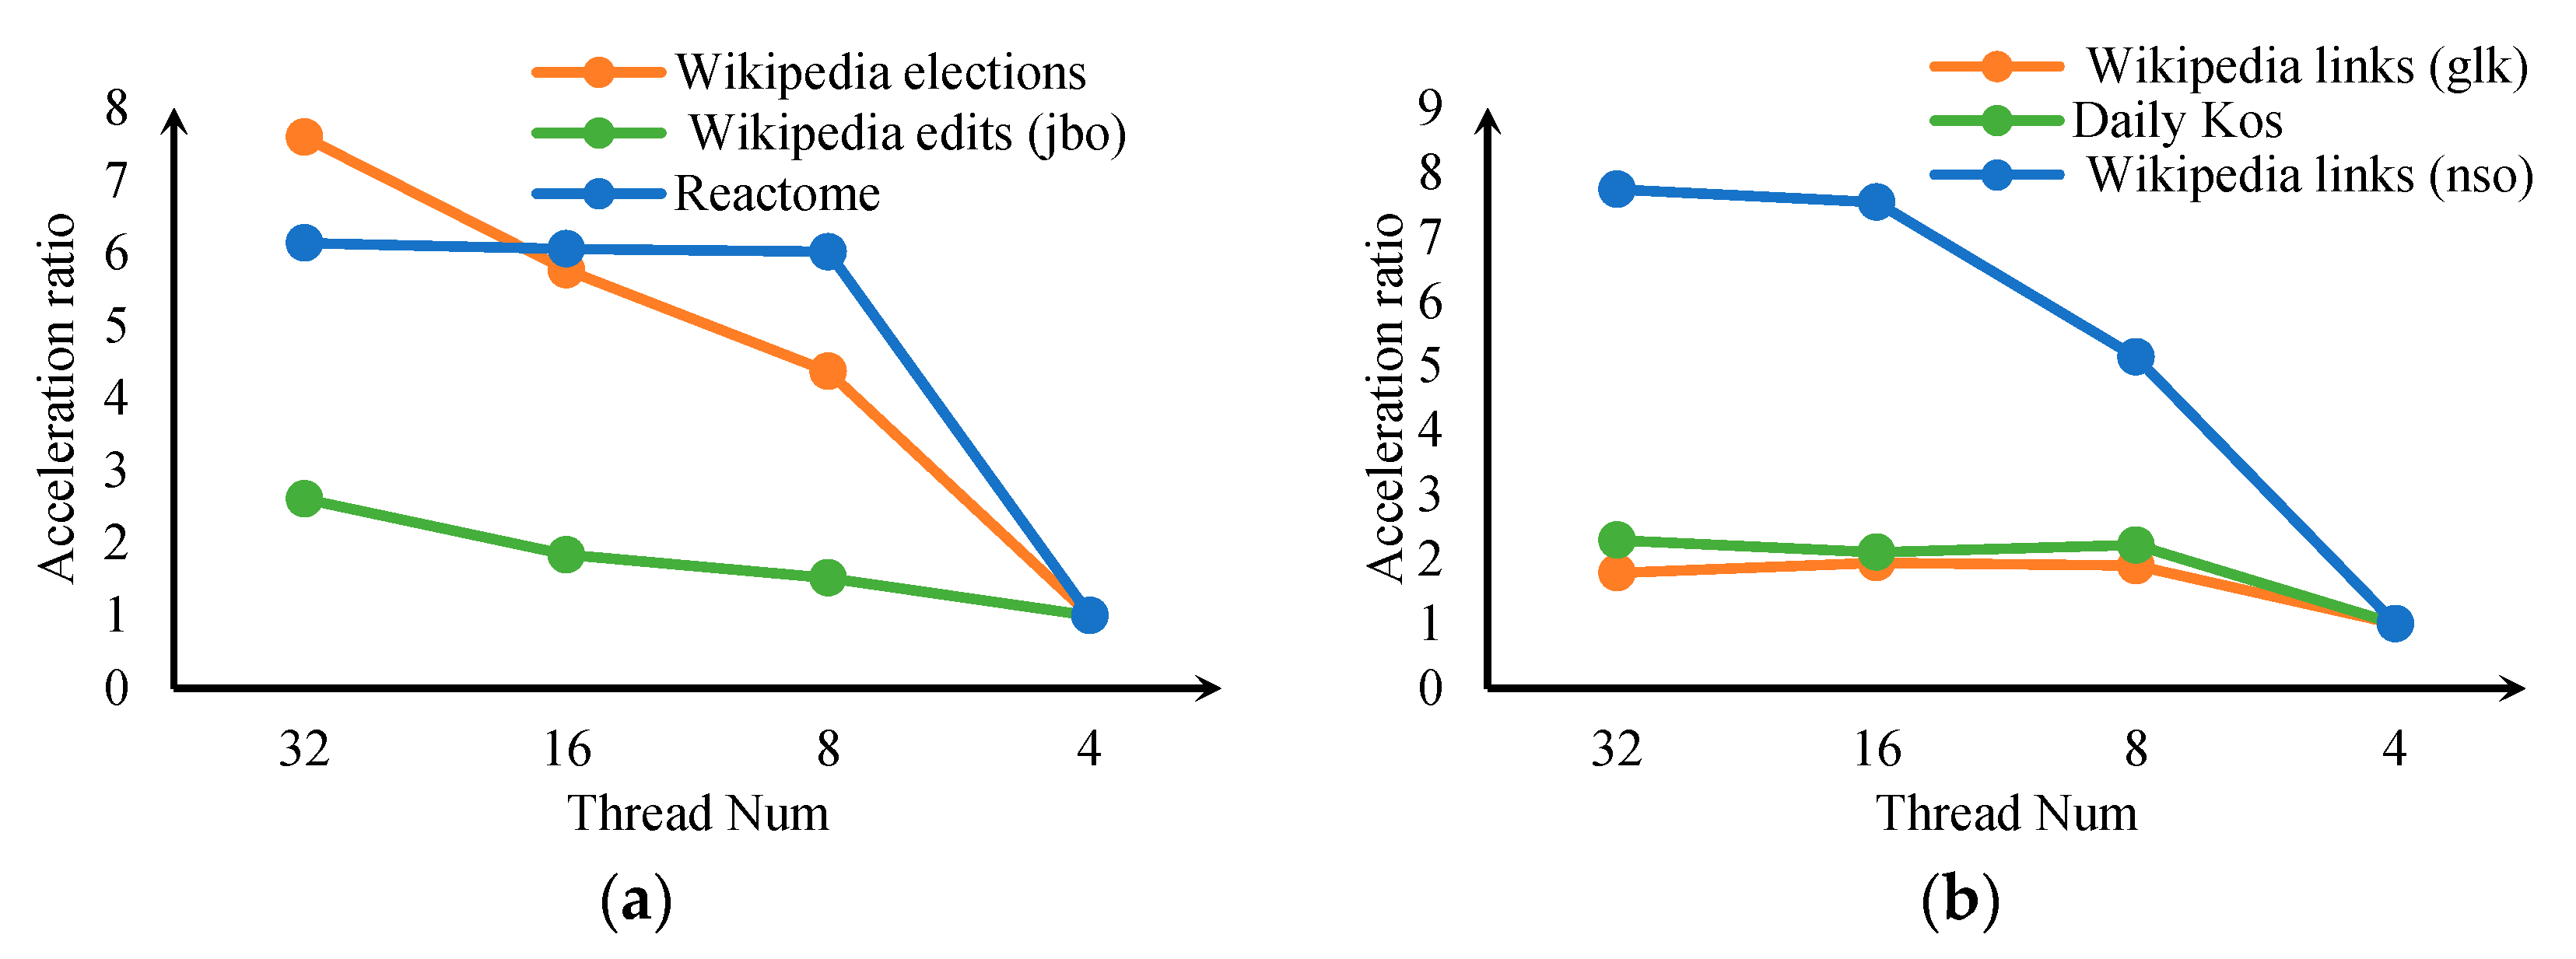
This section follows the metric of the probability density distribution of importance (PDDI) in different datasets. The probability density distribution is defined as a function that can interpret the relative likelihood between the sample and random variable value set.
Compared to traditional greedy and random algorithms, SRNS and HRNS exhibit a significantly higher importance probability density distribution, and the probability density is mainly concentrated in the higher regions (Figure 6). These results evidence that our algorithm prioritized merging nodes based on importance during summarization, and assigned higher importance to the new super-node. As a result, the final summary graph of HRNS creates a significantly higher importance distribution.
Moreover, the importance distributions in Figure 6c,e,f behave differently from Figure 6a,b,d. The reason for this is that merging the nodes redistributed the edge relationships of the original graph. As a result, the new super-node cut off all the edges in a certain iteration, so that no node could successfully match the merging conditions. Therefore, the importance stagnated at a certain value and could not be updated, especially when there was a large number of less important nodes; this led to the distribution of the summary graph behaving at medium importance. Overall, the results depend on the selected metrics and the importance distribution of the original graph.

3.4. Performance

The HRNS performance is evaluated by speedup, which is defined as the execution time ratio of HRNS in different parallel threads. As shown in Figure 7, due to the use of parallelized heap storage, which avoids the bottleneck of the sequential execution, most speedups show a significant rise as the number of parallel threads increases. The highest value was obtained for the Wikipedia elections and Wikipedia links (nso) datasets in 32 threads, reaching approximately 8× speedup for the 4 threads of parallel computing, due to highly cohesive division among partitions; meanwhile, the Wikipedia edits (jbo) and Wikipedia links (glk) datasets show relatively low speedup, due to low cohesive candidate nodes.

3.5. Graph Summary Error

The graph summary error ratio of HRNS is shown in Figure 8. As is shown, the overall summary error ratio grows as the compress ratio increases, and HRNS exhibits a relatively lower summary error ratio than the greedy and random algorithms in most datasets, and a slightly higher error ratio than SRNS. Due to the non-uniform division of edges across partitions, the results of HRNS in Figure 8a,b show higher accumulated error ratios.

3.6. Comparison of Multiple Node Importance Strategies

In this section, we evaluate the influence of HRNS using five ranking metrics on dataset 2000-2 (Figure 9a,b), UCforum (Figure 9c,d) and Wikipedia elections (Figure 9e,f). The HRNS-* shows that the ranking strategy is 100% weight and the HRNS-all curve shows the average weighted (0.25) summary results of four metrics.
As shown in Figure 9, we observe that the error rate and performance both rise, while the compression ratio increases in all five ranking strategies. The HRNS-all shows intermediate error rates and an intermediate execution time between the other four metrics, while the HRNS-cluster coefficient metric yields the highest error rate and longest response time in most cases; this is evidence of a worse importance distribution that leads to a longer traversal time in candidate node selection and a higher volume of accumulated errors. Inconclusion, the error rate and performance can be significantly affected by the distribution after hybrid importance sorting.

4. Conclusions and Future Work

This paper studied the current methods for graph summarization and presented HRNS, a hierarchical parallel graph summarization approach that is based on ranking nodes. The evaluation results show that HRNS can effectively contract the importance characteristic, and adopt a hierarchical parallel approach to accelerate the computation efficiency. In addition, the selection of the ranking strategy also has a significant impact on the evaluation results.
The main contributions of this paper are as follows:
  • This paper introduces the node importance factor into the traditional MDL-style graph summarization algorithms, so that users can trivially adapt new node-merging strategies based on special attributed scenarios.
  • This paper proposes a hierarchical parallel graph-contraction approach to improve execution efficiency.
  • Evaluation results on both real and simulated datasets show that HRNS can efficiently summarize vertices with average importance, and achieve significant performance gain with high speedups, as the sum error ratios are also relatively lower than the traditional algorithms.
However, some limitations also exist regarding the implementation of HRNS; for example, extensions on the parallel graph computing framework and the node/edge attribute factors are lacking. In the future, we plan to incorporate this work into different distributed graph frameworks (synchronous or asynchronous), such as Giraph or GraphX [40], to furtherly optimize the scalability and performance of the method.

Author Contributions

Conceptualization, Q.L.; methodology, Q.L. and J.W.; validation, H.L.; formal analysis, Q.L. and J.W.; investigation, Q.L.; data curation, J.W.; writing—original draft preparation, Q.L. and J.W.; writing—review and editing, Q.L. and J.W.; supervision, Y.J.; funding acquisition, Q.L. and Y.J. All authors have read and agreed to the published version of the manuscript.

Funding

This research was funded by the National Natural Science Foundation of China (No. 61902194), NUPTSF (No. NY219132), Innovative and Entrepreneurial Talents Projects of Jiangsu province, Postgraduate Research and Practice Innovation Program of Jiangsu Province (KYCX22_1024), the Natural Science Foundation of Jiangsu Province (Higher Education Institutions) (19KJB520046, BK20170900, and 20KJA520001), the Jiangsu Planned Projects for Postdoctoral Research Funds (No. 2019K024), the Postgraduate Research and Practice Innovation Program of Jiangsu Province (KYCX19_0921, KYCX19_0906), the Open Research Project of Zhejiang Lab (2021KF0AB05).

Institutional Review Board Statement

Not applicable.

Informed Consent Statement

Not applicable.

Data Availability Statement

All data of this research are available by contact from the corresponding author.

Conflicts of Interest

The authors declare no conflict of interest.

References

  1. China Internet Network Information Center. The 49th Statistical Report on China’s Internet Development. Available online: https://www.cnnic.com.cn/ (accessed on 24 April 2022).
  2. Shin, K.; Ghoting, A.; Kim, M.; Raghavan, H. SWeG: Lossless and Lossy Summarization of Web-Scale Graphs. In Proceedings of the World Wide Web Conference, San Francisco, CA, USA, 13–17 May 2019; pp. 1679–1690. [Google Scholar] [CrossRef]
  3. Lee, K.; Jo, H.; Ko, J.; Lim, S.; Shin, K. Ssumm: Sparse summarization of massive graphs. In Proceedings of the 26th ACM SIGKDD International Conference on Knowledge Discovery & Data Mining, Virtual Events, CA, USA, 6–10 July 2020; pp. 144–154. [Google Scholar]
  4. Dixon, S. Number of Monthly Active Facebook Users Worldwide as of 1st Quarter 2022 (In Millions). Available online: https://www.statista.com (accessed on 28 April 2022).
  5. Liu, Y.; Safavi, T.; Dighe, A.; Koutra, D. Graph summarization methods and applications: A survey. ACM Comput. Surv. (CSUR) 2018, 51, 1–34. [Google Scholar] [CrossRef]
  6. Tang, N.; Chen, Q.; Mitra, P. Graph stream summarization: From big bang to big crunch. In Proceedings of the 2016 International Conference on Management of Data, San Francisco, CA, USA, 26 June–1 July 2016; pp. 1481–1496. [Google Scholar]
  7. Petr, C. Community detection in node-attributed social networks: A survey. Comput. Sci. Rev. 2020, 37, 100286. [Google Scholar]
  8. Besta, M.; Hoefler, T. Survey and taxonomy of lossless graph compression and space-efficient graph representations. arXiv 2018, arXiv:1806.01799. [Google Scholar]
  9. Navlakha, S.; Rastogi, R.; Shrivastava, N. Graph summarization with bounded error. In Proceedings of the 2008 ACM SIGMOD International Conference on Management of Data, Vancouver, BC, Canada, 9–12 June 2008; pp. 419–432. [Google Scholar]
  10. Watts, D.J.; Strogatz, S.H. Collective dynamics of ‘small-world’ networks. Nature 1998, 393, 440–442. [Google Scholar] [CrossRef] [PubMed]
  11. Barabási, A.L.; Albert, R. Emergence of scaling in random networks. Science 1999, 286, 509–512. [Google Scholar] [CrossRef] [Green Version]
  12. Stumpf, M.P.; Wiuf, C.; May, R.M. Subnets of scale-free networks are not scale-free: Sampling properties of networks. Proc. Natl. Acad. Sci. USA 2005, 102, 4221–4224. [Google Scholar] [CrossRef] [Green Version]
  13. Koutra, D.; Kang, U.; Vreeken, J.; Faloutsos, C. Summarizing and understanding large graphs. Stat. Anal. Data Min. 2015, 8, 183–202. [Google Scholar] [CrossRef]
  14. Goasdoué, F.; Guzewicz, P.; Manolescu, I. RDF graph summarization for first-sight structure discovery. VLDB J. 2020, 29, 1191–1218. [Google Scholar] [CrossRef]
  15. Goasdoué, F.; Guzewicz, P.; Manolescu, I. Incremental structural summarization of RDF graphs. In Proceedings of the EDBT 2019—22nd International Conference on Extending Database Technology, Lisbon, Portugal, 26–29 March 2019. [Google Scholar]
  16. Samal, A.; Kumar, S.; Yadav, Y.; Chakraborti, A. Network-centric Indicators for Fragility in Global Financial Indices. Front. Phys. 2021, 8, 624373. [Google Scholar] [CrossRef]
  17. Tsankov, P. Overview of network-based methods for analyzing financial markets. Proc. Tech. Univ. Sofia 2021, 71, 1–7. [Google Scholar] [CrossRef]
  18. Xie, T.; Ma, Y.; Kang, J.; Tong, H.; Maciejewski, R. FairRankVis: A Visual Analytics Framework for Exploring Algorithmic Fairness in Graph Mining Models. IEEE Trans. Vis. Comput. Graph. 2021, 28, 368–377. [Google Scholar] [CrossRef] [PubMed]
  19. Song, H.; Dai, Z.; Xu, P.; Ren, L. Interactive Visual Pattern Search on Graph Data via Graph Representation Learning. IEEE Trans. Vis. Comput. Graph. 2021, 28, 335–345. [Google Scholar] [CrossRef]
  20. Brin, S.; Page, L. The anatomy of a large-scale hypertextual Web search engine. Comput. Netw. ISDN Syst. 1998, 30, 107–117. [Google Scholar] [CrossRef]
  21. Kitsak, M.; Gallos, L.; Havlin, S.; Liljeros, F.; Muchnik, L.; Stanley, H.E.; Makse, H.A. Identification of influential spreaders in complex networks. Nat. Phys. 2010, 6, 888–893. [Google Scholar] [CrossRef] [Green Version]
  22. Freeman, L.C. Centrality in social networks conceptual clarification. Soc. Netw. 1978, 1, 215–239. [Google Scholar] [CrossRef] [Green Version]
  23. Wang, J.; Li, C.; Xia, C. Improved centrality indicators to characterize the nodal spreading capability in complex networks. Appl. Math. Comput. 2018, 334, 388–400. [Google Scholar] [CrossRef]
  24. Maji, G.; Dutta, A.; Malta, M.C.; Sen, S. Identifying and ranking super spreaders in real world complex networks without influence overlap. Expert Syst. Appl. 2021, 179, 115061. [Google Scholar] [CrossRef]
  25. Malewicz, G.; Austern, M.H.; Bik, A.J.; Dehnert, J.C.; Horn, I.; Leiser, N.; Czajkowski, G. Pregel: A system for large-scale graph processing. In Proceedings of the 2010 ACM SIGMOD International Conference on Management of Data, Indianapolis, IN, USA, 6–10 June 2010; pp. 135–146. [Google Scholar]
  26. Liu, Y.; Wei, W.; Sun, A.; Miao, C. Distributed graph summarization. In Proceedings of the 23rd ACM International Conference on Conference on Information and Knowledge Management, Shanghai, China, 3–7 November 2014; pp. 799–808. [Google Scholar]
  27. Lin, W. Large-Scale Network Embedding in Apache Spark. In Proceedings of the 27th ACM SIGKDD Conference on Knowledge Discovery & Data Mining, Singapore, 14–18 August 2021; pp. 3271–3279. [Google Scholar]
  28. Zhang, Y.; Gao, Q.; Gao, L.; Wang, C. Maiter: An Asynchronous Graph Processing Framework for Delta-Based Accumulative Iterative Computation. IEEE Trans. Parallel Distrib. Syst. 2013, 25, 2091–2100. [Google Scholar] [CrossRef] [Green Version]
  29. Kusum, A.; Vora, K.; Gupta, R.; Neamtiu, I. Efficient processing of large graphs via input reduction. In Proceedings of the 25th ACM International Symposium on High-Performance Parallel and Distributed Computing, Kyoto, Japan, 31 May–4 June 2016; pp. 245–257. [Google Scholar]
  30. Stanley, N.; Kwitt, R.; Niethammer, M.; Mucha, P.J. Compressing Networks with Super Nodes. Sci. Rep. 2018, 8, 10892. [Google Scholar] [CrossRef] [Green Version]
  31. Ke, X.; Khan, A.; Bonchi, F. Multi-relation Graph Summarization. ACM Trans. Knowl. Discov. Data (TKDD) 2022, 16, 1–30. [Google Scholar] [CrossRef]
  32. Hajiabadi, M.; Singh, J.; Srinivasan, V.; Thomo, A. Graph Summarization with Controlled Utility Loss. In Proceedings of the 27th ACM SIGKDD Conference on Knowledge Discovery & Data Mining, Virtual Event, Singapore, 14–18 August 2021; pp. 536–546. [Google Scholar]
  33. Kang, S.; Lee, K.; Shin, K. Personalized Graph Summarization: Formulation, Scalable Algorithms, and Applications. arXiv 2022, arXiv:2203.14755. [Google Scholar]
  34. Zhou, H.; Liu, S.; Lee, K.; Shin, K.; Shen, H.; Cheng, X. DPGS: Degree-preserving graph summarization. In Proceedings of the 2021 SIAM International Conference on Data Mining (SDM), Virtual Event, 29 April–1 May 2021; pp. 280–288. [Google Scholar]
  35. Yong, Q.; Hajiabadi, M.; Srinivasan, V.; Thomo, A. Efficient graph summarization using weighted lsh at billion-scale. In Proceedings of the 2021 International Conference on Management of Data, Xi’an, China, 20–25 June 2021; pp. 2357–2365. [Google Scholar]
  36. Lee, K.; Ko, J.; Shin, K. Slugger: Lossless hierarchical summarization of massive graphs. In Proceedings of the 2022 IEEE 38th International Conference on Data Engineering (ICDE), IEEE, Kuala Lumpur, Malaysia, 9 May 2022; pp. 472–484. [Google Scholar]
  37. Ko, J.; Kook, Y.; Shin, K. Incremental lossless graph summarization. In Proceedings of the 26th ACM SIGKDD International Conference on Knowledge Discovery & Data Mining, Virtual Event, CA, USA, 6–10 July 2020; pp. 317–327. [Google Scholar]
  38. Gou, X.; Zou, L.; Zhao, C.; Yang, T. Graph Stream Sketch: Summarizing Graph Streams with High Speed and Accuracy. IEEE Trans. Knowl. Data Eng. 2022. early access. [Google Scholar] [CrossRef]
  39. LaSalle, D.; Patwary, M.M.A.; Satish, N.; Sundaram, N.; Dubey, P.; Karypis, G. Improving graph partitioning for modern graphs and architectures. In Proceedings of the 5th Workshop on Irregular Applications: Architectures and Algorithms, Austin, TX, USA, 15 November 2015; pp. 1–4. [Google Scholar]
  40. Gonzalez, J.E.; Xin, R.S.; Dave, A.; Crankshaw, D.; Franklin, M.J.; Stoica, I. GraphX: Graph Processing in a Distributed Dataflow Framework. In Proceedings of the 11th USENIX Symposium on Operating Systems Design and Implementation(OSDI), Berkeley, CA, USA, 6–8 October 2014; pp. 599–613. [Google Scholar]
Figure 1. Average node importance example in random summarization.
Applsci 13 04664 g001
Figure 2. Importance metrics of graph summarization. (a) Node importance probability density distribution of graph summary. (b) Average node importance with compression ratio.
Applsci 13 04664 g002
Figure 3. Hierarchical parallel graph summarization abstraction.
Applsci 13 04664 g003
Figure 4. HRNS implementation architecture.
Applsci 13 04664 g004
Figure 5. Average node importance as a function of compression ratio. (a) 2000-2 dataset. (b) 2500-2 dataset. (c) Blog dataset. (d) Cora dataset. (e) Ca-GrQc dataset. (f) UCforum dataset.
Applsci 13 04664 g005
Figure 6. Average node importance with compression ratio. (a) PDDI (2000-2). (b) PDDI (2500-2). (c) PDDI (blog). (d) PDDI (cora). (e) PDDI (Ca-GrQc). (f) PDDI (UCforum).
Applsci 13 04664 g006
Figure 7. HRNS speedup in different datasets. (a) Parallel acceleration ratio (Wikipedia and Reactome). (b) Parallel acceleration ratio (Wikipedia and Daily Kos).
Applsci 13 04664 g007
Figure 8. Graph summary error. (a) 2002-2 dataset. (b) 2500-2 dataset. (c) Blog dataset. (d) Cora dataset. (e) Ca-GrQc dataset. (f) Ucforum dataset.
Applsci 13 04664 g008aApplsci 13 04664 g008b
Figure 9. Graph summary error of different ranking strategies. (a) Summary error rate (2000-2 dataset). (b) Running time (2002-2 dataset). (c) Summary error rate (UCforum dataset). (d) Running time (UCforum dataset). (e) Summary error rate (Wikipedia elections dataset). (f) Running time (Wikipedia elections dataset).
Applsci 13 04664 g009aApplsci 13 04664 g009b
Table 1. The input graph datasets used in experiments.
Graph DatasetVerticesEdges
UC Irvine forum (UCforum)89914,038
Blogs122333,433
Facebook150037,206
Bible (names)177318,262
2000-2200010,962
2500-2250014,014
Cora270810,566
Ca-GrQc524214,496
Wikipedia edits (jbo)540388,756
Reactome6229292,320
Daily Kos6906699,498
Wikipedia elections7115201,386
Wikipedia links (glk)7332533,038
Wikipedia links (nso)8152589,970
Disclaimer/Publisher’s Note: The statements, opinions and data contained in all publications are solely those of the individual author(s) and contributor(s) and not of MDPI and/or the editor(s). MDPI and/or the editor(s) disclaim responsibility for any injury to people or property resulting from any ideas, methods, instructions or products referred to in the content.

