Article

Identification of Impact Frequency for Down-the-Hole Drills Using Motor Current Signature Analysis

1
Departamento de Ingeniería Eléctrica, Universidad Católica de la Santísima Concepción, Concepción 4090541, Chile
2
Facultad de Ingeniería, Universidad de Concepción, Concepción 4070386, Chile
3
Departamento de Electrónica, Universidad Técnica Federico Santa María, Valparaíso 2390123, Chile
4
Facultad Ciencias de la Ingeniería, Universidad Austral de Chile, Valdivia 5111187, Chile
*
Author to whom correspondence should be addressed.
Appl. Sci. 2023, 13(8), 4650; https://doi.org/10.3390/app13084650
Submission received: 14 February 2023 / Revised: 29 March 2023 / Accepted: 3 April 2023 / Published: 7 April 2023
(This article belongs to the Special Issue Structural Geology, Rock Mechanics and Their On-Site Testing Analysis)

Abstract

:
In rotary-percussion drilling, the impact frequency is a crucial variable that is closely linked to operational factors that determine the efficacy of the drilling process, such as the rate of penetration, bit wear, and rock mass characteristics. Typical identification methods rely on complex simulation models or the analysis of different sensor signals installed on specially adapted setups, which are difficult to be implemented in the field. This paper presents a novel study where the impact frequency is identified by motor current signature analysis (MCSA) applied to an induction motor driving a DTH drilling setup. The analysis of the case study begins with the definition of characteristic drilling stages where the pressure and sound signals allow the detection of an impact frequency of 14.10 Hz, which is then used as a reference to validate three MCSA identification approaches. As a result of the analysis, the envelope approach is the most robust for nearly real-time implementations considering its simplicity and range of coverage. Experimental results provide evidence about the feasibility of the proposed MCSA methods to be integrated into Measurement-While-Drilling (MWD) systems to improve drilling condition monitoring and rock mass characterization.

1. Introduction

Rotary-percussion drilling has been recognized as an efficient drilling method due to its capability to provide a higher rate of penetration (RoP) compared with the conventional rotary drill, especially for high compression strength rock formations composed of dolomite, limestone, sandstone, granite, etc. [1]. Among percussion drilling methods, Down-the-Hole (DTH) drilling is widely used in industrial applications such as mining, blast hole, tunneling, construction, geological exploration, and oil and gas production, among others [2,3,4]. Besides high RoP, DTH drilling provides operational and economic advantages, such as low power losses, accurate hole geometry, and reduced drill string stress [5].
One of the most important variables studied in percussion drilling, particularly in DTH drilling, is the impact frequency [6,7,8], defined as the number of impacts of the hammer bit over the drilling surface per unit of time. Numerical simulations reported in [9] suggest that a significant increase of RoP can be achieved by increasing the percussive frequency of pneumatic hammers. In [10], authors show simulations to confirm that increasing the impact frequency produces a significant improvement in the RoP but also highlight that high frequencies can also be detrimental to the service life of torsional impact drilling equipment. The impact frequency can also be ranked to establish performance thresholds depending on the characteristics of the equipment and drilling surface. The work in [11] shows that when impact frequency is lower than the threshold frequency, the detritus removal volume is reduced in the rock breaking process considering polycrystalline diamond drill bits.
The adequate operation ranges for the impact frequency vary depending on the mechanic properties of the drilling surface, drilling angle, and hammer type [12,13,14,15]. According to [16], DTH hammers usually operate with impact frequencies ranging from 10 to 28 Hz, generating high-frequency torsional impacts, which produce highly dynamic variations in the magnitude of bit torque. The work in [17] shows that as the hammer vertical deviation angle increases from 0° (vertical) to 90° (horizontal), the impact frequency of the pneumatic hammer decreases from 10.8 to 10 Hz, resulting in a reduction of the effective energy per blow of 22.5%. In [18], the authors report that the recommended impact frequency value will depend on different drilling conditions; thus, when considering a back rake angle of 55°, the best penetration performance is achieved for an impact frequency of 30 Hz, while under a crushing efficiency criterion, the recommendation is 50 Hz. Higher impact frequencies can be found in other types of drilling technologies. For instance, in [19], a sonic drill results in an impact frequency of 70 Hz while the hydraulic rock drill drifter analyzed in [20] can reach an impact frequency close to 75 Hz.
It is clear that regardless of the type of percussive drilling machine and bit technology, the impact frequency is a crucial variable to be monitored and analyzed for increasing drilling efficiency, stability, and tool life. Typical frequency identification methods rely on complex simulation models or signal analysis using measurements from different sensors (e.g., pressure, sound, strain) installed in specially adapted setups that are difficult to implement in field applications. For instance, the authors in [21] use the acoustic signal recorded by a microphone placed near the impacting system to obtain the experimental data of the impact frequency. In [17], the impact frequency is obtained by the statistical analysis of several waveforms monitored by the data acquisition system, including pressure transducers, photoelectric whirl measuring apparatus, laser rangefinder, and a sensor placed at the end of the rock sample that is capable of monitoring the force acting on the rock during impact. On the other hand, in [20], the impact frequency is obtained by the FFT analysis of signals captured from the strain gauge bridge, pressure sensor, and flow sensor after a wavelet transform for reducing noise and improving the resolution ratio in both time and frequency domains. Overall, the proposed frequency identification approaches are unattractive for deployment in conventional diesel-powered pneumatic or hydraulic drilling machines due to the requirement of installing, operating, and maintaining sensors that may not be readily available and must withstand extremely harsh operational environments.
There is currently a growing tendency towards incorporating electrical equipment at the different stages of mining. Replacing traditional diesel-powered equipment with electrical counterparts brings multiple benefits, such as reducing exhaust gases, fumes, and particulate matter that may be harmful to workers [22,23]. Analyses also show that electrifying the different stages of the mining process can potentially reduce operational costs [24]. The proliferation of electric trucks and loaders in mining facilities [25,26] is a concrete example of this tendency. Given this trend, it is reasonable to expect that diesel-based drives in current drilling machines will eventually be replaced with electrical drives. Moreover, using electrical motors in drilling machines will facilitate the deployment and adoption of advanced monitoring techniques currently used in other application domains. In particular, Motor Current Signature Analysis (MCSA) techniques reported and used in other application domains could be directly applied for condition monitoring and fault detection in drilling machines, including broken rotor bars [27,28], bearing damage [29,30], eccentricity [31,32], electrical stator faults [33,34], among others [35]. In addition, MCSA can also enable the development of new low-cost methods for monitoring the impact frequency in drilling applications, which have not been reported in the literature.
This paper proposes and evaluates three methods for estimating the impact frequency in a pneumatic DTH drill rig using measurements of the current in the three-phase induction motor that provides the rotational motion to the DTH hammer. The advantage of using motor current signals is that these signals are commonly monitored for safety, monitoring, and control purposes so that the frequency identification tasks can be implemented with already deployed equipment without further intervention or modifications to the drilling rig.
To evaluate the proposed MCSA approaches for impact frequency identification, we perform the following tasks: (i) we first use measurements of hammer pressure and sound signals to establish reference margins for the impact frequency of a DTH drilling rig while operating over a high-hardness rock specimen, and (ii) we then assess the accuracy of the estimated frequency obtained by applying three different functions to the measured motor current signals, including side bands, waterfall plots, and envelopes. The experimental evaluation shows that, for the considered case study, all the proposed MCSA methods enable the estimation of the impact frequency of the DTH drilling rig while operating over the rock sample. Moreover, the analysis permits establishing operational requirements for these techniques to be applied in practical scenarios. Considering the simplicity of the implementation, the results provide evidence of the practical utility of the proposed methods for promoting the adoption of this technology in field drilling operations.

2. Materials and Methods

This section provides an overview of the operating principle of the pneumatic DTH percussive drilling system and describes the components of the experimental setup used for the study. Moreover, the analysis of hammer pressure and audio signals during the drilling operation is presented, which provides a reference frame to define different drilling stages of interest and to validate the proposed identification approaches of impact frequency based on MCSA.

2.1. Principles of Percussion DTH Drilling

A pneumatic DTH hammer is driven by pressured air coming from an air compressor that provides the energy (by axial pressure) to move the percussion piston that hits the drill bit with a specific impact frequency and energy for rock breaking [5]. As seen in Figure 1, the compressed air also flows through the drill bit, performing hole cleaning by removing the detritus outside the drilled hole. In this study, the rotary torque is provided by an electric motor connected to a drill string by a gearbox to produce, together with the compressor, the rotary percussive drilling action over the rock specimen. As mentioned in Section 1, the incorporation of electric drives to replace traditional diesel equipment is a growing trend due to the multiple operational benefits that they incorporate into the different processes. Particularly, this study uses an induction motor powered by a variable frequency drive (VFD), considering both their wide use for industry application and the implementation of advanced monitoring techniques based on MCSA that are currently used for motor condition monitoring.

2.2. DTH Drilling Setup

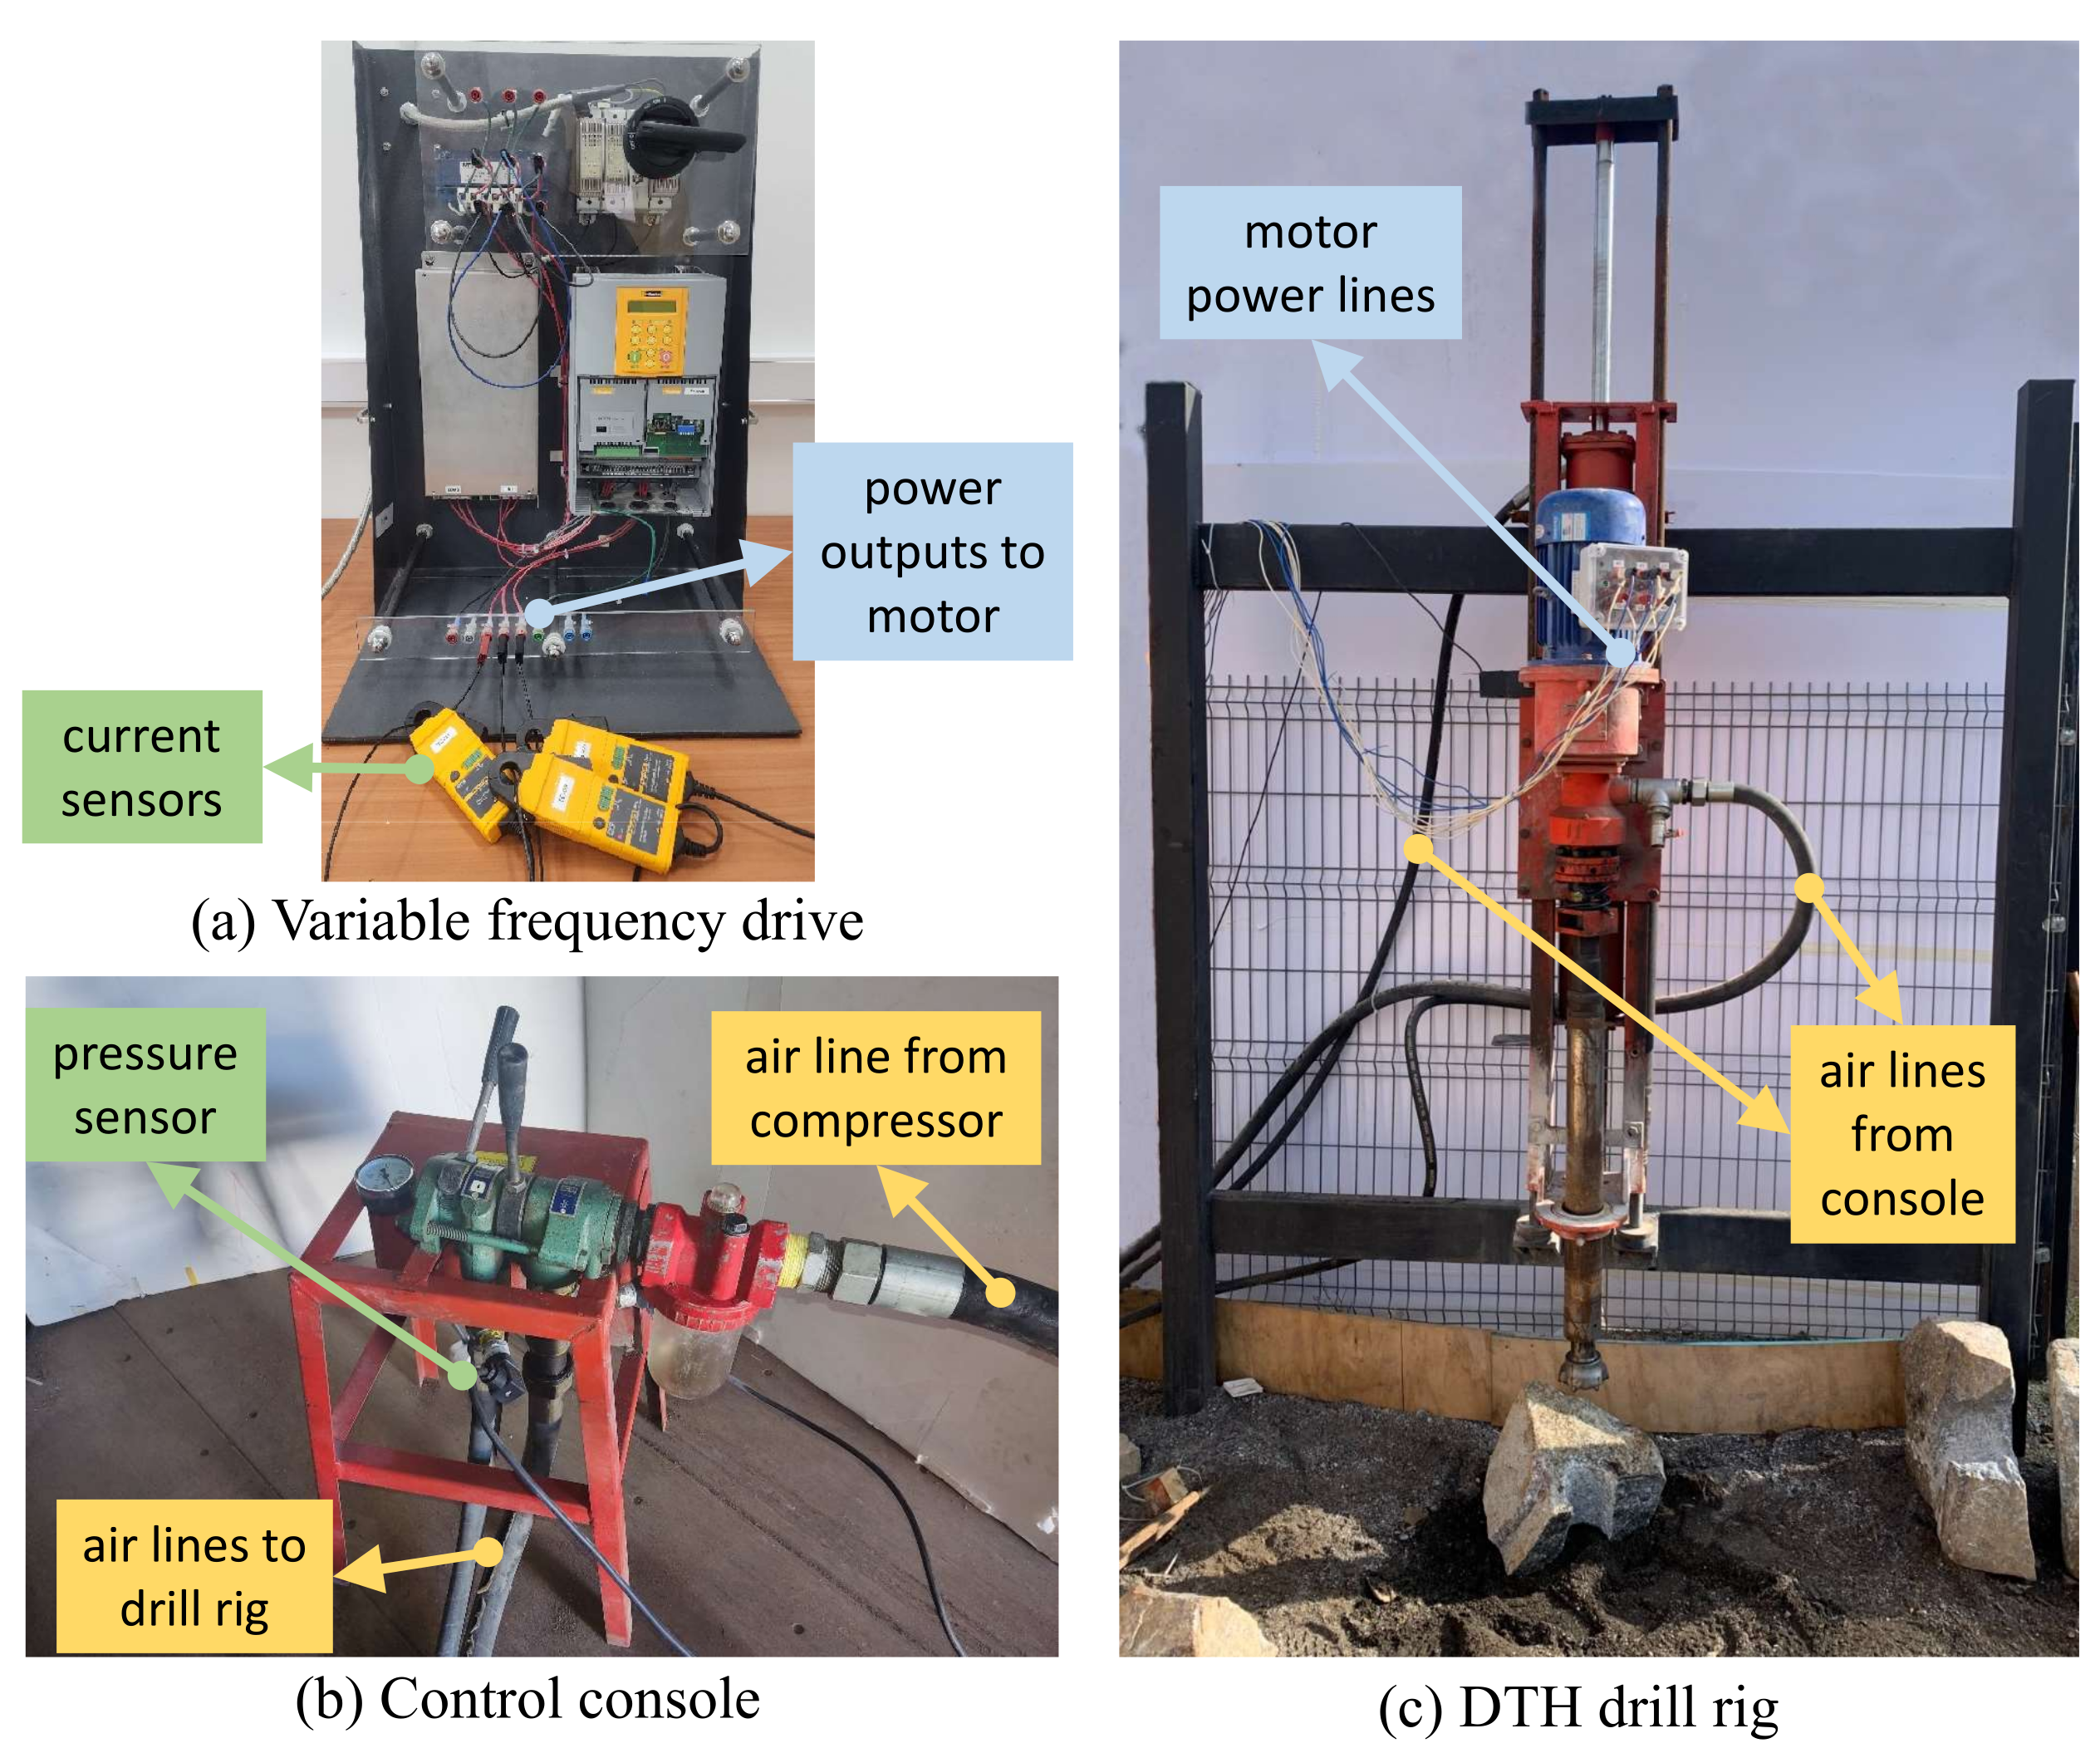
The experimental setup used in this research is composed of a pneumatic drill rig driven by a 4 kW, 380 V, 1440 rpm, 50 Hz induction motor as a primary rotary actuator that provides the required torque to the rotary bit through a gearbox. The pressured air from a 33 kW rotary screw compressor is distributed in the pneumatic control console to feed a DTH hammer for percussive action and detritus cleaning. The rated speed of the drilling tool bit is 90 rpm. For detailed technical specifications about these components, see [16]. Figure 2 shows the main components of the experimental setup and their interconnections, where the yellow arrows indicate the air pressure lines, the green arrows indicate the location of a pressure sensor for direct measurement of operating pressure, and the light blue arrows indicate the location of the power line outputs of the VFD and power lines on the drill motor connection box. Table 1 summarizes the relevant technical specifications of the current and pressure sensors used in this study to implement different techniques for estimating the impact frequency. It should be noted that three-phase motor currents signals are measured at the output of the VFD (not shown). All readings from the sensors are collected and processed in a dedicated data acquisition (DAQ) system (MicroLabBox processor [36]) with advanced processing capabilities that enable the implementation of the different MCSA algorithms proposed. The pressure and current sensor data analyzed in this paper are captured at a fixed sample frequency of 50 kHz, while the drilling machine rotates at rated speed.
Additionally, a Sony HDR-XR500V video camera recorder (not shown in the figures) is used to capture the environmental sound signal during the operation of the drilling rig with a sample rate of 48 kHz. The sound signal is analyzed independently of the other sensors and is used only as a confirmation method to validate the identified impact frequency using the hammer pressure signal.

2.3. Characterization of Drilling Stages

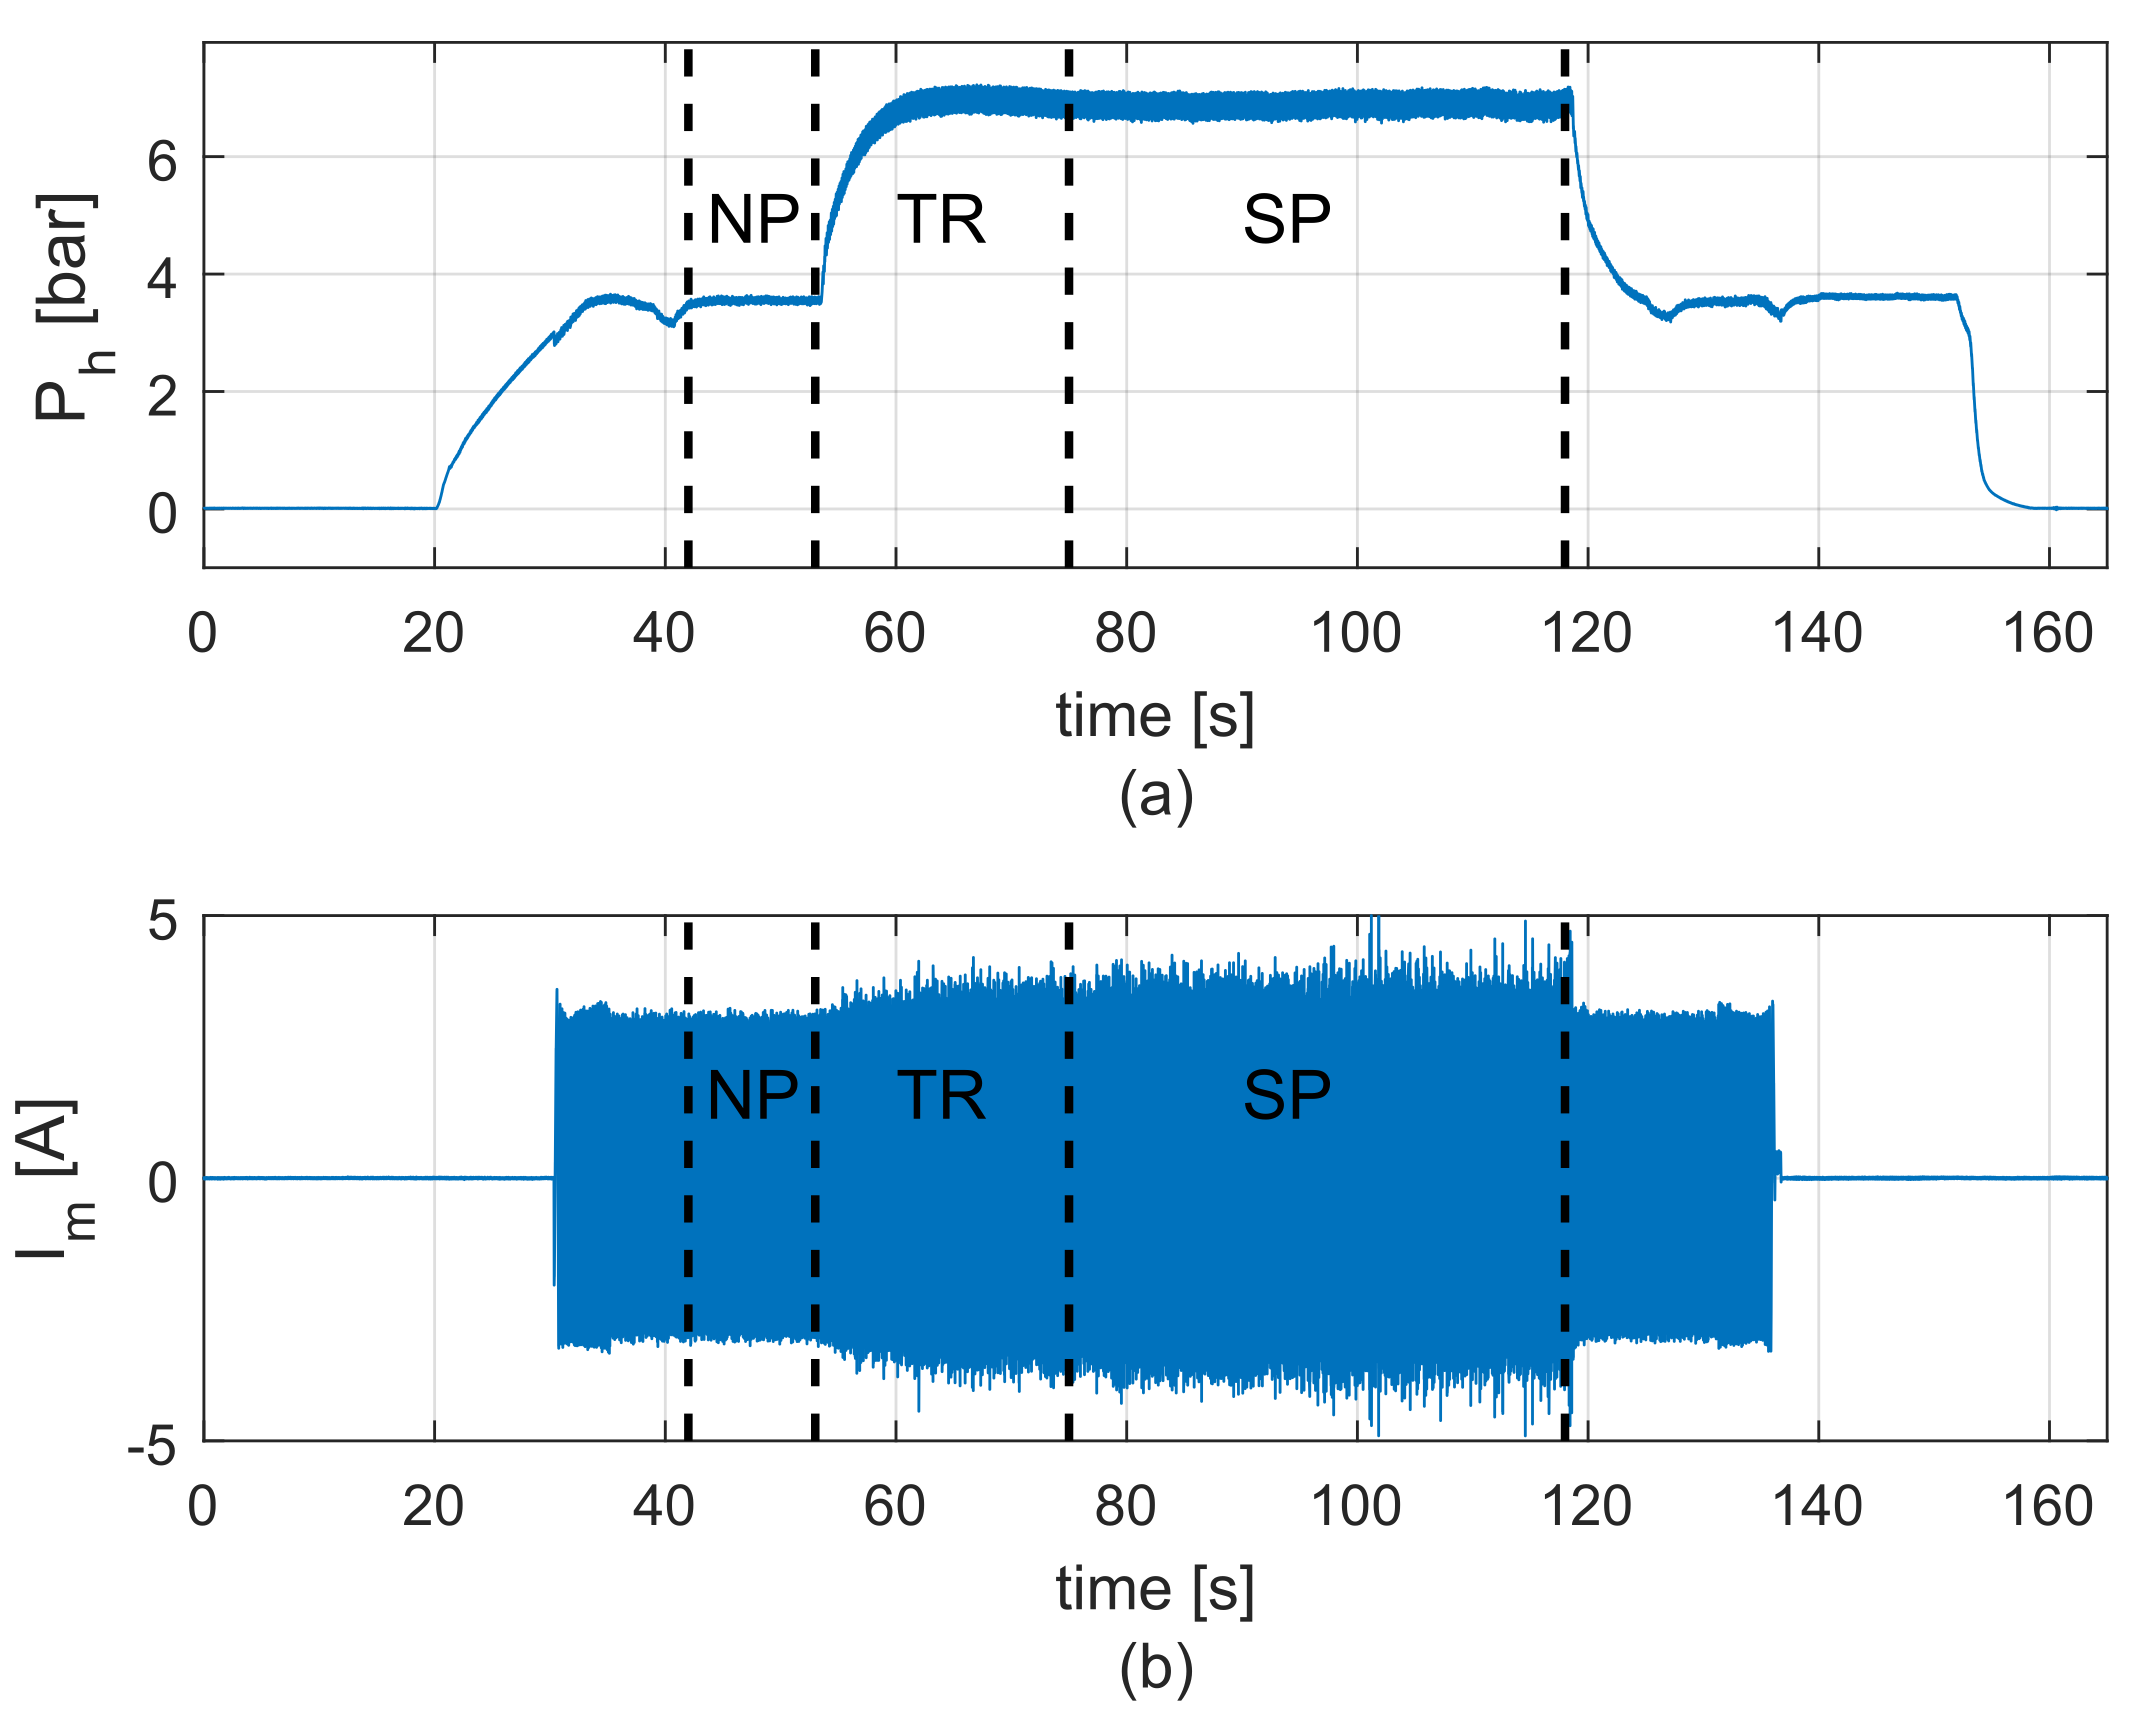
Before obtaining the impact frequency from current signal analysis, it is necessary to characterize the dynamic behavior of the pressure and current signals during the different stages of drilling. This characterization allows us to determine ranges of values associated with no percussive and stable percussive action of drilling over a sample rock specimen. For this study, the rock specimen is a high-hardness tonalite (granite) phaneritic crystalline formed by plagioclase (large crystals), quartz, biotite, and hornblende. The approximate dimensions of these testing samples are 300 mm × 700 mm × 400 mm (height × width × depth). Figure 3 shows the behavior of the hammer pressure (Ph) and motor current (Im) signals captured before and during the perforation of the rock sample, with the main stages of the drilling process separated with dashed vertical lines. In this experiment, the pressurized air was distributed to the DTH hammer pipes by the pneumatic console compressor at t = 20 s while the induction motor started 10 s later at t = 30 s.
The first stage, defined as no percussive (NP) operation, starts when Ph is stabilized around 3.6 bar while Im is kept stable, reaching peaks around 3.12 A. The current signal during the NP stage represents the no-load current, i.e., the magnetizing current required to set up magnetic flux inside the motor air gap. The second stage is called the transition (TR) stage and starts when the DTH hammer makes contact with the rock surface, showing the presence of oscillations in the hammer pressure and motor current due to the activation of hammer percussion. The P h signal shows an exponential increase in its magnitude as the drill bit gets deeper, to be stabilized around t = 75 s with a mean value of 6.9 bar. During the TR stage, the amplitude of the motor current increases until reaching peaks around 4.2 A. The third and last stage represents the drilling operation with stable percussion (SP), which starts once the hammer bit is entirely inside the rock specimen and ends at t = 118 s when the drill bit traverses the rock sample. During the SP stage, Ph shows a stable oscillation around the mean value of 6.9 bar, and the peak current oscillates between 2.6 and 4.2 A due to the DTH hammer percussion. After the drill bit traverses the rock, both hammer pressure and motor current signals rapidly decrease until the previous values observed for the NP stage are reached.

2.4. Identification of Impact Frequency Using Hammer Pressure and Sound Signals

To assess the effectiveness of the proposed MCSA techniques for impact frequency identification, we first need to establish reference values that can be compared with the ones obtained from the analysis of the motor currents. To this end, we independently analyze the hammer pressure and sound signals to determine and verify a reference value for the target impact frequency during the SP stage.
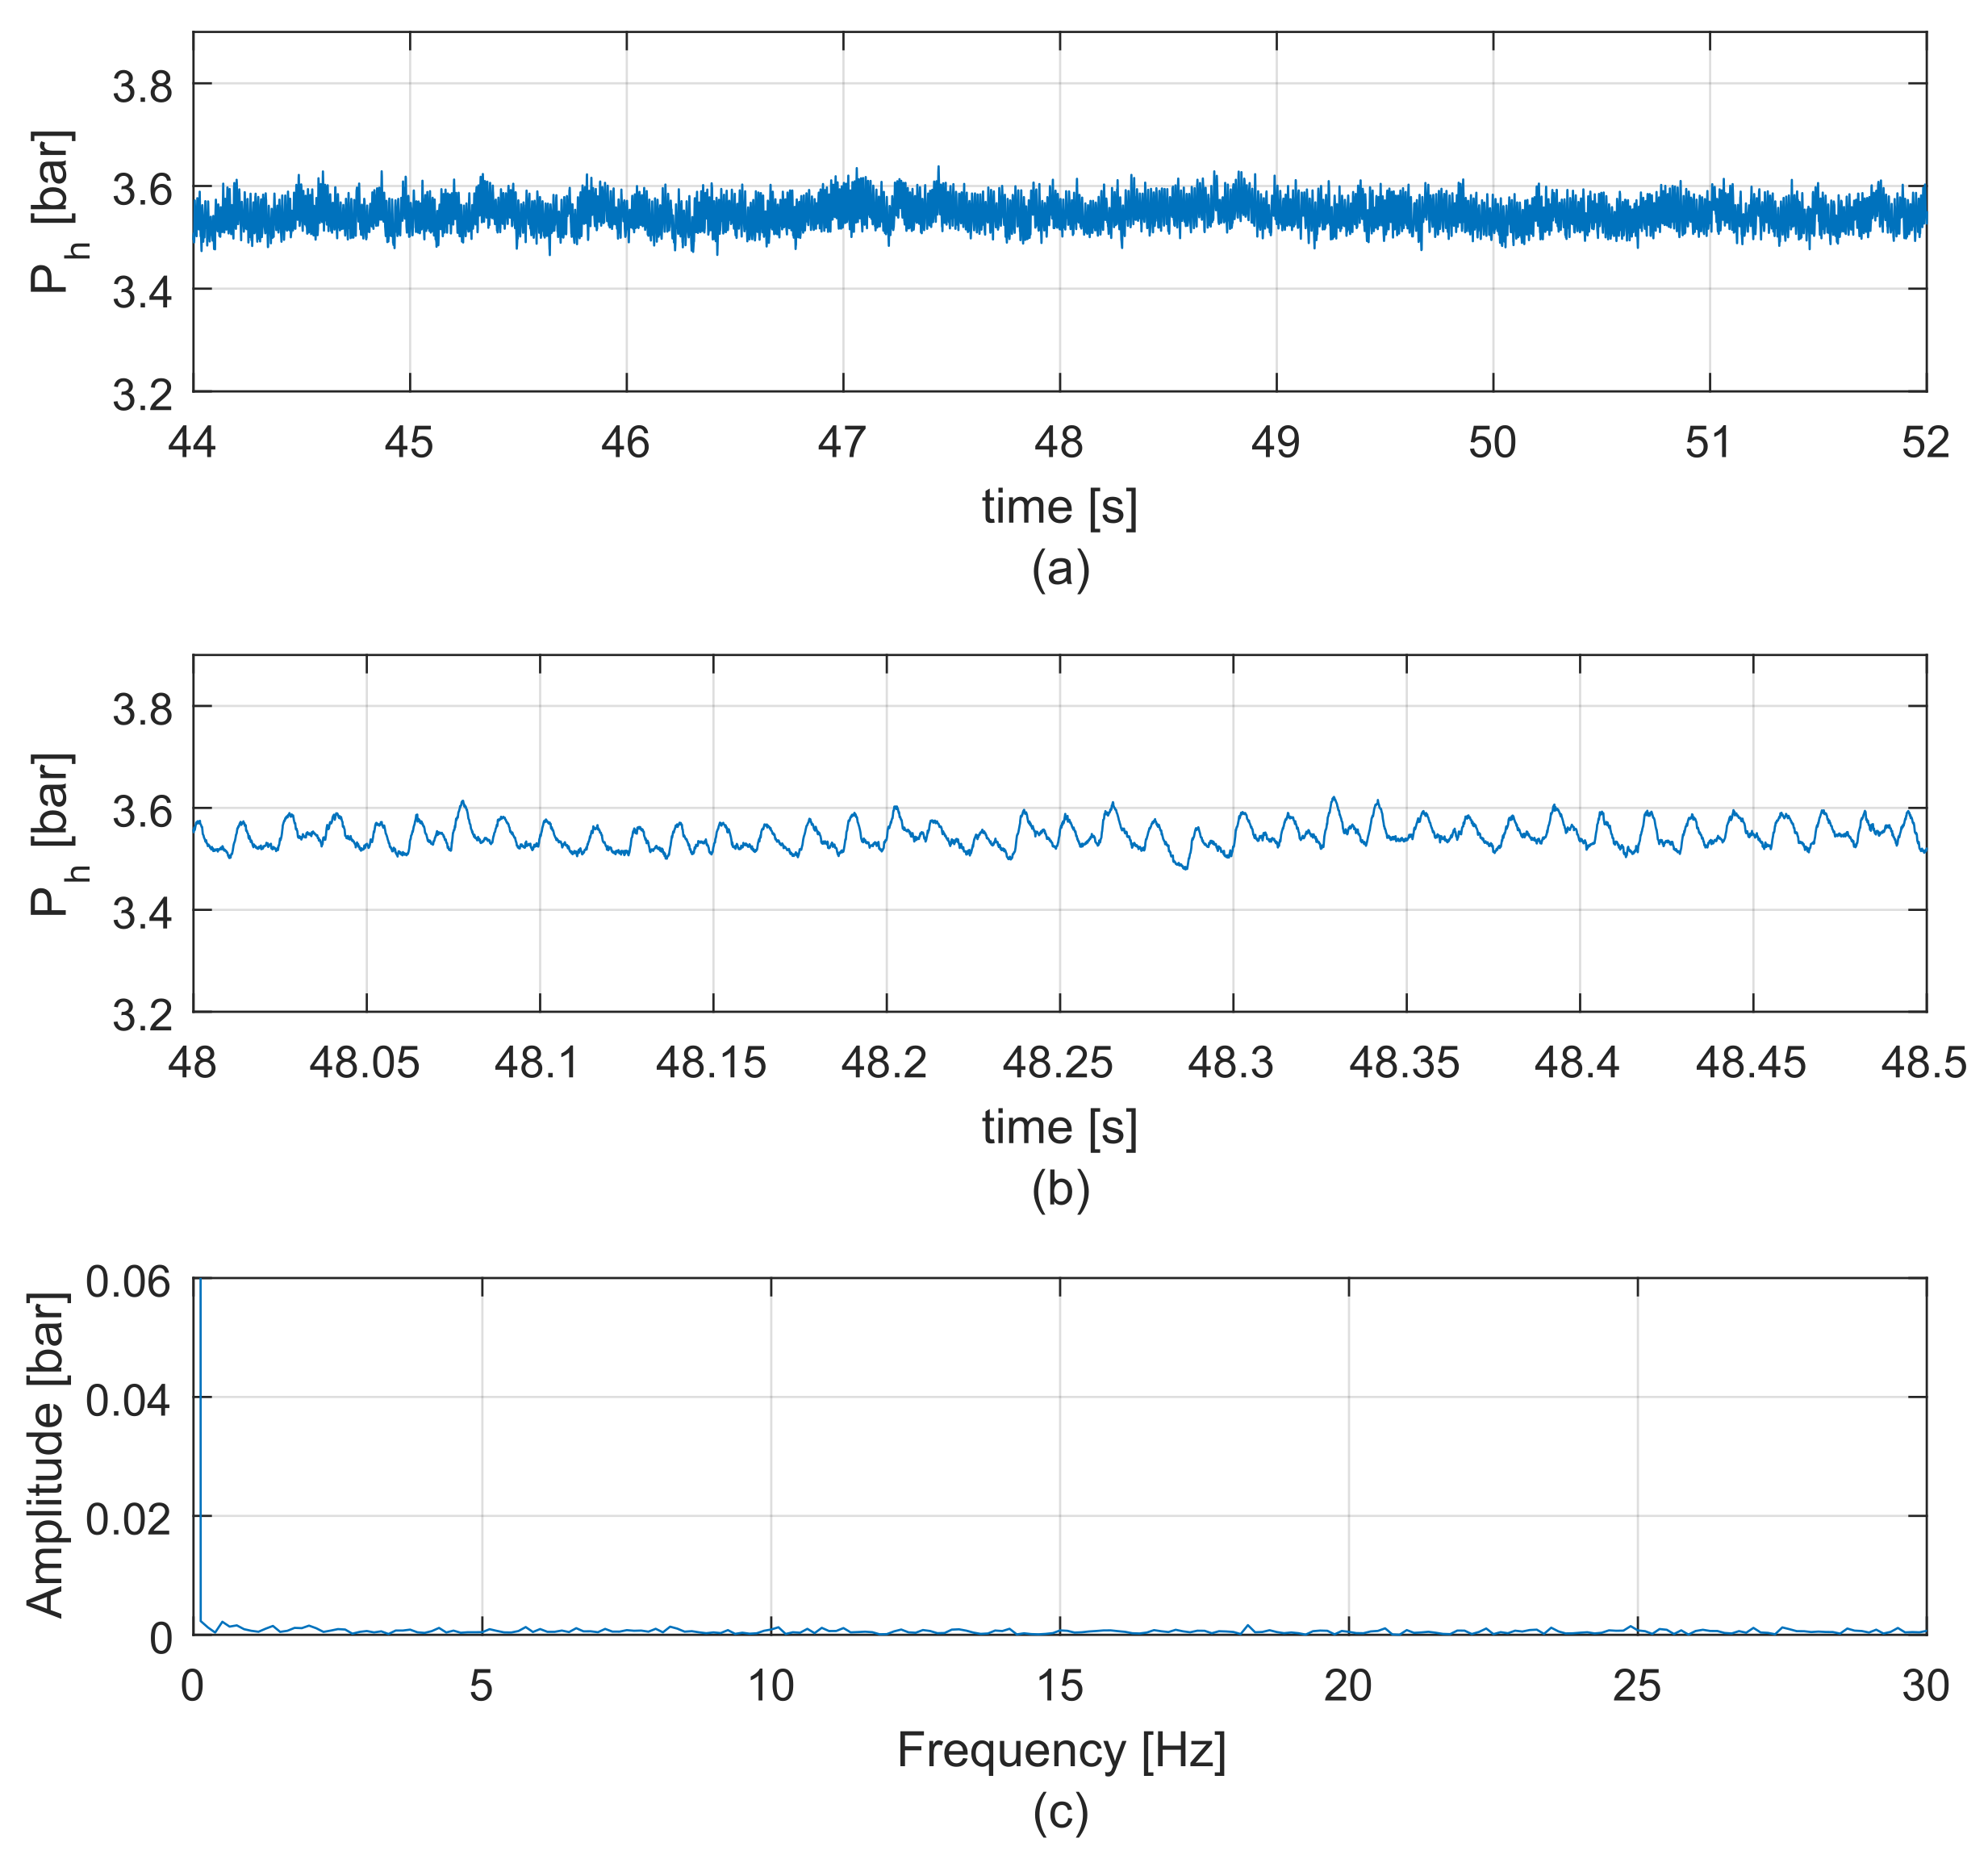
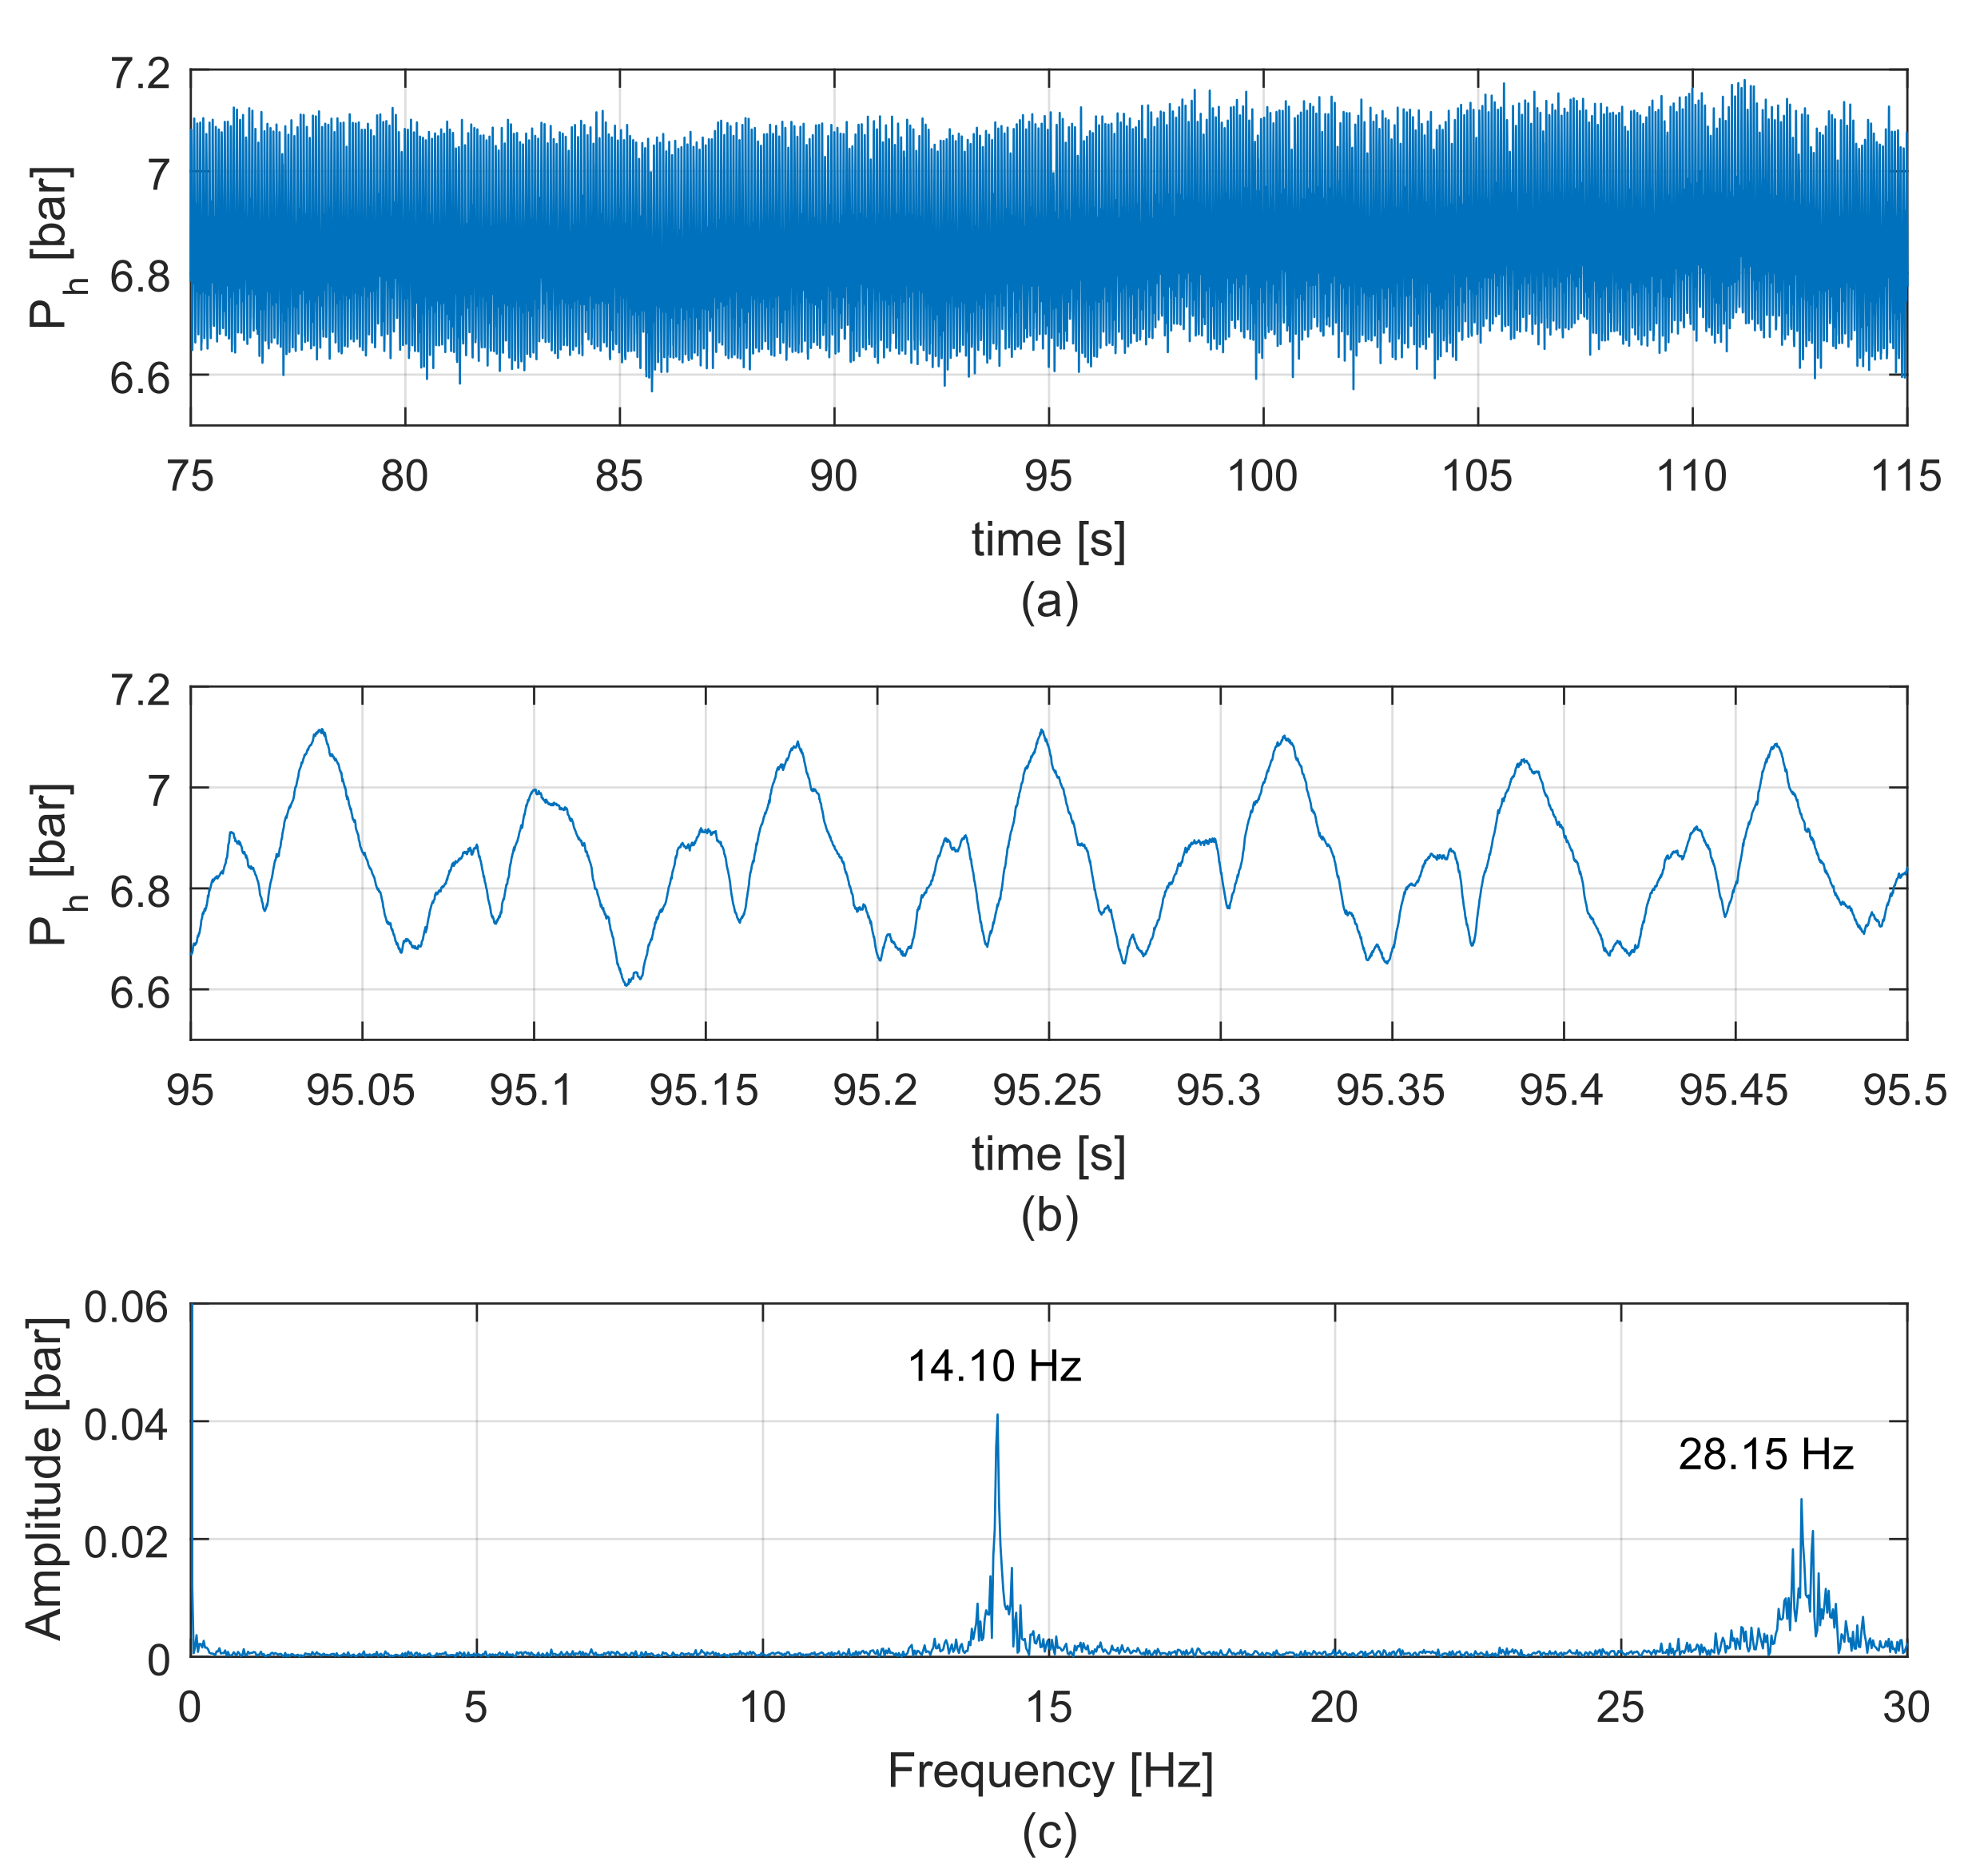
Figure 4 and Figure 5 show the time and frequency domain plots of Ph during the NP-stage and SP-stage, respectively. Figure 4a and its zoom in Figure 4b shows a stable pressure signal with a DC value around 3.55 bar. The frequency spectrum of this signal shown in Figure 4c confirms the absence of frequency components associated with percussive action. Conversely, Figure 5a,b show that significant oscillations in the Ph values appear during the SP stage. Figure 5c shows the frequency spectra, evidencing the appearance of one dominant frequency component at 14.10 Hz followed by a second harmonic frequency at 28.15 Hz. Considering that the rest of the harmonic content only shows multiples of the dominant component (the impact frequency in this case), the frequency spectra in the figures are limited to 30 Hz.
It should be noted that the DC component in the Ph signal appears in the spectra (for frequency equal to zero); however, this DC component is irrelevant for the analysis, and it is only included to keep consistency with the plotted signal in the time domain and could be suppressed by subtracting the mean value to the raw reading of the sensor.
The sound signal captured with the video recorder is used to confirm the impact frequency found by analyzing the hammer pressure signal. In this case, the sound signal is not synchronized with the rest of the sensors in the setup, and we delimit the different drilling stages by the visual inspection of the video feed. Figure 6 plots the spectrum of the sound signal captured during the SP stage, which shows similar frequency components to the one derived from the hammer pressure signal. Since the camera’s microphone includes band-pass filters designed to capture frequencies in the range between 20 Hz and 20 kHz (corresponding to the typical listening range of the human ear), the amplitude of the impact frequency at 14.10 Hz appears to be lower than the amplitude of the second harmonic located around 28.15 Hz. Despite the apparent distortion in the spectrum of the sound signal, and given the restricted scope of the target problem, the spectrum of the sound signal allows us to corroborate that the impact frequency of the DTH hammer in the experiment is 14.10 Hz.

3. Results

Using the reference frame described in Section 2, this section describes and evaluates the three approaches proposed for impact frequency identification using MCSA: side bands analysis, waterfall plots, and envelope analysis.

3.1. Side Bands Approach

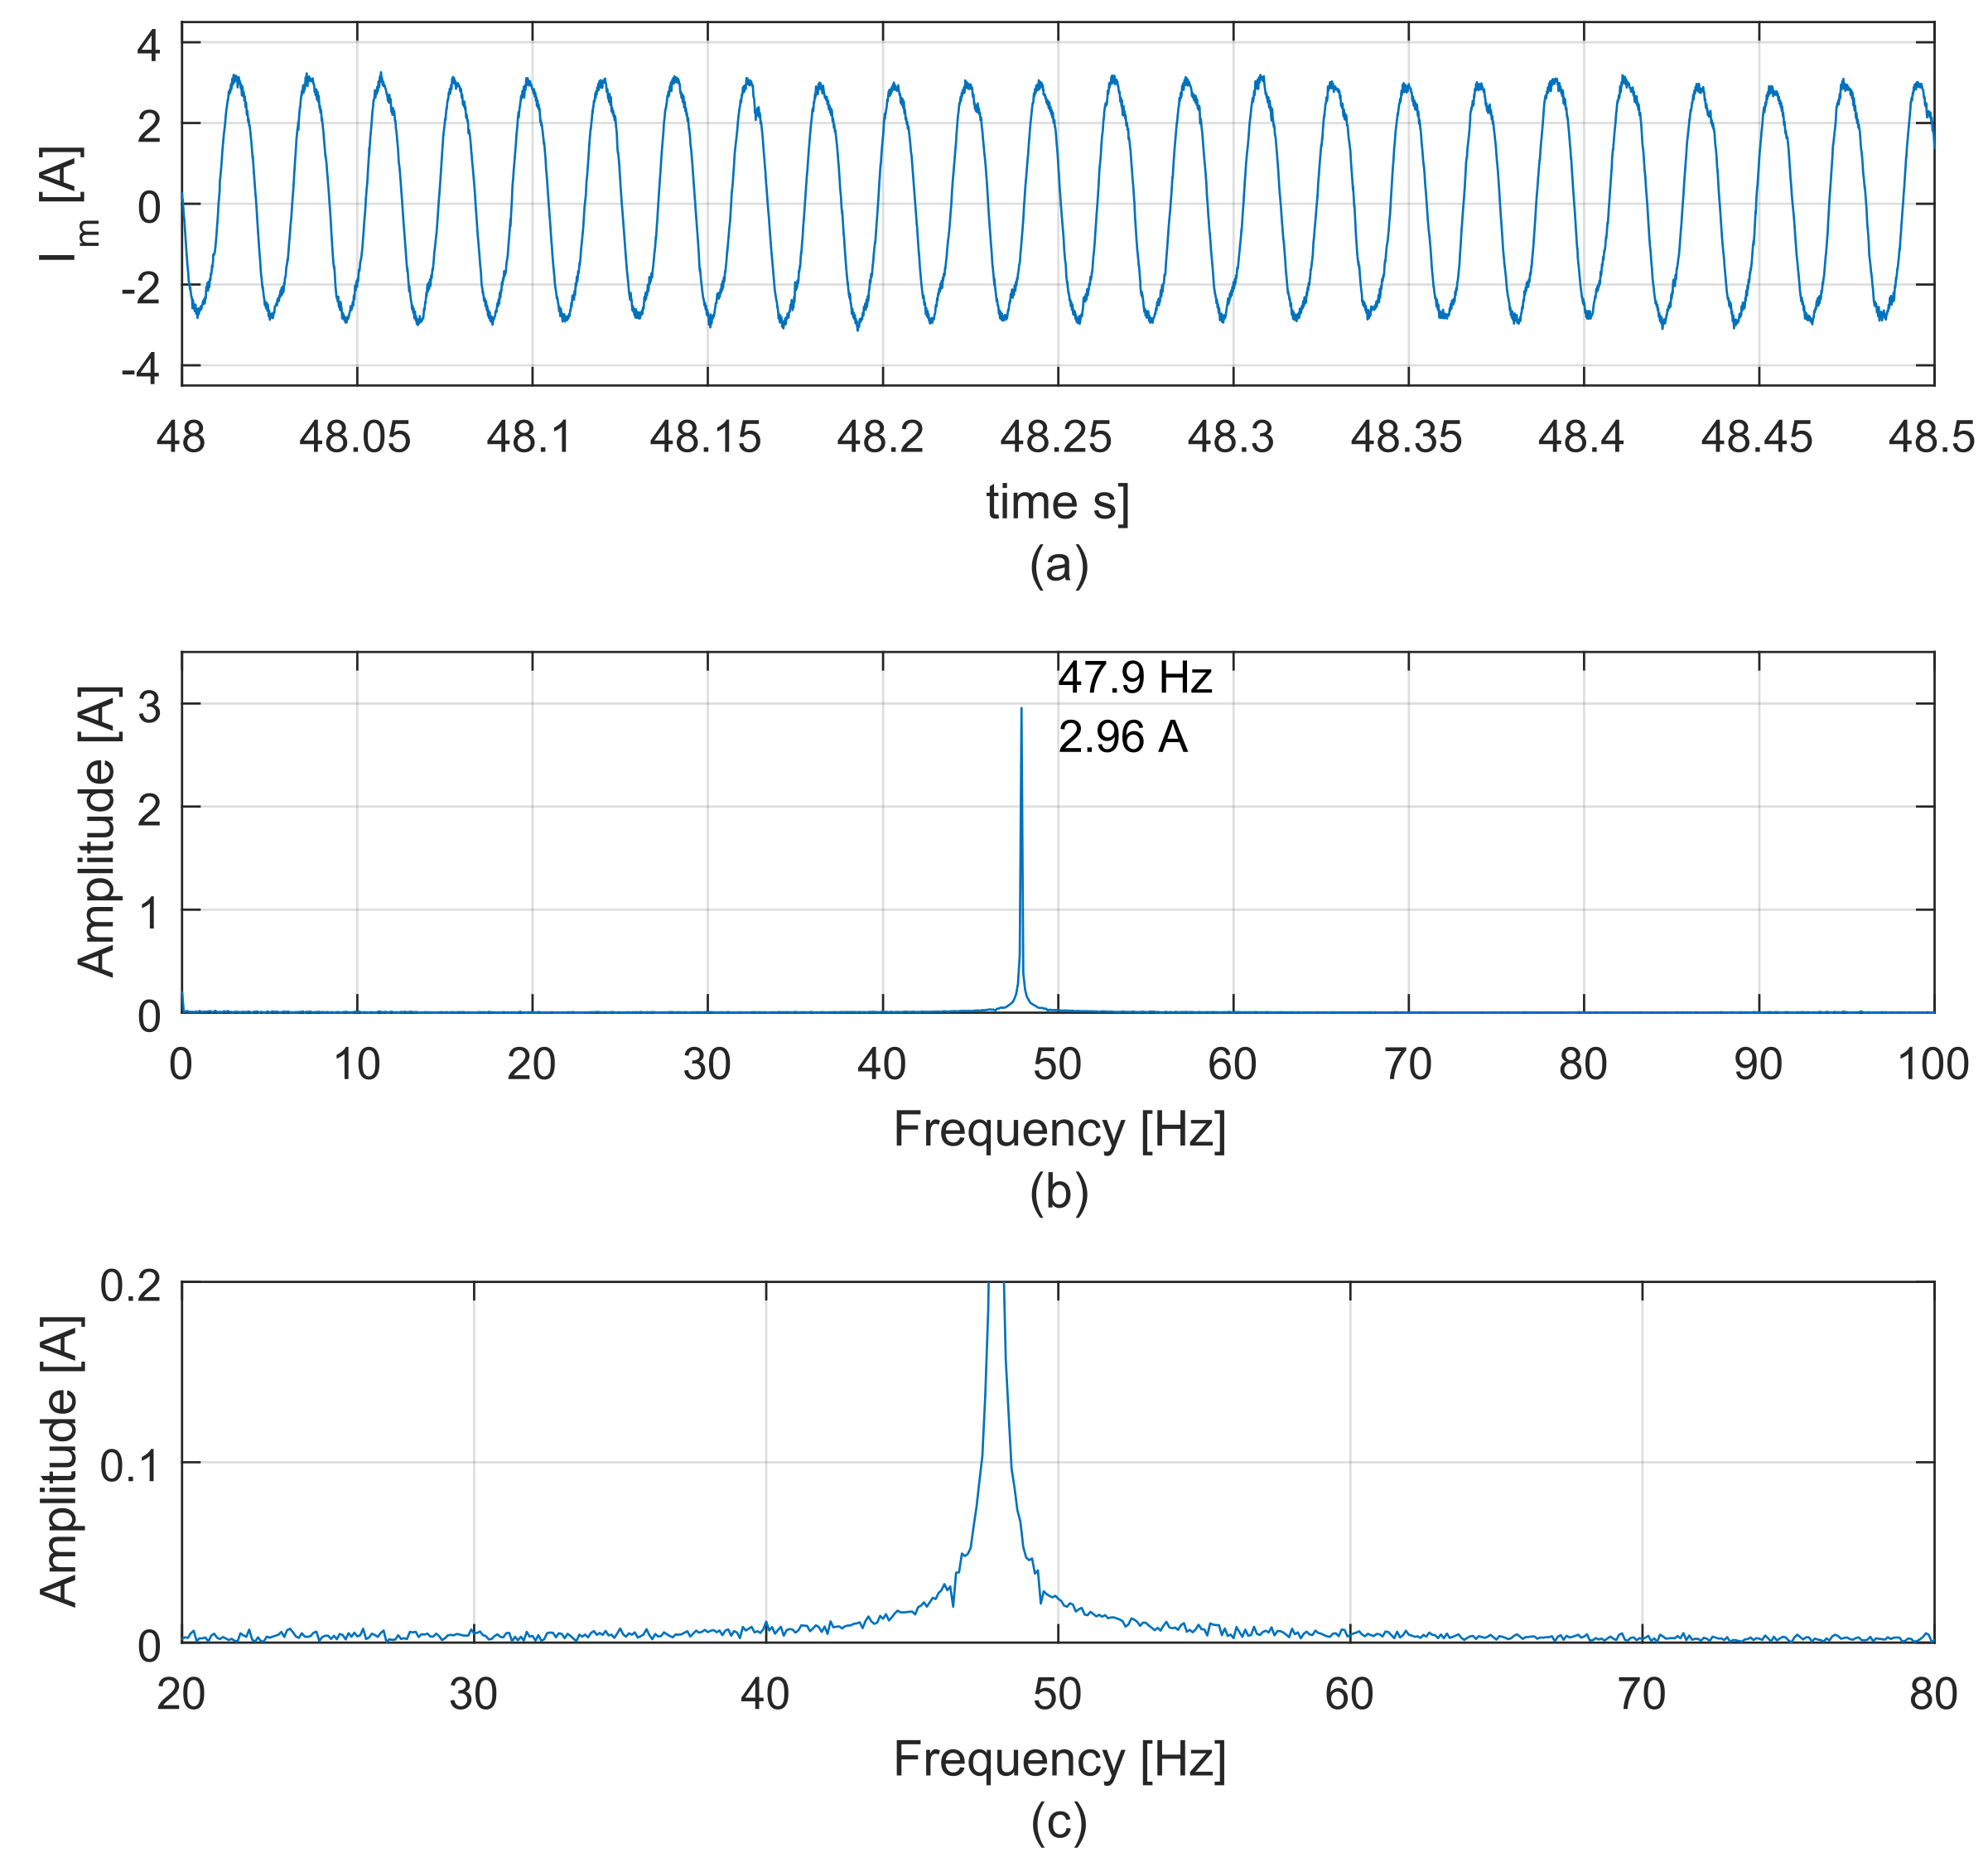
Figure 7 and Figure 8 show the time and frequency domain representation of the motor current signals during the NP and SP stages, respectively. Figure 7a shows the expected sinusoidal signal with a nearly fixed amplitude of 3 A. The plotted motor current corresponds to the sum of the magnetizing current and mechanical friction associated with the rotating components of the drill rig, including gearbox and bottomhole assembly. The spectrum in Figure 7b shows that the motor current signal has a fundamental component around 47.9 Hz with an amplitude of 2.96 A. The fundamental frequency corresponds to the stator voltage frequency that feeds the induction motor from the VFD. Since the VFD implements its own control law, the voltage frequency reaching the motor differs slightly from the 50 Hz of the grid, considering the speed reference and the instantaneous motor load. Figure 7c shows a zoomed-in view of the spectrum around the fundamental frequency, showing that during the NP-stage, there are no additional frequency components other than the fundamental associated with the power supply.
The current signal in the temporal domain plotted in Figure 8a, shows that, once the drilling starts, the current presents a variable amplitude with peaks reaching around 4 A. The frequency spectrum in Figure 8b shows a fundamental component at 48.2 Hz, slightly higher than the frequency obtained previously during the NP-stage due to the increment of the load torque in the SP-stage that reduces the motor speed. As a result, the VFD control law increases the feed frequency to keep motion at the constant reference speed. The amplitude of the fundamental component is only 2.51 A, which suggests that amplitudes higher than 2.51 A observed in the temporal domain are associated with additional frequency components present during the stable percussion drilling operation. Effectively, the zoomed-in view in Figure 8c shows the presence of two groups of side bands around the fundamental frequency originating from different operational dynamics. According to the analysis to detect defects in the cage of induction motors presented in [37], the pair of side bands close to the fundamental frequency represents the “twice slip frequency side bands” whose values and related current amplitudes are defined by the drive train inertia and torque and speed oscillations. The same work states that the farther group of side bands can be associated with oscillations of mechanical loads, which, for our case study, are produced by the percussive action of the hammer. This group of symmetrically spaced side bands is located at 34.07 Hz and 62.27 Hz and is related to the cyclic variation around the mean average speed caused by the hammer operation. The average distance of these bands to the fundamental frequency is 14.10 Hz, corresponding to the impact frequency.
From a practical perspective, this method requires the user to know the rated range of variations of the impact frequency, which can usually be found in the technical specifications provided by the hammer’s manufacturer. If the range of rated frequency is unknown, it may be difficult to discriminate the side bands related to the impact frequency from the other side bands expected to appear in the current frequency spectrum.

3.2. Waterfall Plots Approach

The second method evaluated for identifying the impact frequency from MCSA is based on the short-time Fourier transform (STFT), which splits the motor current time signal into short segments of equal length to then compute the FFT separately on each segment. The resulting frequency spectra are displayed in a 3D waterfall plot, which facilitates visualizing the variations of the spectrum over time. Figure 9 shows a waterfall plot for the motor current during the SP stage, considering time segments of 2.66 s. This figure clearly shows the variations in the amplitude of the fundamental component of the frequency spectrum over each time segment. Considering that these variations can reveal the impacts of the DTH hammer over the drilling surface, the next step is to extract the amplitudes of the fundamental component of motor current to create a new data array (Im,fund) and then to apply the FFT to the new data array to identify the impact frequency. Figure 10a shows the evolution of the resulting Im,fund data array over time. The enlarged view of this data is shown in Figure 10b, where circles represent the amplitudes of the fundamental component captured for each sampled segment. For this analysis, a time segment of 0.02 s is chosen, considering that these windows cover approximately one complete cycle of the fundamental component of 50 Hz (1/0.02 = 50 Hz), which allows us to capture variations on fundamental current on each cycle. The frequency spectrum in Figure 10c confirms that the impact frequency of 14.10 Hz is detected. Notably, the maximum frequency captured in the spectrum in Figure 10c is approximately 24 Hz, corresponding to the Nyquist frequency of Im,fund.
Since this method must capture the fundamental cycles of the motor current, which are defined by the rated frequency of the motor, the maximum frequency of the spectrum will naturally be limited to half of this frequency, i.e., 25 Hz for a nominal frequency of 50 Hz and 30 Hz for a nominal frequency of 60 Hz. This limitation is important, considering that the impact frequency can be within a wide range of values (see Section 1) and can even exceed the fundamental frequency of the stator. Therefore, the application of this method will be restricted to drilling machines with operational impact frequencies lower than the Nyquist frequency. To overcome this limitation, the following method studied in this paper is the enveloping approach.

3.3. Envelope Approach

In signal processing, the envelope function of an oscillating signal is a curve outlining the extremes of the signal in a smooth way. Envelope functions provide a convenient way to represent instantaneous changes in the amplitude of an oscillating signal, and it is then suitable for analyzing the changes in the amplitude of the motor current observed during the SP-stage. The envelopes of the motor current signal are computed using spline interpolation over the local maxima (i.e., current peaks), separated by n samples. The maximum number of spline interpolation samples ( n m a x ) between successive current peaks is obtained by
n m a x = f s f f
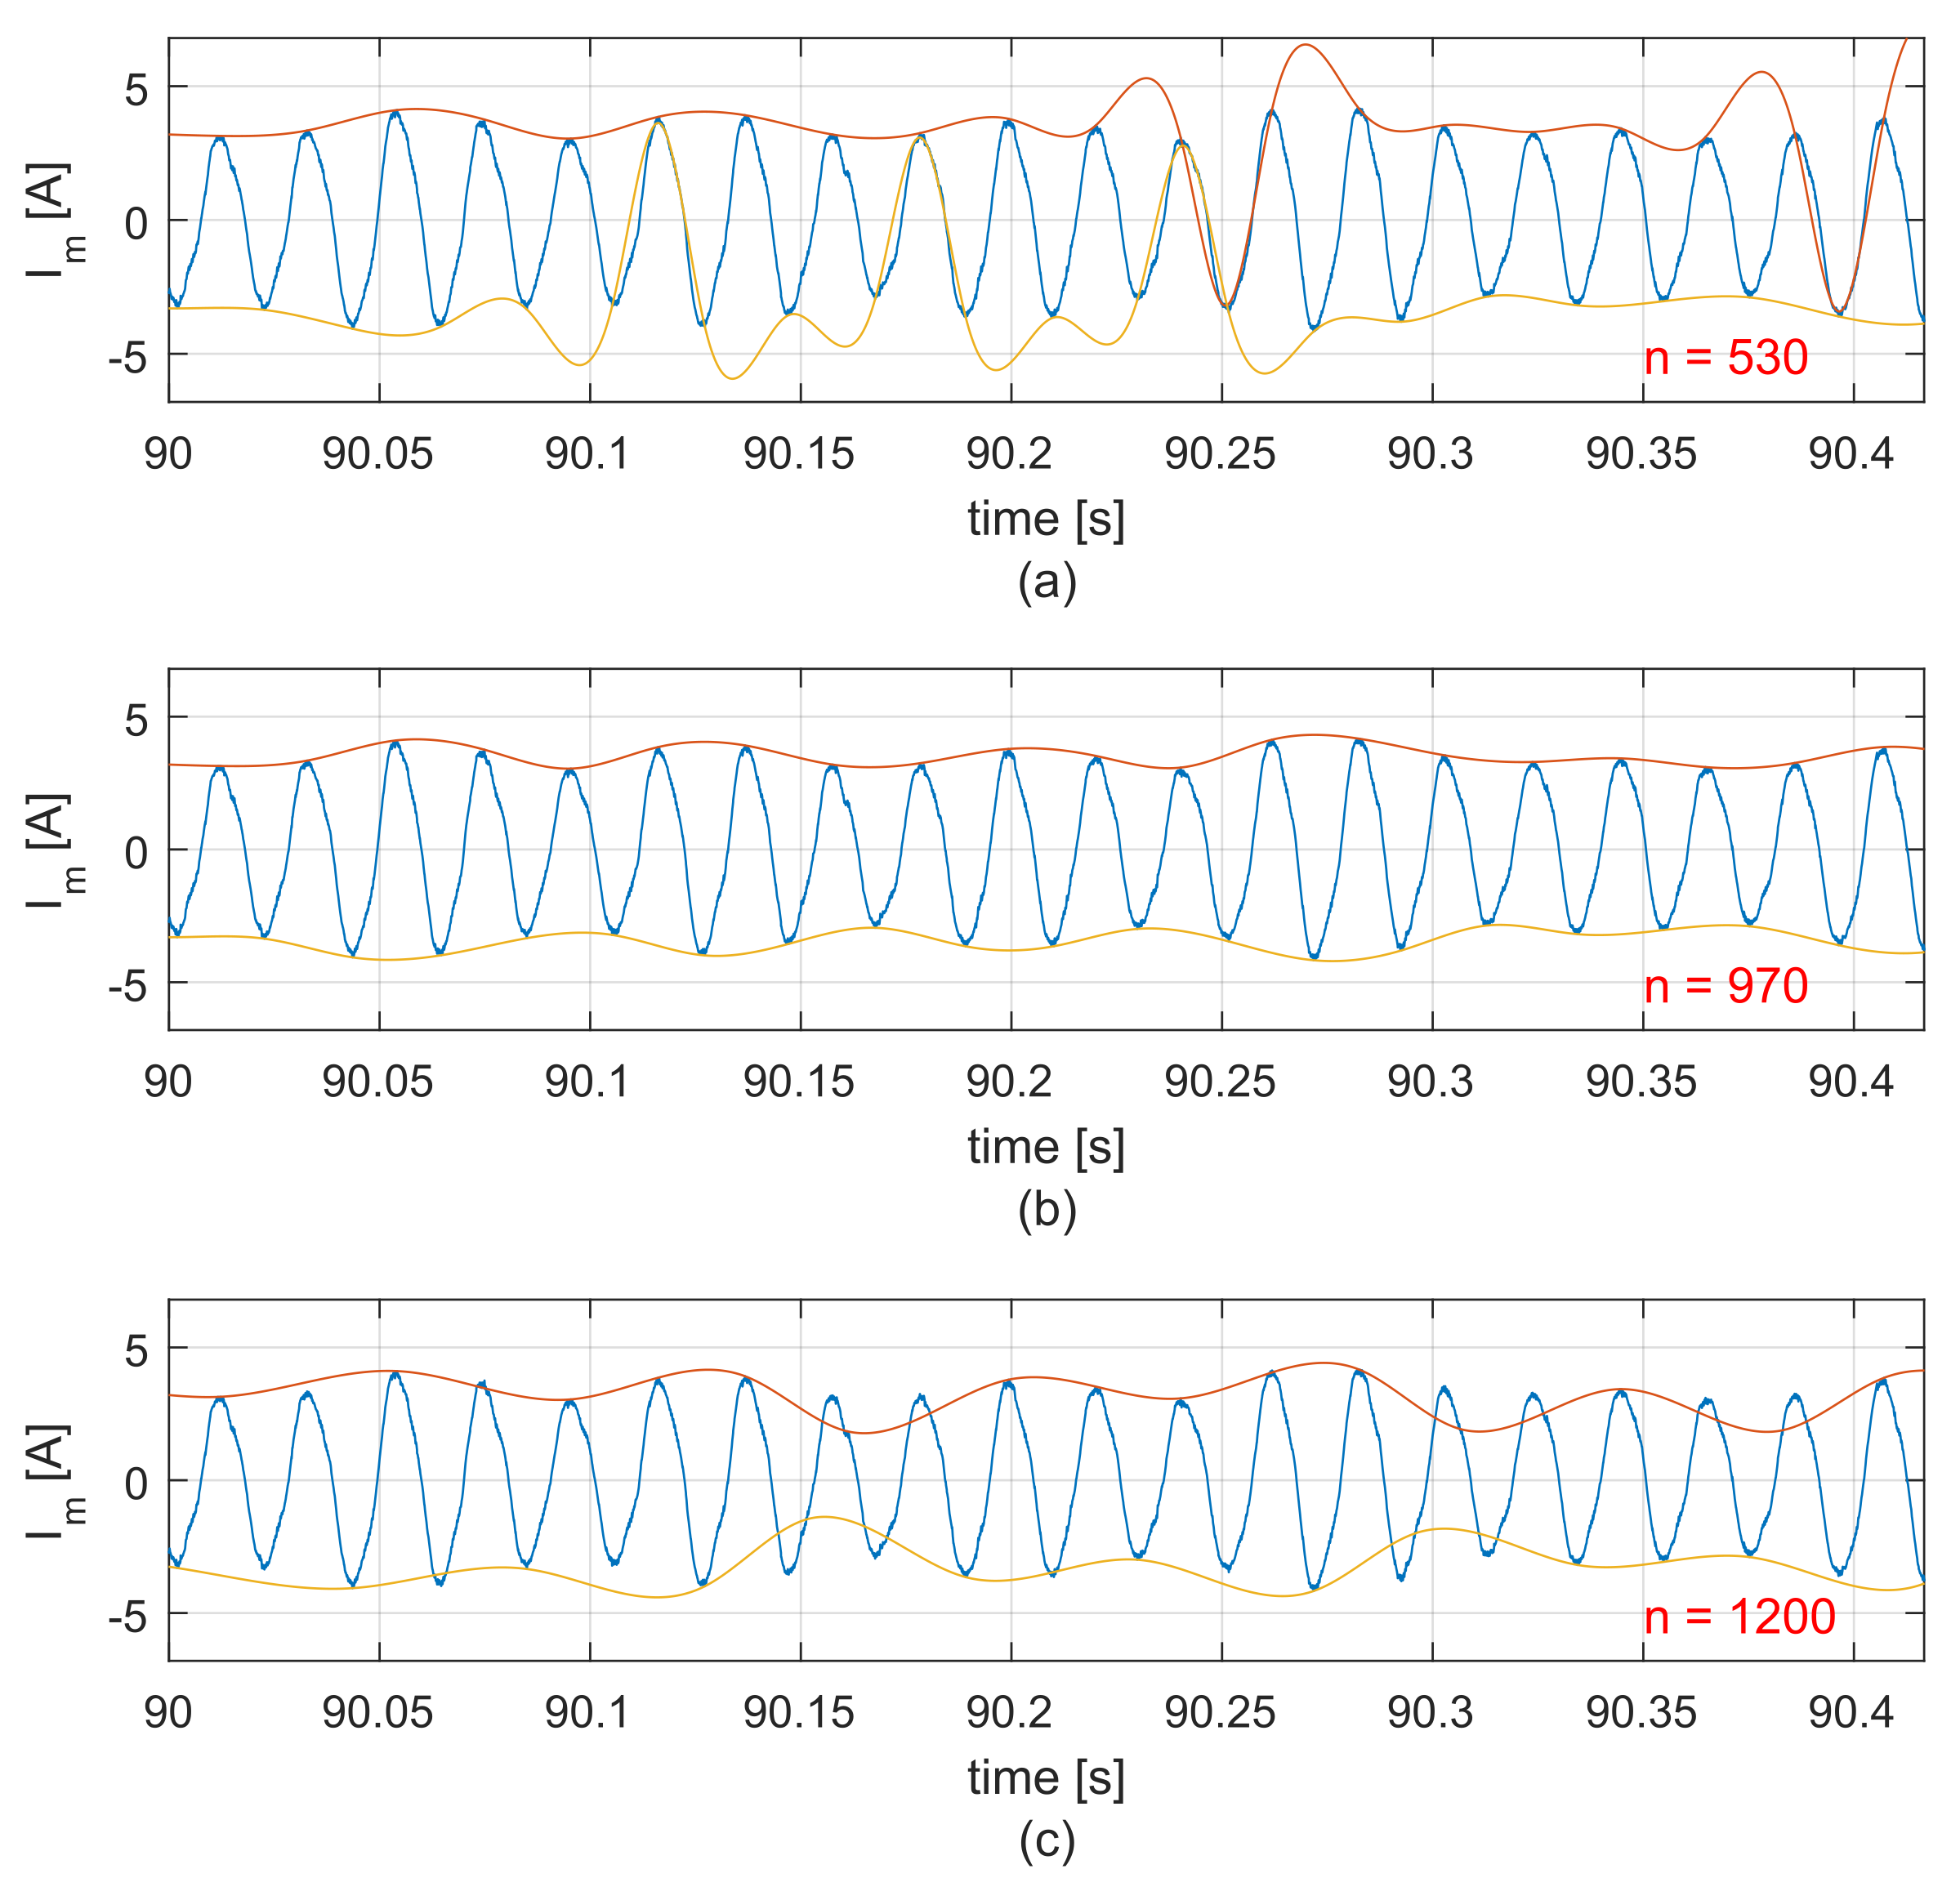
where f s is the sample frequency and f f is the fundamental frequency of the motor current. For our case study, f s is 50 kHz and f f is 48.2 Hz (see Figure 8), resulting in a n m a x = 1037 that represents an upper-bound for n.
To illustrate the effects of the choice of the number of samples n used for spline interpolation in the shape of the resulting envelope, Figure 11 shows the motor current signal during a window of the SP-stage, including the upper (red line) and lower (yellow line) envelopes considering three values of n. The depicted examples consider n = 530 (lower than n m a x ), n = 970 (close to n m a x ), and n = 1200 (greater than n m a x ). The plot shows that setting a low value of n produces a distorted envelope that does not capture the amplitude peaks of the current signal. On the other hand, when the number of samples is greater than n m a x , the envelope signal cannot consistently capture the current peak modulation, generating artificially higher amplitude peaks. When considering several samples close to n m a x , the resulting envelopes accurately outline the peaks of the motor current.
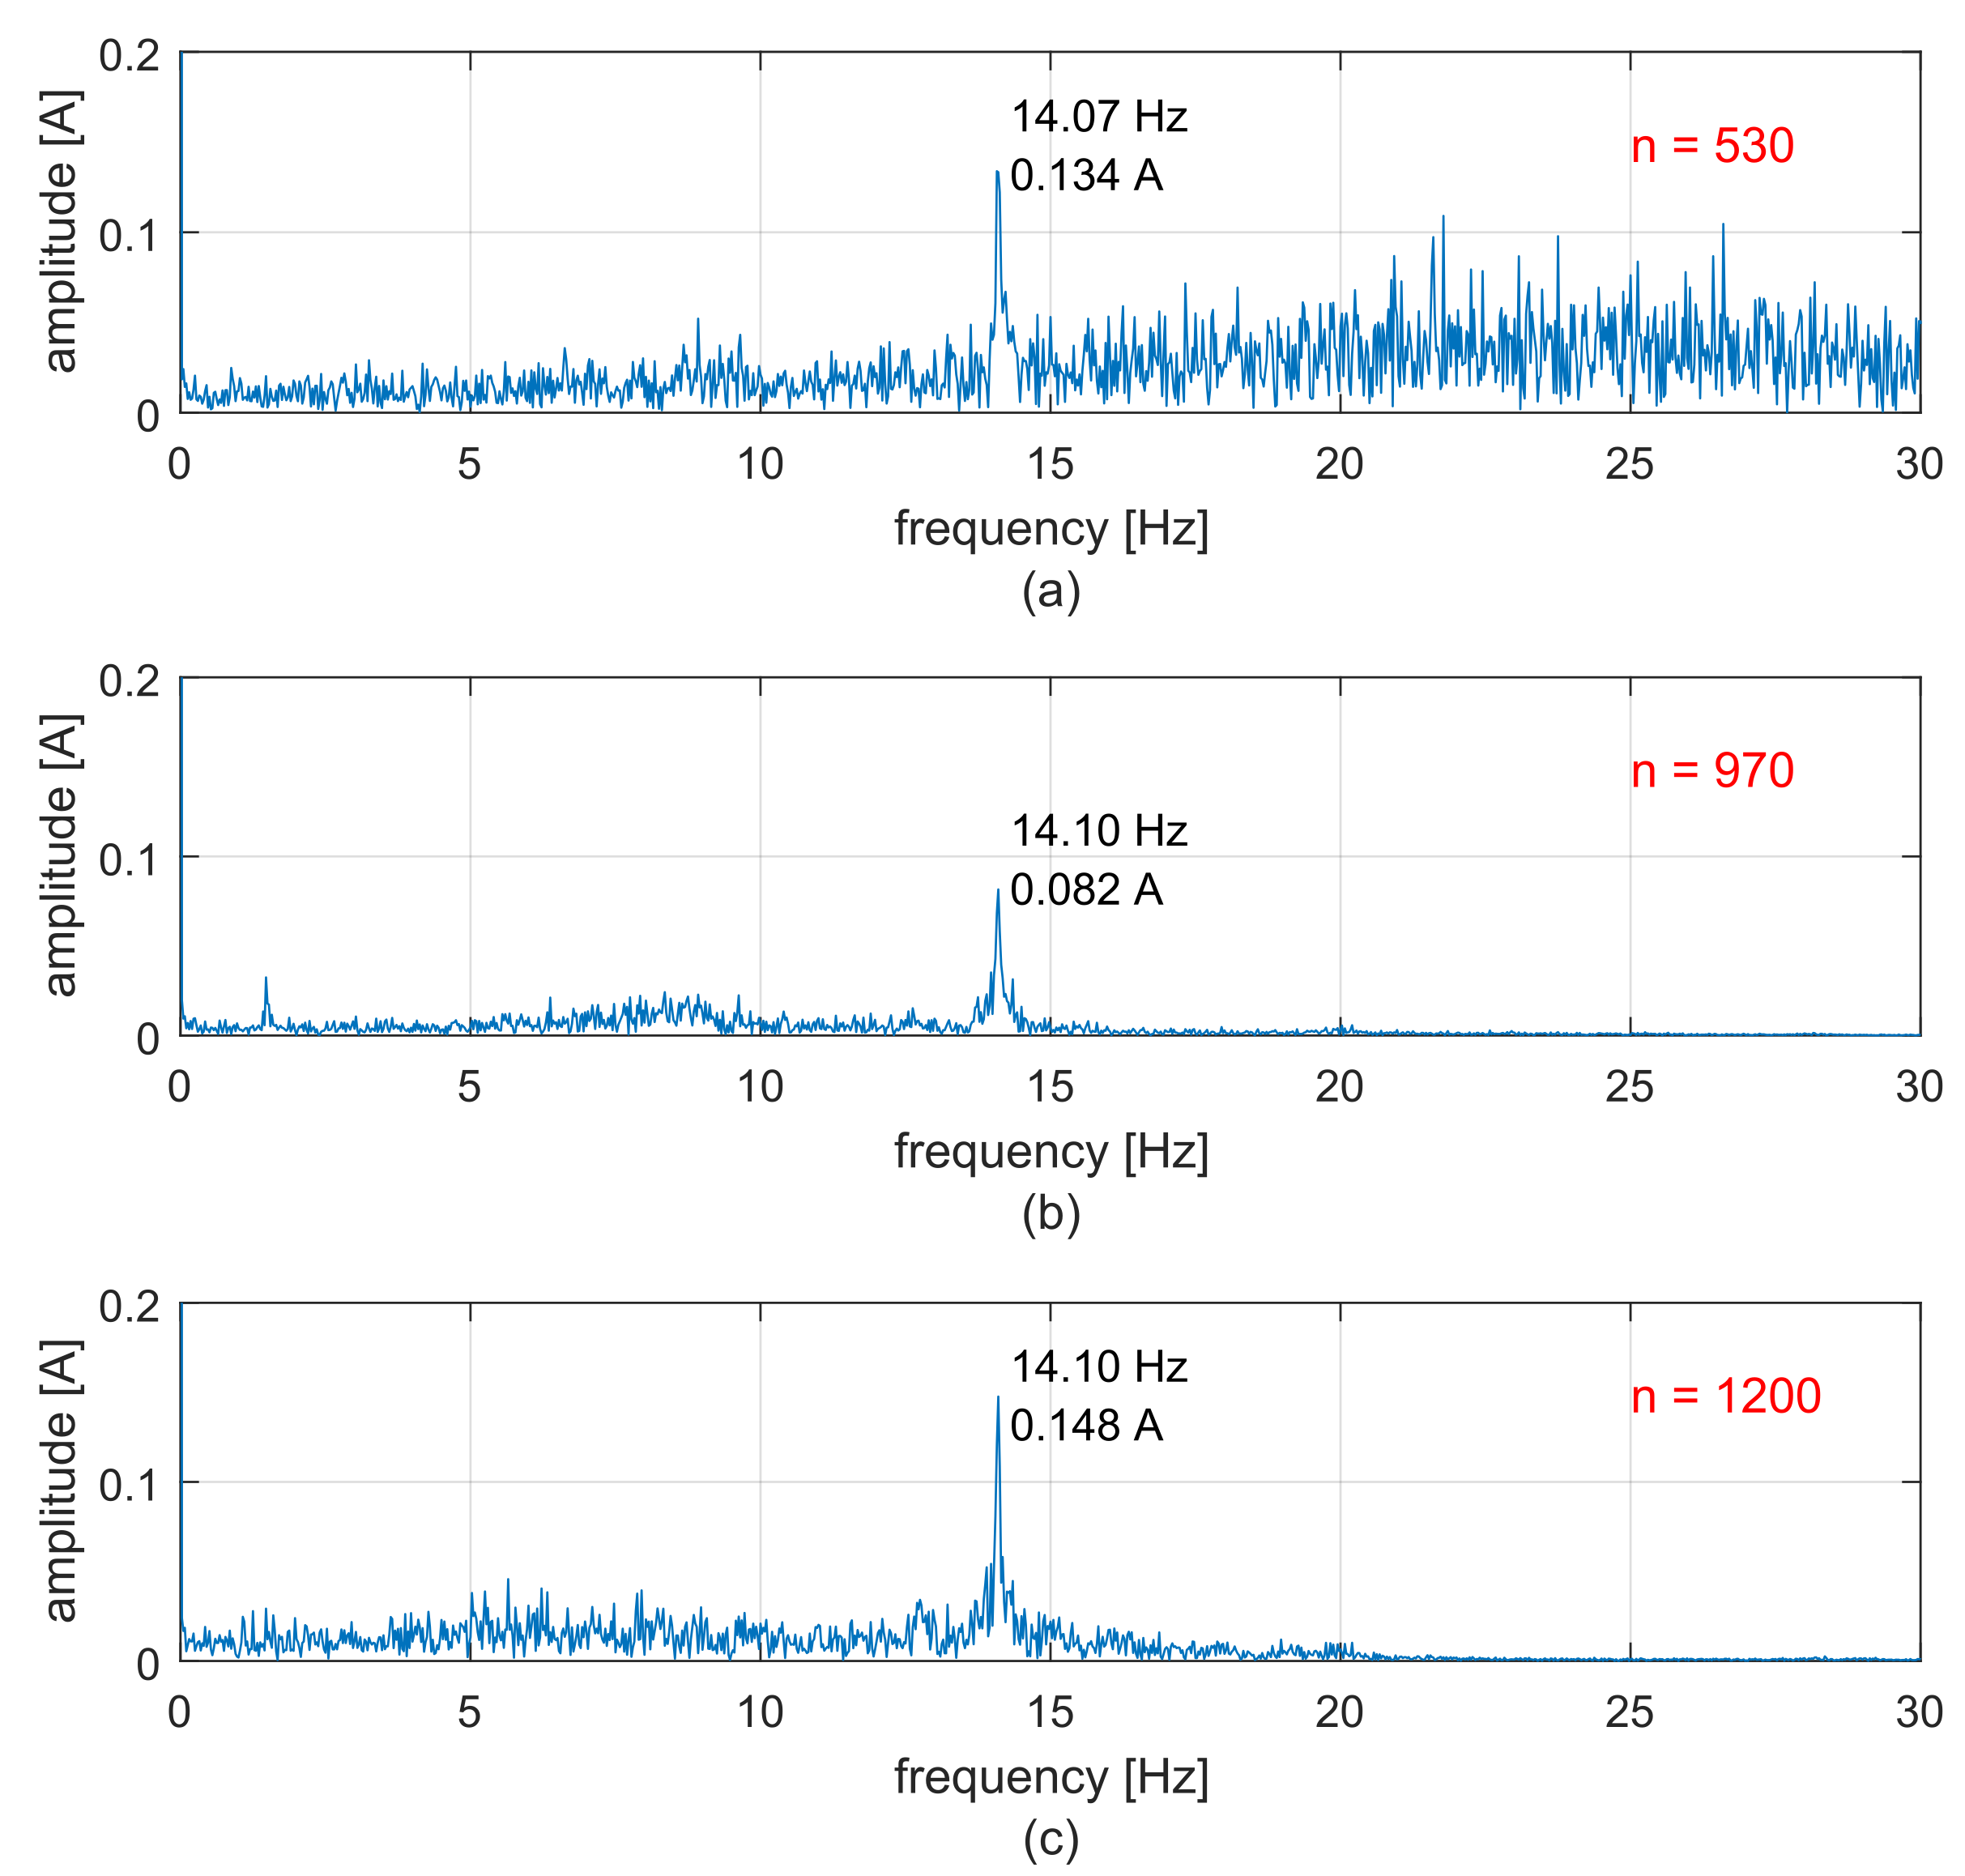
To illustrate the effect of the chosen n over the spectra of the resulting envelopes, Figure 12 shows the frequency spectra for the three values of n presented above. Figure 12 shows that impact frequency is identified with a certain accuracy grade regardless of the number of samples used for the spline interpolation. However, the amplitude of both the motor current at the impact frequency and the artificial frequency content are significantly affected by n. For n = 530 , the noticeable distortions in the envelope shape and the overestimation of the peaks of the current signal amplify the current amplitude at the impact frequency and generate artificial frequency components comparable in amplitude to the impact frequency. As expected, for n = 970 , the impact frequency is clearly distinguishable, and the amplitude coincides with the magnitude of the current. In the case of n = 1200 , the impact frequency is still clearly distinguishable in the spectra, but the overestimation of the peaks of the current signals represented in the envelope generates a higher amplitude for the impact frequency and artificial frequency content.
The observed results suggest that the method for frequency identification using the envelope approach is not very sensitive to the choice of the parameter n. Indeed, repeating the procedure described above for different values of n and performing a sensitivity analysis over the identified frequency, we determined that, for our case study, setting the number of samples in the range ( 0.53 × n m a x ) n ( 0.93 × n m a x ) permitted us to identify the impact frequency. Considering that the values f s and f f required to compute n m a x are known, selecting a proper value for n using the previous expression is straightforward.

4. Discussion

The analysis of the three proposed methods based on MCSA to identify the impact frequency in DTH drilling systems allows us to establish advantages and disadvantages between them. In some cases, the differences are derived from practical implications, while in other cases, they are related to mathematical limitations.
The side bands approach has the most straightforward implementation of the evaluated approaches since it only requires direct FFT analysis of the motor current signal during the SP-stage and calculating the frequency offset difference between the side bands with the fundamental component. However, since additional side bands are expected to appear in the spectrum due to different dynamics, the user must know the rated operational range for the impact frequency of the drilling rig. Moreover, recent works show that, in the case of incipient motor faults, additional side bands can appear close to the frequency components associated with oscillating loads [35,37], further complicating the separation of the frequency of interest.
Compared with the side bands method, the waterfall approach requires the FFT-based algorithms to be performed twice to identify the impact frequency. The first execution is used to construct the waterfall plot (using STFT), and the second execution computes the frequency spectrum of the fundamental component of Im extracted from the waterfall plot, from where the impact frequency can be identified. The method is sensitive to the time segment selected for the construction of the waterfall plot, which should be carefully chosen to properly capture the dynamic variations of the current amplitude due to hammer percussion. By capturing these variations, the frequency spectrum of the resulting data array Im,fund obtained from the waterfall plot will include frequency content related to the impact frequency. However, the maximum impact frequencies that can be captured by this method are inherently restricted to the Nyquist frequency of the sampling rate used to construct I m , f u n d . As explained in Section 3.2, the maximum impact frequency that can be identified in practice will be around half the rated motor frequency.
The last evaluated method corresponds to the envelope approach, which uses spline interpolation between local peaks of the motor current amplitude. In this approach, the modulation of the motor current due to the torsional impacts traduced in load torque dynamic variation is detected by applying the FFT to the envelope signals. The method requires the number of samples n for spline interpolation to be specified as an input parameter, which can be intuitively selected through a preliminary analysis of the current signal. A sensitivity analysis applied for the case study showed that this method is not very sensitive to the choice of n, providing an ample range for the value of n without degrading the results. The envelope method overcomes the inherent limitations of the side bands and waterfall approaches, providing a simple and effective technique for identifying both the impact frequency and the related motor current amplitude.
Future research in this topic will include extensive experimental evaluations using different hammer bits and rock samples within a wide range of compressive strengths to validate the proposed approaches in a wide range of operational conditions. Considering that the impact frequency is related to drilling efficiency variables such us RoP, bit wearing, and rock properties of drilled formations, further works will also integrate the MCSA-based impact frequency identification into Measurement-While-Drilling (MWD) systems designed to monitor the drilling process in nearly real-time, providing complementary and valuable information to characterize the rock mass during the drilling operation.

5. Conclusions

This paper proposes and evaluates three methods for identifying the impact frequency in a pneumatic DTH drill rig driven by an electric motor using MCSA. The estimated impact frequency obtained with the three proposed methods for an experimental reference setup was consistent with values obtained from an independent analysis of pressure and sound signal analysis during both the NP-stage (no percussive drilling) and the SP-stage (stable percussive drilling). The experimental study showed that the proposed side bands and the waterfall approaches present restrictions that may limit their application scope in practical scenarios. Overall, the proposed envelope approach represented a simple, more robust alternative for identifying the impact frequency.
The application of the proposed methods for impact frequency identification tailored for drilling operations represents a novel application of MCSA techniques. Given the evidence about the feasibility of identifying impact frequency via MCSA, the future scope of this research will address integrating impact frequency analysis and related motor current amplitude into observed-based MWD systems to develop more robust rock mass characterization analytical tools for industrial applications.

Author Contributions

Conceptualization, G.R. and G.C.; methodology, G.R. and R.G.; software D.B.; validation, D.B., R.G. and G.R.; formal analysis, D.B., G.R., R.G. and G.C.; investigation, G.R. and D.B.; writing—original draft preparation, G.R., G.C., R.G. and L.R.-C.; writing—review and editing, G.R., G.C., R.G. and L.R.-C.; visualization, G.R., G.C., R.G. and L.R.-C.; supervision, G.R.; project administration, G.R.; funding acquisition, G.R. All authors have read and agreed to the published version of the manuscript.

Funding

This work was funded by the National Agency for Research and Development (Agencia Nacional de Investigación y Desarrollo ANID) through project FONDECYT 11180768.

Institutional Review Board Statement

Not applicable.

Informed Consent Statement

Not applicable.

Data Availability Statement

Not applicable.

Conflicts of Interest

The authors declare no conflict of interest.

References

  1. Bruno, M.S. Fundamental Research on Percussion Drilling: Improved Rock Mechanics Analysis, Advanced Simulation Technology, and Full-Scale Laboratory Investigations; Technical Report; Office of Scientific and Technical Information, Department of Energy: Arcadia, CA, USA, 2005. [CrossRef] [Green Version]
  2. Chiang, L.E.; Stamm, E.B. Design Optimization of Valveless DTH Pneumatic Hammers by a Weighted Pseudo-Gradient Search Method. J. Mech. Des. 1998, 120, 687–694. [Google Scholar] [CrossRef]
  3. Zhang, Z.X. Rock Fracture and Blasting: Theory and Applications; Butterworth-Heinemann: Oxford, UK, 2016. [Google Scholar]
  4. Li, J.G.; Zhan, K. Intelligent Mining Technology for an Underground Metal Mine Based on Unmanned Equipment. Engineering 2018, 4, 381–391. [Google Scholar] [CrossRef]
  5. Bo, K.; Chen, B.; Hu, Y.; Wang, M. Design optimization and feasibility analysis of pneumatic DTH Hammer with self-rotation bit. J. Vibroengineering 2022, 24, 305–316. [Google Scholar] [CrossRef]
  6. Izquierdo, L.E.; Chiang, L.E. A methodology for estimation of the specific rock energy index using corrected down-the-hole drill monitoring data. Min. Technol. 2004, 113, 225–236. [Google Scholar] [CrossRef]
  7. Karpov, V.N.; Petreev, A.M. Determination of Efficient Rotary Percussive Drilling Techniques for Strong Rocks. J. Min. Sci. 2021, 57, 447–459. [Google Scholar] [CrossRef]
  8. Chiang, L.; Elías, D. Modeling impact in down-the-hole rock drilling. Int. J. Rock Mech. Min. Sci. 2000, 37, 599–613. [Google Scholar] [CrossRef]
  9. Bu, C.; Qu, Y.; Cheng, Z.; Liu, B. Numerical simulation of impact on pneumatic DTH hammer percussive drilling. J. Earth Sci. 2009, 20, 868–878. [Google Scholar] [CrossRef]
  10. Zhu, X.; Tang, L.; Tong, H. Effects of High-Frequency Torsional Impacts on Rock Drilling. Rock Mech. Rock Eng. 2014, 47, 1345–1354. [Google Scholar] [CrossRef]
  11. Wang, Y.; Ni, H.; Wang, R.; Huang, B.; Liu, S.; Zhang, H. Numerical Simulation Research on Cutting Rock with a PDC Cutter Assisted by an Impact Force. Adv. Civ. Eng. 2022, 2022, 8282104. [Google Scholar] [CrossRef]
  12. Ma, Y.; Xu, Y. Research into technology for precision directional drilling of gas-drainage boreholes. Min. Miner. Depos. 2022, 16, 27–32. [Google Scholar] [CrossRef]
  13. Liu, H. Numerical Modelling of the Rock Fragmentation Process by Mechanical Tools. Ph.D. Thesis, Luleå University of Technology, Luleå, Sweden, 2004. [Google Scholar]
  14. Kivade, S.; Murthy, C.S.; Vardhan, H. Experimental Investigations on Penetration Rate of Percussive Drill. Procedia Earth Planet. Sci. 2015, 11, 89–99. [Google Scholar] [CrossRef] [Green Version]
  15. López Jimeno, C.; López Jimeno, E.; García Bermúdez, P. Manual de Perforación y Voladura de Rocas, 1st ed.; Instituto Tecnológico Geominero de España: Madrid, Spain, 2003. [Google Scholar]
  16. Bout, G.; Brito, D.; Gómez, R.; Carvajal, G.; Ramírez, G. Physics-Based Observers for Measurement-While-Drilling System in Down-the-Hole Drills. Mathematics 2022, 10, 4814. [Google Scholar] [CrossRef]
  17. Zhao, Z.; Meng, Y.; Li, Y.; Shi, X.; Xiang, C. Effects of Working Angle on Pneumatic Down-the-hole Hammer Drilling. Rock Mech. Rock Eng. 2015, 48, 2141–2155. [Google Scholar] [CrossRef]
  18. Shi, H.; Ji, Z.; Jiang, J.; Li, B. Numerical Study on Fragmentation Characteristics of Granite Under a Single Polycrystalline Diamond Compact Cutter in Rotary-Percussive Drilling. J. Energy Resour. Technol. 2022, 144, 093201. [Google Scholar] [CrossRef]
  19. Lianggang, L.; Bing, Z.; Qiang, L. Study on Vibration Frequency and Rock Fragmentation Effect of Sonic Drill Rig. Procedia Eng. 2014, 73, 3–9. [Google Scholar] [CrossRef] [Green Version]
  20. Guo, Y.; Yang, S.Y.; Liu, D.S.; Zhang, L.Y.; Chen, J.W. Impact performance for high frequency hydraulic rock drill drifter with sleeve valve. Int. J. Fluid Mach. Syst. 2016, 9, 39–46. [Google Scholar] [CrossRef] [Green Version]
  21. Zhang, X.; Zhang, S.; Peng, J.; Wu, D. A fluidic oscillator with concave attachment walls and shorter splitter distance for fluidic DTH hammers. Sens. Actuators A Phys. 2018, 270, 127–135. [Google Scholar] [CrossRef]
  22. Bharathan, B.; Sasmito, A.P.; Ghoreishi-Madiseh, S.A. Analysis of energy consumption and carbon footprint from underground haulage with different power sources in typical Canadian mines. J. Clean. Prod. 2017, 166, 21–31. [Google Scholar] [CrossRef]
  23. Fúnez Guerra, C.; Reyes-Bozo, L.; Vyhmeister, E.; Jaén Caparrós, M.; Salazar, J.; Godoy-Faúndez, A.; Clemente-Jul, C.; Verastegui-Rayo, D. Viability analysis of underground mining machinery using green hydrogen as a fuel. Int. J. Hydrogen Energy 2020, 45, 5112–5121. [Google Scholar] [CrossRef]
  24. Ertugrul, N.; Kani, A.P.; Davies, M.; Sbarbaro, D.; Morán, L. Status of Mine Electrification and Future Potentials. In Proceedings of the 2020 International Conference on Smart Grids and Energy Systems (SGES), Perth, Australia, 23–26 November 2020; pp. 151–156. [Google Scholar] [CrossRef]
  25. Paraszczak, J.; Svedlund, E.; Fytas, K.; LaFlamme, M. Electrification of Loaders and Trucks – A Step Towards More Sustainable Underground Mining. Renew. Energy Power Qual. J. 2014, 1, 81–86. [Google Scholar] [CrossRef]
  26. Nieto, A.; Schatz, R.; Dogruoz, C. Performance analysis of electric and diesel equipment for battery replacement of tethered LHD vehicles in underground mining. Min. Technol. 2020, 129, 1–8. [Google Scholar] [CrossRef]
  27. Hassan, O.E.; Amer, M.; Abdelsalam, A.K.; Williams, B.W. Induction motor broken rotor bar fault detection techniques based on fault signature analysis—A review. IET Electr. Power Appl. 2018, 12, 895–907. [Google Scholar] [CrossRef]
  28. Antonino-Daviu, J.A.; Gyftakis, K.N.; Garcia-Hernandez, R.; Razik, H.; Marques Cardoso, A.J. Comparative Influence of Adjacent and Non-Adjacent Broken Rotor Bars on the Induction Motor Diagnosis through MCSA and ZSC Methods. In Proceedings of the IECON 2015-41st Annual Conference of the IEEE Industrial Electronics Society, Yokohama, Japan, 9–12 November 2015; pp. 001680–001685. [Google Scholar] [CrossRef]
  29. Noureddine, B.; Eddine, Z.S.; Mohamed, S. Experimental Exploitation for the Diagnosis to the Induction Machine under a Bearing Fault-Using MCSA. In Proceedings of the 2015 4th International Conference on Electrical Engineering (ICEE), Boumerdes, Algeria, 13–15 December 2015; pp. 1–4. [Google Scholar] [CrossRef]
  30. Pandarakone, S.E.; Masuko, M.; Mizuno, Y.; Nakamura, H. Deep Neural Network Based Bearing Fault Diagnosis of Induction Motor Using Fast Fourier Transform Analysis. In Proceedings of the 2018 IEEE Energy Conversion Congress and Exposition (ECCE), Portland, OR, USA, 23–27 December 2018; pp. 3214–3221. [Google Scholar] [CrossRef]
  31. Bessous, N.; Zouzou, S.E.; Sbaa, S.; Bentrah, W. A Comparative Study between the MCSA, DWT and the Vibration Analysis Methods to Diagnose the Dynamic Eccentricity Fault in Induction Motors. In Proceedings of the 2017 6th International Conference on Systems and Control (ICSC), Batna, Algeria, 7–9 May 2017; pp. 414–421. [Google Scholar] [CrossRef]
  32. Bessous, N.; Zouzou, S.E.; Sbaa, S.; Khelil, A. New Vision about the Overlap Frequencies in the MCSA-FFT Technique to Diagnose the Eccentricity Fault in the Induction Motors. In Proceedings of the 2017 5th International Conference on Electrical Engineering—Boumerdes (ICEE-B), Boumerdes, Algeria, 29–31 October 2017; pp. 1–6. [Google Scholar] [CrossRef]
  33. Akhil Vinayak, B.; Anjali Anand, K.; Jagadanand, G. Wavelet-based real-time stator fault detection of inverter-fed induction motor. IET Electr. Power Appl. 2020, 14, 82–90. [Google Scholar] [CrossRef]
  34. Bazan, G.H.; Scalassara, P.R.; Endo, W.; Goedtel, A.; Godoy, W.F.; Palácios, R.H.C. Stator fault analysis of three-phase induction motors using information measures and artificial neural networks. Electr. Power Syst. Res. 2020, 143, 1–8. [Google Scholar] [CrossRef]
  35. Yakhni, M.F.; Cauet, S.; Sakout, A.; Assoum, H.; Etien, E.; Rambault, L.; El-Gohary, M. Variable speed induction motor’s fault detection based on transient motor current signatures analysis: A review. Mech. Syst. Signal Process. 2020, 184, 109737. [Google Scholar] [CrossRef]
  36. dSPACE. Brochure MicroLabBox Hardware. 2020. Available online: https://www.dspace.com/shared/data/pdf/2020/dSPACE-MicroLabBox_Product-Brochure_2020-01_EN.pdf (accessed on 29 January 2023).
  37. Thomson, W.T.; Culbert, I. Current Signature Analysis for Condition Monitoring of Cage Induction Motors: Industrial Application and Case Histories, 1st ed.; Wiley: Hoboken, NJ, USA, 2016. [Google Scholar] [CrossRef]
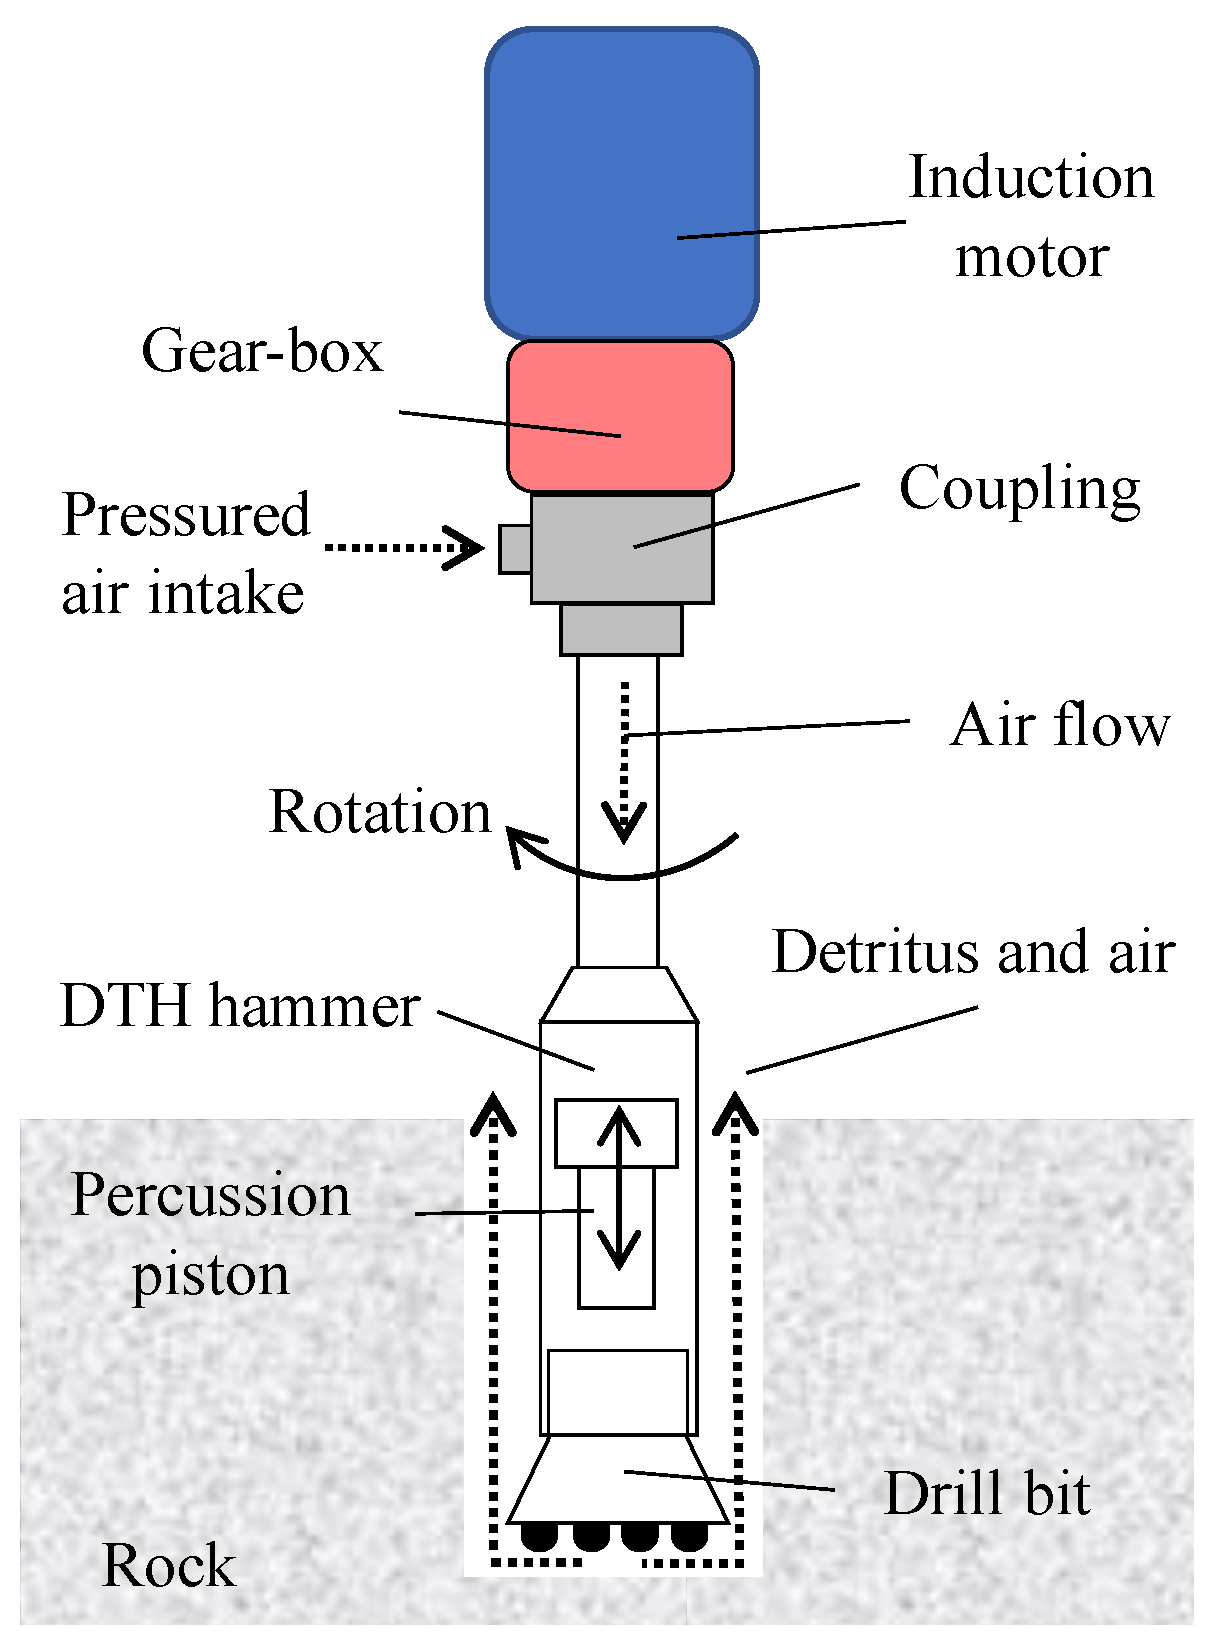
Figure 1. Schematics of percussion DTH drilling operating principle.
Applsci 13 04650 g001
Figure 2. Descriptions of the DTH drilling setup, including the main components and their interconnections. The setup extends the one described in [16] with additional sensors.
Applsci 13 04650 g002
Figure 3. Characteristic profile of monitored signals during operation (NP: no percussion, TR: transition, SP: stable percussion): (a) hammer pressure; (b) motor current.
Applsci 13 04650 g003
Figure 4. Hammer pressure signal analysis during NP-stage: (a) Ph signal; (b) zoom of Ph signal; (c) frequency spectrum Ph signal.
Applsci 13 04650 g004
Figure 5. Hammer pressure signal analysis during SP-stage: (a) Ph signal; (b) zoom of Ph signal; (c) frequency spectrum of Ph.
Applsci 13 04650 g005
Figure 6. Frequency spectrum of the sound signal during SP-stage.
Applsci 13 04650 g006
Figure 7. Motor current signal analysis during stage-a: (a) zoom of Im signal; (b) frequency spectrum of Im; (c) zoom of frequency spectrum of Im.
Applsci 13 04650 g007
Figure 8. Motor current signal analysis during stage-z: (a) zoom of Im signal; (b) frequency spectrum of Im; (c) zoom of frequency spectrum of Im.
Applsci 13 04650 g008
Figure 9. Waterfall plot for motor current during stage-z.
Applsci 13 04650 g009
Figure 10. Impact frequency identification from waterfall plots during stage-z: (a) Im,fund signal; (b) zoom of Im,fund signal; (c) frequency spectrum of IIm,fund.
Applsci 13 04650 g010
Figure 11. Upper (red line) and lower (yellow line) envelopes of motor current signal (blue line) during SP-stage with different number of samples for spline interpolation: (a) 530 samples; (b) 970 samples; (c) 1200 samples.
Applsci 13 04650 g011
Figure 12. Frequency spectra of upper envelopes for motor current signal during SP-stage: (a) 530 samples for spline interpolation; (b) 970 samples for spline interpolation; (c) 1200 samples for spline interpolation.
Applsci 13 04650 g012
Table 1. Drilling setup sensor specifications.
Sensor TypeRangeOutputBandwidth
Current clampDC + AC peak: 30 [A]±100 [mV/A]20 [kHz]
Hammer pressure0–10 [bar]0–10 [V]1 [kHz]
Disclaimer/Publisher’s Note: The statements, opinions and data contained in all publications are solely those of the individual author(s) and contributor(s) and not of MDPI and/or the editor(s). MDPI and/or the editor(s) disclaim responsibility for any injury to people or property resulting from any ideas, methods, instructions or products referred to in the content.