Article

A Full-Color Holographic System Based on Taylor Rayleigh–Sommerfeld Diffraction Point Cloud Grid Algorithm

1
School of Electronic Science and Engineering, Nanjing University, Nanjing 210023, China
2
College of Information Engineering, Yangzhou University, Yangzhou 225127, China
*
Author to whom correspondence should be addressed.
Appl. Sci. 2023, 13(7), 4466; https://doi.org/10.3390/app13074466
Submission received: 11 February 2023 / Revised: 22 March 2023 / Accepted: 29 March 2023 / Published: 31 March 2023
(This article belongs to the Special Issue Digital Holography: Novel Techniques and Its Applications)

Abstract

:
Real objects-based full-color holographic display systems usually collect data with a depth camera and then modulate the input light source to reconstruct the color three-dimensional scene of the real object. However, at present, the main problems of the real-time high quality full-color 3D display are slow speed, low reconstruction quality, and high consumption of hardware resources caused by excessive computing. Based on the hybrid Taylor Rayleigh–Sommerfeld diffraction algorithm and previous studies on full-color holographic systems, our paper proposes Taylor Rayleigh–Sommerfeld diffraction point cloud grid algorithm (TR-PCG), which is to perform Taylor expansion on the radial value of Rayleigh–Sommerfeld diffraction in the hologram generation stage and modify the data type to effectively accelerate the calculation speed and ensure the reconstruction quality. Compared with the wave-front recording plane, traditional point cloud gridding (PCG), C-PCG, and Rayleigh–Sommerfeld PCG without Taylor expansion, the computational complexity is significantly reduced. We demonstrate the feasibility of the proposed method through experiments.

1. Introduction

1.1. Background

Nowadays, VR and AR display technology is becoming more and more popular, while holographic display technology is one of the most mainstream and promising technologies. The real-world scene is mostly three-dimensional (3D) information, while the traditional two-dimensional (2D) devices can only provide 2D plane information without depth clues. This means that human visual perception and understanding ability cannot fully be utilized, and there are problems due to a lack of information and insufficient authenticity [1]. Holograms can carry the intensity, color, depth, and orientation of a given 3D scene, and can reconstruct the 3D image to achieve highly realistic visualization [2]. In order to make people really understand the objective world, research on development from 2D to 3D is gradually growing.
The methods of generating holograms can be classified into two categories: digital holography (DH) and computer-generated holography (CGH). DH uses optical instruments to record holograms, but the accuracy of the instruments and the need for stable coherent lighting equipment limit such holograms to both static and small-scale scenes [2]. In order to realize the dynamic holographic 3D reconstruction of real scenes, the CGH is the most effective method. CGH is a method of digitally generating holographic interference patterns from 3D objects in which optical technology is used to reconstruct the images of objects [3]. First of all, the real object should be digitized. Digital methods include point-by-point scanning, laser triangulation, structural light method, stereo vision method, computed tomography scan, etc. The original data obtained through the above methods usually take the form of a data cloud. Time is limited when repairing the point cloud model to a polygon model during real-time playback [4]. Therefore, improving the CGH mode generation method of 3D model by using the data form of point cloud is the basis of realizing real-time holographic reconstruction of real scenes. However, CGHs are hindered by slow computational speed and low reconstruction image quality due to the huge computational effort required to digitally record and display full-color 3D images.

1.2. Related Researches

Current CGH calculation is mainly divided into three methods: point cloud method, polygon-based method and depth plane method. In this paper, we focus on the acceleration of the point-cloud method. It takes a long time to generate a hologram based on the point cloud method because it has to compute a sub-hologram from each point of the point cloud, which requires substantial computation. Many methods have been proposed to reduce computation time to move closer to real-time computation [5,6,7,8]. The first is the look-up table (LUT) method [5], where fringe patterns (FPs) of all possible object points are pre-calculated and stored in a table; however, this requires a large amount of memory and cannot effectively reduce the computational complexity. On the basis of LUT, scholars have successively proposed split look-up table method [6], compressed look-up table (C-LUT) method [7] and accurate compressed look-up table method [8], but their memory usage is still very large.
Wavefront-recording plane (WRP) is another method to realize fast CGH calculation. This method is divided into two steps. The first step is to record the spherical waves emitted from 3D objects on the WRP. The second step is to calculate the diffraction from WRP to CGH based on the fast Fourier transform (FFT) [9]. The calculation time is reduced because the light field is generated on the WRP rather than directly on the CGH plane. The scholars first studied the acceleration of the first step [4,10,11,12,13,14,15,16]. Scholars A. Phan et al., proposed a method of generation speed and reconstructed im-age quality enhancement of a long-depth object using double wavefront recording planes and a GPU [14], which overcomes the defect of increasing calculation time in WRP. Takashi et al., proposed a method to calculate holograms from line-drawn objects at layers of different depths without FFT. However, the objects are relatively simple and the reconstruction quality is limited [4].
The scholars then studied the acceleration of the second step. We utilize the diffraction theory to calculate the light field of the light in the digital data of the three-dimensional scene on the hologram plane. Although the dimension reduces from 3D object to 2D hologram plane, the calculated light field still contains the 3D information of the recorded 3D scene [17]. In general, Fresnel diffraction, Rayleigh–Sommerfeld diffraction, and Fourier transform can be used to record and reconstruct light fields.
However, the high demand for reconstruction quality keeps increasing the requirement for CGH’s resolution and computational complexity. Even simple 3D images require a large amount of computational time. In order to improve the speed, researchers approximate Rayleigh–Sommerfeld diffraction. A fast-Fourier-transform-based numerical integration method for the Rayleigh–Sommerfeld diffraction formula has been proposed by Fabin Shen et al. [18]. Although this method improves the calculation speed to some extent, it is not suitable for the case with more sampling points, which sacrifices the image accuracy to a certain extent. In order to restore the color information, scholars have conducted a lot of research. A full-color holographic display with enhanced image quality by the iterative angular-spectrum method using a single-phase hologram was proposed by scholars Zehao He et al., The convolution error is considered and eliminated during the iteration [19]. However, the study does not consider the computational speed comprehensively; thus, there is still a considerable distance from real-time implementation.
Scholars NI CHEN et al., have proposed a method of approximating the angular spectrum diffraction formula by extending the exponential term in the diffraction convolution kernel through Taylor expansion, so as to obtain similar numerical accuracy with less bit formats (e.g., single-precision floating-point data type). This reduces the required computational memory by half compared to the usual double-precision floating-point data type and, thus, significantly reduces the running time [20]. However, this method is only limited to 2D black and white images and cannot truly restore the col-or information of real objects.

1.3. Research of Our Paper

In order to speed up the calculation, scholars have conducted a lot of research. The authors once proposed a multi-camera holographic system based on heterogeneous sampled two-dimensional images and compressed point cloud grid (C-PCG). Compared with the traditional wavefront recording plane method, the quality of the recon-structed images is significantly improved and the computational complexity is greatly reduced [21]. In order to improve the quality of reconstruction, the author also proposed a holographic system based on multi-depth camera, which uses efficient depth grid to represent real three-dimensional objects, so as to flexibly and effectively obtain full-color reconstruction images [22]. Zhao et al., have proposed an angular-spectrum layer-oriented method to generate CGHs of 3D scenes [23]. Moreover, a novel layer-based CGH calculation using layer classification and occlusion culling for the 3D object was proposed by Su et al. [24]. However, neither of these approaches is oriented towards the actual objects. They are limited to computer-synthesized images of virtual 3D objects. Our method is based on the point cloud grid algorithm for actual objects, which actually adds the transformation from point cloud to layer. The kernel is layer to layer transformation, and uses the Fourier transform similar to that of the WRP method. Our method is optimized for the resolution of the holograms required for the transformation from point cloud to grid for optical reconstruction.
Based on the hybrid Taylor Rayleigh–Sommerfeld diffraction algorithm proposed by CHEN et al., and the author’s previous research on full-color holographic systems, we propose a method called Taylor Rayleigh–Sommerfeld point cloud grid (TR-PCG) for Taylor expansion of the Rayleigh–Sommerfeld diffraction to reduce the computational complexity based on a full-color holographic display system in this paper. The method proposed by CHEN can only be used for 2D image reconstruction and quality improvement. We took her ideas and made improvements based on our original PCG approach, which effectively increased speed while maintaining quality. Our approach is primarily based on 3D reconstruction of real objects. We first process the collected point cloud grid by dividing the red, green, and blue channels, then combine fast Fourier transform (FFT) with Taylor expansion for the radial values in the convolution, which retains the quadratic term. Meanwhile, we modify the data type, which means changing the double-precision floating-point number to a single-precision floating-point number, thus obtaining similar numerical accuracy in a less-bit format. Under the guarantee of sufficient reconstruction quality, our method significantly improves the reconstruction speed by about 20%. We have verified the effectiveness of the algorithm through simulation experiments. It not only overcomes the deficiency that the reconstructed images of some acceleration algorithms are limited to monochrome images, but also effectively improves the calculation speed based on ensuring the reconstruction quality, and the resolution is improved to 2048 × 2048. We speed up the calculation speed of the hologram generation stage and ensure the quality of the full-color reconstructed images, which further improves the performance of the system.

2. Introduction to Full-Color Holographic System Module

The full-color holographic system is divided into four stages: acquisition, preprocessing, hologram generation, and reconstruction. The system is shown in Figure 1.
In the first stage, we use the Kinect depth camera to collect color and depth information of objects, thus generating a 3D point cloud model. The creation of a point cloud can be seen as a sampling of a continuous surface, where the spherical waves from each point source are superimposed on the hologram plane. Due to the relatively large amount of data directly collected from 3D objects, redundant information should be filtered in this step, namely, salient object detection [25].
In the second stage, the collected color and depth information is pre-processed. For the 3D point cloud model, it is separated into red, green, and blue channels by depth-layer weighted prediction.
In the third stage, the color component values are characterized based on the depth information of real objects to generate effective depth grids. Each object is composed of different grids, which contains color information of different R/G/B channels. The fast Fourier transform calculates the grid of different channels to generate the hologram.
At this stage, our algorithm performs Taylor expansion of the radial value r in the convolution-based on Rayleigh–Sommerfeld diffraction, thus effectively improving the computational speed of hologram generation while ensuring the reconstruction quality in an acceptable range.
The fourth stage is the full-color reconstruction module. Fresnel diffraction is used to calculate the propagation of light waves in the near-field region to clearly reconstruct real 3D objects.

3. Theoretical Derivation of the TR-PCG Algorithm

The point cloud grid method generally consists of three steps. First, the depth camera captures point clouds containing depth information. Next, each point of the same depth is matched with a depth grid node; that is, each depth grid contains all points at the same depth. Finally, according to the coordinates of each layer in the generated grid, diffraction calculation is carried out for each layer with FFT, and the final CGH is obtained.
Therefore, on the basis of PCG, we propose TR-PCG; the steps are as follows.
First is the sampling stage, which samples the object’s light field. The depth camera is used to obtain both depth and color information from the real scene, from which the full-color point cloud model is extracted.
When sampling, we need to consider how many sample points should be used for objects and holograms, which means the resolution requirement. We need to match the size of the grid transformed from the obtained point cloud with the size of the holographic plane. Therefore, although the object is a real object, the information obtained after collection can be scaled, so can the final generated hologram. Spatial light modulator resolution size is 2048 × 2048, each pixel interval is fixed. We match the size of the object to the resolution of the spatial light modulator. The resolution is whatever the grid is. Here, we define 1 X and 1 Y as the distances between the items in the spectrum of the sampled data in the f X and f Y directions, respectively. In fact, the size of the object determines the bandwidth of the light field on the hologram surface, which, in turn, determines the number of samples required for the light field on the hologram surface.
The resolution of normal holographic elements is 1920 × 1080. According to the formula, as long as the number of sampling points is not less than 960 × 960, the sampling requirement can be satisfied. The number of sampling points in this paper is more than 1000 × 1000, which can certainly meet the requirements of sampling frequency.
The following is the hologram generation stage. An FFT is performed on each grid to calculate the diffraction and obtain three computer generation holograms, one for each of the red, green, and blue channels. It is necessary to calculate the complex value of the light field at each sampling point. We perform Taylor expansion for the radial value r in the convolution based on FFT to realize relatively high-speed discrete Fourier transform of the object light field. The result is a set of discrete sample values of the complex light field, while both an amplitude and a phase are at each sample point.
In the 3D Cartesian coordinate system, we assume that the wave propagates along the z-axis, so the two-dimensional plane is r = ( x , y ) . When the propagation distance is z , the initial field becomes a new field according to the following formula:
u ( r , z ) = u ( r , 0 ) h ( r , z ) ,
where u ( r , z ) is the new field, u ( r , 0 ) is the initial field, and h ( r , z ) is the point spread function.
Convolution in the spatial domain is equivalent to multiplication in the spatial spectrum domain:
u ( r , z ) = F 1 ( F ( u ( r , z 0 ) ) × F ( h ( r , z ) ) ) ,
where F / F 1 is the Fourier forward/inverse transform, z 0 represents the initial position of the object on the z-axis.
According to the sampling relationship in the sampling step, we obtain the sampling frequency f X and f Y :
f X = 1 N X × s a m _ i n t ,
f Y = 1 N Y × s a m _ i n t ,
where N X and N Y are the number of sampling points and s a m _ i n t is the sampling interval.
We improve the computational efficiency by using FFT. Holograms of the three channels are generated by using 2D FFT on the depth grids. The total computation time can be effectively reduced by computing the hologram from a 2D multi-depth grid rather than a single point in a 3D point cloud. Then computer generated holograms can be obtained by performing the light-field diffraction calculation in each layer:
U M ( f X , f Y ) = F [ U ( x , y ) ] ,
where f X and f Y are the frequencies in the spatial spectrum domain, U ( x , y ) is the object field in the spatial domain.
According to the geometric relationship, the radial value r in the spatial domain satisfies the following formula:
r = ( f X 2 + f Y 2 ) × ( λ p p h ) 2 ,
where f X and f Y are the frequencies in the spatial spectrum domain, λ is the wavelength and p p h is the spacing of pixels.
According to the Rayleigh–Sommerfeld diffraction formula, the point spread function h ( r , z ) is:
h ( r , z ) = 1 2 π z r ( 1 j k r ) r 2 exp ( j k r ) ,
where the radial value r = | r | , the vector r = ( x , y , z ) and k is the wave vector.
Here we use single-precision floating-point numbers. However, pure single-precision diffraction may lead to inaccurate results due to phase error. Therefore, for the single-precision floating-point numbers, by proper Taylor expansion of the radial value r in the fast Fourier transform and mixing with the angular spectral diffraction (ASM), we can achieve a relatively accurate and fast numerical diffraction propagation.
The single-channel data need to be looped separately. The red channel is used as an example, and the same goes for the green and blue channels.
Fourier transform is applied to the point spread function h to obtain the transfer function H in the spatial spectrum domain, as shown in the following formula:
H = exp ( j k 1 d 1 ) exp ( j π λ d 1 r ) ,
where k 1 is the wave vector of the red wave, λ is the wavelength of the red wave and d 1 is as shown in the following equation:
d 1 = d C u t × s a m _ i n t 2 ,
where d is the distance to generate the hologram, s a m _ i n t is the sampling interval and C u t is the segmented point cloud grids.
Furthermore, r is as follows:
r = 1 | ρ | 2 ( λ p p h ) 2 1
where | ρ | 2 = ( f X 2 + f Y 2 ) .
For convenience, here we define r as follows:
r = ( f X 2 + f Y 2 ) × ( λ p p h ) 2
Therefore, the relationship between r and r is:
r = 1 r 1
According to the Taylor expansion formula:
1 x 2 = 1 x 2 2 x 4 8 +
r in Equation (12) and x 2 in Equation (13) are equivalent, so r is expanded as follows:
r = 1 r 1 = 1 r 2 ( r ) 2 8 1 = r 2 ( r ) 2 8
According to the findings of the experiment, the reconstruction image with shorter computation time and higher quality can be obtained when retaining to the quadratic term. When retaining to the cubic term, the reconstruction quality is similar to that of the quadratic term. Relative to the increase in reconstruction time, the reconstruction quality is not significantly improved.
The above steps make Fourier transform for both the two-dimensional information obtained from the original image and the point spread function h , and the results are, respectively, U M ( f X , f Y ) and H . The purpose is to convert the convolution operation in the spatial domain into the multiplication operation in the spatial spectrum domain and reduce computational complexity. Moreover, since we need the results in the spatial domain, we should take inverse Fourier transform of the answer in the spatial spectrum domain. The final result is shown in the following equation:
H D e p t h   g r i d   N = F 1 U M ( f X , f Y ) × H ,
where H D e p t h   g r i d   N represents the hologram of the depth grids in channel X ( X = red/green/blue); U M ( f X , f Y ) is the optical field information of channels red, green and blue; and H is the angular spectrum.
Finally, the hologram H o l is obtained by superposition:
H o l = H D e p t h   g r i d   1 + H D e p t h   g r i d   2 + + H D e p t h   g r i d   N ,
At this point, the loop body ends. After all the loops are finished, the resulting hologram H o l is finally obtained.
The hologram reconstruction stage proceeds below. Appropriate coding forms need to be selected to convert them into forms suitable for representation on the holographic screen. We chose Fresnel diffraction.
Fresnel diffraction is utilized to reconstruct the phase hologram. In Fresnel diffraction, the formula of H F is as follows:
H F = exp ( j k z ) exp ( j π λ d 2 ( x 2 + y 2 ) ) ,
where d 2 is the reconstruction distance, k is the wave vector and both x and y are square arrays formed by the sampling points.
All three channels, R, G, and B, are processed according to the above steps, which can respectively generate monochrome holograms of the depth grids.
The results obtained from the above three channels are quantified and then combined to obtain the final full-color holographic reconstruction image with considerable quality. Figure 2 shows the whole process of TR-PCG.

4. Experiments and Results

In order to verify the validity of Taylor expansion in the proposed method, we remove Taylor expansion on the basis of TR-PCG and call this method the Rayleigh–Sommerfeld PCG method without Taylor expansion (RS-PCG). Therefore, in our paper, the proposed TR-PCG algorithm is compared with the WRP, the traditional PCG algorithm, the C-PCG, and the RS-PCG. The reconstruction quality of several methods is compared by the Peak Signal to Noise Ratio (PSNR) algorithm. We use the Kinect depth camera to collect depth and color information of the object, conduct simulation experiments in MATLAB 2022 and run them on the PC of Windows 11 64 bit.
We verify the effectiveness of the proposed method through simulation experiments. The resolutions of the experimental holograms are set as 1024 × 1024 and 2028 × 2048, the pixel spacing is set as 7.4μm and the wavelengths of red, green, and blue light are set at 633 nm, 532 nm, and 473 nm, respectively. We collect several groups of data named as beibei_nini, person with beibei, person with dragon, dragon and person with nini as our experimental object.
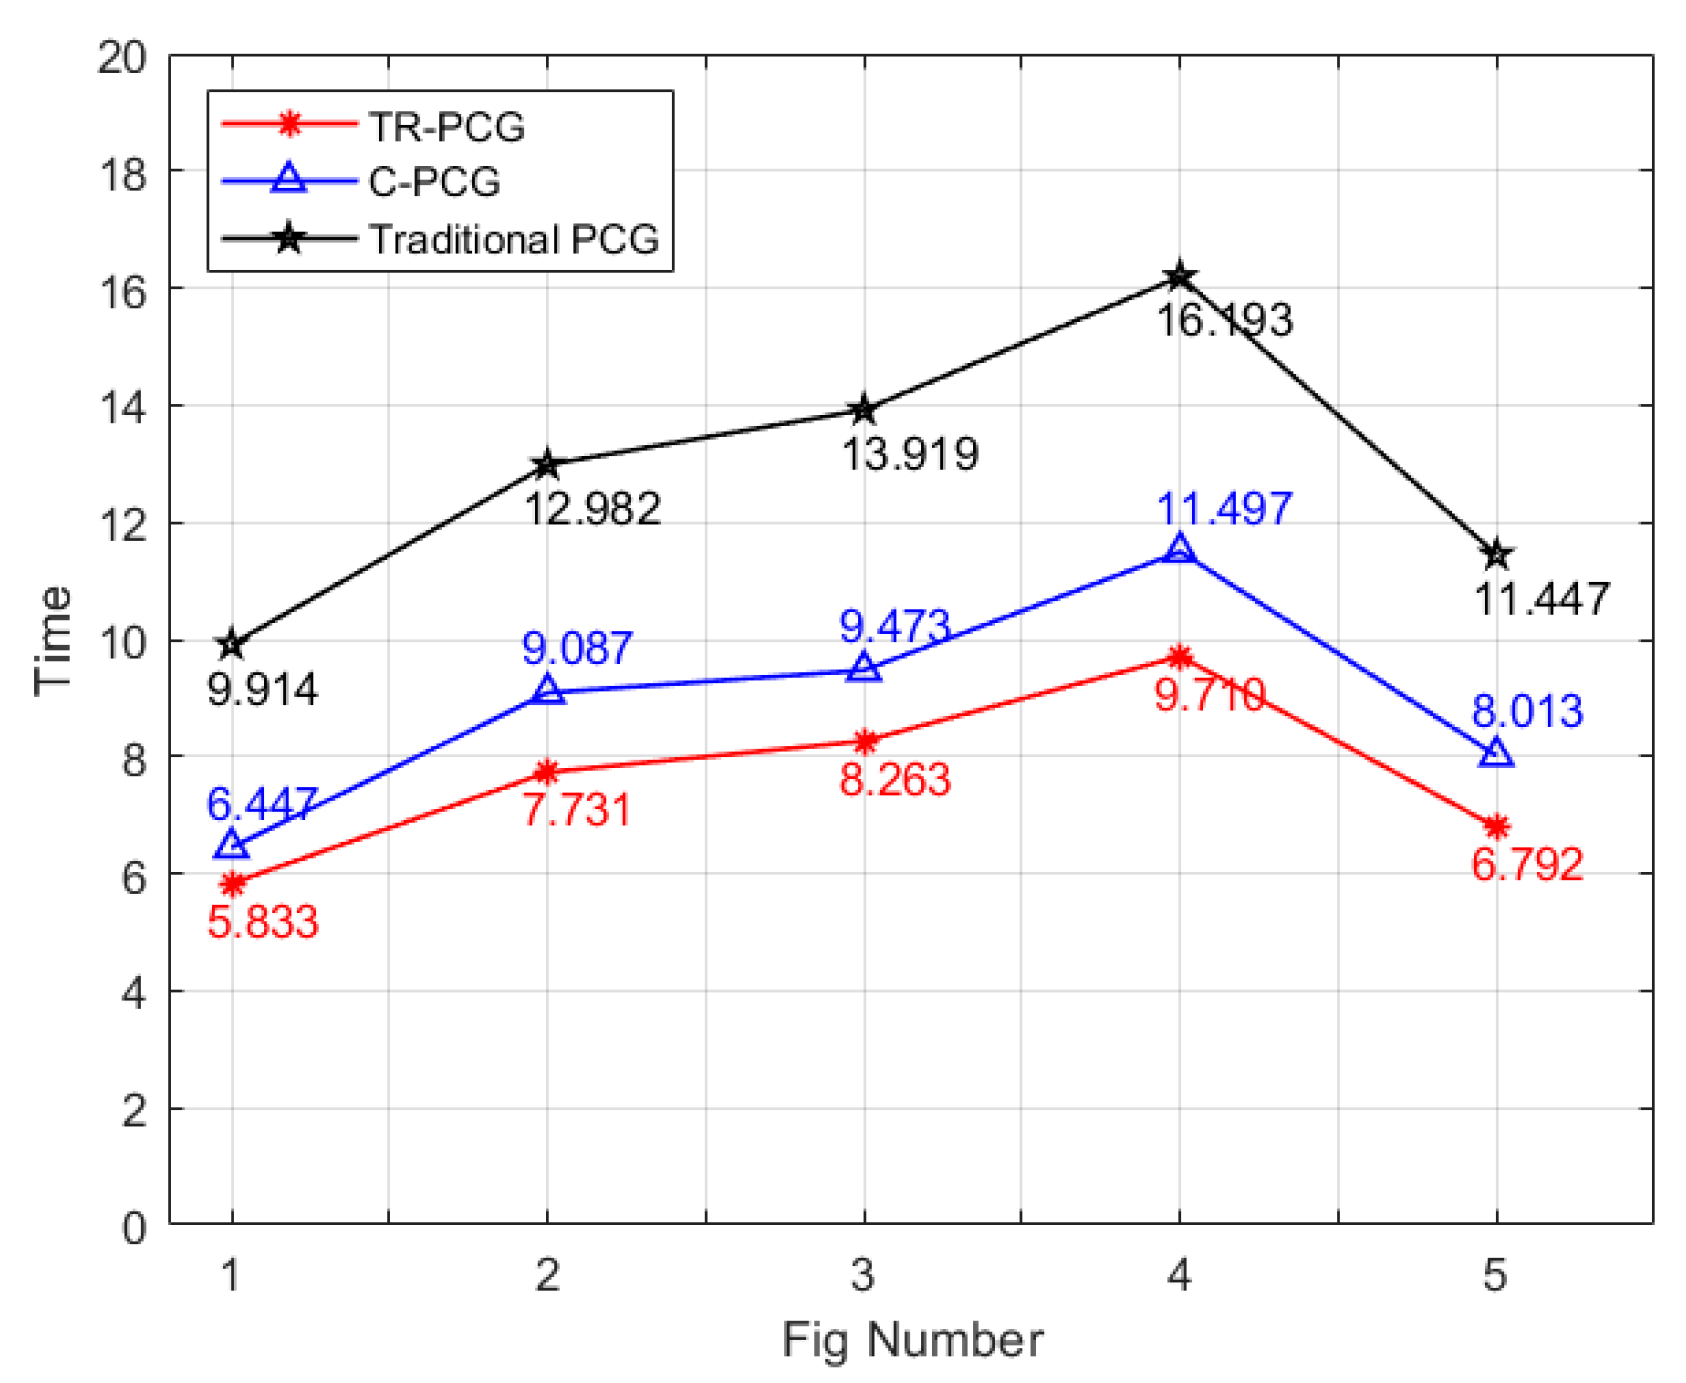
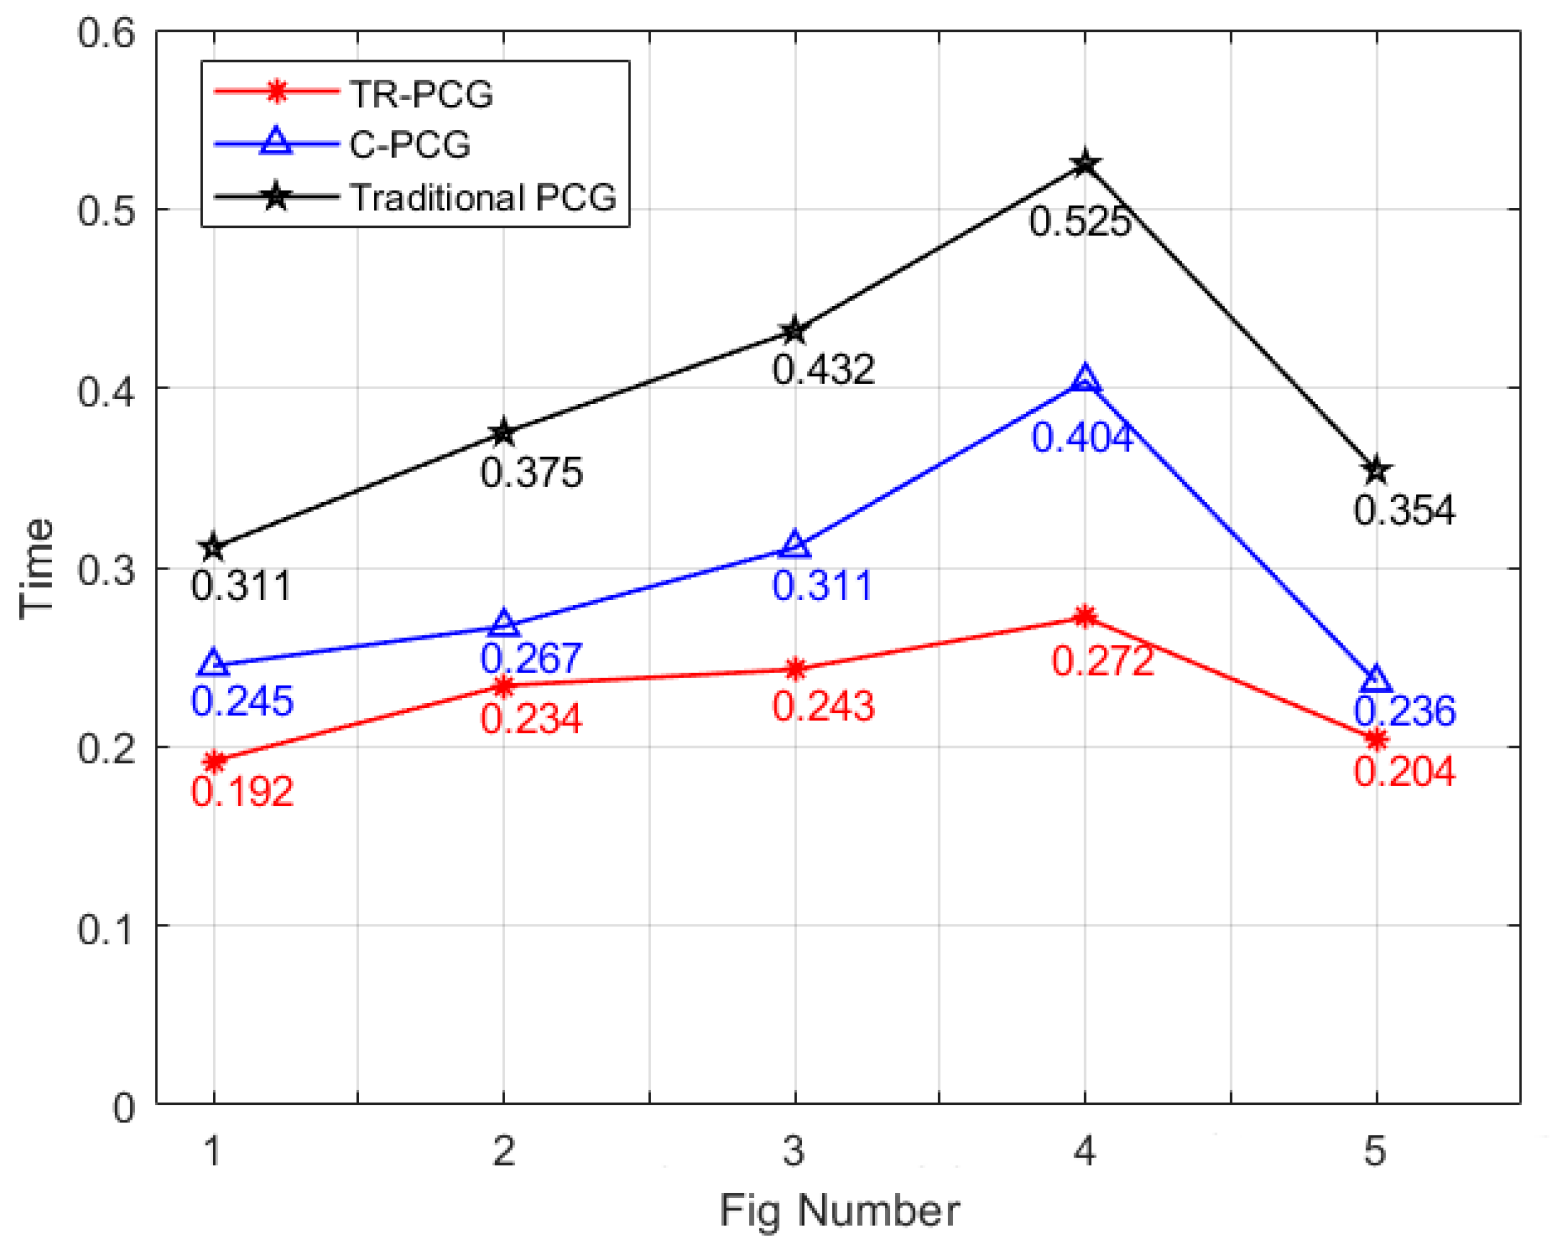
Table 1 compares the CPU and GPU calculation time of WRP, traditional PCG, C-PCG, RS-PCG, and TR-PCG at 1024 × 1024 resolution.
Figure 3 and Figure 4 compares the CPU and GPU calculation time of traditional PCG, C-PCG, and TR-PCG at 1024 × 1024 resolution.
As can be seen in Table 1 and Figure 3 and Figure 4, when the resolution is 1024 × 1024, compared with the WRP, the speed of TR-PCG is increased by over 90%. Compared with the traditional PCG, the speed of TR-PCG is increased by about 40%. Compared with the C-PCG, the speed of TR-PCG is improved by about 15–20%. Compared with the RS-PCG, the speed of TR-PCG is improved by about 25%.
Table 2 shows the CPU and GPU calculation time of traditional PCG, C-PCG, RS-PCG, and TR-PCG at 2048 × 2048 resolution.
Figure 5 and Figure 6 compares the CPU and GPU calculation time of traditional PCG, C-PCG and TR-PCG at 2048 × 2048 resolution.
As can be seen in Table 2 and Figure 5 and Figure 6, when the resolution is 2048 × 2048, compared with the traditional PCG, the speed of TR-PCG is increased by about 40%. Compared with the C-PCG, the speed of TR-PCG is improved by about 20–30%. Compared with the RS-PCG, the speed of TR-PCG is improved by about 30%. Compared with 1024 × 1024 resolution, the overall speed is somewhat slower. However, TR-PCG has a significant speed increase over the other three methods. Actually, from the Table 1 and Table 2 and Figure 3, Figure 4, Figure 5 and Figure 6, we find that RS-PCG improves the speed by about 1.3 times while TR-PCG improves the speed by about 1.7 times. Therefore, it is obvious that Taylor expansion contributes more than single-precision.
Figure 7 shows the reconstructed images of the three methods when the diffraction distance is 24.85 cm and the resolution is 2048 × 2048. From left to right are the original image and reconstructed images of traditional PCG, C-PCG, RS-PCG, and TR-PCG. The peak signal-to-noise ratio is the logarithm of the mean square error between the original image and the processed image relative to the square of the maximum value of the signal. In order to measure the image quality after processing, we often refer to the PSNR value to measure whether a processing program is satisfactory. The PSNRs of the reconstructed images are shown in Figure 7b–e.
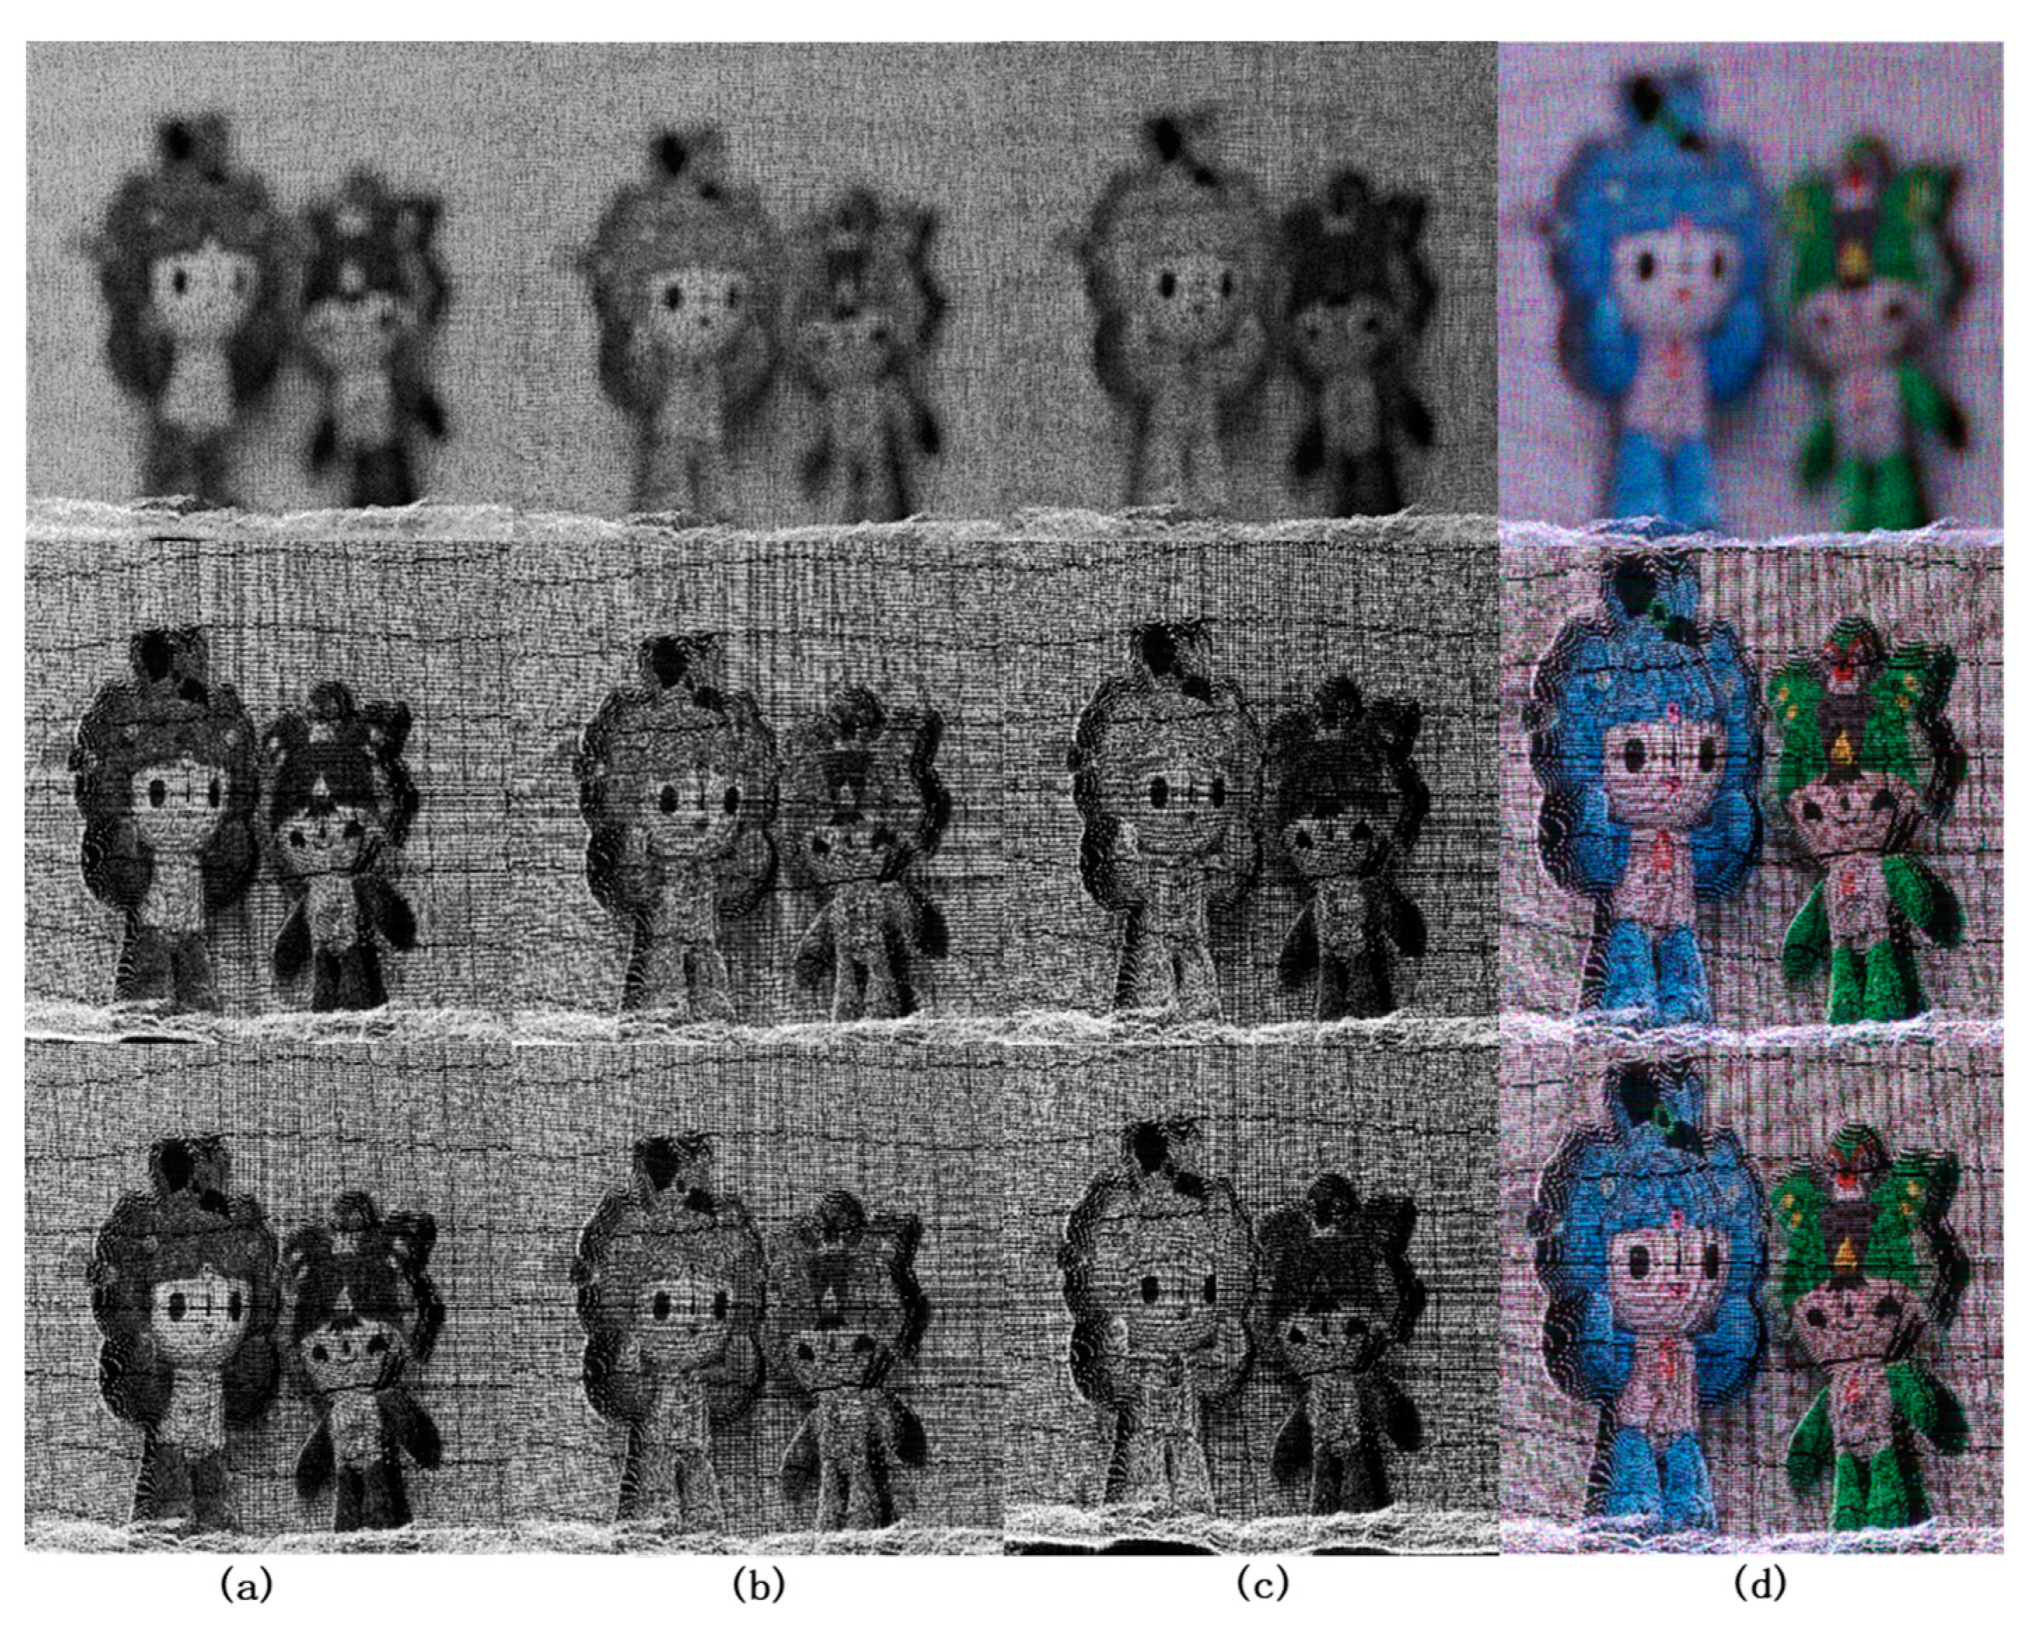
Figure 8 shows holograms generated by R, G, and B channels and reconstructed images of a set of point cloud data when the diffraction distance is 24.95 cm. From top to bottom are holograms of the R, G, and B channels and a full-color reconstructed image.
As can be seen from Figure 7, the reconstructed image quality of TR-PCG is a little different from that of traditional PCG, C-PCG, and RS-PCG. Compared with the case of 1024 × 1024 resolution, the image quality is improved. Considering the speed and quality, it is acceptable. The PSNRs of traditional PCG method are shown in Figure 7b; the PSNRs are 17.38, 18.18, 17.42, 16.78, and 17.44 dB, respectively. The PSNRs of C-PCG method are shown in Figure 7c; the PSNRs are 17.14, 17.42, 17.87, 16.03, and 17.10 dB, respectively. The PSNRs of RS-PCG method are shown in Figure 7d; the PSNRs are 17.56, 17.84, 18.01, 16.05, and 16.98 dB, respectively. As shown in Figure 7e, the PSNRs of the reconstructed images using the proposed TR-PCG method are 17.50, 17.56, 17.65, 16.14, and 17.13 dB, respectively. Currently, there are no accurate evaluation criteria for 3D images, so we adopted PSNR in 2D images as the evaluation criteria. PSNR uses point clouds to make comparison with reconstructed images; therefore, while the reconstruction image has focal points, PSNR can only reflect the reconstruction quality to a certain extent, which means it can only be a reference. During the experiment, we found little fluctuating PSNR of these methods; that is, the Taylor expansion method we used did not have a large impact on the image quality.

5. Conclusions

We propose a full-color holographic display system based on the Hybrid Taylor Rayleigh–Sommerfeld diffraction algorithm. Under the guarantee of reconstruction of the color and position information of real objects, we make Taylor expansion for the radial value in the Rayleigh–Sommerfeld diffraction while combining with fast Fourier transform. Moreover, we change the data type. Thus, on the premise of ensuring the quality of image reconstruction, the computing speed can be effectively improved. At the same time, RS-PCG is single-precision only. Compared to TR-PCG with single-precision and Taylor expansion, we find that Taylor expansion contributes much more to acceleration than single-precision. In our paper, the image resolution reaches 2048 × 2048, and the increase rate of this method is over 90% higher than WRP, about 40% higher than the traditional PCG, about 20% higher than C-PCG, and about 30% higher than the RS-PCG. The feasibility and effectiveness of the proposed method are verified by simulation experiments. This will promote the development of full-color holographic reconstruction technology and reduce the consumption of hardware resources.

Author Contributions

Conceptualization, Q.Y. and Y.Z.; methodology, Q.Y. and Y.Z.; software, Q.Y.; validation, Q.Y. and Y.Z.; formal analysis, Q.Y.; investigation, J.B. and J.J.; resources, Q.Y. and Y.Z.; data curation, Q.Y.; writing—original draft preparation, Q.Y. and Y.Z.; writing—review and editing, W.L.; visualization, Q.Y.; supervision, Y.Z.; project administration, Y.Z.; funding acquisition, Y.Z. All authors have read and agreed to the published version of the manuscript.

Funding

This research was funded by National Natural Science Foundation of China, grant number No.62205283. This research was funded by Natural Science Foundation of Jiangsu Province, grant number No. BK20200921. This research was funded by China Postdoctoral Science Foundation, grant number No.2022M712697. This research was funded by Natural Science Research of the Jiangsu Higher Education Institutions of China, grant number No. 20KJB510024.

Informed Consent Statement

Informed consent was obtained from all subjects involved in the study. Written informed consent has been obtained from the patient(s) to publish this paper.

Data Availability Statement

Data underlying the results presented in this paper are not publicly available at this time but may be obtained from the authors upon reasonable request.

Acknowledgments

Authors thank all those who provided help for us for their great support with the experiments.

Conflicts of Interest

The authors declare no conflict of interest.

References

  1. Cao, L.C.; He, Z.H.; Liu, K.X.; Sui, X.M. Progress and challenges in dynamic holographic 3D display for the metaverse. Infrared Laser Eng. 2022, 51, 267–281. [Google Scholar]
  2. Sahin, E.; Stoykova, E.; Makinen, J.; Gotchev, A. Computer-Generated Holograms for 3D Imaging: A Survey. ACM Comput. Surv. (CSUR) 2020, 53, 1–35. [Google Scholar] [CrossRef] [Green Version]
  3. Zhao, Y.; Shi, C.X.; Kwon, K.C.; Piao, Y.L.; Piao, M.L.; Kim, N. Fast calculation method of computer-generated hologram using a depth camera with point cloud gridding. Opt. Commun. 2018, 411, 166–169. [Google Scholar] [CrossRef]
  4. Nishitsuji, T.; Shimobaba, T.; Kakue, T.; Ito, T. Fast calculation of computer-generated hologram of line-drawn objects without FFT. Opt. Express 2020, 28, 15907–15924. [Google Scholar] [CrossRef] [PubMed]
  5. Lucente, M.E. Interactive computation of holograms using a look-up table. J. Electron. Imaging 1993, 2, 28–34. [Google Scholar] [CrossRef]
  6. Pan, Y.C.; Xu, X.W.; Solanki, S.; Liang, X.N.; Tanjung, R.B.A.; Tan, C.W.; Chong, T.C. Fast CGH computation using S-LUT on GPU. Opt. Express 2009, 17, 18543–18555. [Google Scholar] [CrossRef] [PubMed]
  7. Jia, J.; Wang, Y.T.; Liu, J.; Li, X.; Pan, Y.J.; Sun, Z.M.; Zhang, B.; Zhao, Q.; Jiang, W. Reducing the memory usage for effective computer-generated hologram calculation using compressed look-up table in full-color holographic display. Appl. Opt. 2013, 52, 1404–1412. [Google Scholar] [CrossRef] [PubMed]
  8. Gao, C.; Liu, J.; Xue, G.L.; Jia, J.; Wang, Y.T. Accurate compressed look up table method for CGH in 3D holographic display. Opt. Express 2015, 23, 33194–33204. [Google Scholar] [CrossRef]
  9. Pi, D.P.; Liu, J.; Han, Y.; Yu, S.; Xiang, N. Acceleration of computer-generated hologram using wavefront-recording plane and look-up table in three-dimensional holographic display. Opt. Express 2020, 28, 9833–9841. [Google Scholar] [CrossRef]
  10. Shimobaba, T.; Masuda, N.; Ito, T. Simple and fast calculation algorithm for computer-generated hologram with wavefront recording plane. Opt. Lett. 2009, 34, 3133–3135. [Google Scholar] [CrossRef]
  11. Zhao, Y.; Piao, M.L.; Li, G.; Kim, N. Fast calculation method of computer-generated cylindrical hologram using wave-front recording surface. Opt. Lett. 2015, 40, 3017–3020. [Google Scholar] [CrossRef] [PubMed]
  12. Islam, M.S.; Piao, Y.L.; Zhao, Y.; Kwon, K.C.; Cho, E.; Kim, N. Max-depth-range technique for faster full-color hologram generation. Appl. Opt. 2020, 59, 3156–3164. [Google Scholar] [CrossRef] [PubMed]
  13. Piao, Y.L.; Erdenebat, M.U.; Zhao, Y.; Kwon, K.C.; Kim, N. Improving the quality of full-color holographic three dimensional displays using depth related multiple wavefront recording planes with uniform active areas. Appl. Opt. 2020, 59, 5179–5188. [Google Scholar] [CrossRef] [PubMed]
  14. Phan, A.H.; Piao, M.L.; Gil, S.K.; Kim, N. Generation speed and reconstructed image quality enhancement of a long-depth object using double wavefront recording planes and a GPU. Appl. Opt. 2014, 53, 4817–4824. [Google Scholar] [CrossRef] [PubMed]
  15. Wei, L.J.; Okuyama, F.; Sakamoto, Y.J. Fast calculation method with saccade suppression for a computer-generated hologram based on Fresnel zone plate limitation. Opt. Express 2020, 28, 13368–13383. [Google Scholar] [CrossRef] [PubMed]
  16. Zhang, H.; Cao, L.C.; Jin, G.F. Scaling of Three-Dimensional Computer-Generated Holograms with Layer-Based Shifted Fresnel Diffraction. Appl. Sci. 2019, 9, 2118. [Google Scholar] [CrossRef] [Green Version]
  17. Park, J.H. Recent progress in computer-generated holography for three-dimensional scenes. J. Inf. Disp. 2017, 18, 1–12. [Google Scholar] [CrossRef] [Green Version]
  18. Shen, F.B.; Wang, A.B. Fast-Fourier-transform based numerical integration method for the Rayleigh-Sommerfeld diffraction formula. Appl. Opt. 2006, 45, 1102–1110. [Google Scholar] [CrossRef]
  19. He, Z.H.; Liu, K.X.; Sui, X.M.; Cao, L.C. Full-Color Holographic Display with Enhanced Image Quality by Iterative Angular-Spectrum Method. In Proceedings of the Digital Holography and Three-Dimensional Imaging 2022, Cambridge, UK, 1–4 August 2022. [Google Scholar]
  20. Chen, N.; Wang, C.L.; Heidrich, W. HTRSD: Hybrid Taylor Rayleigh-Sommerfeld diffraction. Opt. Express 2022, 30, 37727–37735. [Google Scholar] [CrossRef]
  21. Zhao, Y.; Kwon, K.C.; Erdenebat, M.U.; Jeon, S.H.; Piao, M.L.; Kim, N. Implementation of full-color holographic system using non-uniformly sampled 2D images and compressed point cloud gridding. Opt. Express 2019, 27, 29746–29758. [Google Scholar] [CrossRef]
  22. Zhao, Y.; Erdenebat, M.U.; Alam, M.S.; Piao, M.L.; Jeon, S.H.; Kim, N. Multiple-camera holographic system featuring efficient depth grids for representation of real 3D objects. Appl. Opt. 2019, 58, A242–A250. [Google Scholar] [CrossRef] [PubMed]
  23. Zhao, Y.; Cao, L.; Zhang, H.; Kong, D.; Jin, G. Accurate calculation of computer-generated holograms using angular-spectrum layer-oriented method. Opt. Express 2015, 23, 25440–25449. [Google Scholar] [CrossRef] [PubMed]
  24. Zhao, Y.; Cao, L.; Zhang, H.; Tan, W.; Wu, S.; Wang, Z.; Jin, G. Time-division multiplexing holographic display using angu-lar-spectrum layer-oriented method. Chin. Opt. Lett. 2016, 14, 16–20. [Google Scholar]
  25. Zhao, Y.; Bu, J.W.; Liu, W.; Ji, J.H.; Yang, Q.H.; Lin, S.F. Implementation of a full-color holographic system using RGB-D Salient Object Detection and Divided point cloud gridding. Opt. Express 2023, 31, 1641–1655. [Google Scholar] [CrossRef] [PubMed]
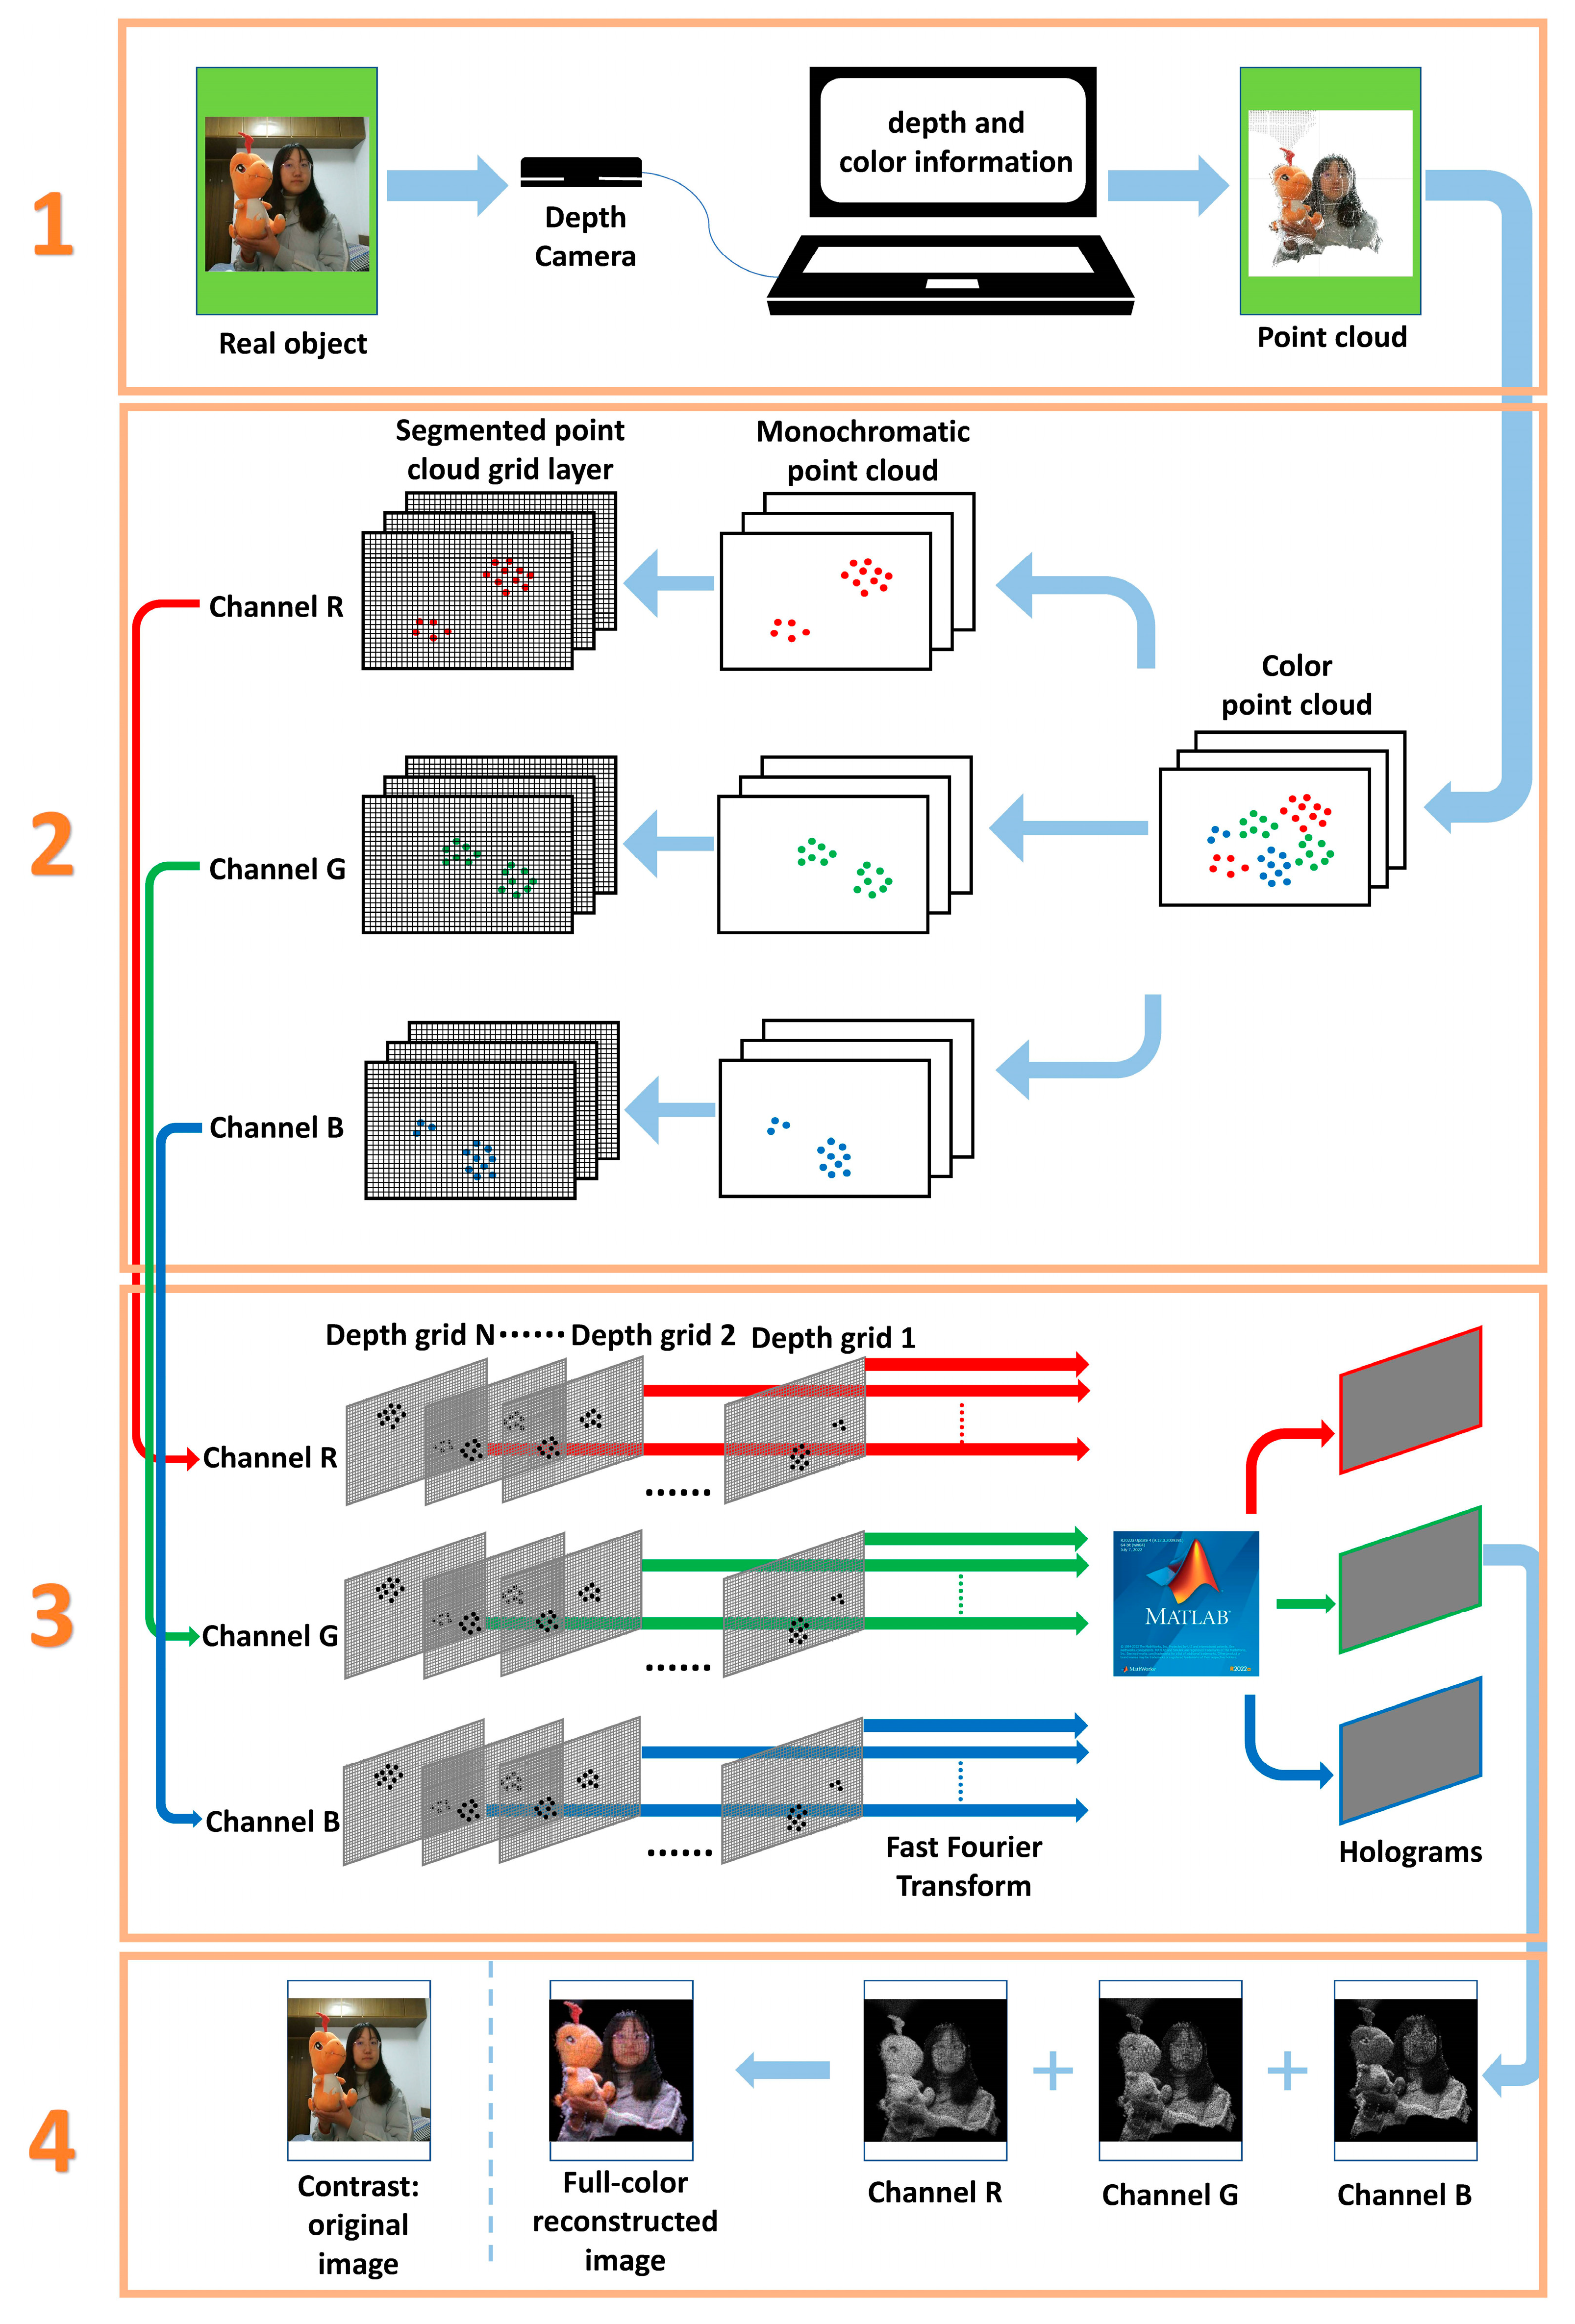
Figure 1. Schematic diagram of full-color holographic system.
Applsci 13 04466 g001
Figure 2. Schematic diagram of TR-PCG.
Applsci 13 04466 g002
Figure 3. Comparison of CPU calculation time between traditional PCG, C-PCG, and TR-PCG when resolution is 1024 × 1024.
Applsci 13 04466 g003
Figure 4. Comparison of GPU calculation time between traditional PCG, C-PCG, and TR-PCG when resolution is 1024 × 1024.
Applsci 13 04466 g004
Figure 5. Comparison of CPU calculation time between traditional PCG, C-PCG, and TR-PCG when resolution is 2048 × 2048.
Applsci 13 04466 g005
Figure 6. Comparison of GPU calculation time between traditional PCG, C-PCG, and TR-PCG when resolution is 2048 × 2048.
Applsci 13 04466 g006
Figure 7. (a) Color images; Reconstructed images of (b) traditional PCG, (c) C-PCG, (d) RS-PCG, and (e) TR-PCG when the diffraction distance is 24.85 cm and the resolution is 2048 × 2048.
Applsci 13 04466 g007
Figure 8. Holograms of (a) channel R, (b) channel G, (c) channel B, and (d) full-color reconstructed image of traditional PCG, C-PCG, RS-PCG, and TR-PCG.
Applsci 13 04466 g008
Table 1. Comparison of CPU and GPU calculation time of holographic system when resolution is 1024 × 1024. Running time is measured in seconds.
ObjectCPU Running Time
NameNumber of pointsNumber of layersWRPTraditional PCGC-PCGRS-PCGTR-PCG
beibei_nini1,273,82435015,125.5339.9146.4477.8155.833
person with beibei694,2694669372.06412.9829.08710.0807.731
person with dragon671,4275008996.60113.9199.47310.9148.263
dragon481,8155868088.91716.19311.49712.7849.710
person with nini617,9044108523.86211.4478.0138.9636.792
ObjectGPU running time
NameNumber of pointsNumber of layersWRPTraditional PCGC-PCGRS-PCGTR-PCG
beibei_nini1,273,82435078.1620.3110.2450.2530.192
person with beibei694,26946649.3380.3750.2670.2950.234
person with dragon671,42750045.7910.4320.3110.3360.243
dragon481,81558640.9850.5250.4040.4310.272
person with nini617,90441043.2720.3540.2360.2620.204
Table 2. Comparison of CPU and GPU calculation time of holographic system when resolution is 2048 × 2048. Running time is measured in seconds.
ObjectCPU Running Time
NameNumber of pointsNumber of layersTraditional PCGC-PCGRS-PCGTR-PCG
beibei_nini1,255,02347365.85443.17154.37737.633
person with beibei726,075765105.33277.42587.36860.756
person with dragon600,759837115.25883.68995.63966.412
dragon1,240,45248667.14746.07755.38438.661
person with nini643,32969194.96271.34378.13554.530
ObjectGPU running time
NameNumber of pointsNumber of layersTraditional PCGC-PCGRS-PCGTR-PCG
beibei_nini1,255,0234732.1261.8081.8161.143
person with beibei726,0757633.4642.5712.9711.972
person with dragon600,7598364.0382.9423.3852.303
dragon1,240,4524862.3271.6481.9171.152
person with nini643,3296902.9712.0262.5321.684
Disclaimer/Publisher’s Note: The statements, opinions and data contained in all publications are solely those of the individual author(s) and contributor(s) and not of MDPI and/or the editor(s). MDPI and/or the editor(s) disclaim responsibility for any injury to people or property resulting from any ideas, methods, instructions or products referred to in the content.