Abstract
One of the main issues that has limited the use of hydrogen as an energy vector for a long time is its low energy density per unit of volume. Alternative chemical storage methods have been developed in recent years to overcome the limitations associated with compressed or liquified hydrogen storage. One of these is the Liquid Organic Hydrogen Carrier (LOHC), which utilizes organic hydrocarbons that can capture hydrogen (through an exothermic hydrogenation reaction) and release hydrogen (through an endothermic dehydrogenation reaction). In this paper, a 0D model of an internal combustion engine fueled with a mixture of hydrogen and methane was used to investigate whether the enthalpy of the exhaust gases can balance the heat rate required to self-sustain the dehydrogenation stage. Two LOHC+ compounds were considered, namely, Perhydro-dibenzyltoluene and Perhydro-N-Ethylcarbazole. Four different hydrogen-to-methane ratios were considered, assuming an engine maximum brake power ranging from 500 to 6000 RPM. An energy balance was performed, balancing the dehydrogenation heat rate and the exhaust gas cooling heat rate, in order to establish the minimum temperatures of the exhaust gases required to self-sustain the LOHC+ dehydrogenation. We demonstrated that the minimum exhaust temperatures required to self-sustain the process in different running regimes and at different hydrogen-to-methane ratios are lower than literature and experimental exhaust temperatures.
1. Introduction
Hydrogen is the first and the lightest element in the periodic table. In nature, under standard conditions, hydrogen is found in gaseous and diatomic forms (H2). Under these situations, the gas is stable, tasteless and colorless, and it has low melting and boiling temperatures (−259.2 °C and −252.9 °C, respectively) [1]. Furthermore, hydrogen molecules are highly flammable. However, following a chemical reaction in the presence of oxygen, the final product is H2O; this fact has made it possible to identify hydrogen as a possible fuel for use in large machinery or even in moving vehicles, as nowadays it is increasingly important to minimize the emissions produced. In this case, the product (water) does not pollute the environment [2].
Various methods can be used to produce hydrogen, such as the exploitation of fossil fuels rather than nuclear energy or of that obtained through renewable energy sources, which is about 5%. This percentage denotes the problem of high emissions due to the production of hydrogen, as almost 95% of production is through fossil sources, and the development of technology in the direction of renewable sources is undoubtedly a great incentive to try to adopt such production methods [2].
The density of hydrogen is decidedly low and significantly lower than diesel fuel and petrol. Therefore, large-volume systems are needed to store H2. Thanks to scientific research and the technological progress of recent years, it has been possible to achieve solutions that act directly on the pressure and temperature conditions of the storage tank. More precisely, solutions have been adopted over the years that allow for an increase in the amount of hydrogen that can be accumulated inside the tanks by exploiting, for example, very high pressures (up to the order of 70/80 MPa) or by considerably lowering the temperatures. Gaseous hydrogen storage is subjected to pressures around 70 MPa to increase density and design smaller tanks. Liquid storage follows the liquefaction of the hydrogen. In this way, the density reaches higher values than in the previous case; the percentages are around 27% compared to standard fuels of petroleum origin. These methods are valid and are in continuous development and optimization. However, it is difficult to achieve their reliable use and, at the same time, effectiveness within applications related to the automotive sector in the short term, as it would be challenging to design tanks resistant to high pressures while keeping vehicles light at a low cost. In this context, an optimal solution consists of the use of carbon fibers, which inevitably increases costs. Regarding liquid storage, the necessity to heavily insulate the liquid at the low temperatures seen previously (−253 °C) takes up too much space. It is also necessary to consider any safety problems linked to these parameters in order to envisage, for example, the use of blowoff valves rather than sensors positioned at critical points. For these reasons, alternative storage methods have also been developed recently, i.e., the so-called LOHCs (Liquid Organic Hydrogen Carriers) [3].
Within a LOHC system, a cycle takes place that initially provides for the presence of a LOHC-compound, i.e., hydrogen discharge. In the presence of H2 (for example, it can be obtained from an electrolysis process), a hydrogenation reaction occurs, in which the compound is charged and becomes LOHC+. Subsequently, another reaction occurs, known as dehydrogenation, in which the H+ ions separate from the compound and are conveyed where necessary (for example, inside a fuel cells of IC engines). At the same time, the LOHC becomes discharged and can start the cycle again, as just described. Notably, the hydrogenation reaction is exothermic, whereas the dehydrogenation reaction is endothermic [3]. Figure 1 summarizes the process of a generic LOHC system [4,5].
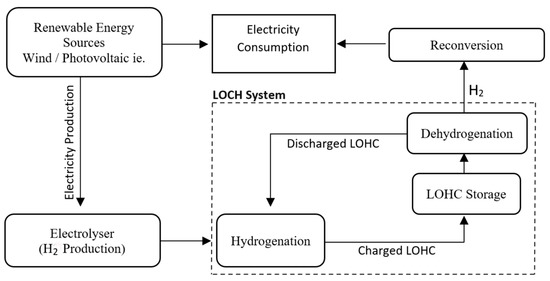
Figure 1.
Schematic view of process of LOHC system (modified from [4], consepy by [5]).
This system is easy, and it allows the accumulation of hydrogen, binding it to a compound in much higher quantities than the storage of hydrogen alone. It also allows for a reduction in the cost associated with the transport of the substance. Furthermore, the LOHC compounds are stable over time and do not undergo any particular deterioration throughout the various hydrogenation/dehydrogenation cycles.
Over the years, many studies have been carried out on different types of compounds identifiable as a LOHC, such as Benzene/Cyclohexane and Toluene/Methylcyclohexane. As far as the automotive sector is concerned, the pair Dibenzyltoluene/Perhydro-dibenzyltoluene (abbreviated as H0-DBT/H18-DBT, the first of which is discharged of hydrogen while the second is charged) arouses particular interest, as both the LOHC+ and the LOHC- are not flammable. This is essential for safety and has positive consequences for transport, favoring the movement of more significant quantities of a compound under optimal conditions and reducing costs.
Following the significant development of technology and research in recent years and considering the importance and need to produce energy by reducing emissions, vehicles equipped with alternative propulsion systems have been introduced into the market. A great advantage of the use of hydrogen as compared to batteries lies in the weight. For the propulsion of heavy vehicles (i.e., cargo), it is almost impossible and highly inconvenient to adopt batteries, as they would considerably increase the weight of the vehicles, thus significantly reducing the load capacity or the autonomy of the vehicles. Therefore, in parallel with the development of batteries in electric cars, research has developed a series of different solutions, united by hydrogen as fuel. The first solution described is the fuel cell. This makes it possible to limit harmful emissions by acting on certain pollutants according to the technology adopted; the final product of the reaction is H2O. Hydrogen can also be used as a fuel in internal combustion engines. In recent years, the interest in dual-fuel engines has assumed particular importance. In this regard, various studies and research have been carried out on the integration of hydrogen when suitably exploited with another more common fuel, such as petrol or diesel, which could contribute to the improvement of performance and emissions, acting directly on the combustion process in the cylinder.
This study considers a FireTM 1.4 L, 8-valve, 4-stroke spark ignition engine manufactured by FiatTM (Turin, Italy). The choice of this engine was made because FIAT already converted this engine to methane as fuel for some commercial vehicles (i.e., Fiat PandaTM and Fiat Grande PuntoTM (Turin, Italy)), where methane is stored in compressed tanks at 350 bar maximum pressure. The brake power curve of the engine fueled with compressed natural gas (CNG) is given by the manufacturer and used in a previous work, in which methane was mixed syngas from biomass gasification [6]. As far as hydrogen storage is concerned, the use of two LOHC+ compounds was considered, namely, Perhydro-dibenzyltoluene (H18-DBT) and Perhydro-N-Ethylcarbazole (H12-NEC). These two compounds were selected since they have excellent properties for transport and safety (they are non-flammable), and their dehydrogenation enthalpy values are lower than all the other compounds. Four different syngas compositions were evaluated.
- 100% H2 (Case 1)
- 75% H2, 25% CH4 (Case 2)
- 50% H2, 50% CH4 (Case 3)
- 25% H2, 75% CH4 (Case 4).
The percentages above are depicted in terms of volume. This study aimed to create a simplified model by assessing some parameters, which allows one to find the values of the temperatures of the exhaust gases and their energy. Once temperature values are known, it is also possible to trace the values of the two powers on which the comparison is based, i.e., that of the exhaust gases and that required for the dehydrogenation of the LOHC+ to take place.
2. Materials and Methods
From [6,7], it is possible to identify the following formula that estimates the Indicated Power (kW) of an engine:
where is the air density (kg/m3), is the displacement (m3), is the volumetric efficiency, is the indicated efficiency calculated through Equation (2), is the lower calorific value (MJ/kg), is the stoichiometric air–fuel ratio, is the equivalence ratio, and is the rotational speed (RPM).
In this equation, , , , , and refer to the thermodynamic efficiency (with regard to an ideal thermodynamic cycle), pumping efficiency, trapping efficiency, indicated cycle efficiency, adiabatic efficiency and combustion efficiency, respectively.
During model creation, the same internal combustion engine is considered for each combination of fuel used. In this case, the parameters , , and remain almost constant due to their low dependence on the nature of the fuel used. Moreover, a further hypothesis can be considered for the . Usually, this parameter varies according to the type of fuel considered; therefore, it cannot be kept constant for every choice of the mixture. However, scientific studies demonstrate the dependence of this parameter on the equivalence ratio ; in particular, it has been noted that in the conditions of the maximum load of spark-ignition engines, due to the use of rich mixtures, an increase in leads to a decrease in the combustion efficiency. Therefore, in these particular cases, can be assumed equal to 1. So, Equation (1) can be rewritten in a simplified form:
where is a fuel-independent constant. The term of assumes the ideal gas conditions are valid:
where indicates the air pressure, is the temperature of the mixture at the inlet, and is a constant value of 287 J/(kg K) [6]. It is possible to create a relationship between and the pressure in the suction line:
where is the pressure in the suction line, is the moles of air, and is the moles in the air–fuel mixture. In this regard, it is assumed that the air–fuel mixture is stoichiometric and that the is equal to the ambient pressure.
The number of moles can be calculated by exploiting the oxidation reaction of a fuel in the form of :
where the number 3.773 is obtained from the ratio between the moles of nitrogen and oxygen in the air, while , and represent the number of carbon, hydrogen and oxygen atoms in the fuel molecule, respectively [6]. In a stoichiometric mixture:
where the term denotes the atomic weights of carbon (12.011 g/mol), hydrogen (1.008 g/mol), oxygen (16 g/mol) and nitrogen (14.07 g/mol) [6]. Within the model, the use of a gas of variable composition has been considered, for which it is possible to implement the slightly modified Equation (6), where the terms , , , and represent the molar fraction inside the syngas of H2, CO, CH4, N2 and CO2, respectively.
Further, Equations (7) and (8) can be rewritten after introducing the molar fractions of fuels in gaseous form:
The terms of Equation (11) indicate the molecular weights, respectively, of H2 (2.016 g/mol), CO (28.011 g/mol), CH4 (16.032 g/mol), N2 (28.16 g/mol) and CO2 (44.011 g/mol) [6].
In the model employed, for simplicity, it is assumed that = = 20 °C.
The indicated power of the engine powered by syngas can be represented as a function of the indicated power supplied by the same engine powered by petrol (. The latter is derived from , the values of which characterize the graph of the power curve, taking into account the power losses . The two equations that quantify the two powers mentioned overhead are as follows [6]:
In these equations, is the density of the air in the air–fuel mixture (kg/m3), and is the density of the air in the air–gasoline mixture, which is assumed to be equal to the density of the air at 20 °C, the value of 1.225 kg/m3.
The Chen–Flynn model [8] is used to calculate the numerical values of , considered equal both in the petrol engine and in the one fueled by gaseous fuel. Accordingly:
Here, is the maximum pressure reached in the combustion chamber (70 bar), is the average speed of the piston (m/s), and is the torque (Nm).
The power supplied by the engine that operates using syngas as fuel can be calculated using the next equation [6]:
It is possible to present other equations used in the model in order to carry out an energy balance between the power of the exhaust gases and that necessary to make the dehydrogenation take place in the various LOHC systems introduced.
The volumetric flow rate of the mixture was considered , calculated through the following formula:
The air flow rate can be obtained then:
The mass flow rate of the air, , can be calculated via multiplying the flow rate obtained from Equation (18) by the density of the air (1.225 kg/m3).
If the value of is known, it is possible to obtain the value of the mass flow rate of the fuel, using the relationship:
The value of the exhaust gas mass flow rate can be obtained with the equation:
It is also possible to present formulas relating to the power balance in order to determine the minimum temperature of the exhaust gases necessary for the dehydrogenation process of the stored LOHC to take place. The power of the exhaust gases is given by the equation:
where is the temperature [K] at which the dehydrogenation of LOHC occurs, which varies according to the choice of the LOHC; is the temperature [K] of the exhaust gases; and is the specific heat at constant pressure [kJ/(kg K)] of the exhaust gases. This parameter depends on . Exploiting the ideal gas hypothesis [9]:
where , , and depend on the composition of the gases leaving the combustion chamber. For instance, using only hydrogen as a fuel, H2O in the form of water vapor and inert N2 will be present in the exhaust (Case 1). In this case, for water vapor, the coefficients assume the values of = 32.24, = 0.1923 × 10⁻², = 1.055 × 10⁻⁵ and = −3.595 × 10⁻⁹ [9].
In the model under consideration, the reaction products in cases 2, 3 and 4 are water vapor, CO2 (whose parameters are = 22.26, = 5.981 × 10⁻², = −3.501 × 10⁻⁵ and = 7.469 × 10⁻⁹) and N2 inert in gaseous form ( = 28.90, = −0.1571 × 10⁻², = 0.8081 × 10⁻⁵ and = −2.873 × 10⁻⁹). The value is acquired with the following formula:
where the x, y and z weights of the mean take on a value equal to x = 1, y = 0 and z = 0.5 × 3.773 for Case 1; x = 1.25, y = 0.25 and z = 1.75 × 3.773 for Case 2; x = 1.5, y = 0.5 and z = 1.25 × 3.773 for Case 3; and x = 1.75, y = 0.75 and z = 1.625 × 3.773 for Case 4. The z-weights are calculated by multiplying 3.773 by the moles of O2 present in the reactants. The dehydrogenation power () can be calculated as follows:
where is the parameter that describes the enthalpy of dehydrogenation, and is a coefficient that quantifies the mass fraction of H2 present in the syngas. In the model, is assumed to be , , and for cases 1, 2, 3 and 4, respectively.
As can be seen, the coefficient is decidedly lower than the volumetric fractions that define the four cases; this is due to the mass of hydrogen, which has a lower value than the other compounds. The formula used for the calculation is as follows:
The values of and are taken from [3]. At this point, it is possible to equalize the two powers (22) and (25), obtaining for each LOHC considered the minimum value of the exhaust gas temperature (the only unknown) necessary for the dehydrogenation process to take place.
Table 1 shows the data of the engine geometry adopted (4 cylinders). Table 2, Table 3, Table 4 and Table 5 show the data relating to the syngas, the mixture and the air, with the relative units of measurement, as the composition of the syngas, quantified by the volume fraction in the respective tables.

Table 1.
Characteristics of the motor adopted.
Table 2.
Data for Case 1.
Table 3.
Data for Case 2.
Table 4.
Data for Case 3.
Table 5.
Data for Case 4.
In order to carry out the power balance, it is also necessary to know the data relating to the dehydrogenation enthalpies of the two LOHC+ compounds considered and the temperatures at which the process takes place. Regarding H18-DBT, the two values are respectively 65.4 kJ/mol H2 (at 1 bar) and 300 °C. In the case of H12-NEC instead, they are equal to 50 kJ/mol H2 (at 1 bar) and 260 °C [3]. In this regard, it is necessary to clarify that the temperatures predicted for the dehydrogenation of H12-NEC are included in a wide range, so values lower than 260 °C could have been chosen. However, a conservative choice was made, falling on the upper limit of 260 °C.
3. Results
Using the iterative method, the values of the minimum temperatures of the exhaust gases were calculated, which allowed the dehydrogenation process of the two LOHC+ to be triggered. The following Table 6 and Table 7 show the obtained values of temperature and the values of (which were previously expressed as a function of the unknown parameter ), as well as the enthalpies exploited in the balance for different LOHC+ compounds.
Table 6.
Calculated values for H18-DBT.
Table 7.
Calculated values for H12-NEC.
The specific heat values are acquired after obtaining the value, which satisfies the heat balance equation. From the numerical values of the tables, it can be noted that the necessary for the dehydrogenation of H18-DBT are higher than those for dehydrogenation of H12-NEC; this could also be understood from the difference between the enthalpies of the dehydrogenation of the two compounds. Another critical observation lies in the fact that the decrease as the volumetric fraction of CH4 increases; in the case of H18-DBT, starting from a value of 1150 K (100% H2) and arriving at a minimum of 630 K (25% H2), while choosing H12-NEC as the compound, the values will be, respectively, 990 K (100% H2) and 575 K (25% H2). In this regard, it is possible to draw a graph that precisely describes the trend of as a function of the volumetric fraction of H2. Figure 2 shows the calculated values for H18-DBT and H12-NEC with changes in the hydrogen ratio. Data from some experimental studies in the literature are also shown in the same figure. It should be noted that while the values obtained from our study show the minimum exhaust temperatures required to self-sustain the process, the exhaust gas temperature values observed in experimental studies are independent of the dehydrogenation process. As shown in Figure 2, the exhaust gas temperature values observed with low amounts of hydrogen in the fuel may be sufficient to initiate dehydrogenation. It should be noted that the values for the different references indicated in the image are calculated using different fuel compositions.
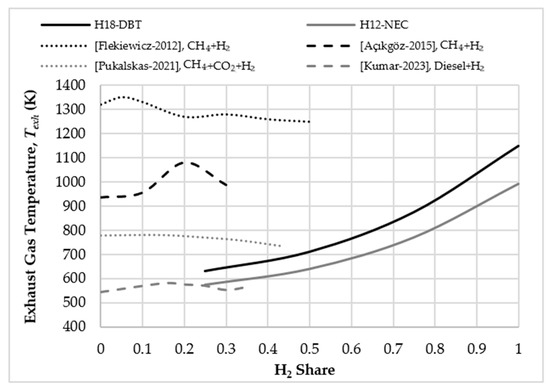
Figure 2.
trend as volumetric % of H2 varies [10,11,12,13].
The obtained temperatures, especially in simulations 2, 3 and 4 (therefore, with the addition of CH4), have values consistent with those typically reached by the exhaust gases at the exit from the combustion chamber. Suppose the actual temperatures are lower than the tabulated ones (the minimum for the dehydrogenation process to occur). In that case, acting directly on the combustion process is possible. Otherwise, integrations with the engine system can be envisaged. Among these solutions, the most typical consist of exploiting electric energy to increase the temperatures (Joule effect) or using post-combustors [3]. The first solution would require an adequate electrical system, which is usually applied in vehicles that use fuel cells. The second one is more interesting since it strictly concerns the field of internal combustion engines. The latter system introduces hydrogen burners, which make it possible to supply the missing energy to implement the dehydrogenation process by directly burning a part of the hydrogen detached from the LOHC+ compound [3].
For each of the four cases, it is possible to compare the trends of the values necessary for the dehydrogenation of the two compounds (H18-DBT and H12-NEC) as the RPM varies; the results are represented in the following Figure 3 and Figure 4. The required in selecting H12-DBT are decidedly lower than those necessary to dehydrogenate the H18-DBT compound, precisely because of the difference between their enthalpies. It can be remarked that, since the lines are straight, the most remarkable differences in terms of the required are found for high RPM values. On the other hand, the differences are less marked for low RPM values.
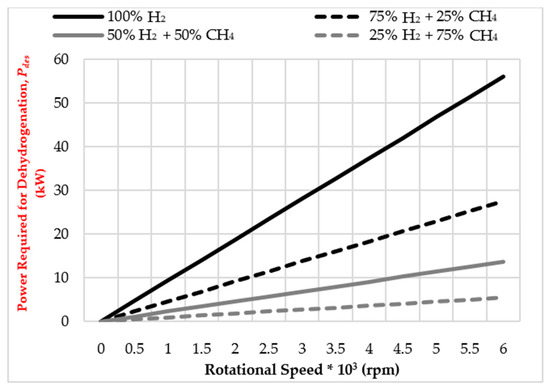
Figure 3.
values for Perhydro-dibenzyltoluene (H18-DBT).
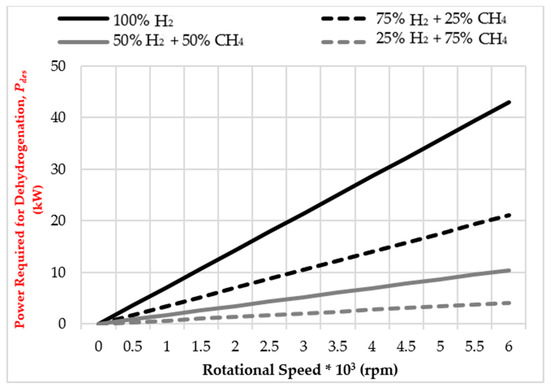
Figure 4.
values for Perhydro-N-Ethylcarbazole (H12-NEC).
Table 8 summarizes the results obtained, indicating for each simulation and LOHC the respective obtained values of and , where the maximum dehydrogenation power is obtained at a regime of 6000 RPM. It should be noted that, since the power diagram represents a linear trend, if the value in one point is known (i.e., 6000 RPM), it is possible to identify the for any other RPM by employing a simple proportion.
Table 8.
Results summary.
H12-NEC needs a lower thermal power compared to H18-DBT, and then the exhaust temperatures required are lower for H12-NEC. However, this LOHC has a high melting point that can be overcome by designing specialized methods for storage and transportation that can maintain the necessary temperature or by combining H12-NEC with other chemicals to lower its melting point. Yet, these methods can add complexity and cost to the refueling process, which can make refueling less practical when used for vehicles.
4. Conclusions
Two different LOHC compounds were taken into consideration, namely, H18-DBT and H12-NEC, which have different characteristics and properties. A 0D model was used for calculating the dehydrogenation power and the minimum exhaust gas temperatures for the dehydrogenation process to take place. We demonstrated that obtaining sufficient energy to dehydrogenate the LOHC compounds is possible by exploiting the exhaust gases at certain values of calculated and indicated beforehand. We also showed that the dehydrogenation power increases with the rise in the rotational speed for both H18-DBT and H12-NEC. As the CH4 volumetric fraction increased, started to decline. The required power for dehydrogenation was calculated at a higher value for H18-DBT at all rotational speeds than it was observed for H12-NEC.
The simulations carried out within this work can be further refined by exploiting special engineering software for calculating the temperatures reached in the chamber during the combustion process for an engine cycle, as well as by carrying out suitable experimental tests in order to compare the results and possibly validate everything. Finally, it should be noted that the implemented model requires a tank containing the LOHC+ liquid and a catalyst that allows the dehydrogenation process to occur. Therefore, it is advisable to design and validate these components, as well, paying attention to their size and weight, as discussed for the automotive sector. For this reason, the study and use of geometries and materials that allow the process to take place should be optimized.
Author Contributions
Conceptualization, S.P., A.M. and M.Z.; methodology, S.P., A.M. and M.Z.; software, S.P., A.M., M.Z. and A.F.K.; validation, S.P., A.M., M.Z. and A.F.K.; writing—original draft preparation, A.F.K.; writing—review and editing, S.P., A.M. and A.F.K.; visualization, S.P., A.M. and A.F.K.; supervision, A.M. All authors have read and agreed to the published version of the manuscript.
Funding
This research received no external funding.
Institutional Review Board Statement
Not applicable.
Informed Consent Statement
Not applicable.
Data Availability Statement
Not applicable.
Conflicts of Interest
The authors declare no conflict of interest.
Abbreviations
| CNG | Compressed natural gas | Lower calorific value | |
| H0-DBT | Dibenzyltoluene | Mass flow rate | |
| IMEP | Indicated mean effectivepressure | X | Mole ratio |
| LOHC | Liquid organic hydrogen carrier | Pressure | |
| H18-DBT | Perhydro-dibenzyltoluene | Pumping efficiency | |
| RPM | Revolutions per minute | Rotational speed | |
| Adiabatic efficiency | Specific heat at constant pressure | ||
| Average piston speed | Stoichiometric air–fuel ratio | ||
| Combustion efficiency | Temperature at which the dehydrogenation of LOHC occurs | ||
| Density | Minimum exhaust temperatures required to self-sustain the process | ||
| Displacement | Temperature of the mixture at the inlet | ||
| Equivalence ratio | Thermodynamic efficiency | ||
| Fuel independent constant | Torque | ||
| Gas constant | Trapping efficiency | ||
| Indicated cycle efficiency | Volumetric efficiency | ||
| Indicated efficiency | Volumetric flow rate of the mixture | ||
| Indicated power | Volume fraction |
References
- Yip, H.L.; Srna, A.; Yuen, A.C.Y.; Kook, S.; Taylor, R.A.; Yeoh, G.H.; Medwell, P.R.; Chan, Q.N. A Review of Hydrogen Direct Injection for Internal Combustion Engines: Towards Carbon-Free Combustion. Appl. Sci. 2019, 9, 4842. [Google Scholar] [CrossRef]
- Dimitriou, P.; Tsujimura, T. A review of hydrogen as a compression ignition engine fuel. Int. J. Hydrogen Energy 2017, 42, 24470–24486. [Google Scholar] [CrossRef]
- Modisha, P.M.; Ouma, C.N.M.; Garidzirai, R.; Wasserscheid, P.; Bessarabov, D. The Prospect of Hydrogen Storage Using Liquid Organic Hydrogen Carriers. Energy Fuels 2019, 33, 2778–2796. [Google Scholar] [CrossRef]
- Eypasch, M.; Schimpe, M.; Kanwar, A.; Hartmann, T.; Herzog, S.; Frank, T.; Hamacher, T. Model-based techno-economic evaluation of an electricity storage system based on Liquid Organic Hydrogen Carriers. Appl. Energy 2017, 185, 320–330. [Google Scholar] [CrossRef]
- Müller, B.; Müller, K.; Teichmann, D.; Arlt, D.W. Energiespeicherung mittels Methan und energietragenden Stoffen—Ein thermodynamischer Vergleich. Chem. Ing. Tech. 2011, 83, 2002–2013. [Google Scholar] [CrossRef]
- Allesina, G.; Pedrazzi, S.; Rinaldini, C.A.; di Paola, G.; Morselli, N.; Savioli, T.; Vidoni, A.; Mattarelli, E.; Tartarini, P. Effect of Syngas-Cng Co-Combustion on Automotive Engines for Micro Chp Applications; ASME-ATI-UIT Conf.: Naples, Italy, 2015. [Google Scholar]
- Ferrari, G. Motori A Combustione Interna; II Capitello: Torino, Italy, 1996. [Google Scholar]
- Heywood, J. Internal Combustion Engine Fundamentals; McGraw-Hill: New York, NY, USA, 1988. [Google Scholar]
- Cengel, Y. Thermodynamics and Heat Transfer; McGraw-Hill: New York, NY, USA, 1998. [Google Scholar]
- Flekiewicz, M.; Kubica, G. An Influence of Methane/Hydrogen Proportion in Fuel Blend on Efficiency of Conversion Energy in SI Engine. J. KONES Powertrain Transp. 2012, 19, 117–124. [Google Scholar] [CrossRef]
- Açıkgöz, B.; Çelik, C.; Soyhan, H.S.; Gökalp, B.; Karabağ, B. Emission characteristics of an hydrogen–CH4 fuelled spark ignition engine. Fuel 2015, 159, 298–307. [Google Scholar] [CrossRef]
- Pukalskas, S.; Kriaučiūnas, D.; Rimkus, A.; Przybyła, G.; Droździel, P.; Barta, D. Effect of Hydrogen Addition on the Energetic and Ecologic Parameters of an SI Engine Fueled by Biogas. Appl. Sci. 2021, 11, 742. [Google Scholar] [CrossRef]
- Kumar, A.; Kumar, C.B.; Lata, D. Effect of hydrogen enrichment on exhaust gas temperature and emission of a dual fuel diesel engine. Mater. Today Proc. 2023, 72, 631–635. [Google Scholar] [CrossRef]


Disclaimer/Publisher’s Note: The statements, opinions and data contained in all publications are solely those of the individual author(s) and contributor(s) and not of MDPI and/or the editor(s). MDPI and/or the editor(s) disclaim responsibility for any injury to people or property resulting from any ideas, methods, instructions or products referred to in the content. |
© 2023 by the authors. Licensee MDPI, Basel, Switzerland. This article is an open access article distributed under the terms and conditions of the Creative Commons Attribution (CC BY) license (https://creativecommons.org/licenses/by/4.0/).