Abstract
This work developed a method that uses a single monochrome high-speed camera without sacrificing the spatial resolution to measure both in-plane and out-of-plane full-field vibrations. By using the high-speed camera and a two-dimensional digital image correlation (2D-DIC) algorithm, the method first extracts the out-of-plane displacement field from the measured virtual in-plane strains. Then it retrieves the in-plane displacement field after eliminating the out-of-plane motion-induced virtual component. For validation, in-plane and out-of-plane translation tests and single-frequency vibration experiments were carried out. The measurement results show good agreement with the reference values, indicating the effectiveness of the proposed high-speed 2D-DIC (HS-2D-DIC). Further, the natural frequencies and mode shapes of a rectangular cantilever panel were also measured successfully, exhibiting the method’s effectiveness in practical applications. Since the HS-2D-DIC requires only a single monochrome camera, no complex optical setup, and no complicated calibration process, the method can be developed as a competitive tool for full-field vibration characterizations.
1. Introduction
Vibration measurement provides an efficient way of characterizing structural safety and durability, which has attracted much attention in engineering and industry [1,2,3]. Therefore, many vibration measurement methods, including accelerometers and displacement transducers, have been developed [4,5]. However, these early methods are generally contact-type ones, which can inevitably affect the natural frequencies of structures during the measurement and hardly be applied for characterizing lightweight and lightly damped structures. Laser Doppler vibrometers (LDVs) and continuous scanning LDVs (CSLDVs) emerged later [6,7]. Benefitting from their wide frequency range, high spatial resolution, and non-contact measurement features, LDVs and CSLDVs have started to be used in many applications [8,9,10]. Nevertheless, during these applications, researchers found that LDVs and CSLDVs still face two problems [11]: (1) the measurement accuracy is easily affected by the movement of LDV or CSLDV devices during a test; (2) the scanning parameters of a CSLDV are hard to select when measuring the structures subjected to a random load. For these reasons, an alternative non-contact method is still desirable to characterize full-field vibrations conveniently and effectively.
Digital image correlation (DIC) is an image-based full-field displacement and deformation measurement method developed in the early 1980s [12]. Since the previously developed two-dimensional DIC (2D-DIC) uses a single camera to capture specimen images and it measures only in-plane displacement on the specimen surface [13,14,15]. The method of three-dimensional DIC (3D-DIC) based on binocular vision was developed to overcome this limitation. Although the 3D-DIC requires two synchronized cameras and a relatively complex calibration process, it can measure both in-plane and out-of-plane displacements, which has allowed it to be used in an increasing number of applications in current experimental mechanics and material testing [16,17,18,19,20]. Recently, researchers discovered that a 3D-DIC could also be applied for full-field vibration measurements after the installation of synchronized high-speed cameras [21]. Due to its simple optical arrangement and low requirement of the experimental environment, the high-speed 3D-DIC (HS-3D-DIC) has rapidly become a competitive vibration measurement method, and many HS-3D-DIC-based vibration investigations have been subsequently carried out. For example, R. Hunady et al. investigated the dynamic behavior of rotating structures by using an HS-3D-DIC [22]; R. Chabrier et al. used an HS-3D-DIC to characterize the vibro-impact absorber to help understand the interactions occurring during impact [23]; Z. Su et al. studied the 3D dynamic deformation of the underwater rotor blades with the aid of an HS-3D-DIC [24]; and G. Sun et al. realized the vibration-based damage identification in composite plates by using an HS-3D-DIC [25]. Very recently, L. Yu and B. Pan discovered that full-field vibration measurements using an HS-3D-DIC still have some problems [11]: (1) the method requires a pair of high-speed cameras, which significantly increases hardware investment; (2) the precise synchronization of high-speed cameras is very complicated; and (3) the intensity variations and non-linear geometric distortion between the image pairs decrease the measurement accuracy. They introduced a single-camera HS-3D-DIC method for full-field vibration measurements to address these problems. With a specially designed light split device, generally a four-mirror adaptor, two different views of the specimen surface can be projected onto two halves of the same camera sensor target. Therefore, complicated camera synchronization is no longer needed, and only one high-speed camera is required to measure vibrations. Based on this method, S. Barone et al. studied the vibrations on a cantilever plate and a turbine blade [26]; and R. Xie et al. investigated the flow-induced vibration of a flexible splitter plate [27]. Although a single-camera HS-3D-DIC effectively avoids the high cost and precise synchronization issues, in turn, it introduces two new problems: (1) the resolution of each view is reduced in half due to the scene splitting; and (2) the optical arrangement of a single-camera HS-3D-DIC is relatively complicated and the imaging parameter becomes hard to adjust.
This work developed a high-speed-2D-DIC (HS-2D-DIC)-based full-field vibration measurement method. The method uses measured in-plane virtual strains to sense the out-of-plane displacements, which inherits the advantages of a single-camera HS-3D-DIC and overcomes its remaining problems. In the remainder of this manuscript, the principle of the HS-2D-DIC-based full-field vibration measurement method is first introduced. Then, validation experiments are carried out, including in-plane and out-of-plane translation tests, out-of-plane displacement sensitivity assessment, and vibration frequency measurement. Finally, the movements of a rectangular cantilever aluminum panel under the impulse load were measured, and the panel’s natural frequencies and mode shapes were successfully estimated.
2. Principle of the Method
2.1. Two-Dimensional Digital Image Correlation (2D-DIC)
The system configuration of a 2D-DIC is shown in Figure 1a, which consists of a camera, an imaging lens, and a group of light sources. Before a 2D-DIC measurement, the speckle pattern was first fabricated onto the specimen surface, and the imaging lens was then adjusted to make the camera focus on the surface. After acquiring the speckle images by using the 2D-DIC system, the in-plane displacement field, i.e., U-displacement field and V-displacement field, of the specimen can be calculated. As shown in Figure 1b, a region of interest (ROI) in the reference image was first specified and evenly divided into virtual grids. Then, the displacements at each point of the virtual grids can be computed to obtain the full-field deformation. Taking point P as an example, a square reference subset of (2M + 1) × (2M + 1) pixels centered at (x0, y0) from the reference image is chosen and used to track its corresponding target subset in the deformed image. To track the target subset, the similarity degree between the reference subset and the deformed subset was first estimated based on the correlation criterion. Then, the peak position (x0′, y0′) of the similarity degree distribution could be identified, which is also the center of the target subset. The differences in the positions of the reference subset center and the target subset center yield the in-plane displacement vector. After acquiring the in-plane displacement fields, the in-plane strain fields on the test object surface can also be estimated using numerical differentiation.

Figure 1.
Two-dimensional digital image correlation: (a) system configuration, (b) in-plane displacement field calculation.
2.2. Estimate Both in-Plane and Out-of-Plane Displacements in Vibration Measurements
In a 2D-DIC measurement, in-plane displacement fields, i.e., a U-displacement field and V-displacement field, estimated from the captured speckle patterns by using the 2D-DIC algorithm, as shown in Figure 1, can be represented as [13,28]
where Um and Vm are the displacements measured by a 2D-DIC; Ua and Va are the actual displacements, which are composed of the specimen deformation, rigid body translation, and rigid body rotation; Z is the object’s distance as shown in Figure 2; W is the out-of-plane displacement; and (xs, ys) is the spatial coordinate in the sensor plane. If neglecting the specimen’s out-of-plane rotation, the corresponding in-plane strain field can be estimated by calculating the gradient of the measured displacements
where εxxm and εyym are the measured in-plane strains; and εxxa and εyya are the actual in-plane strains. Since the specimen deformation is minimal in the vibration measurements, the actual strains εxxa and εyya can be neglected, and thus the measured strains εxxm and εyym can be considered entirely denoted by the out-of-plane motion-induced virtual strain, which is
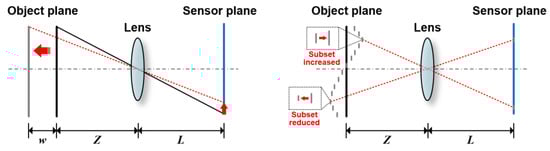
Figure 2.
Schematic of the virtual in-plane displacement induced by the specimen’s out-of-plane motion.
Therefore, when measuring the full-field vibrations using an HS-2D-DIC, the out-of-plane displacement W can first be estimated from the measured in-plane strains εxxm and εyym by using Equation (3). Then, the actual in-plane displacements Ua and Va can be calculated based on the estimated out-of-plane motion W and the measured in-plane displacements Um and Vm by using Equation (1).
2.3. Sensitivity of the In-Plane Displacement and Out-of-Plane Displacement Measurements
In 2D-DIC measurements, the in-plane displacement sensitivity is majorly related to the DIC algorithm, which can generally reach 0.02 pixels [29]. Therefore, it is varied with the imaging resolution of the 2D-DIC system. If the imaging resolution is 0.1mm/pixel, the in-plane displacement sensitivity δU and δV can be estimated; i.e., 0.02 pixel × 0.1 mm/pixel = 2 µm. However, the field of view (FOV) is generally predetermined in practical measurements. Thus, the imaging resolution and the in-plane displacement sensitivity are limited by the pixel numbers of the camera sensor.
The out-of-plane measurement sensitivity is associated with the object’s distance Z and the measured strain, as shown in Equation (3), which can be represented as
where δε is the strain sensitivity; i.e., the minimum strain that a 2D-DIC can accurately measure. Therefore, δε can be represented as δε = δU/Lx or δε = δV/Ly, where Lx × Ly corresponds to the size of the FOV. Since the displacement sensitivity of the DIC measurement can generally reach 0.02 pixels, the strain sensitivity is also determined by the number of pixels on the camera sensor. When considering a camera with 1000 × 1000 pixels, δε can be estimated; i.e., 0.02 pixel/1000 pixel = 20 µε. Further, considering that the object distance is 1 m, the sensitivity of the out-of-plane displacement can be estimated; i.e., 1 m × 10 µε = 20 µm. Compared with the in-plane displacement sensitivity, the out-of-plane displacement sensitivity is one order of magnitude lower. The proposed 2D-DIC-based vibration measurement method is mainly suitable for measuring large amplitude vibrations. From the analysis, it is noted that, both in-plane and out-of-plane displacement sensitivities are related to the pixel numbers of the camera sensor. Therefore, a high-resolution camera or even a camera array can be employed to enhance the displacement sensitivities [30]. In addition, if the measurement condition is permitted, the out-of-plane displacement sensitivity can be further improved by decreasing the object’s distance.
δW = −Z·δε,
In conclusion, the steps of choosing adequate imaging parameters can be summarized as follows:
- ■
- Determining the FOV and the minimum object distance according to the practical measurement needs;
- ■
- Setting the distance between the camera and the measured object to the predetermined minimum object distance for obtaining the maximum out-of-plane displacement sensitivity;
- ■
- Choosing a high-resolution camera or a camera array for ensuring a high in-plane displacement sensitivity;
- ■
- Selecting the focal length of the imaging lens that allows the camera to image the full range of the predetermined FOV at the minimum object distance.
3. Experiment and Result
3.1. In-Plane and Out-of-Plane Translation Tests
To validate the effectiveness of characterizing full-field vibrations by using the proposed HS-2D-DIC, in-plane and out-of-plane translation tests were firstly carried out. As shown in Figure 3, a flat plate, marked by a random speckle pattern, was fixed on a two-dimensional linear translation stage as the specimen. In front of the plate, a pair of blue light sources (center wavelength of 465 nm) were used for illumination, and a camera (Revealer M220, Fuhuang AgileDevice Ltd., Hefei, China, maximum frame rate of 2000 fps at a resolution of 1920 × 1080 pixels) equipped by an imaging lens (Sigma Art series DG HSM(A014), Sigma Co., Ltd., Kanagawa, Japan, aperture F/1.4 and focal length of 50 mm) and a band-pass filter was used to capture the speckle images. It is noted that the speckle pattern is important for DIC measurements; i.e., a speckle pattern with the appropriate speckle size (3~5 pixels per speckle), high contrast, and random distribution are required for a high-resolution and precise DIC measurements [31]. Therefore, in this experiment, the speckle pattern was numerically generated based on the Gaussian simulation algorithm [32]. It features a speckle size of 3–6 pixels and 10% speckle density. In addition, the combination of the blue monochromatic light source and band-pass filter used by the imaging system is used to eliminate the influence of ambient light [33]. The distance between the camera and the plate was set as 500 mm. Before the measurement, the imaging lens was carefully adjusted to make the camera capable of capturing high-contrast speckle images.
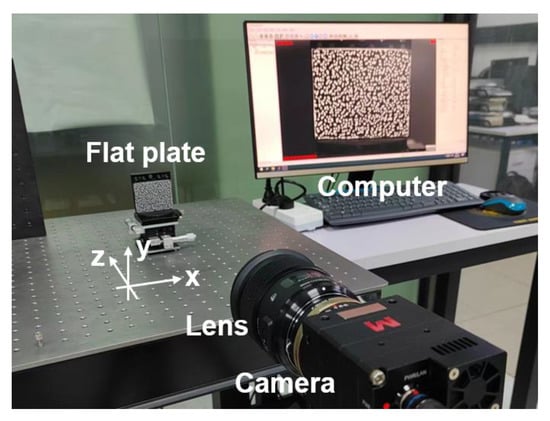
Figure 3.
Experimental arrangement of in-plane and out-of-plane translation tests.
In the translation tests, the plate was moved from 0 mm to 5 mm with 0.5 mm intervals, controlled by the two-dimensional translation stage, and a speckle image was captured at each position using the camera for the 2D-DIC calculation. Since the tested sample/region may not have a regular shape, a specific region of interest (ROI) has to be specified before applying a DIC calculation. During the DIC calculation, the subset size and grid step, which will affect the spatial resolution, measurement accuracy, and computation time, have to be selected. In general, a large subset size and small grid step can result in a high resolution and good accuracy, but low computational efficiency. In this experiment, a rectangular region of 600 × 600 pixels was selected as the region of interest (ROI). A subset size of 51 × 51 pixels and a grid step of 5 were chosen as the DIC calculation parameters. The measured in-plane and out-of-plane displacements are shown in Figure 4. From the results, it is observed that the measured U-displacement for the in-plane translation test and W-displacement for the out-of-plane translation test are in good agreement with the prescribed ones. The error fluctuations are caused by imperfect translations and the limited measurement precision. The absolute values of the mean errors are less than 0.1 mm, validating the effectiveness of the proposed HS-2D-DIC method for measuring both in-plane and out-of-plane displacements. From Figure 4b, it can be seen that the standard deviation increased with the out-of-plane displacement. This could be due to the relatively large out-of-plane motion of the specimen induced by the out-of-focus camera. Therefore, if the magnitude of the out-of-plane displacement is larger than the DOF, the defocusing results in the appearance of measurement errors. This issue can be addressed in the following two ways are provided: (1) increasing the speckle size—the relatively large out-of-plane displacement can turn to be out of focus, but increasing the speckle size ensures that the speckle can still be tracked when defocusing. The drawback of this method lies in the decreasing spatial resolution; and (2) decreasing the aperture size—the DOF can be increased after decreasing the aperture size of the imaging system so that the large out-of-plane displacement makes it possible to address the defocusing problem. But, the price of decreasing aperture size is reduced incoming light so that the exposure time has to be increased synchronously. One of these two methods can be selected according to the specific practical requirements.
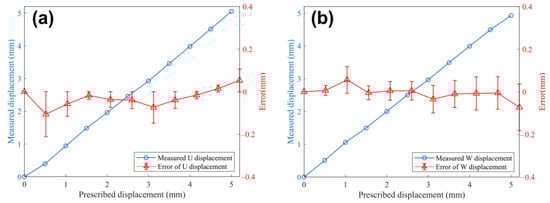
Figure 4.
Experimental results of the (a) in-plane translation test and (b) out-of-plane translation test.
3.2. Out-of-Plane Displacement Sensitivity Assessment
An additional set of translation tests were carried out to investigate the sensitivity of the out-of-plane displacement measurement. Since the camera’s sensor size and the FOV of the imaging system are predetermined, the measurement sensitivity of the out-of-plane displacement measurement is only associated with the working distance, also known as the object distance, of the HS-2D-DIC system. For validation, three different working distances, i.e., 500 mm, 1000 mm, and 1500 mm, as shown in Figure 5, were selected. To keep a consistent FOV, three different imaging lenses with focal lengths of 25 mm, 50 mm, and 75 mm were used. During the translation tests, the flat plate with a speckle pattern was moved from 0 mm to 1 mm with 0.05 mm intervals and controlled by the translation stage. In each position, a speckle image was captured for the 2D-DIC calculation.

Figure 5.
Schematic of the out-of-plane displacement sensitivity assessment experiment.
The measured out-of-plane displacements are shown in Figure 6, in which Figure 6a–c correspond to the results of working distances of 500 mm, 1000 mm, and 1500 mm, respectively. First, it can be seen that the lengths of the error bar increased with the working distance, which means that the displacement sensitivity decreased gradually with the working distance. In addition, the root-mean-square error (RMSE) of each experiment can be estimated by comparing it with the prescribed reference values, as shown in the top right corner of each figure. The RMSE values increased from 33.6 µm to 41.8 µm when the working distance increased from 500 mm to 1500 mm, which again indicates the displacement sensitivity decreased with the working distance of the imaging system.
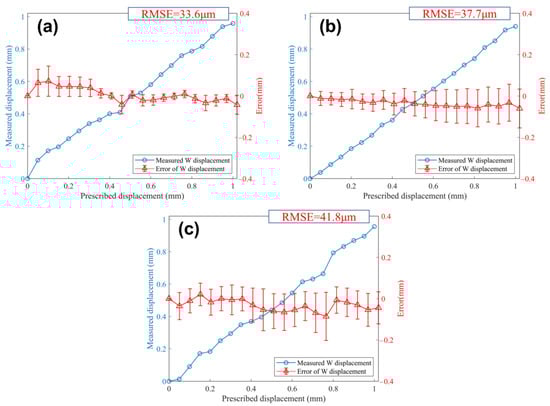
Figure 6.
Results of the out-of-plane translation tests with working distances of (a) 500 mm, (b) 1000 mm, and (c) 1500 mm.
3.3. Single-Frequency Vibration Measurement
To test the vibration measurement capability of an HS-2D-DIC, single-frequency vibration experiments were also carried out. A fascia gun was used as the excitation source and a flat plate with a speckle pattern was used as the specimen, as shown in Figure 7a. In the experiment, the out-of-plane displacements of the specimen with three different frequencies were generated using the excitation source, and the specimen’s movements were measured using the HS-2D-DIC system. The working distance and sampling rate of the HS-2D-DIC system are 500 mm and 1000 fps, respectively. The reference vibration frequencies of the specimen are 19.82 Hz, 29.33 Hz, and 38.85 Hz, respectively, and are measured using a tachometer. The out-of-plane displacements measured by the HS-2D-DIC are shown in Figure 7b–d. The frequencies estimated from the measured displacements are 20.02 Hz, 29.08 Hz, and 38.95 Hz, respectively, which are very close to the reference values. The absolute values of the relative errors are less than 1%, validating the effectiveness of the proposed method in measuring the specimen’s vibrations.
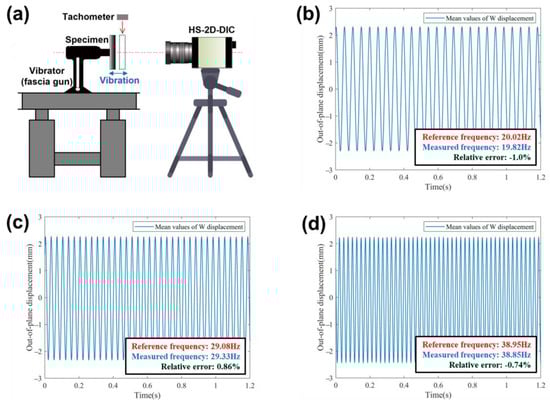
Figure 7.
(a) Schematic of the single-frequency vibration measurement experiment and the results of the vibrational tests with reference frequencies of (b) 20.02 Hz (c) 29.08 Hz, and (d) 38.95 Hz.
3.4. Measurement of Natural Frequencies and Mode Shapes of a Rectangular Cantilever Panel
To investigate the effectiveness of an HS-2D-DIC in characterizing full-field vibrations, an experiment measuring the rectangular cantilever panel movements under the impulse load was finally performed. As shown in Figure 8, an aluminum panel with a speckle pattern was tightly installed on a vibration isolation platform. A high-speed camera (Revealer M220, Fuhuang AgileDevice Ltd., Hefei, China, maximum frame rate of 2000 fps at a resolution of 1920 × 1080 pixels) equipped with an imaging lens (Sigma Art series DG HSM(A014), Sigma Co., Ltd., Kanagawa, Japan, aperture F/1.4, and focal length of 50 mm) was placed in front of the panel to capture the speckle images during the measurement. In order to compare the reference values provided in Ref. [11], the dimensions of the rectangular aluminum panel specimen are the same as the ones measured in the reference article, i.e., 460 mm × 200 mm × 2mm (W × H × T). Two evenly distributed holes were drilled in one short side of the rectangular aluminum panel, and the panel was prepared with contrasting speckle patterns and tightly installed onto the vibration isolation platform through a fixture. Before the measurement, the distance between the panel and the camera was set at 1250 mm, and the imaging lens was carefully adjusted to make the camera capable of capturing high-contrast speckle images. In the experiment, a rubber bullet was fired to excite the cantilever panel. The speckle images during the panel movement were continuously recorded by using the camera at a rate of 1000 fps.
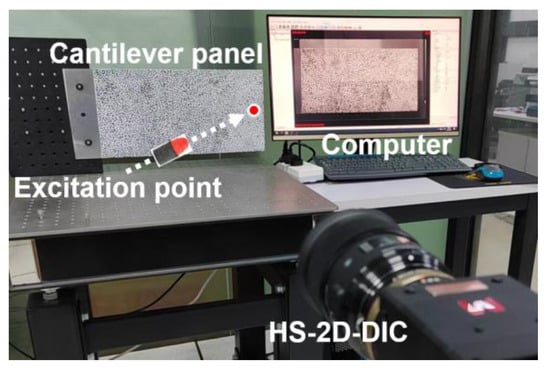
Figure 8.
A photograph of the cantilever aluminum panel vibration experiment.
Using the captured speckle images, the in-plane displacement and virtual strain fields can first be estimated based on the 2D-DIC algorithm. After that, the out-of-plane displacement fields can be obtained using the measured virtual strain fields based on Equation (3), as shown in Figure 8. Figure 9a–i show the out-of-plane displacements corresponding to the times that they were measured: 0.28 s, 0.31 s, 0.34 s, 0.37 s, 0.40 s, 0.43 s, 0.46 s, 0.49 s, and 0.52 s, respectively. Since the left edge of the panel was fixed, the out-of-plane displacement of the edge was kept at 0 throughout the vibration.
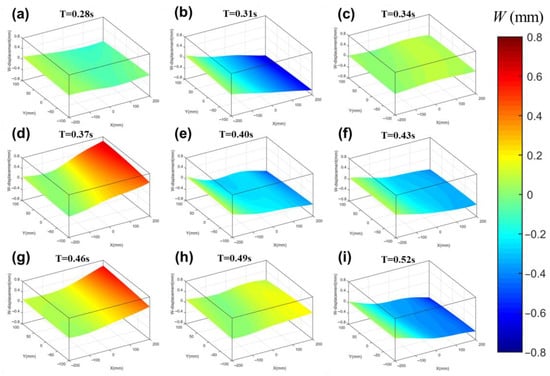
Figure 9.
The out-of-plane displacement fields measured at (a) 0.28 s, (b) 0.31 s, (c) 0.34 s, (d) 0.37 s, (e) 0.40 s, (f) 0.43 s, (g) 0.46 s, (h) 0.49 s, (i) 0.52 s.
To exhibit the dynamic results better, the displacements of four different points, i.e., P1, P2, P3, and P4, on the panel are plotted as shown in Figure 10. Since points P2 and P3 are close to the free edge of the panel, it is observed that the displacement amplitudes of these two points are larger than that of points P1 and P4. By processing the displacement results using the Fourier transform (FT), the frequency spectrums of the tested aluminum panel can be calculated, as shown in Figure 10d. From the spectrums, the natural frequencies of the aluminum panel can be acquired, i.e., 8.89 Hz, 41.80 Hz, and 56.00 Hz, showing good agreement with the reference values estimated by finite element analysis (FEA) [11], i.e., 9.04 Hz, 41.90 Hz, and 56.41 Hz. The differences between the measured and reference values are only −1.5%, −0.2%, and −0.7%.
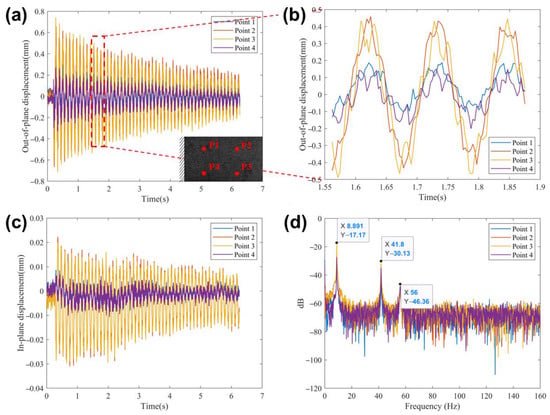
Figure 10.
(a) The out-of-plane displacements of points P1, P2, P3, and P4, (b) a partially enlarged figure of the out-of-plane displacement measurement results, (c) the in-plane displacements of points P1, P2, P3, and P4, (d) the frequency spectrums of the measured out-of-plane displacements.
In addition to extracting the natural frequencies, the mode shapes of the aluminum panel can also be estimated from the measured full-field displacements. First, transform the measured displacements from the time domain to the frequency domain. Then, extract the displacement at different natural frequencies by using band-pass filters. Finally, reversely transform the filtered displacements from the frequency domain to the time domain. Figure 11a–c give the out-of-plane displacements extracted at the natural frequencies of 8.89 Hz, 41.80 Hz, and 56.00 Hz, respectively. Figure 11d–f are the in-plane displacements extracted at the natural frequencies of 8.89 Hz, 41.80 Hz, and 56.00 Hz, respectively. By using the filtered displacements, the mode shapes of the tested rectangular aluminum panel, as shown in Figure 12a–f, can be finally obtained. The measured mode shapes are close to the reference ones as shown in Figure 12g–i, indicating the effectiveness of an HS-2D-DIC in characterizing full-field vibrations. Therefore, even if the panel vibration measurement has some deformation- or rotation-induced measurement errors, their influence should be negligible small. In addition, although the DIC measurements require the fabrication of a speckle pattern on the specimen surface, recent studies have verified that the fabricated speckle pattern does not affect the natural vibrations/displacements [11,21,22]. Moreover, it is noted that if a precisely controlled vibrator is available to excite the panel, the mode shapes can be better measured by setting the vibrational frequencies of the vibrator to the object’s natural frequencies.
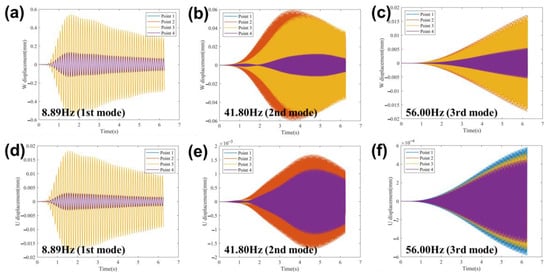
Figure 11.
The out-of-plane displacements extracted at the natural frequencies of (a) 8.89 Hz, (b) 41.80 Hz, (c) 56.00 Hz and the in-plane displacements extracted at the natural frequencies of (d) 8.89 Hz, (e) 41.80 Hz, (f) 56.00 Hz.
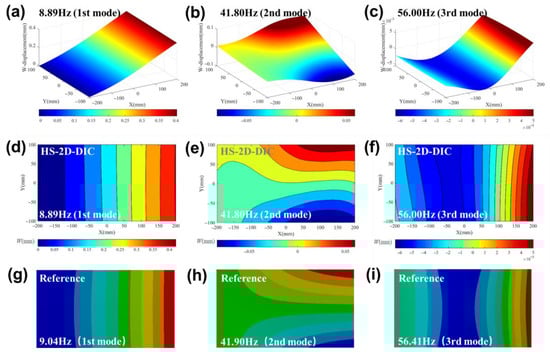
Figure 12.
The three-dimensional mode shapes of the rectangular cantilever panel estimated at natural frequencies by HC-2D-DIC of (a) 8.89 Hz, (b) 41.80 Hz, (c) 56.00 Hz; the two-dimensional mode shapes of the rectangular cantilever panel estimated at the natural frequencies by HC-2D-DIC of (d) 8.89 Hz, (e) 41.80 Hz, (f) 56.00 Hz; and the mode shapes of the rectangular cantilever panel estimated at the natural frequencies by FEA of (g) 8.89 Hz, (h) 41.80 Hz, (i) 56.00 Hz.
4. Conclusions
In this work, an HS-2D-DIC method has been developed for measuring full-field vibrations. The method inherits the in-plane displacement measurement capability of the conventional 2D-DIC and is also capable of sensing out-of-plane displacement using the measured virtual in-plane strains. Compared with the popular HS-3D-DIC, the proposed method requires only one high-speed camera to measure both in-plane and out-of-plane displacement fields in vibration measurements, effectively avoiding the precise synchronization requirement and high hardware costs. Compared with the recently proposed single-camera solution, i.e., a single-camera HS-3D-DIC, the proposed method does not require a complicated optical arrangement and can realize full-field displacement measurements without sacrificing spatial resolution. For validation, many experiments have been carried out, including in-plane and out-of-plane translation tests, displacement sensitivity assessment, single-frequency vibration measurement, and rectangular cantilever panel vibration measurement. The experimental results prove the effectiveness of the proposed HS-2D-DIC method.
5. Discussion
In addition to the advantages of the proposed method, there is an additional issue that needs to be illustrated (Figure 13). In an HS-2D-DIC, the out-of-plane rotation-induced virtual strain is neglected in Equation (2). The resulting measurement error was not analyzed due to the complex situations in practical vibration measurements. Here, we take the cantilever panel vibration experiment in Section 3.4 as an example to discuss the error. From the experiment, it is noted that the amplitude of the out-of-plane displacement on the free edge of a 400 mm length panel is ~1mm, and thus the corresponding vibration angle θ is 0.14°. Therefore, the out-of-plane rotation-induced virtual strain εr = (1 − cosθ)/1 can be estimated, which is 3 µε. By selecting three points, A, B, and C, at distances of 400 mm, 200 mm, and 40 mm, respectively, from the fixed edge of the panel, the out-of-plane displacement-induced virtual strains of these three points can be calculated. They are εA = 103 µε, εB = 5 × 10² µε, and εC = 102 µε, respectively. By comparing the out-of-plane rotation and out-of-plane displacement-induced virtual strains, it can be seen that the former is negligibly small. Since the rotation- or deformation-induced measurement errors are different in various vibration experiments, we plan to develop a single-camera high-speed 3D-DIC system and conduct a series of comparative experiments in our following research paper to discuss the proposed method’s measurement errors in detail.
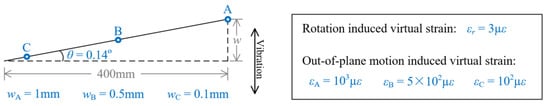
Figure 13.
The schematic of assessing out-of-plane-rotation- and out-of-plane-displacement-induced virtual strains in the cantilever panel vibration experiment.
Author Contributions
Conceptualization, Y.L. and B.D.; methodology, Y.L.; software, Z.N.; validation, Y.L. and P.H.; formal analysis, Y.L.; investigation, Z.N.; resources, P.H. and Y.B.; data curation, Y.L. and Z.N.; writing—original draft preparation, Y.L.; writing—review and editing, Y.B. and B.D.; visualization, P.H.; supervision, S.X., B.D. and Y.B.; project administration, S.X. and B.D.; funding acquisition, S.X. and B.D. All authors have read and agreed to the published version of the manuscript.
Funding
This work was supported by the National Natural Science Foundation of China (62171140, 61705047, and 61727810), Natural Science Foundation of Guangdong Province (2021A1515012598 and 2021A1515011945), and Young S&T Talent Training Program of Guangdong Provincial Association for S&T (SKXRC202225).
Institutional Review Board Statement
Not applicable.
Informed Consent Statement
Not applicable.
Data Availability Statement
Data that support the findings of this study are available from the corresponding author upon reasonable request.
Conflicts of Interest
We declare that we do not have any commercial or associative interest that represents a conflict of interest in connection with the work submitted.
References
- Yang, Y.; Dorn, C.; Mancini, T.; Talken, Z.; Kenyon, G.; Farrar, C.; Mascareñas, D. Blind identification of full-field vibration modes from video measurements with phase-based video motion magnification. Mech. Syst. Signal Process. 2017, 85, 567–590. [Google Scholar] [CrossRef]
- Pedrini, G.; Osten, W.; Gusev, M.E. High-speed digital holographic interferometry for vibration measurement. Appl. Opt. 2006, 45, 3456–3462. [Google Scholar] [CrossRef]
- Dreier, F.; Günther, P.; Pfister, T.; Czarske, J.W.; Fischer, A. Interferometric Sensor System for Blade Vibration Measurements in Turbomachine Applications. IEEE Trans. Instrum. Meas. 2013, 62, 2297–2302. [Google Scholar] [CrossRef]
- Zhang, J.; Qiao, X.; Hu, M.; Feng, Z.; Gao, H.; Yang, Y.; Zhou, R. Flextensional fiber Bragg grating-based accelerometer for low frequency vibration measurement. Chin. Opt. Lett. 2011, 9, 090607. [Google Scholar] [CrossRef]
- Vallan, A.; Casalicchio, M.L.; Perrone, G. Displacement and Acceleration Measurements in Vibration Tests Using a Fiber Optic Sensor. IEEE Trans. Instrum. Meas. 2010, 59, 1389–1396. [Google Scholar] [CrossRef]
- Halkon, B.J.; Rothberg, S.J. Vibration measurements using continuous scanning laser Doppler vibrometry: Theoretical velocity sensitivity analysis with applications. Meas. Sci. Technol. 2003, 14, 382–393. [Google Scholar] [CrossRef]
- Rothberg, S.J.; Allen, M.S.; Castellini, P.; Di Maio, D.; Dirckx, J.J.J.; Ewins, D.J.; Halkon, B.J.; Muyshondt, P.; Paone, N.; Ryan, T.; et al. An international review of laser Doppler vibrometry: Making light work of vibration measurement. Opt. Lasers Eng. 2016, 99, 11–22. [Google Scholar] [CrossRef]
- Nassif, H.H.; Gindy, M.; Davis, J. Comparison of laser Doppler vibrometer with contact sensors for monitoring bridge deflection and vibration. NDT E Int. 2005, 38, 213–218. [Google Scholar] [CrossRef]
- Halkon, B.J.; Rothberg, S.J. Vibration measurements using continuous scanning laser vibrometry: Advanced aspects in rotor applications. Mech. Syst. Signal Process. 2006, 20, 1286–1299. [Google Scholar] [CrossRef]
- Allen, M.S.; Sracic, M.W. A new method for processing impact excited continuous-scan laser Doppler vibrometer measurements. Mech. Syst. Signal Process. 2010, 24, 721–735. [Google Scholar] [CrossRef]
- Yu, L.; Pan, B. Single-camera high-speed stereo-digital image correlation for full-field vibration measurement. Mech. Syst. Signal Process. 2017, 94, 374–383. [Google Scholar] [CrossRef]
- Peters, W.H.; Ranson, W.F. Digital imaging techniques in experimental stress analysis. Opt. Eng. 1982, 21, 427–431. [Google Scholar] [CrossRef]
- Pan, B.; Qian, K.; Xie, H.; Asundi, A. Two-dimensional digital image correlation for in-plane displacement and strain measurement: A review. Meas. Sci. Technol. 2009, 20, 152–154. [Google Scholar] [CrossRef]
- Dong, B.; Li, C.; Pan, B. Fluorescent 2D digital image correlation with built-in coaxial illumination for deformation measurement in space-constrained scenarios. Exp. Mech. 2021, 61, 653661. [Google Scholar] [CrossRef]
- Dong, B.; Li, C.; Pan, B. Ultrasensitive video extensometer using single-camera dual field-of-view telecentric imaging system. Opt. Lett. 2019, 44, 4499–4502. [Google Scholar] [CrossRef]
- Sutton, M.; Reu, P.; Turner, D. Advances in digital image correlation: Extreme-scale applications, algorithms, and uncertainty quantification preface. Exp. Mech. 2018, 58, 1016. [Google Scholar]
- Pan, B. Digital image correlation for surface deformation measurement: Historical developments, recent advances and future goals. Meas. Sci. Technol. 2018, 29, 082001. [Google Scholar] [CrossRef]
- Dong, B.; Zeng, F.; Pan, B. A simple and practical single-camera stereo-digital image correlation using a color camera and x-cube prism. Sensors 2019, 19, 4726. [Google Scholar] [CrossRef]
- Zaletelj, K.; Agrež, V.; Slavič, J.; Boltežar, M. Laser-light speckle formation for deflection-shape identification using digital image correlation. Mech. Syst. Signal Process. 2021, 161, 107899. [Google Scholar] [CrossRef]
- Dong, B.; Li, C.; Pan, B. Fluorescent digital image correlation applied for macroscale deformation measurement. Appl. Phys. Lett. 2020, 117, 044101. [Google Scholar] [CrossRef]
- Beberniss, T.J.; Ehrhardt, D.A. High-speed 3D digital image correlation vibration measurement: Recent advancements and noted limitations. Mech. Syst. Signal Process. 2017, 86, 34–48. [Google Scholar] [CrossRef]
- Hunady, R.; Pavelka, P.; Lengvarsky, P. Vibration and modal analysis of a rotating disc using high-speed 3D digital image correlation. Mech. Syst. Signal Process. 2019, 121, 201–214. [Google Scholar] [CrossRef]
- Chabrier, R.; Sadoulet-Reboul, E.; Chevallier, G.; Foltête, E.; Jeannin, T. Full-field measurements with digital image correlation for vibro-impact characterization. Mech. Syst. Signal Process. 2021, 156, 107658. [Google Scholar] [CrossRef]
- Su, Z.; Pan, J.; Zhang, S.; Wu, S.; Yu, Q.; Zhang, D. Characterizing dynamic deformation of marine propeller blades with stroboscopic stereo digital image correlation. Mech. Syst. Signal Process. 2022, 162, 108072. [Google Scholar] [CrossRef]
- Sun, G.; Wang, Y.; Luo, Q.; Li, Q. Vibration-based damage identification in composite plates using 3D-DIC and wavelet analysis. Mech. Syst. Signal Process. 2022, 173, 108890. [Google Scholar] [CrossRef]
- Barone, S.; Neri, P.; Paoli, A.; Razionale, A.V. Low-frame-rate single camera system for 3D full-field high-frequency vibration measurements. Mech. Syst. Signal Process. 2019, 123, 143–152. [Google Scholar] [CrossRef]
- Xie, R.; Yu, L.; Zhu, W.; Pan, B. Experimental study on flow-induced full-field vibration of a flexible splitter plate behind a cylinder using stereo-digital image correlation. J. Vib. Acoust. Trans. ASME 2021, 143, 034501. [Google Scholar] [CrossRef]
- Pan, B.; Yu, L.; Wu, D. High-accuracy 2D digital image correlation measurements with bilateral telecentric lenses: Error analysis and experimental verification. Exp. Mech. 2013, 53, 1719–1733. [Google Scholar] [CrossRef]
- Pan, B.; Asundi, A.; Xie, H.; Gao, J. Digital image correlation using iterative least squares and pointwise least squares for displacement field and strain field measurements. Opt. Lasers Eng. 2009, 47, 865–874. [Google Scholar] [CrossRef]
- Shao, X.; Chen, Z.; Dai, X.; He, X. Camera array-based digital image correlation for high-resolution strain measurement. Rev. Sci. Instrum. 2018, 89, 105110. [Google Scholar] [CrossRef] [PubMed]
- Dong, Y.; Pan, B. A Review of Speckle Pattern Fabrication and Assessment for Digital Image Correlation. Exp. Mech. 2017, 57, 1161–1181. [Google Scholar] [CrossRef]
- Fu, B.; Li, C.; Dong, B.; Ou, P. Enhanced digital gradient sensing using backlight digital speckle targets. Sensors 2020, 20, 6557. [Google Scholar] [CrossRef] [PubMed]
- Pan, B.; Wu, D.; Xia, Y. An active imaging digital image correlation method for deformation measurement insensitive to ambient light. Opt. Laser Technol. 2012, 44, 204–209. [Google Scholar] [CrossRef]


Disclaimer/Publisher’s Note: The statements, opinions and data contained in all publications are solely those of the individual author(s) and contributor(s) and not of MDPI and/or the editor(s). MDPI and/or the editor(s) disclaim responsibility for any injury to people or property resulting from any ideas, methods, instructions or products referred to in the content. |
© 2023 by the authors. Licensee MDPI, Basel, Switzerland. This article is an open access article distributed under the terms and conditions of the Creative Commons Attribution (CC BY) license (https://creativecommons.org/licenses/by/4.0/).