Research on Influences of Ultrasonic Vibration Agitation Stirring on Carbonation Resistance of Cement-Based Materials after Absorption of CO2


Abstract
1. Introduction
2. Test Study
2.1. Raw Materials
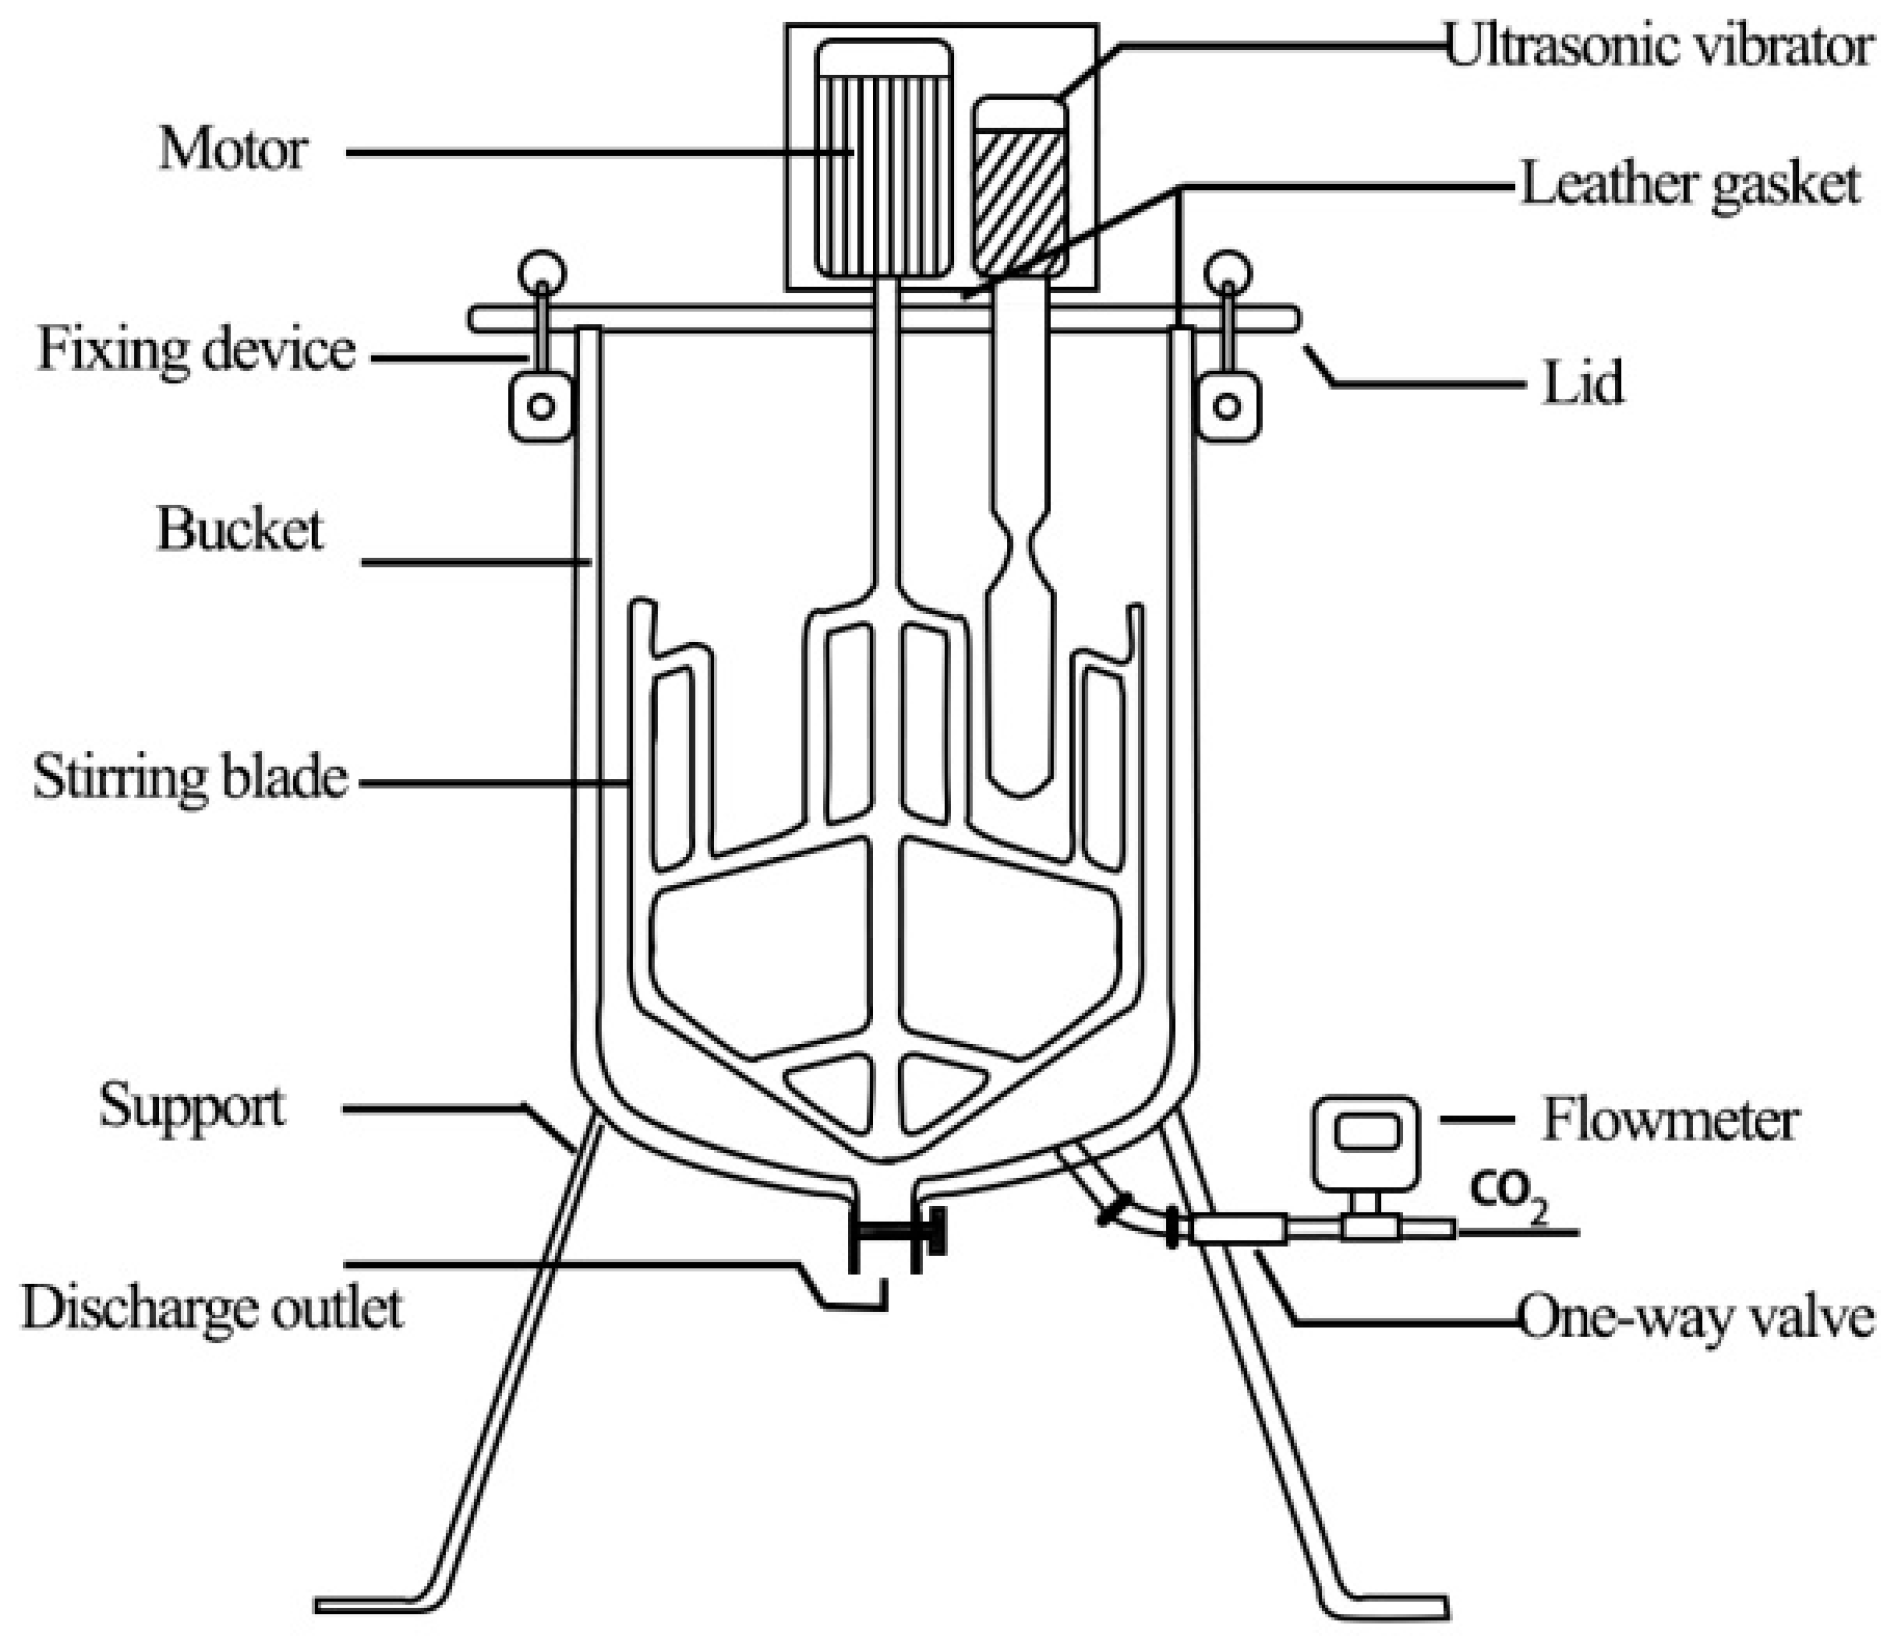
2.2. CO2 Absorption Device
2.3. Specimen Grouping
2.4. Specimen Preparation
- (1)
- Preparation of cement mortar specimens after CO2 absorption under mechanical agitation
- (2)
- Preparation of cement mortar specimens after CO2 absorption under ultrasonic vibration agitation stirring
2.5. Concrete Carbonization Test Procedure
- (1)
- Preprocessing of specimens and accelerated carbonation test
- (2)
- Calculation of carbonation depth
3. Test Contents and Methods
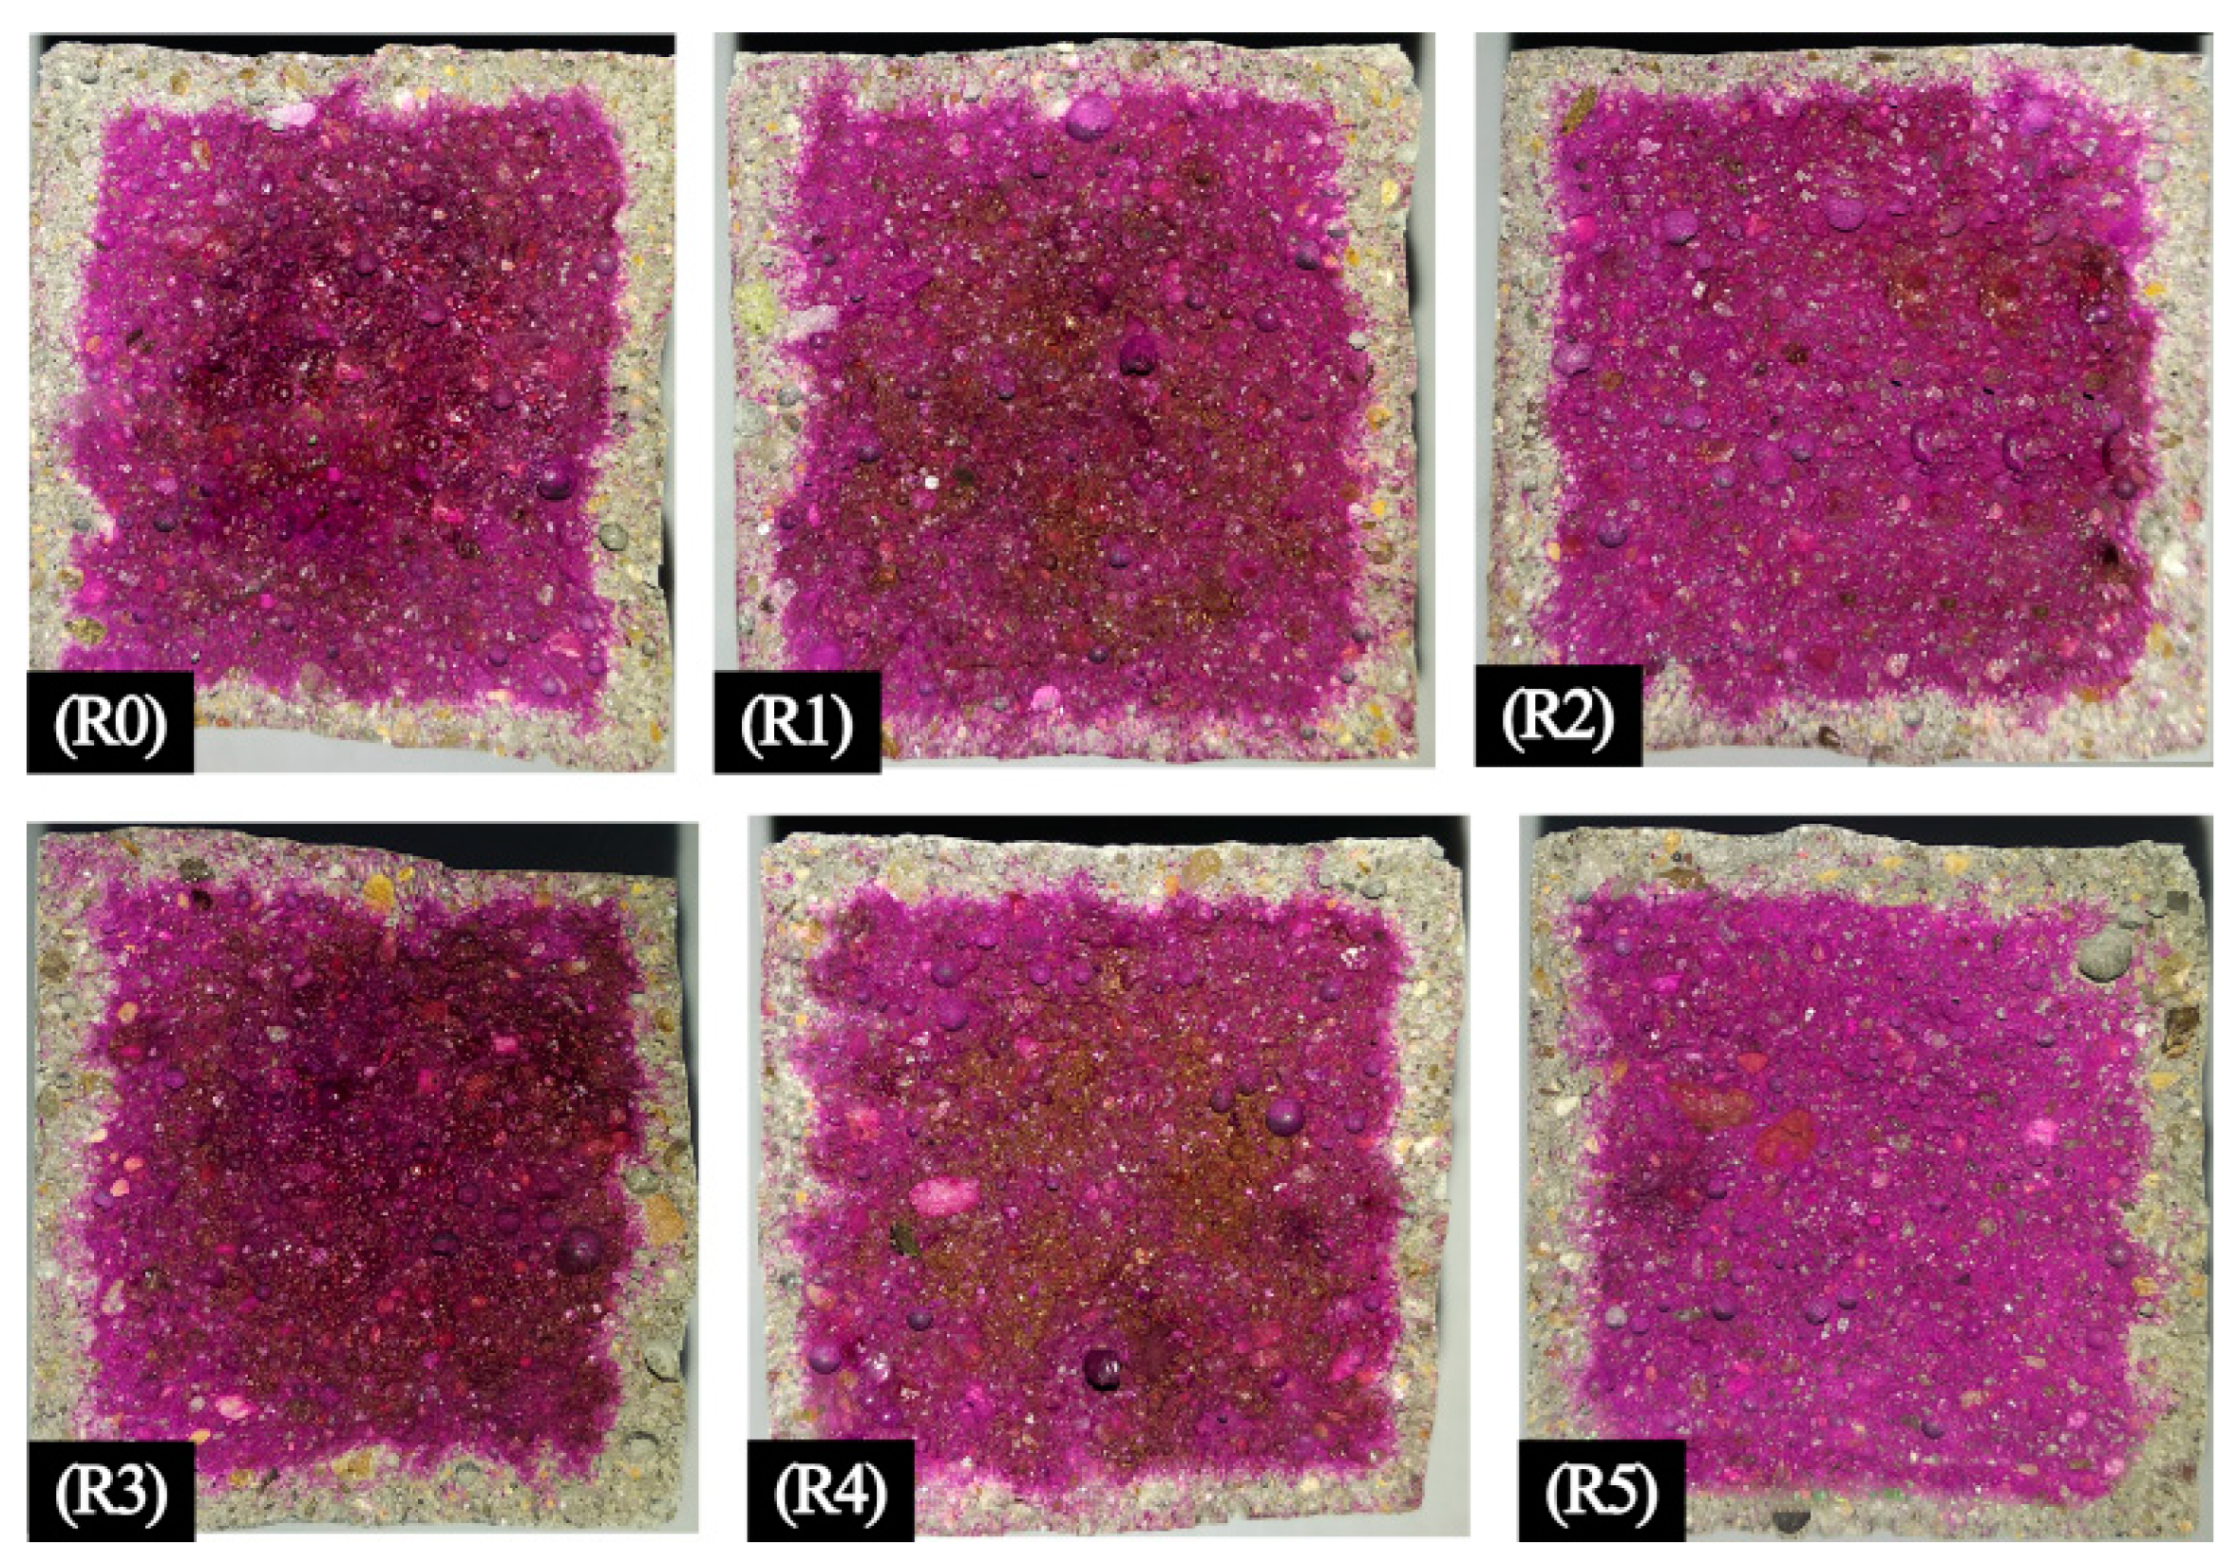
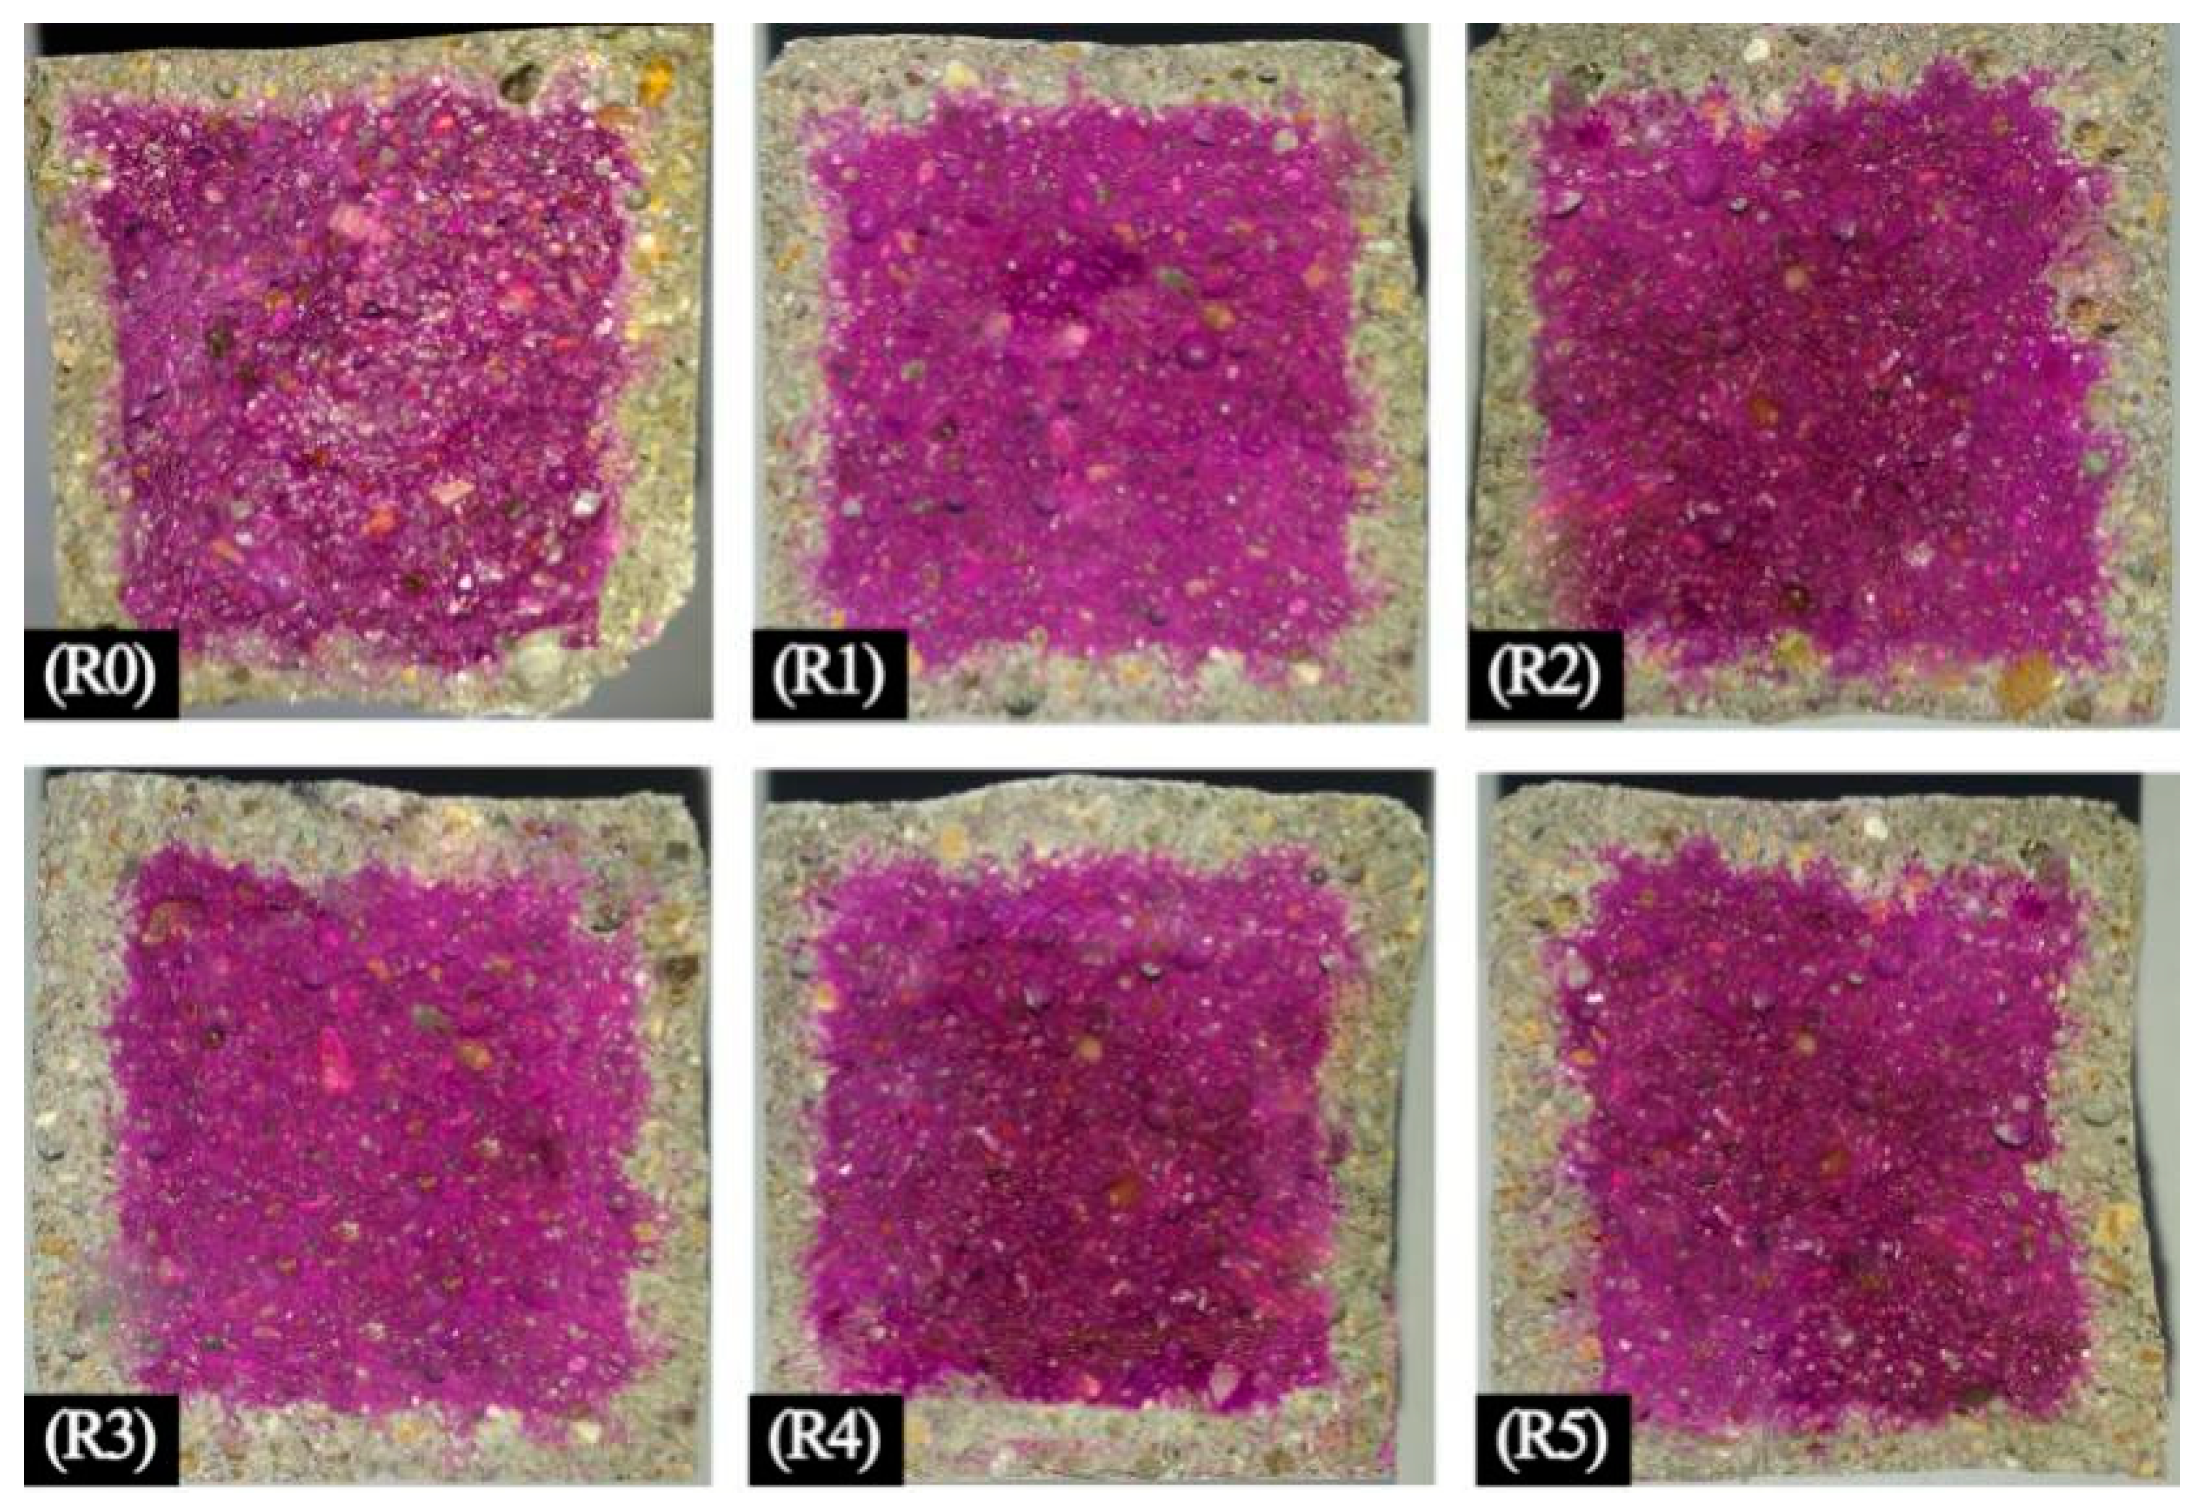
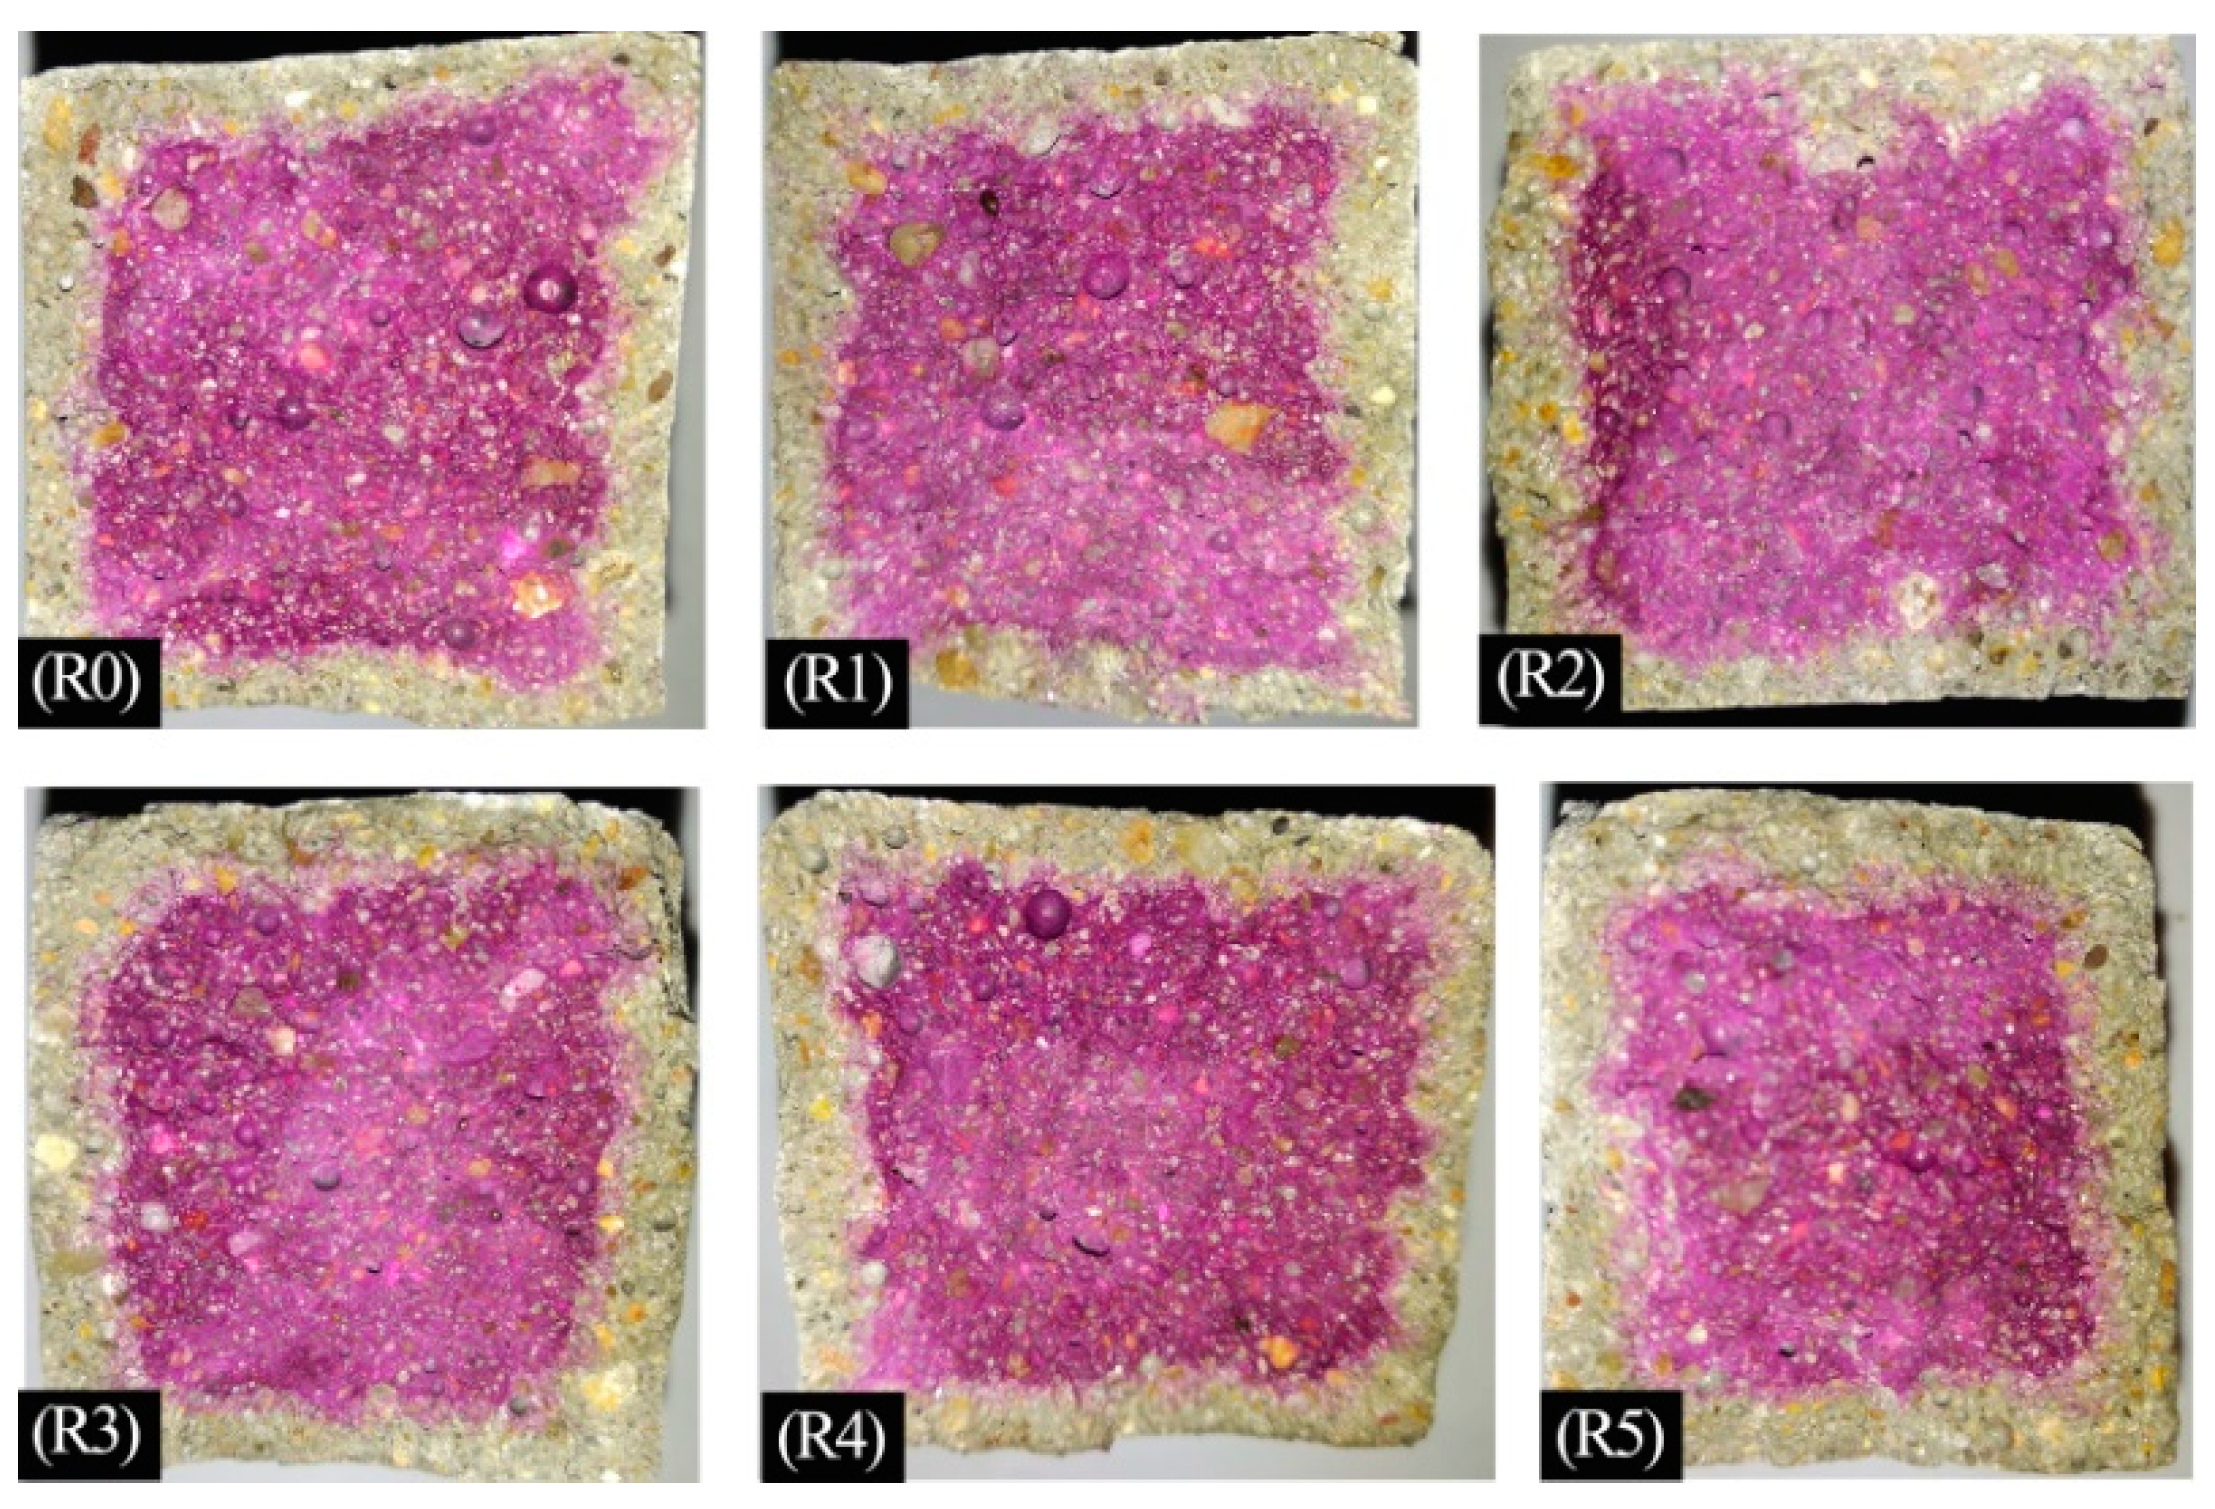
3.1. Carbonization Performances Test
3.2. pH Test
3.3. XRD Test
3.4. SEM Test
4. Test Results and Analysis
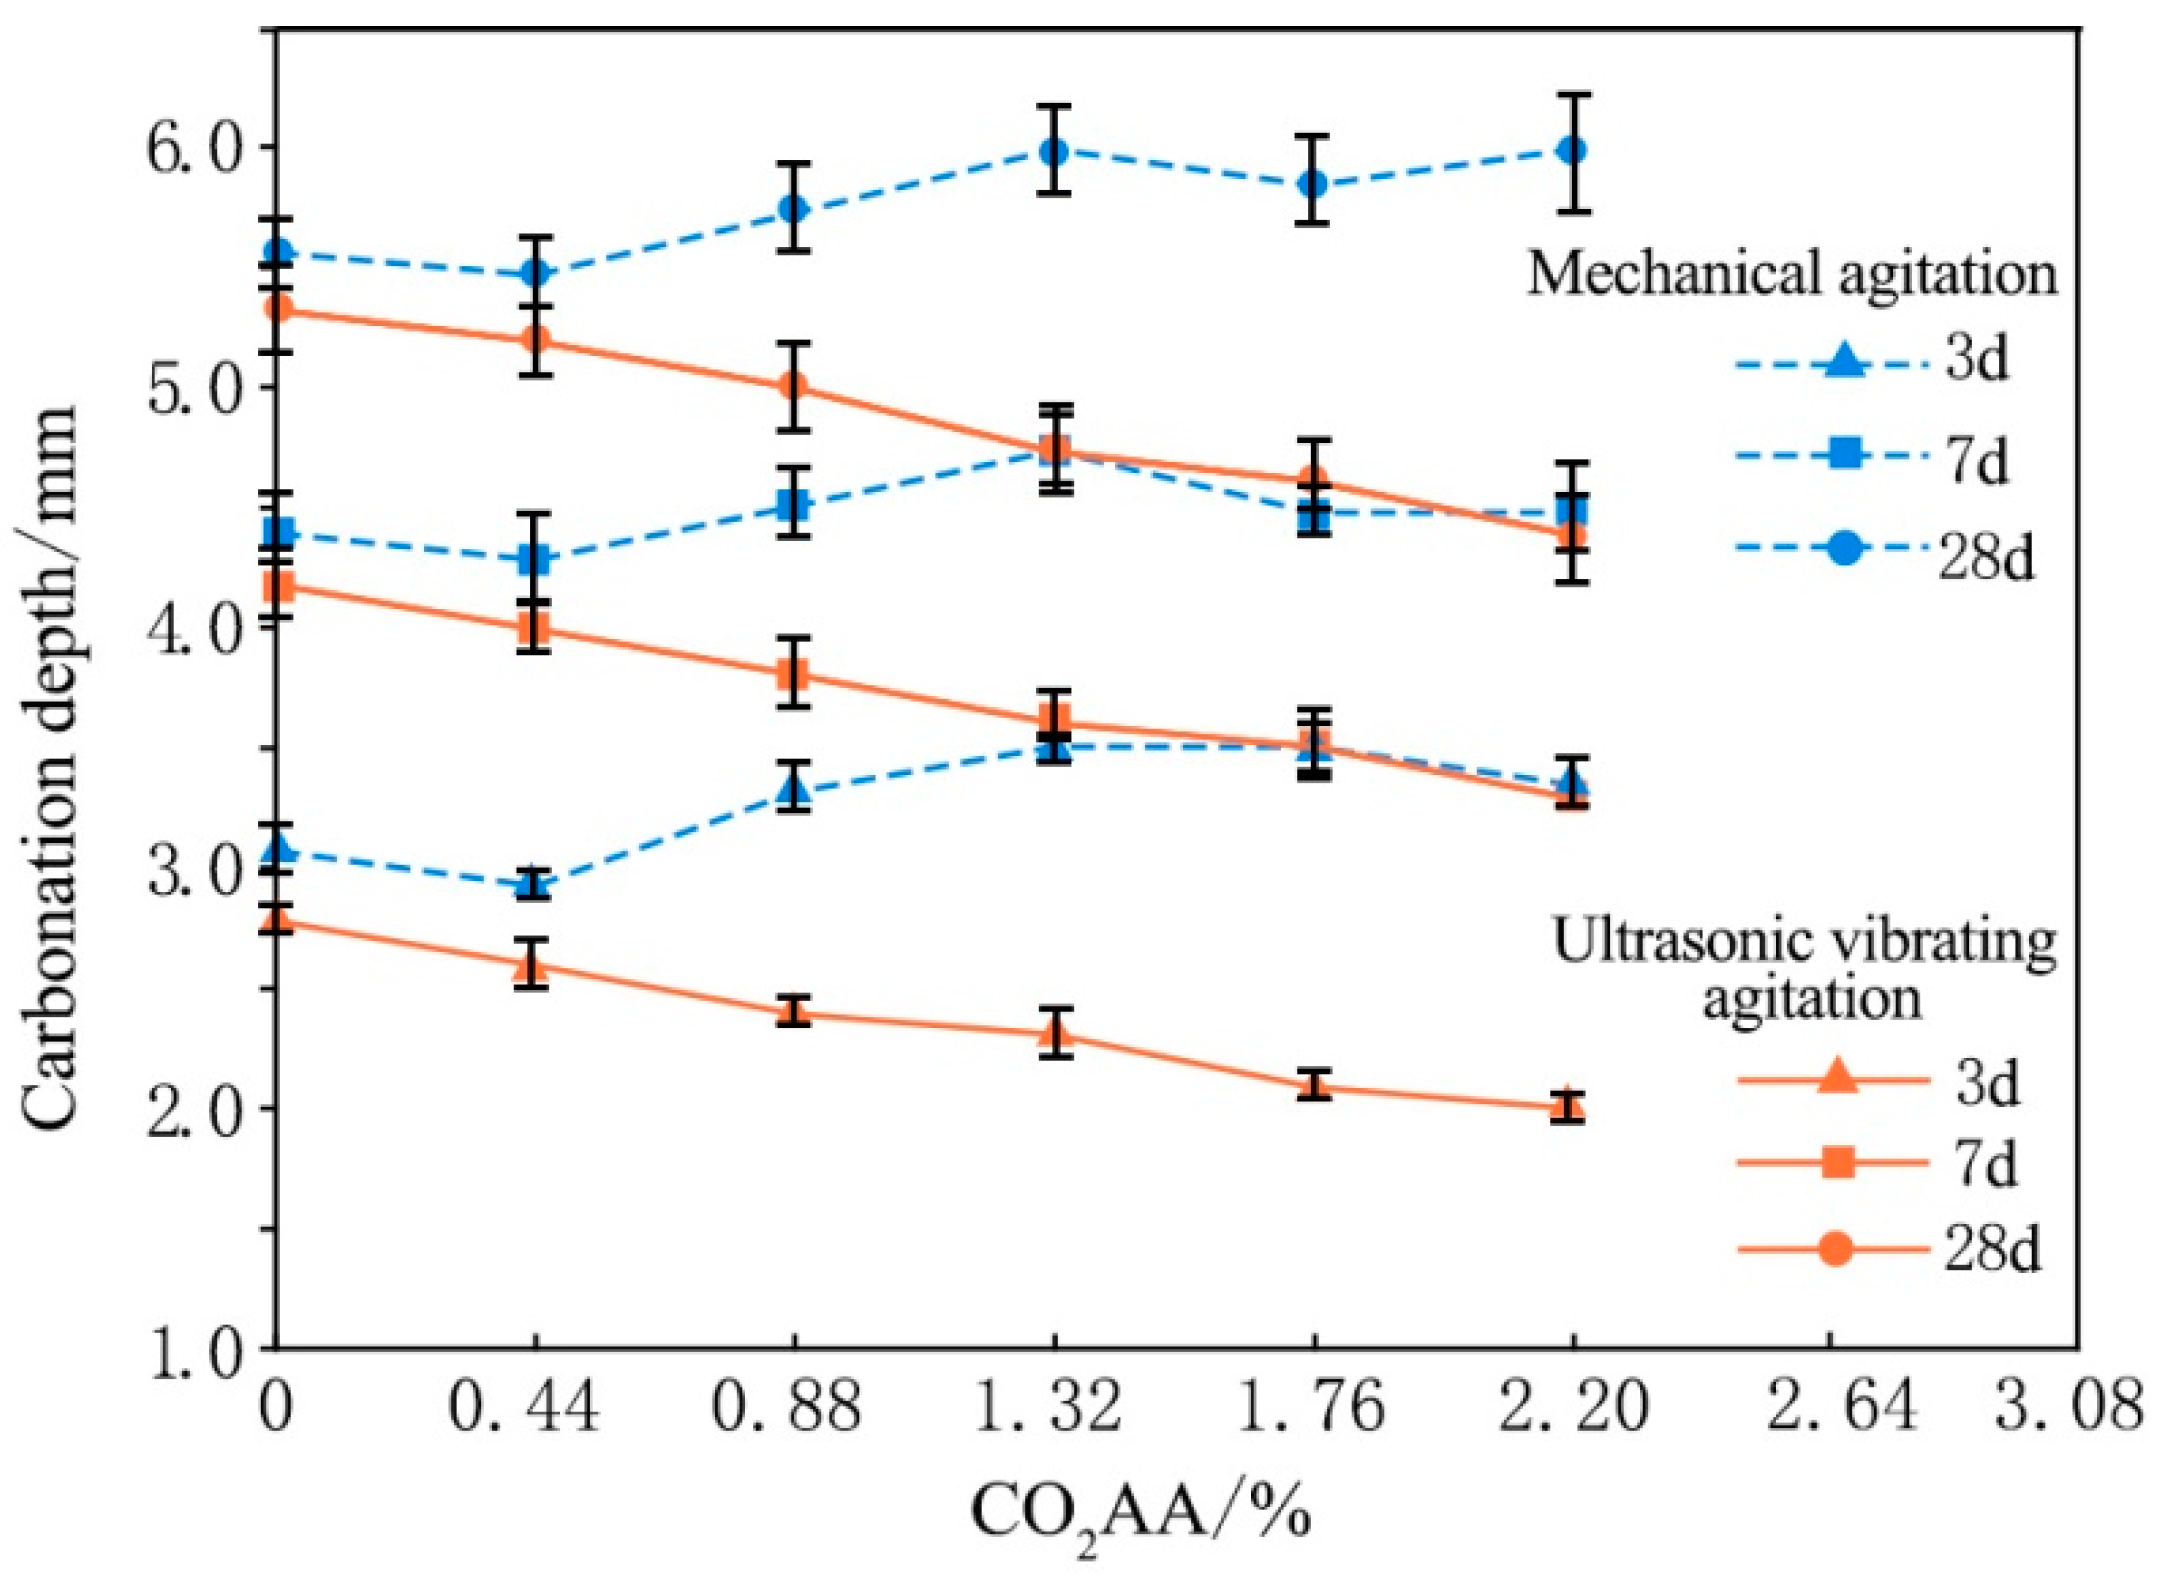
4.1. Carbonation Performances Analysis
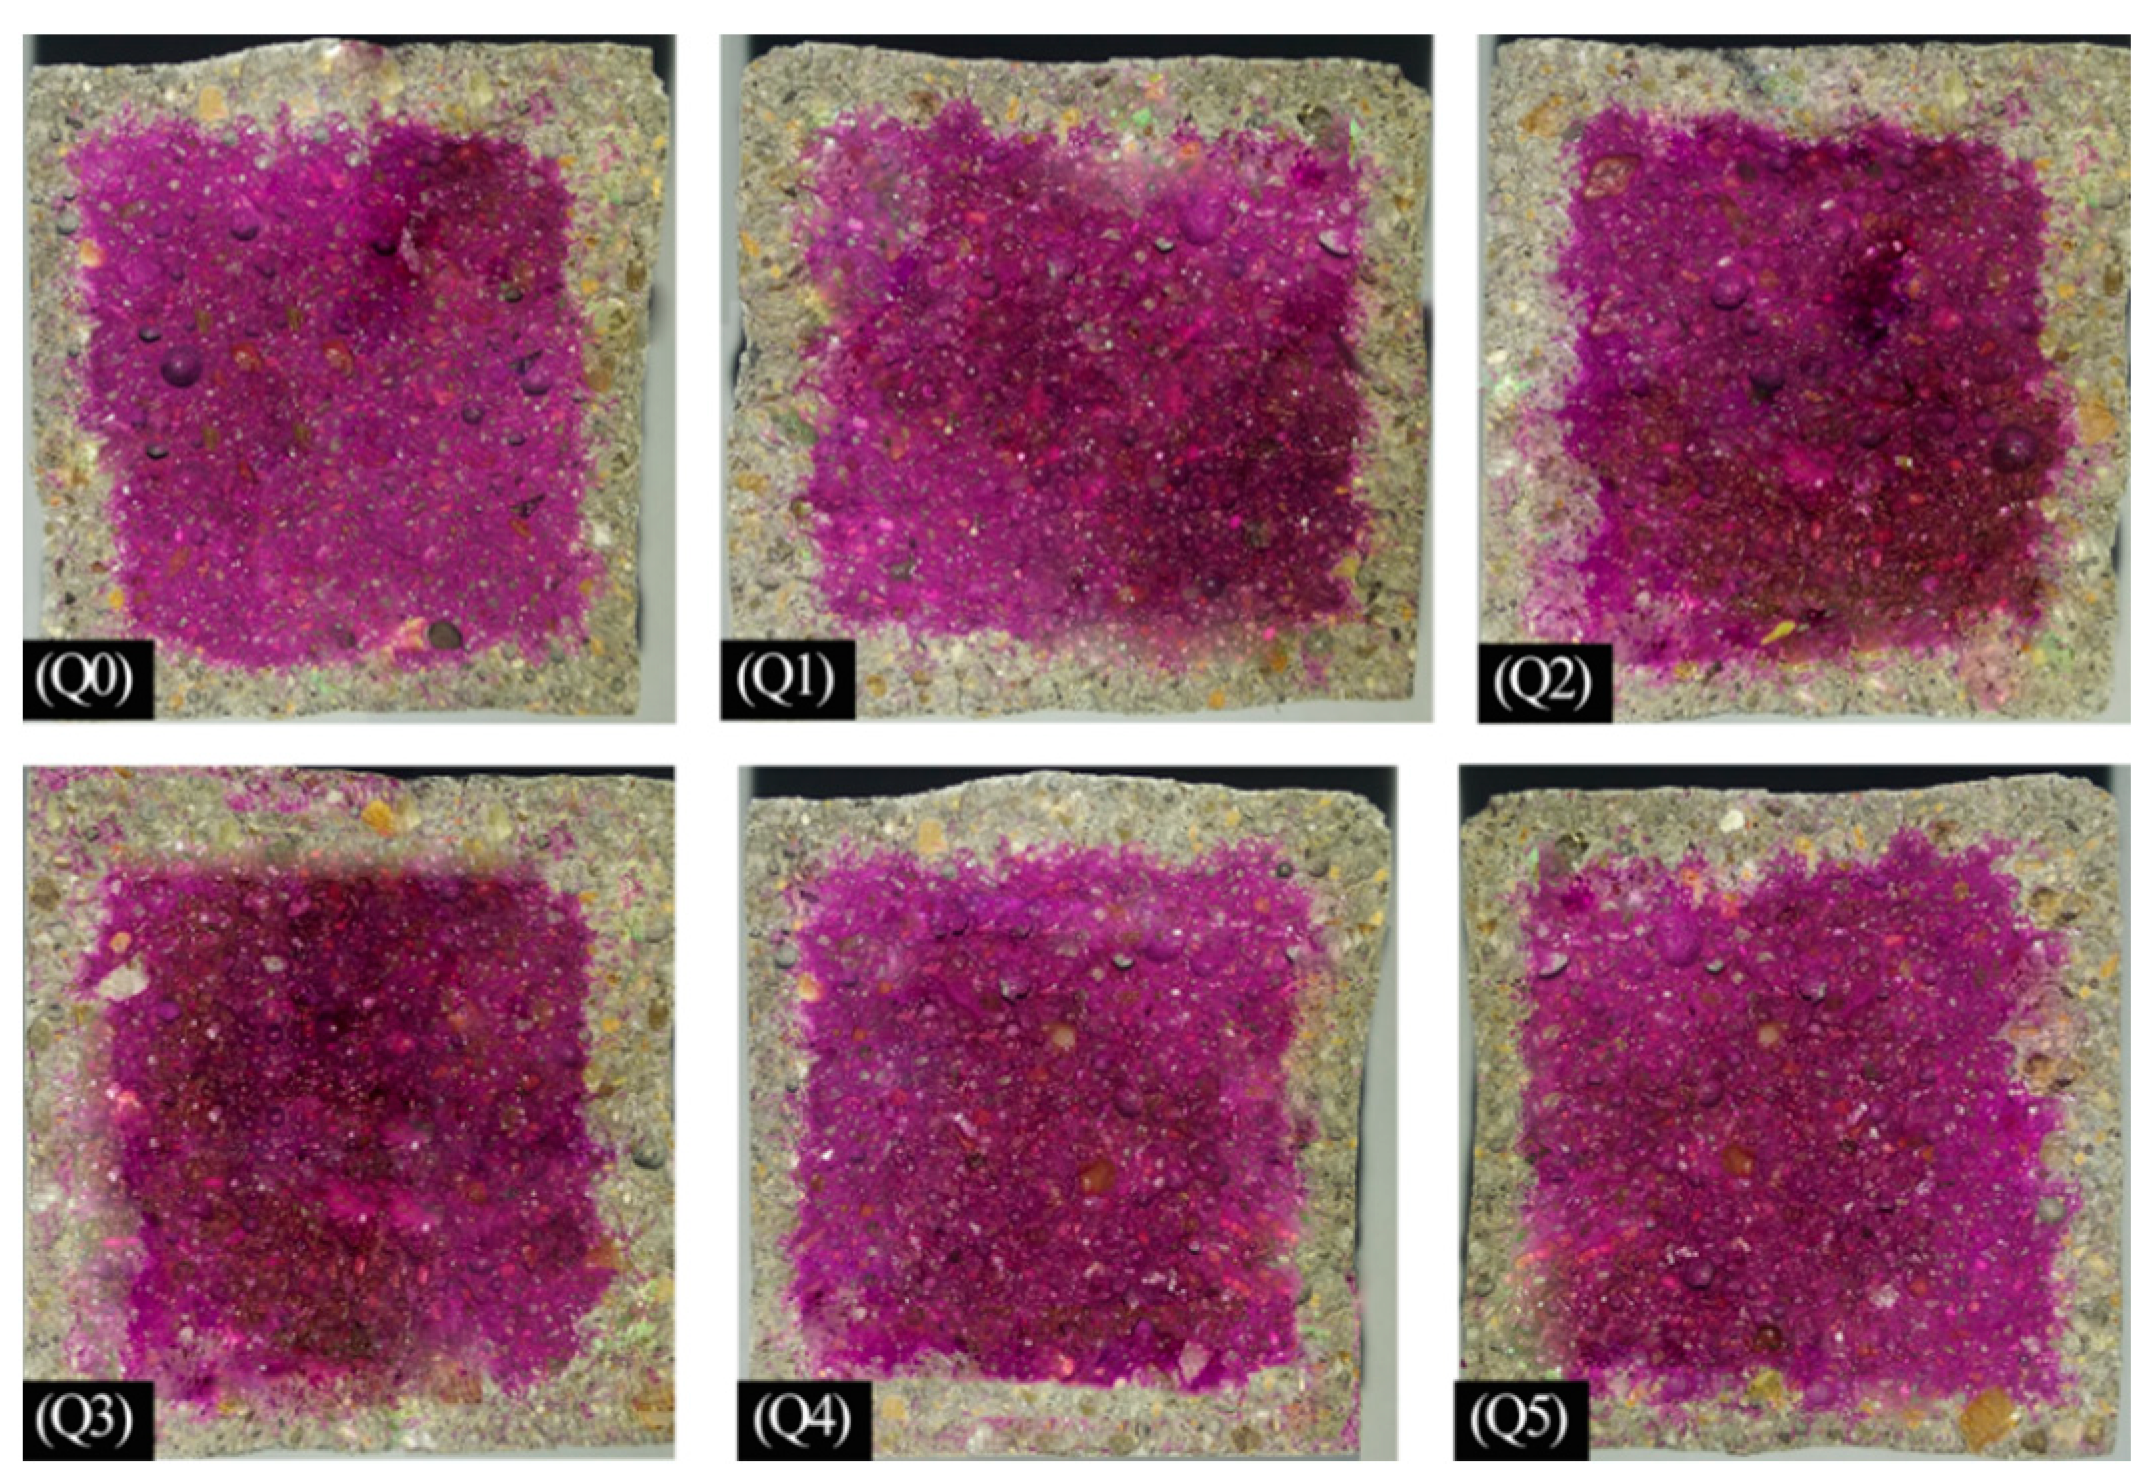
- (1)
- Mechanical agitation
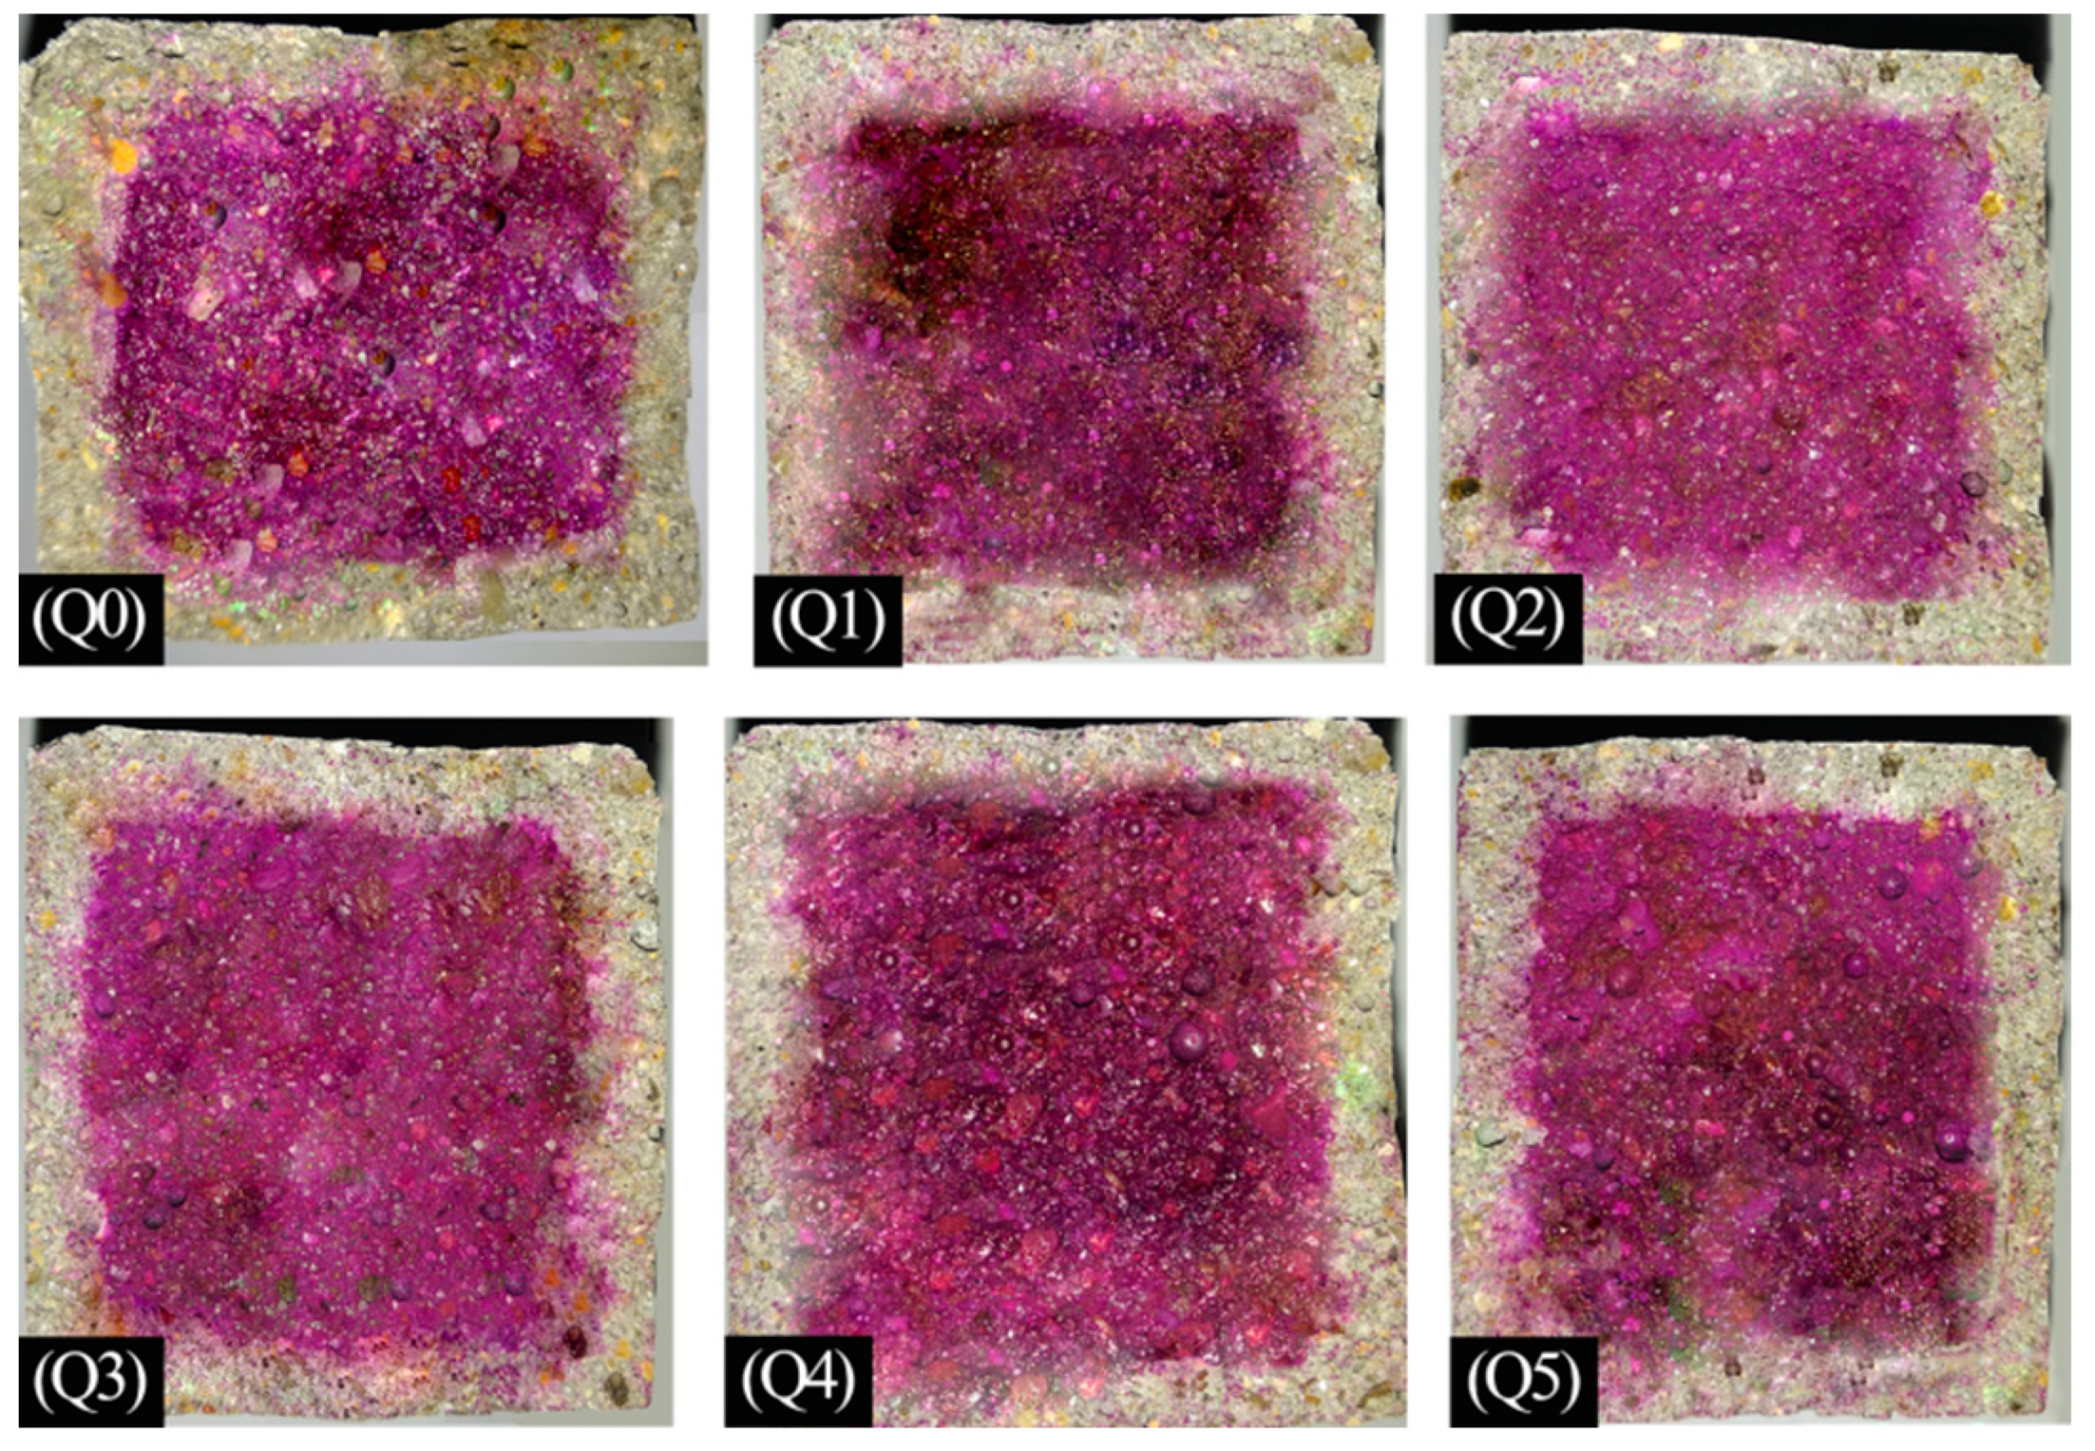
- (2)
- Ultrasonic vibration agitation
- (3)
- Comparative analysis of two stirring methods
4.2. pH Changing Zone
- (1)
- Mechanical agitation
- (2)
- Ultrasonic vibration agitation stirring
- (3)
- Comparative analysis between two stirring methods
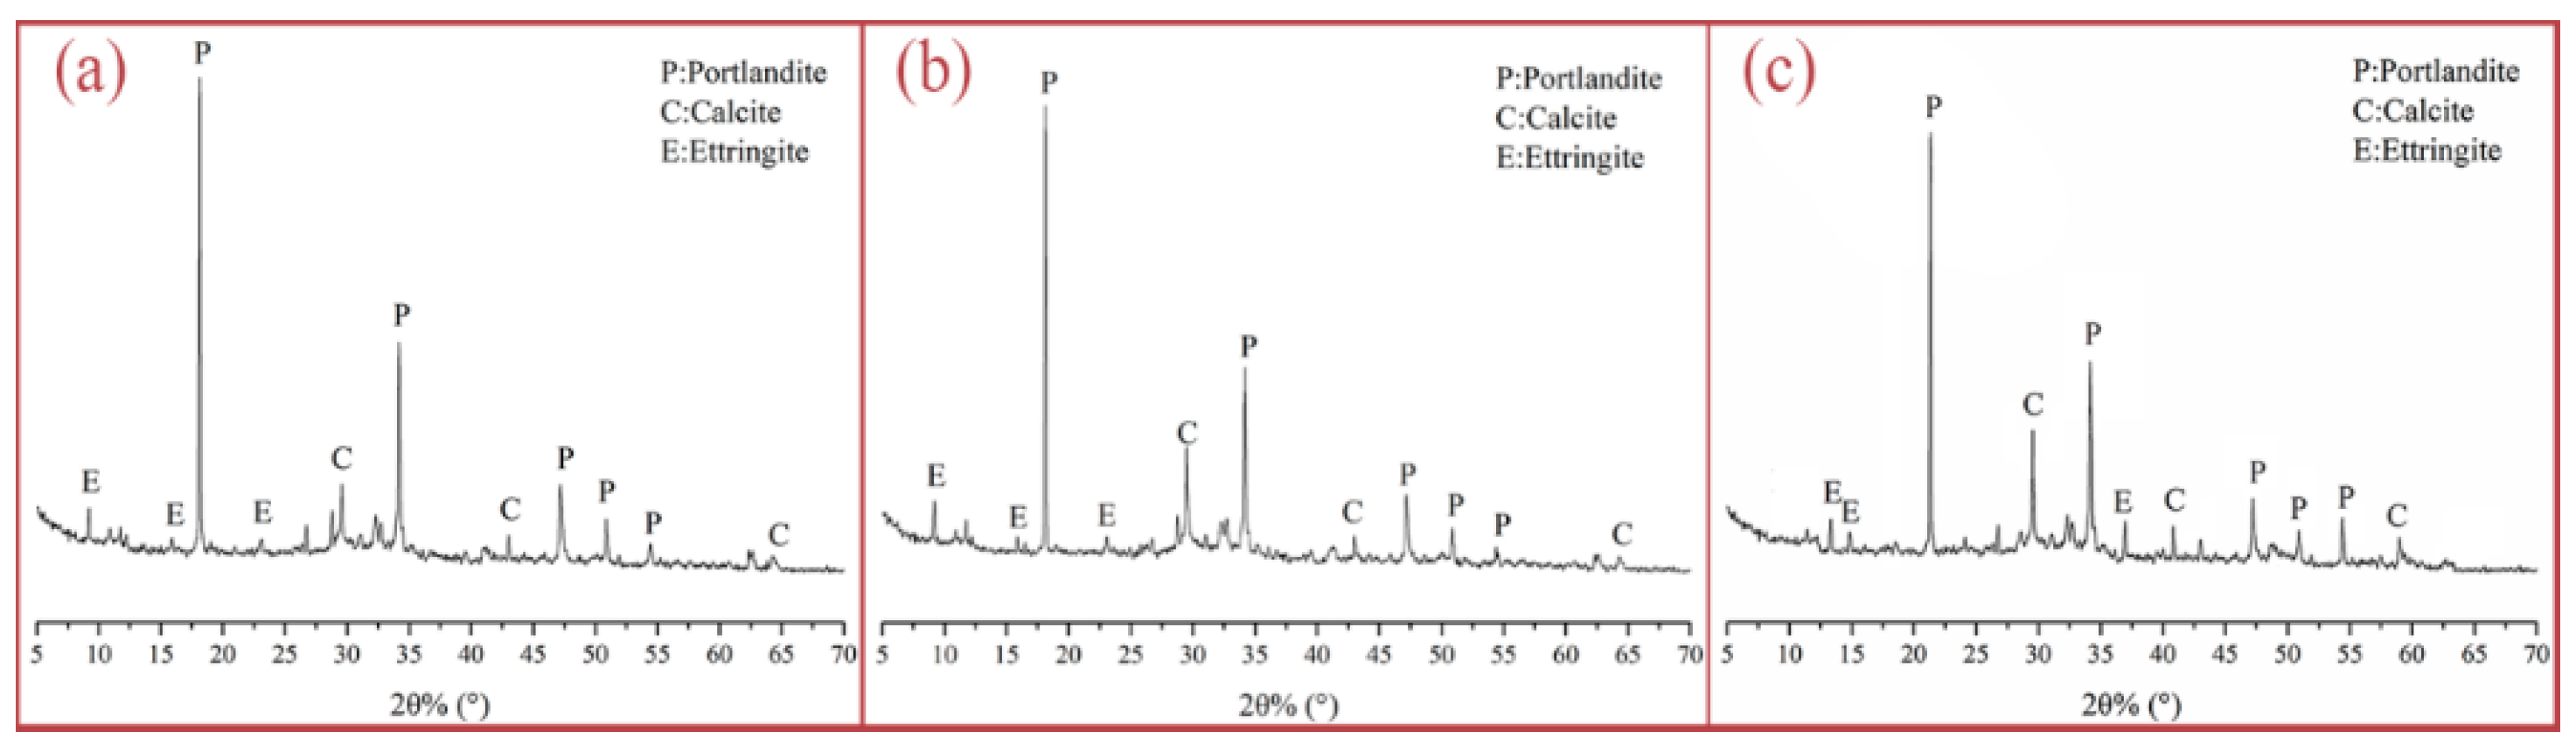
4.3. XRD Analysis of Hardened Paste
- (1)
- Pure cement paste
- (2)
- Cement paste after CO2 absorption under mechanical agitation
- (3)
- Cement paste after CO2 absorption under ultrasonic vibration agitation stirring
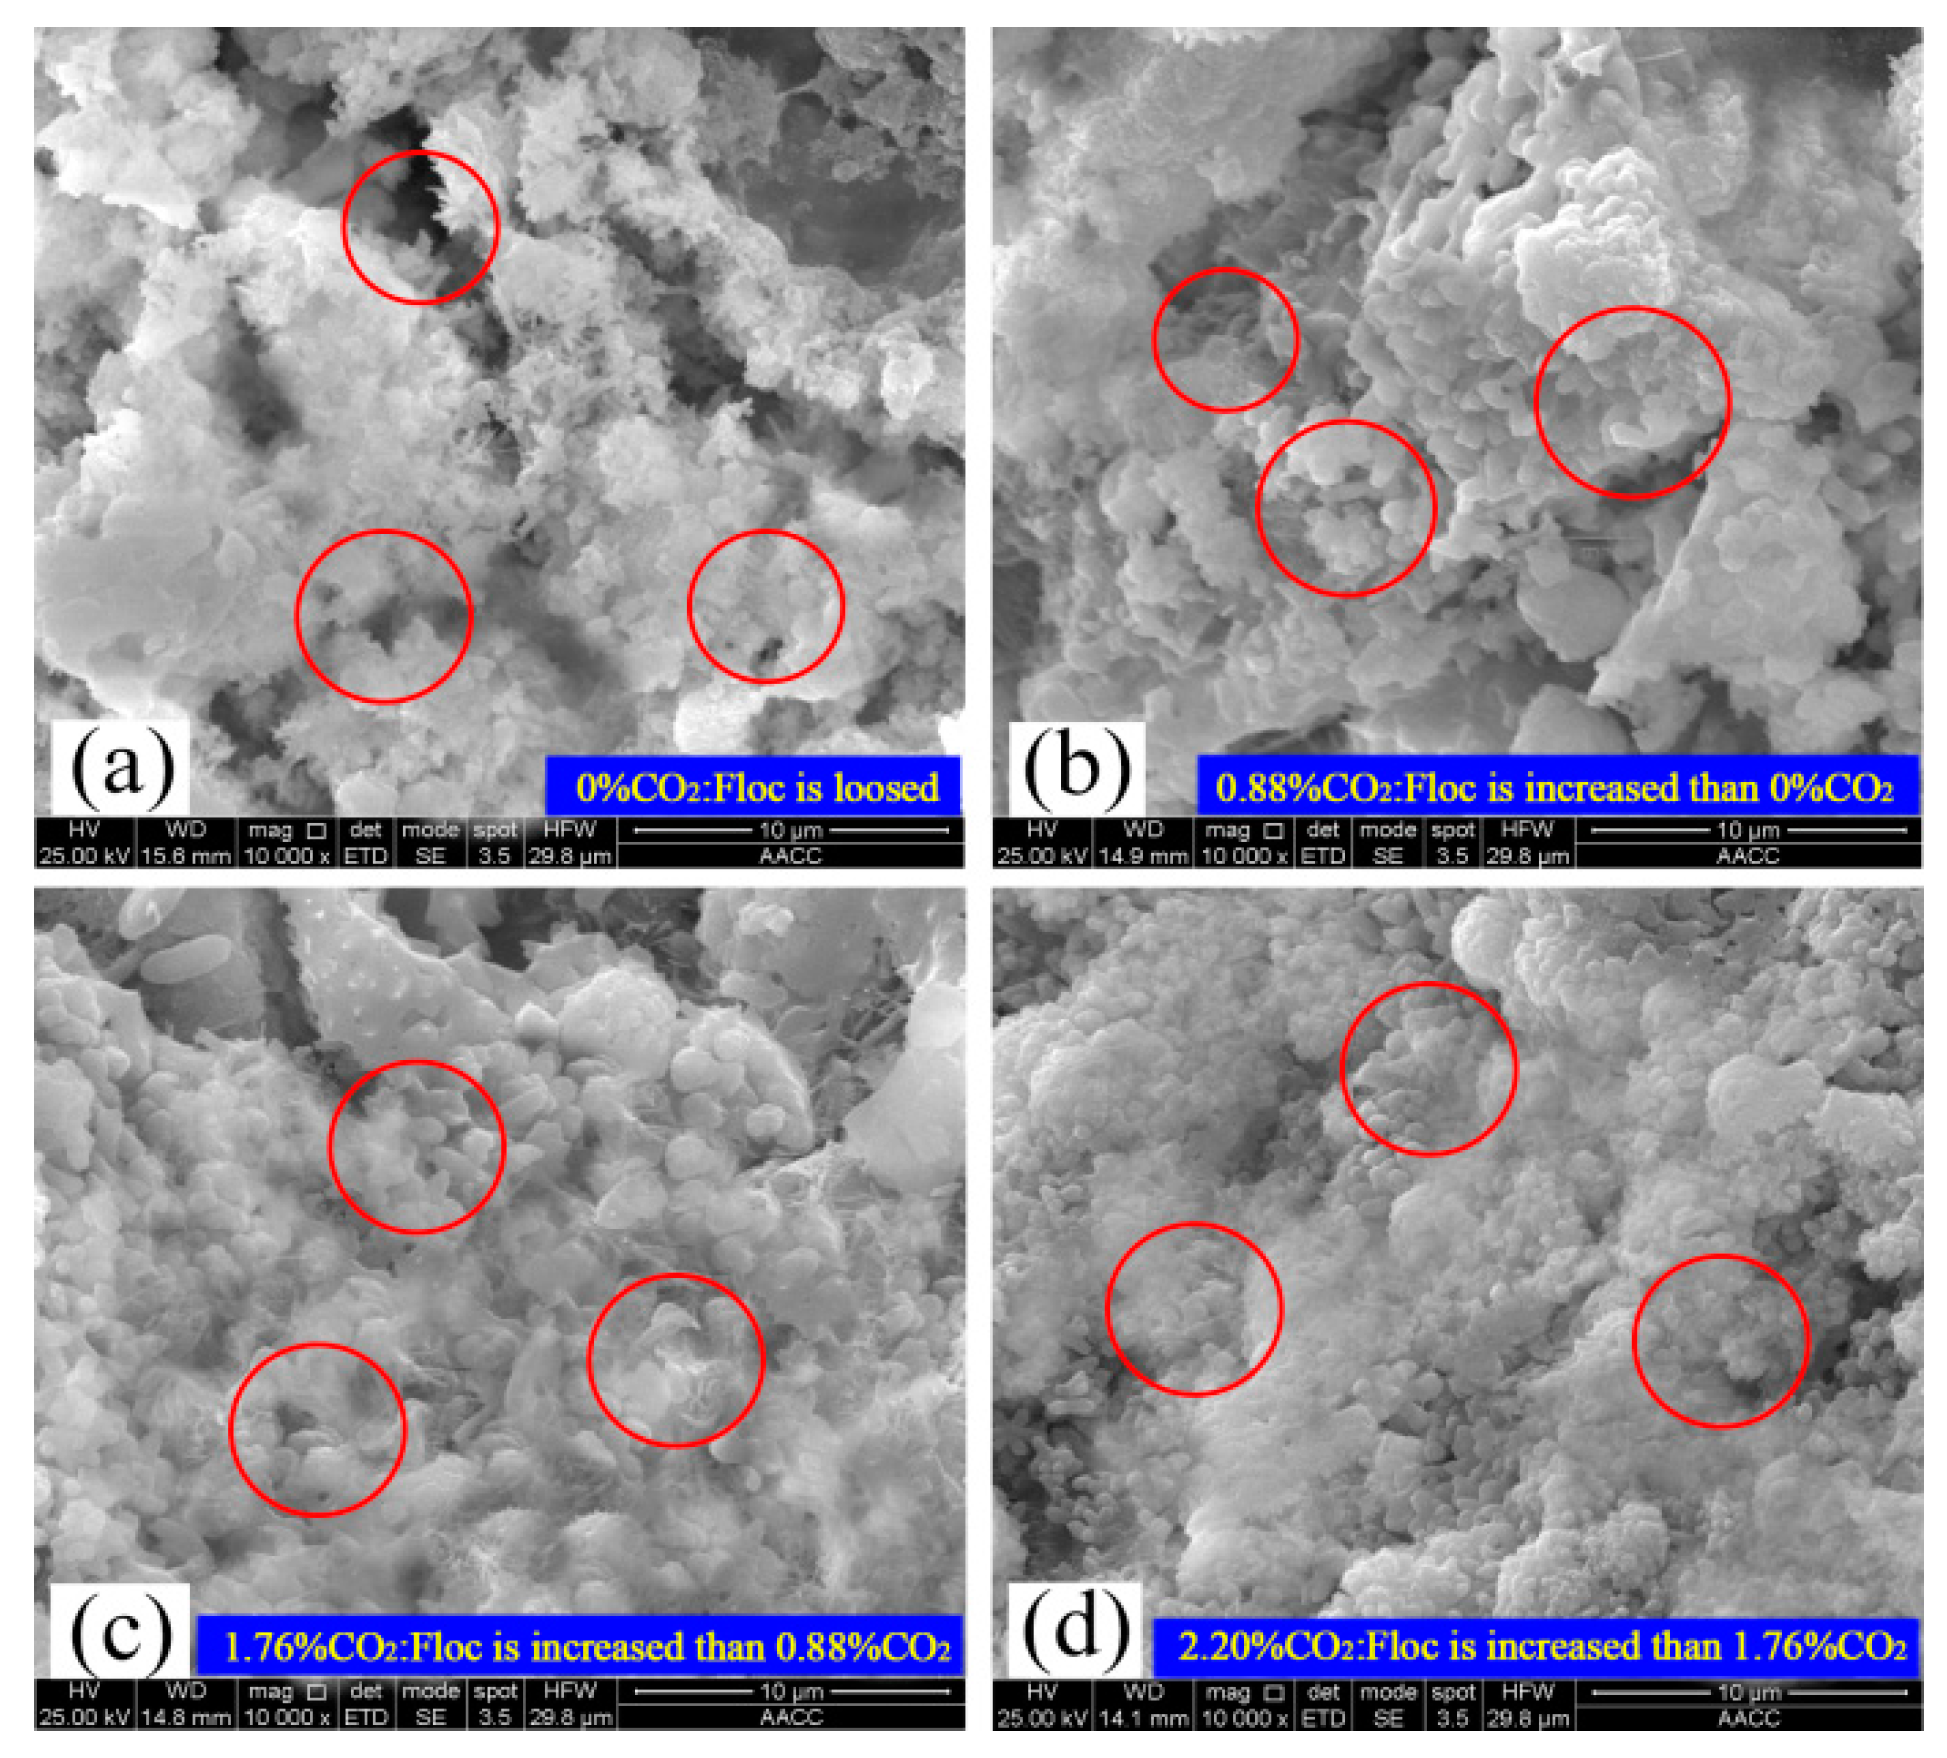
4.4. Microstructure Analysis of Hardened Paste
5. Concrete Carbonation Mechanism Analysis
5.1. Carbonation Mechanism Analysis of Ordinary Concretes
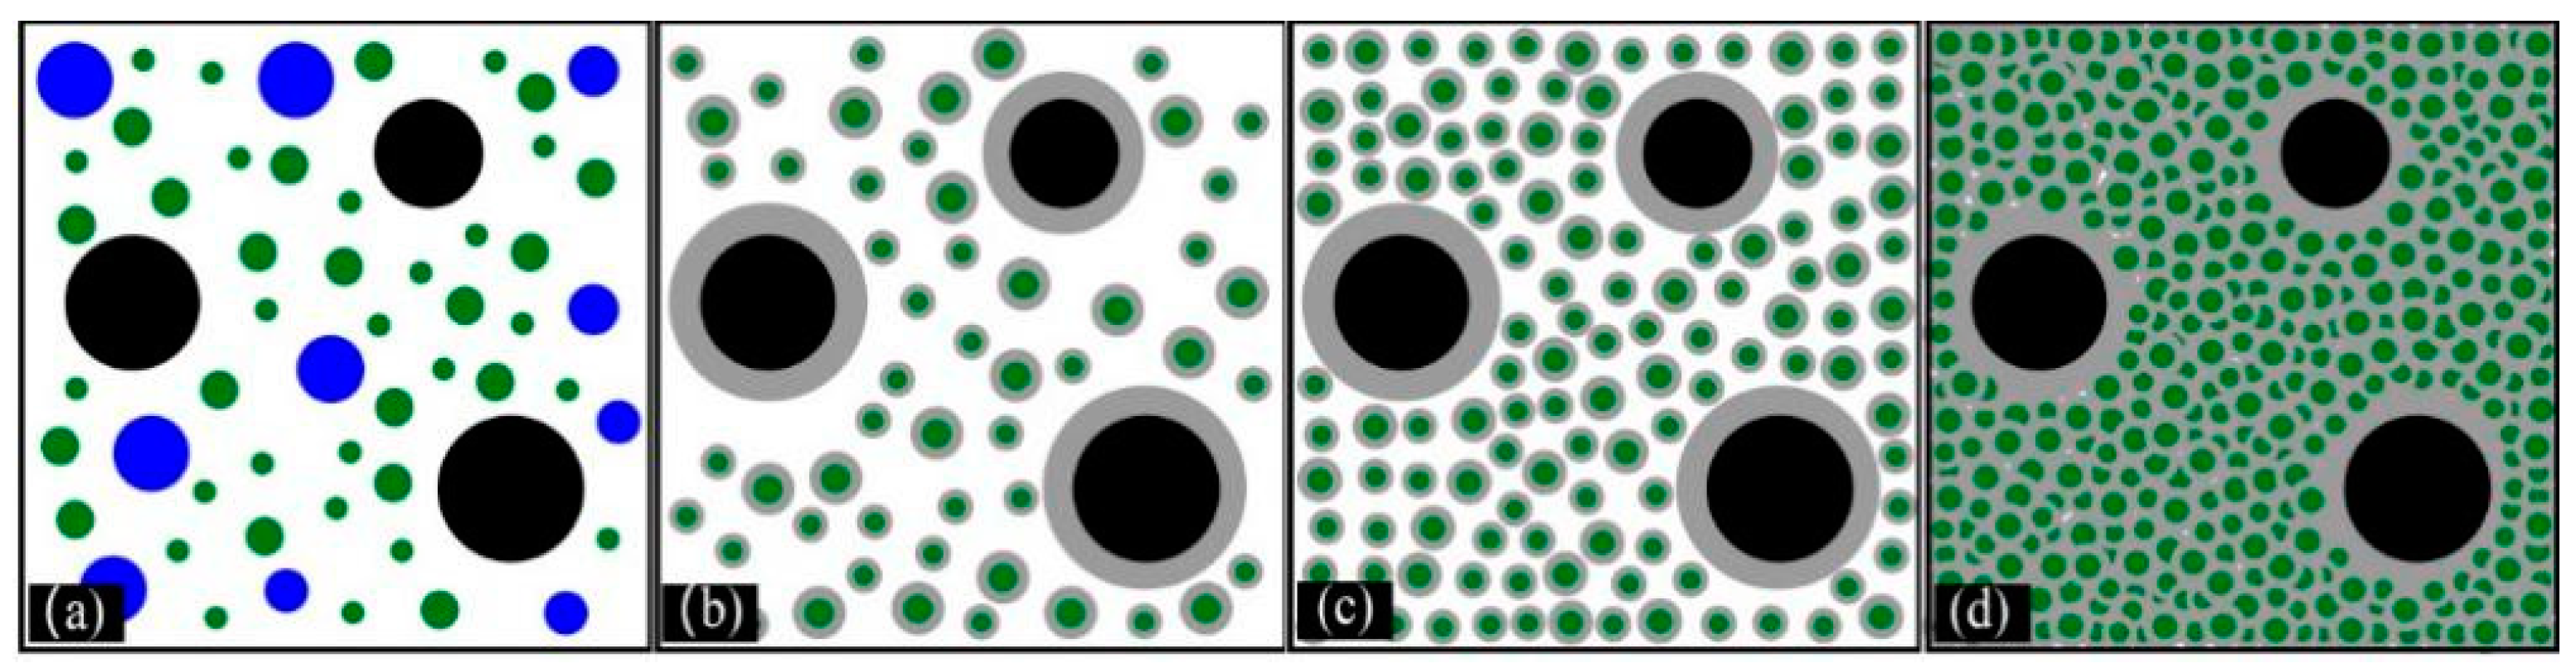
5.2. Carbonation Microstructure Analysis
- (1)
- Molding under mechanical agitation
- (2)
- Molding under ultrasonic vibration agitation
- (3)
- Microstructure analysis of CaCO3 nuclei before molding of cement mortar with CO2 absorption under ultrasonic vibration agitation
6. Summary
- (1)
- Carbonation resistance of cement mortar species after CO2 absorption under ultrasonic vibration is more obvious than that of species formed under mechanical stirring. Besides, carbonation resistance is positively related to CO2 absorption volume before cement molding.
- (2)
- pH variation values of carbonization range under ultrasonic vibration increase with the increase in CO2 absorption volume of cement mortar before carbonation, presenting a rising trend.
- (3)
- The diffraction peak of Ca(OH)2 of cement mortar after CO2 absorption under ultrasonic vibration decreases to some extent compared to that under mechanical stirring, but such a reduction is not very obvious. This proves that CO2 absorption by the cement mortar under ultrasonic vibration has small influences on Ca(OH)2.
- (4)
- After carbonization of CO2 absorbed slurry under ultrasonic vibration, the quantity of capillary tubes decreases significantly with the increase of CO2 absorption volume. As a result, porous structure is improved and compaction degree of cement-based material is increased, thus decreasing diffusion rate of CO2 in the cement paste base. Finally, carbonation resistance of cement-based materials is improved effectively.
Author Contributions
Funding
Institutional Review Board Statement
Informed Consent Statement
Data Availability Statement
Acknowledgments
Conflicts of Interest
References
- Yu, H.; Liu, Q.; Yu, G.X. European oil and gas compaines’ strategic targets of net zero emissions by 2050. Int. Petrol. Econ. 2020, 10, 31–36. [Google Scholar]
- Chandrasekharam, D.; Pathegama, G.R. CO2 emissions from renewables: Solar pv, hydrothermal and EGS sources. Geomech. Geophys. 2020, 6, 1–17. [Google Scholar] [CrossRef]
- Lin, B.Q.; Yao, X.; Liu, X.Y. The Strategic Adjustment of China’s Energy Use Structure in the Context of Energy-Saving and Carbon Emission-Reducing Initiatives. Soc. Sci. China 2010, 1, 5. [Google Scholar]
- Yang, Y.; Wang, L.; Cao, Z.; Mou, C.; Shen, L.; Zhao, J.; Fang, Y. CO2 emissions from cement industry in China: A bottom-up estimation from factory to regional and national levels. J. Geogr. Sci. 2017, 27, 711–730. [Google Scholar] [CrossRef]
- Ma, C.P.; Shi, D. Do the Unilateral Carbon Reduction Measures Contribute to the Global Carbon Emissions in Open Economy? A Review of Carbon Leakage. Int. Econ. Trade. Res. 2014, 30, 4–15. [Google Scholar]
- Wang, G.F. Legal Regulation on Environmental Risk of Global Carbon Emission: Criticism and Reflection. Theory. Mon. 2019, 8, 76–83. [Google Scholar]
- Liu, Z.J.; Shi, J.G.; Zhang, Y. Recent Advances in Storage Technology of Carbon Dioxide. Sino-Glob. Energy 2017, 22, 1–9. [Google Scholar]
- Miller, S.A.; John, V.M.; Pacca, S.A.; Horvath, A. Arpad Horvath. Carbon dioxide reduction potential in the global cement industry by 2050. Resour. Consenvercy. 2017, 114, 115–124. [Google Scholar] [CrossRef]
- Ampomah, W.; Balch, R.; Grigg, R.B.; Cather, M.; Gragg, E.; Will, R.A.; White, M.; Moodie, N.; Dai, Z. Performance assessment of CO2-enhanced oil recovery and storage in the Morrow reservoir. Geomech. Geophys. Geo. 2017, 3, 245–263. [Google Scholar] [CrossRef]
- Li, Y. Technical advancement and prospect for CO2 flooding enhanced oil recovery in low permeability reservoirs. Petrol. Geol. Recov. Effic. 2020, 27, 1–10. [Google Scholar]
- Levine, J.S.; Fukai, I.; Soeder, D.J.; Bromhal, G.; Dilmore, R.M.; Guthrie, G.D.; Rodosta, T.; Sanguinito, S.; Frailey, S.; Gorecki, C.; et al. U.S. DOE NETL methodology for estimating the prospective CO2 storage resource of shales at the national and regional scale. Int. J. Greenh. Gas Con. 2016, 51, 81–94. [Google Scholar] [CrossRef]
- Wan, T.; Mu, Z. The use of numerical simulation to investigate the enhanced Eagle Ford shale gas condensate well recovery using cyclic CO2 injection method with nano-pore effect. Fuel 2018, 233, 123–132. [Google Scholar] [CrossRef]
- Liu, L.L.; Ji, Y.S.; Gao, F.R.; Zhang, L.; Zhang, Z.Z.; Liu, X.Y. Study on high-efficiency CO2 absorption by fresh cement paste. Constra. Build. Mater. 2020, 270, 121364. [Google Scholar] [CrossRef]
- Liu, L.L.; Ji, Y.S.; Ma, Z.G.; Gao, F.R.; Xu, Z.S. Study on the Effects of Ultrasonic Agitation on CO2 Adsorption Efficiency Improvement of Cement Paste. Appl. Sci. 2021, 11, 6877. [Google Scholar] [CrossRef]
- Liu, X.Y. Research of the Hydration and Hardening Mechanism of Cement-Based Materials after Absorbing CO2 in Mixing Stage; China University of Mining and Technology: Xuzhou, China, 2019. [Google Scholar]
- Zhan, B.J.; Poon, C.S.; Shi, C.J. Materials characteristics affecting CO2 curing of concrete blocks containing recycled aggregates. Cem. Concr. Comp. 2016, 67, 50–59. [Google Scholar] [CrossRef]
- Zhan, B.J.; Xuan, D.X.; Poon, C.S.; Shi, C.J. Effect of curing parameters on CO2 curing of concrete blocks containing recycled aggregates. Cem. Concr. Comp. 2016, 71, 122–130. [Google Scholar] [CrossRef]
- Liang, C.; Pan, B.; Ma, Z.; He, Z.; Duan, Z. Utilization of CO2 curing to enhance the properties of recycled aggregate and prepared concrete: A review. Cem. Concr. Comp. 2019, 105, 103446. [Google Scholar] [CrossRef]
- Huang, G.D. Study on the Modification Enhancement and Carbonation Performance of Alkali-activated MSWI Bottom Ash; China University of Mining and Technology: Xuzhou, China, 2018. [Google Scholar]
- Xing, L.L. Stability of Steel Slag and Experimental Research on Steel Slag Coarse Aggregate Concrete; Xi’an University of Architecture and Technology: Xi’an, China, 2012. [Google Scholar]
- Hu, Y.J. Mechanical and High Temperature Resistance Properties of Fly Ash Geopolymer; China University of Mining and Technology: Xuzhou, China, 2017. [Google Scholar]
- Duan, P.; Yan, C.J.; Zhou, W. Effects of calcined layered double hydroxides on carbonation of concrete containing fly ash. Constr. Build. Mater. 2018, 160, 725–732. [Google Scholar] [CrossRef]
- Fang, Y.; Chang, J. Microstructure changes of waste hydrated cement paste induced by accelerated carbonation. Constr. Build. Mater. 2015, 76, 60–365. [Google Scholar] [CrossRef]
- Tam, V.W.; Butera, A.; Le, K.N. Microstructure and chemical properties for CO2 concrete. Constr. Build. Mater. 2020, 262, 120584. [Google Scholar] [CrossRef]
- Wang, Q.; Liu, X.; Xu, G.; Su, Y.B. Correlation study of concrete carbonation depth values tested by phenolphthalein and pH value. Concr. 2016, 4, 13–16. [Google Scholar]
- Liang, C.; Lu, N.; Ma, H.; Ma, Z.; Duan, Z. Carbonation behavior of recycled concrete with CO2-curing recycled aggregate under various environments. J. CO2 Util. 2020, 39, 101185. [Google Scholar]
- Yi, Z.W.; Wang, T.; Guo, R. Sustainable building material from CO2 mineralization slag: Aggregate for concretes and effect of CO2 curing. J. CO2 Util. 2020, 40, 101196. [Google Scholar] [CrossRef]
- Chen, T.F.; Bai, M.J.; Gao, X.J. Carbonation curing of cement mortars incorporating carbonated fly ash for performance improvement and CO2 sequestration. J. CO2 Util. 2021, 51, 101633. [Google Scholar] [CrossRef]
- Liua, W.; Lia, Y.Q.; Tang, L.P.; Dong, Z.J. XRD and 29Si MAS NMR study on carbonated cement paste under accelerated carbonation using different concentration of CO2. Mater. Today. Commun. 2019, 19, 464–470. [Google Scholar] [CrossRef]
- Dos Reis, G.S.; Cazacliu, B.; Artoni, R.; Torrenti, J.-M.; Hoffmann, C.S.; Lima, E.C. Coupling of attrition and accelerated carbonation for CO2 sequestration in recycled concrete aggregates. Clean. Eng. Technol. 2021, 3, 100106. [Google Scholar] [CrossRef]
- Zhang, D.; Ghoulehb, Z.; Shao, Y. Review on carbonation curing of cement based materials. J. CO2 Util. 2017, 21, 119–131. [Google Scholar] [CrossRef]
- Monkman, S.; Shao, Y. Carbonation Curing of Slag-Cement Concrete for Binding CO2 and Improving Performance. J. Mater. Civil. Eng. 2010, 22, 296–304. [Google Scholar] [CrossRef]
- Song, H.; Niu, D.T.; Li, C.H. Carbonation test of concrete containing mineral admixtures. J. Chin. Ceram. Soc. 2009, 37, 2066–2070. [Google Scholar]
- Liu, Z.; Meng, W. Fundamental understanding of carbonation curing and durability of carbonation-cured cement-based composites: A review. J. CO2 Util. 2021, 44, 101428. [Google Scholar]
- Fernández-Carrasco, L.; Rius, J.; Miravitlles, C. Supercritical carbonation of calcium aluminate cement. Cem. Concr. Res. 2008, 38, 1033–1037. [Google Scholar] [CrossRef]


| Chemical Composition | SiO2 | Al2O3 | Fe2O3 | CaO | MgO | f-CaO | Loss |
|---|---|---|---|---|---|---|---|
| Content (%) | 22.1 | 5.34 | 3.44 | 65.33 | 2.11 | 0.39 | 0.13 |
| Composition | C3S | C2S | C3A | C4AF |
|---|---|---|---|---|
| Content (%) | 54.04 | 22.84 | 8.39 | 10.42 |
| Specimen No. | R0 | R1 | R2 | R3 | R4 | R5 |
|---|---|---|---|---|---|---|
| CO2 AA (%) | 0 | 0.44 | 0.88 | 1.32 | 1.76 | 2.20 |
| 3 d/mm | 3.1 ± 0.2 | 2.9 ± 0.1 | 3.3 ± 0.2 | 3.5 ± 0.1 | 3.5 ± 0.2 | 3.6 ± 0.2 |
| 7 d/mm | 4.4 ± 0.3 | 4.3 ± 0.4 | 4.5 ± 0.3 | 4.6 ± 0.3 | 4.5 ± 0.2 | 4.5 ± 0.4 |
| 28 d/mm | 5.6 ± 0.3 | 5.5 ± 0.3 | 5.7 ± 0.4 | 6.0 ± 0.4 | 5.8 ± 0.4 | 6.0 ± 0.5 |
| No. | Q0 | Q1 | Q2 | Q3 | Q4 | Q5 |
|---|---|---|---|---|---|---|
| CO2 AA/% | 0 | 0.44 | 0.88 | 1.32 | 1.76 | 2.20 |
| 3 d/mm | 2.8 ± 0.1 | 2.6 ± 0.2 | 2.4 ± 0.1 | 2.3 ± 0.2 | 2.1 ± 0.1 | 2.0 ± 0.1 |
| 7 d/mm | 4.2 ± 0.3 | 4.0 ± 0.2 | 3.8 ± 0.3 | 3.6 ± 0.2 | 3.5 ± 0.3 | 3.3 ± 0.2 |
| 28 d/mm | 5.3 ± 0.4 | 5.2 ± 0.3 | 5.0 ± 0.4 | 4.7 ± 0.4 | 4.6 ± 0.3 | 4.4 ± 0.4 |
| Carbonation Depth/mm | 0 | 2 | 4 | 6 | 8 | 10 | 12 | 14 | 16 | 18 | 20 |
|---|---|---|---|---|---|---|---|---|---|---|---|
| CO2 0% | 8.5 ± 0.5 | 8.5 ± 0.6 | 8.5 ± 0.5 | 9.5 ± 0.7 | 11.7 ± 0.8 | 12.0 ± 1.1 | 13.0 ± 1.2 | 13.2 ± 1.1 | 13.1 ± 1.2 | 12.9 ± 1.0 | 13.0 ± 1.1 |
| CO2 0.44% | 8.5 ± 0.6 | 8.5 ± 0.7 | 8.5 ± 0.6 | 9.6 ± 0.8 | 11.0 ± 0.9 | 12.2 ± 1.1 | 13.1 ± 1.0 | 13.0 ± 1.2 | 13.0 ± 1.1 | 13.1 ± 1.2 | 13.1 ± 1.0 |
| CO2 0.88% | 8.5 ± 0.6 | 8.5 ± 0.7 | 8.5 ± 0.8 | 9.3 ± 0.6 | 10.5 ± 0.9 | 11.6 ± 1.0 | 13.1 ± 1.3 | 12.9 ± 1.3 | 13.2 ± 1.0 | 12.9 ± 1.1 | 13.1 ± 1.1 |
| CO2 1.32% | 8.5 ± 0.6 | 8.5 ± 0.7 | 8.5 ± 0.6 | 8.5 ± 0.8 | 9.7 ± 0.9 | 11.1 ± 0.9 | 13.0 ± 1.2 | 13.1 ± 1.2 | 12.9 ± 1.1 | 13.0 ± 1.2 | 13.1 ± 1.2 |
| CO2 1.76% | 8.5 ± 0.5 | 8.5 ± 0.7 | 8.5 ± 0.8 | 9.0 ± 0.2 | 10.2 ± 1.0 | 10.9 ± 1.1 | 12.9 ± 1.2 | 13.0 ± 1.1 | 13.0 ± 1.2 | 13.2 ± 1.2 | 13.1 ± 1.3 |
| CO2 2.20% | 8.5 ± 0.6 | 8.5 ± 0.7 | 8.5 ± 0.6 | 8.5 ± 0.6 | 9.5 ± 1.0 | 10.8 ± 0.9 | 12.8 ± 1.1 | 13.1 ± 1.1 | 13.0 ± 1.0 | 13.1 ± 1.1 | 13.2 ± 1.0 |
| Carbonation Depth/mm | 0 | 2 | 4 | 6 | 8 | 10 | 12 | 14 | 16 | 18 | 20 |
|---|---|---|---|---|---|---|---|---|---|---|---|
| CO2 0% | 8.5 ± 0.2 | 8.5 ± 0.2 | 8.5 ± 0.2 | 8.6 ± 0.2 | 9.8 ± 0.2 | 11.2 ± 0.2 | 13.1 ± 0.2 | 13.0 ± 0.2 | 13.1 ± 0.2 | 12.9 ± 0.2 | 13.1 ± 0.2 |
| CO2 0.44% | 8.5 ± 0.2 | 8.5 ± 0.2 | 8.5 ± 0.2 | 8.7 ± 0.2 | 10.0 ± 0.2 | 11.5 ± 0.2 | 13.3 ± 0.2 | 13.1 ± 0.2 | 13.1 ± 0.2 | 13.2 ± 0.2 | 13.0 ± 0.2 |
| CO2 0.88% | 8.5 ± 0.2 | 8.5 ± 0.2 | 8.5 ± 0.2 | 8.7 ± 0.2 | 10.4 ± 0.2 | 12.0 ± 0.2 | 13.1 ± 0.2 | 12.9 ± 0.2 | 13.2 ± 0.2 | 13.1 ± 0.2 | 13.1 ± 0.2 |
| CO2 1.32% | 8.5 ± 0.2 | 8.5 ± 0.2 | 8.5 ± 0.2 | 8.8 ± 0.2 | 10.9 ± 0.2 | 12.3 ± 0.2 | 13.0 ± 0.2 | 13.2 ± 0.2 | 13.0 ± 0.2 | 13.3 ± 0.2 | 13.2 ± 0.2 |
| CO2 1.76% | 8.5 ± 0.2 | 8.5 ± 0.2 | 8.5 ± 0.2 | 9.0 ± 0.2 | 11.2 ± 0.2 | 12.7 ± 0.2 | 13.1 ± 0.2 | 13.2 ± 0.2 | 13.1 ± 0.2 | 13.2 ± 0.2 | 13.1 ± 0.2 |
| CO2 2.20% | 8.5 ± 0.2 | 8.5 ± 0.2 | 8.5 ± 0.2 | 9.0 ± 0.2 | 11.5 ± 0.2 | 13.1 ± 0.2 | 13.2 ± 0.2 | 13.0 ± 0.2 | 13.2 ± 0.2 | 13.1 ± 0.2 | 13.2 ± 0.2 |
Disclaimer/Publisher’s Note: The statements, opinions and data contained in all publications are solely those of the individual author(s) and contributor(s) and not of MDPI and/or the editor(s). MDPI and/or the editor(s) disclaim responsibility for any injury to people or property resulting from any ideas, methods, instructions or products referred to in the content. |
© 2023 by the authors. Licensee MDPI, Basel, Switzerland. This article is an open access article distributed under the terms and conditions of the Creative Commons Attribution (CC BY) license (https://creativecommons.org/licenses/by/4.0/).
Share and Cite
Liu, L.; Ji, Y.; Gao, F.; Xu, Z. Research on Influences of Ultrasonic Vibration Agitation Stirring on Carbonation Resistance of Cement-Based Materials after Absorption of CO2. Appl. Sci. 2023, 13, 4256. https://doi.org/10.3390/app13074256
Liu L, Ji Y, Gao F, Xu Z. Research on Influences of Ultrasonic Vibration Agitation Stirring on Carbonation Resistance of Cement-Based Materials after Absorption of CO2. Applied Sciences. 2023; 13(7):4256. https://doi.org/10.3390/app13074256
Chicago/Turabian StyleLiu, Lili, Yongsheng Ji, Furong Gao, and Zhishan Xu. 2023. "Research on Influences of Ultrasonic Vibration Agitation Stirring on Carbonation Resistance of Cement-Based Materials after Absorption of CO2" Applied Sciences 13, no. 7: 4256. https://doi.org/10.3390/app13074256
APA StyleLiu, L., Ji, Y., Gao, F., & Xu, Z. (2023). Research on Influences of Ultrasonic Vibration Agitation Stirring on Carbonation Resistance of Cement-Based Materials after Absorption of CO2. Applied Sciences, 13(7), 4256. https://doi.org/10.3390/app13074256