Article

Multiplicative Vector Fusion Model for Detecting Deepfake News in Social Media

by
Yalamanchili Salini
* and
Jonnadula Harikiran
School of Computer Science and Engineering, VIT-AP University, Amaravati 522237, India
*
Author to whom correspondence should be addressed.
Appl. Sci. 2023, 13(7), 4207; https://doi.org/10.3390/app13074207
Submission received: 8 February 2023 / Revised: 12 March 2023 / Accepted: 21 March 2023 / Published: 26 March 2023
(This article belongs to the Special Issue Deep Learning Architectures for Computer Vision)

Abstract

:
In the digital age, social media platforms are becoming vital tools for generating and detecting deepfake news due to the rapid dissemination of information. Unfortunately, today, fake news is being developed at an accelerating rate that can cause substantial problems, such as early detection of fake news, a lack of labelled data available for training, and identifying fake news instances that still need to be discovered. Identifying false news requires an in-depth understanding of authors, entities, and the connections between words in a long text. Unfortunately, many deep learning (DL) techniques have proven ineffective with lengthy texts to address these issues. This paper proposes a TL-MVF model based on transfer learning for detecting and generating deepfake news in social media. To generate the sentences, the T5, or Text-to-Text Transfer Transformer model, was employed for data cleaning and feature extraction. In the next step, we designed an optimal hyperparameter RoBERTa model for effectively detecting fake and real news. Finally, we propose a multiplicative vector fusion model for classifying fake news from real news efficiently. A real-time and benchmarked dataset was used to test and validate the proposed TL-MVF model. For the TL-MVF model, F-score, accuracy, precision, recall, and AUC were performance evaluation measures. As a result, the proposed TL-MVF performed better than existing benchmarks.

1. Introduction

Fake news can be disseminated to the public to produce misinformation, which can lead to unexpected fake results. On social media, fake news has had a significant impact on the quality of life. Because the internet is so widely available, there is a greater likelihood that false information will be disseminated, which can lead to major issues [1]. Fake news, for example, can lead to political instability, which in turn can pose a threat to national security. Public safety can be jeopardized as a result of false reporting. There was a lot of misinformation on the internet during the 2016 US elections and the COVID-19 outbreak. About 62% of Americans will rely on social media to obtain their news. Because of these factors, the ability to identify fake news is becoming increasingly important. Fake news can be identified using the information contained in several sources. Unfortunately, human intervention is required in the majority of cases to verify the validity of the data sample. Users of social media platforms have instantaneous, global access to one another. The same may be said for domestic and international current events, of which they notify the public. It is not always possible to confirm the veracity of a news item due to a lack of cross-referencing before its dissemination to the public and because conspiracy theories, political interests, and expediency can influence the information [2]. Therefore, the phenomenon of fake news propagation is severe and daily, and it is vital to address it to protect principles and values.
Facebook, Twitter, TikTok, and Instagram are all examples of social media platforms that promote news sharing, communication, interaction, and cooperation. The use of deep learning models for marketing and attracting new customers is not limited to personal communication. Nevertheless, the development of mobile apps and the services they offer have made these networks more accessible and easier to use. A wide range of issues, such as economics, the environment, and politics, are affected by fake news or misinformation on social media. Publishers of fake news and false statements may be doing it for a variety of reasons, including entertainment, misinforming the public about a topic, raising the number of visitors to a website, or supporting a prejudiced viewpoint. They fall into one of two categories: illegal or fraudulent. In order to detect fake news, natural language processing (NLP) is crucial for preventing problems with feature extraction caused by human involvement. Machine learning and deep learning are used to identify fake news [3]. Higher accuracy is obtained through DL models; however, disappearing gradients may be a problem with longer cycles of data. Due to sequential reliance, training time will also be longer. Deep learning transformers, on the other hand, were able to work around these issues and produce encouraging outcomes. High performance was achieved using positional encoding and a network model with only attention and fully linked layers [4].
There has been a lot of discussion about fake news during the 2016 US election, but the topic is not new. Media outlets, journalists, and editors usually follow a strict code of behavior when sharing news. The internet introduced a new way of consuming, publishing, and sharing information in the late twentieth century. Many people turn to social media for news these days. Around half of the world’s population uses social media. In this way, fake news can sometimes be difficult to discern. Regarding news dissemination, social media sites and networks offer many advantages, including instant access to information, free distribution, and no time constraints. There needs to be more regulation for these platforms.
Using social media to disseminate false information undermines trust in the news ecosystem, damages individual and organizational reputations, and causes fear among the general public—all of which threaten society’s stability. Since fake news uses terminology similar to real news, it is very difficult to distinguish fake news from real news. Real news exists to instill confidence in the public. In order to prevent rumors, identity theft, a lack of authenticity and confidentiality, and fake profiles across online platforms, there is a heightened need to deal with the spread of false data across online platforms. Therefore, we used the RoBERTa base model as the foundation for our fake news detector model.
The model has an extra set of layers, such as dropout layers, activation functions, etc., added to one of the transformer’s outputs and consists of three fully connected layers. To accomplish this fake news identification task effectively, the transformer model was developed. The pre-trained RoBERTa model mostly produces two results. For activities requiring a transformation from one sequence to another, such as translating sentences or assigning tags, the first output is a probability vector examined with the T5 model. The second output is a probability vector with the RoBERTa model that can be utilized for various classification tasks. These include spotting bogus news, analyzing sentiment, identifying spam, and so on. When applied to a model, our implementation makes use of the T5 model, which processes input samples before feeding them to a previously trained model. This study’s main contribution is proof that partial input sequences are sufficient for classification by the pre-trained RoBERTa model. As a result, the proposed improved model can also categorize tasks such as detecting fake news and classifying detected news, among others, using the MVF technique.
The following list of contributions is achieved by this study:
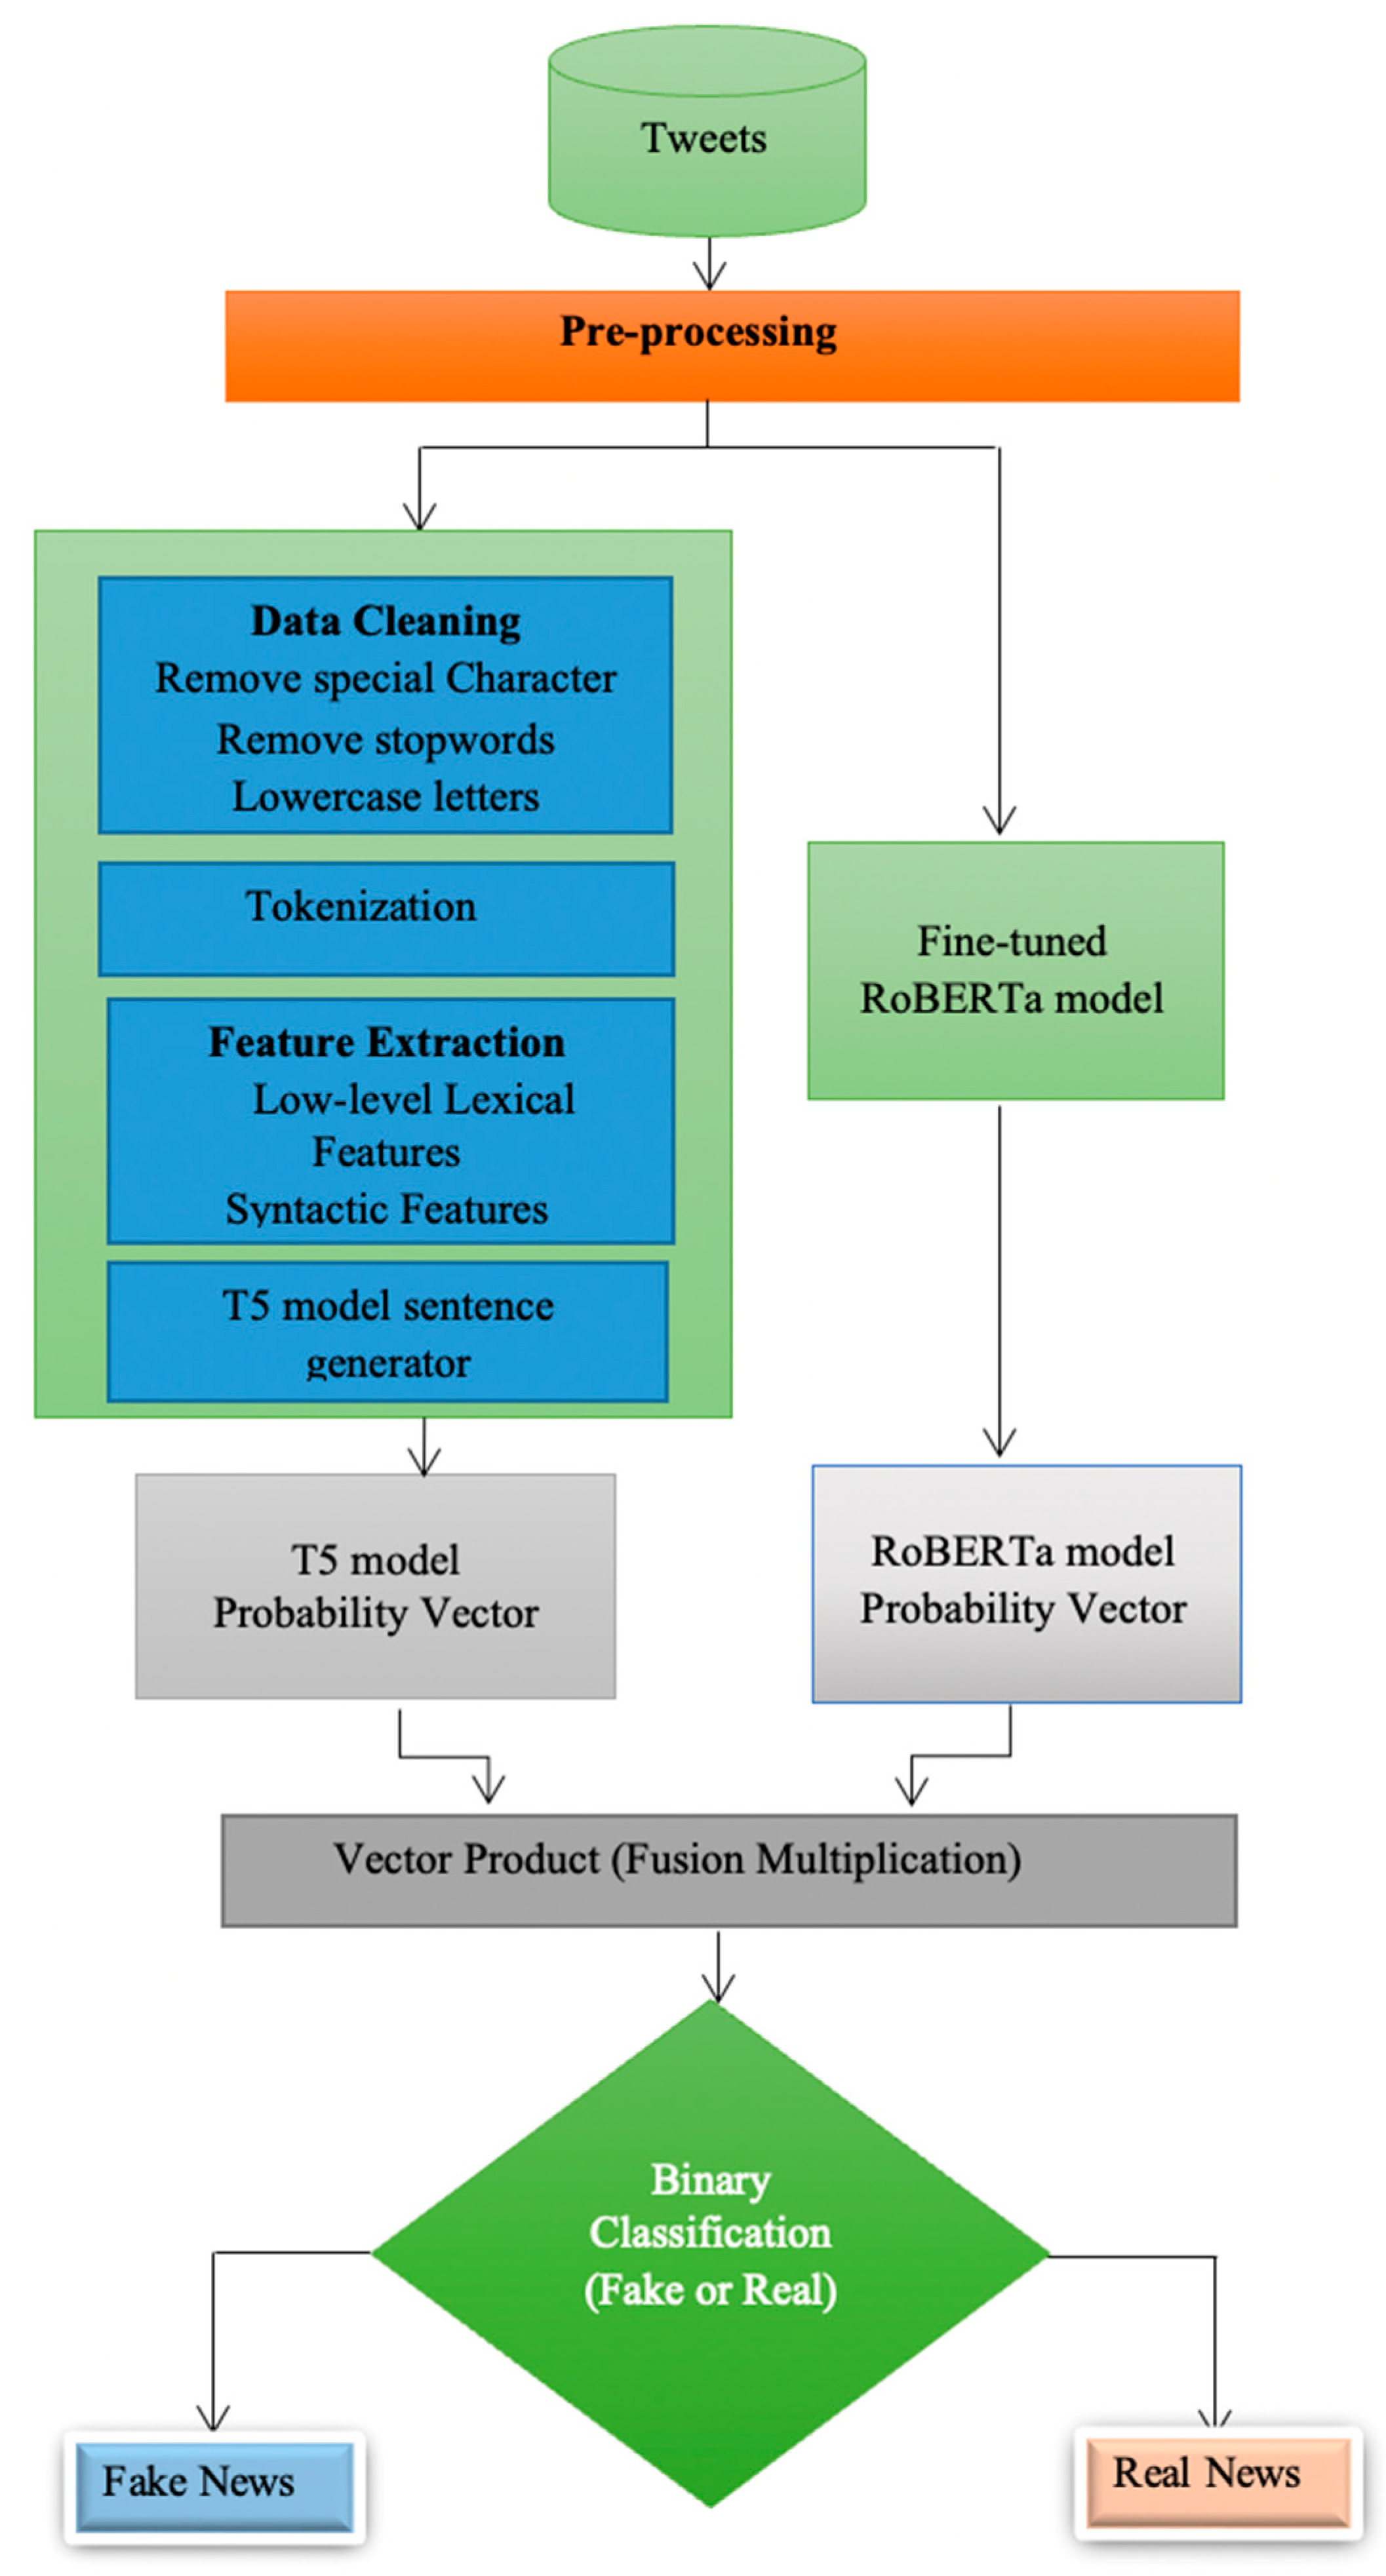
  • Initially, we performed data pre-processing and sentence generation from deepfake news datasets with the T5 model.
  • We designed a fine-tuned RoBERTa model to detect deepfake and real news effectively with optimal parameters.
  • To classify deepfake news from real news on social media datasets, we proposed a transfer learning-based multiplicative vector fusion (TL-MVF) model.
  • The proposed TL-MVF model was tested and validated on real-time and benchmarked datasets.
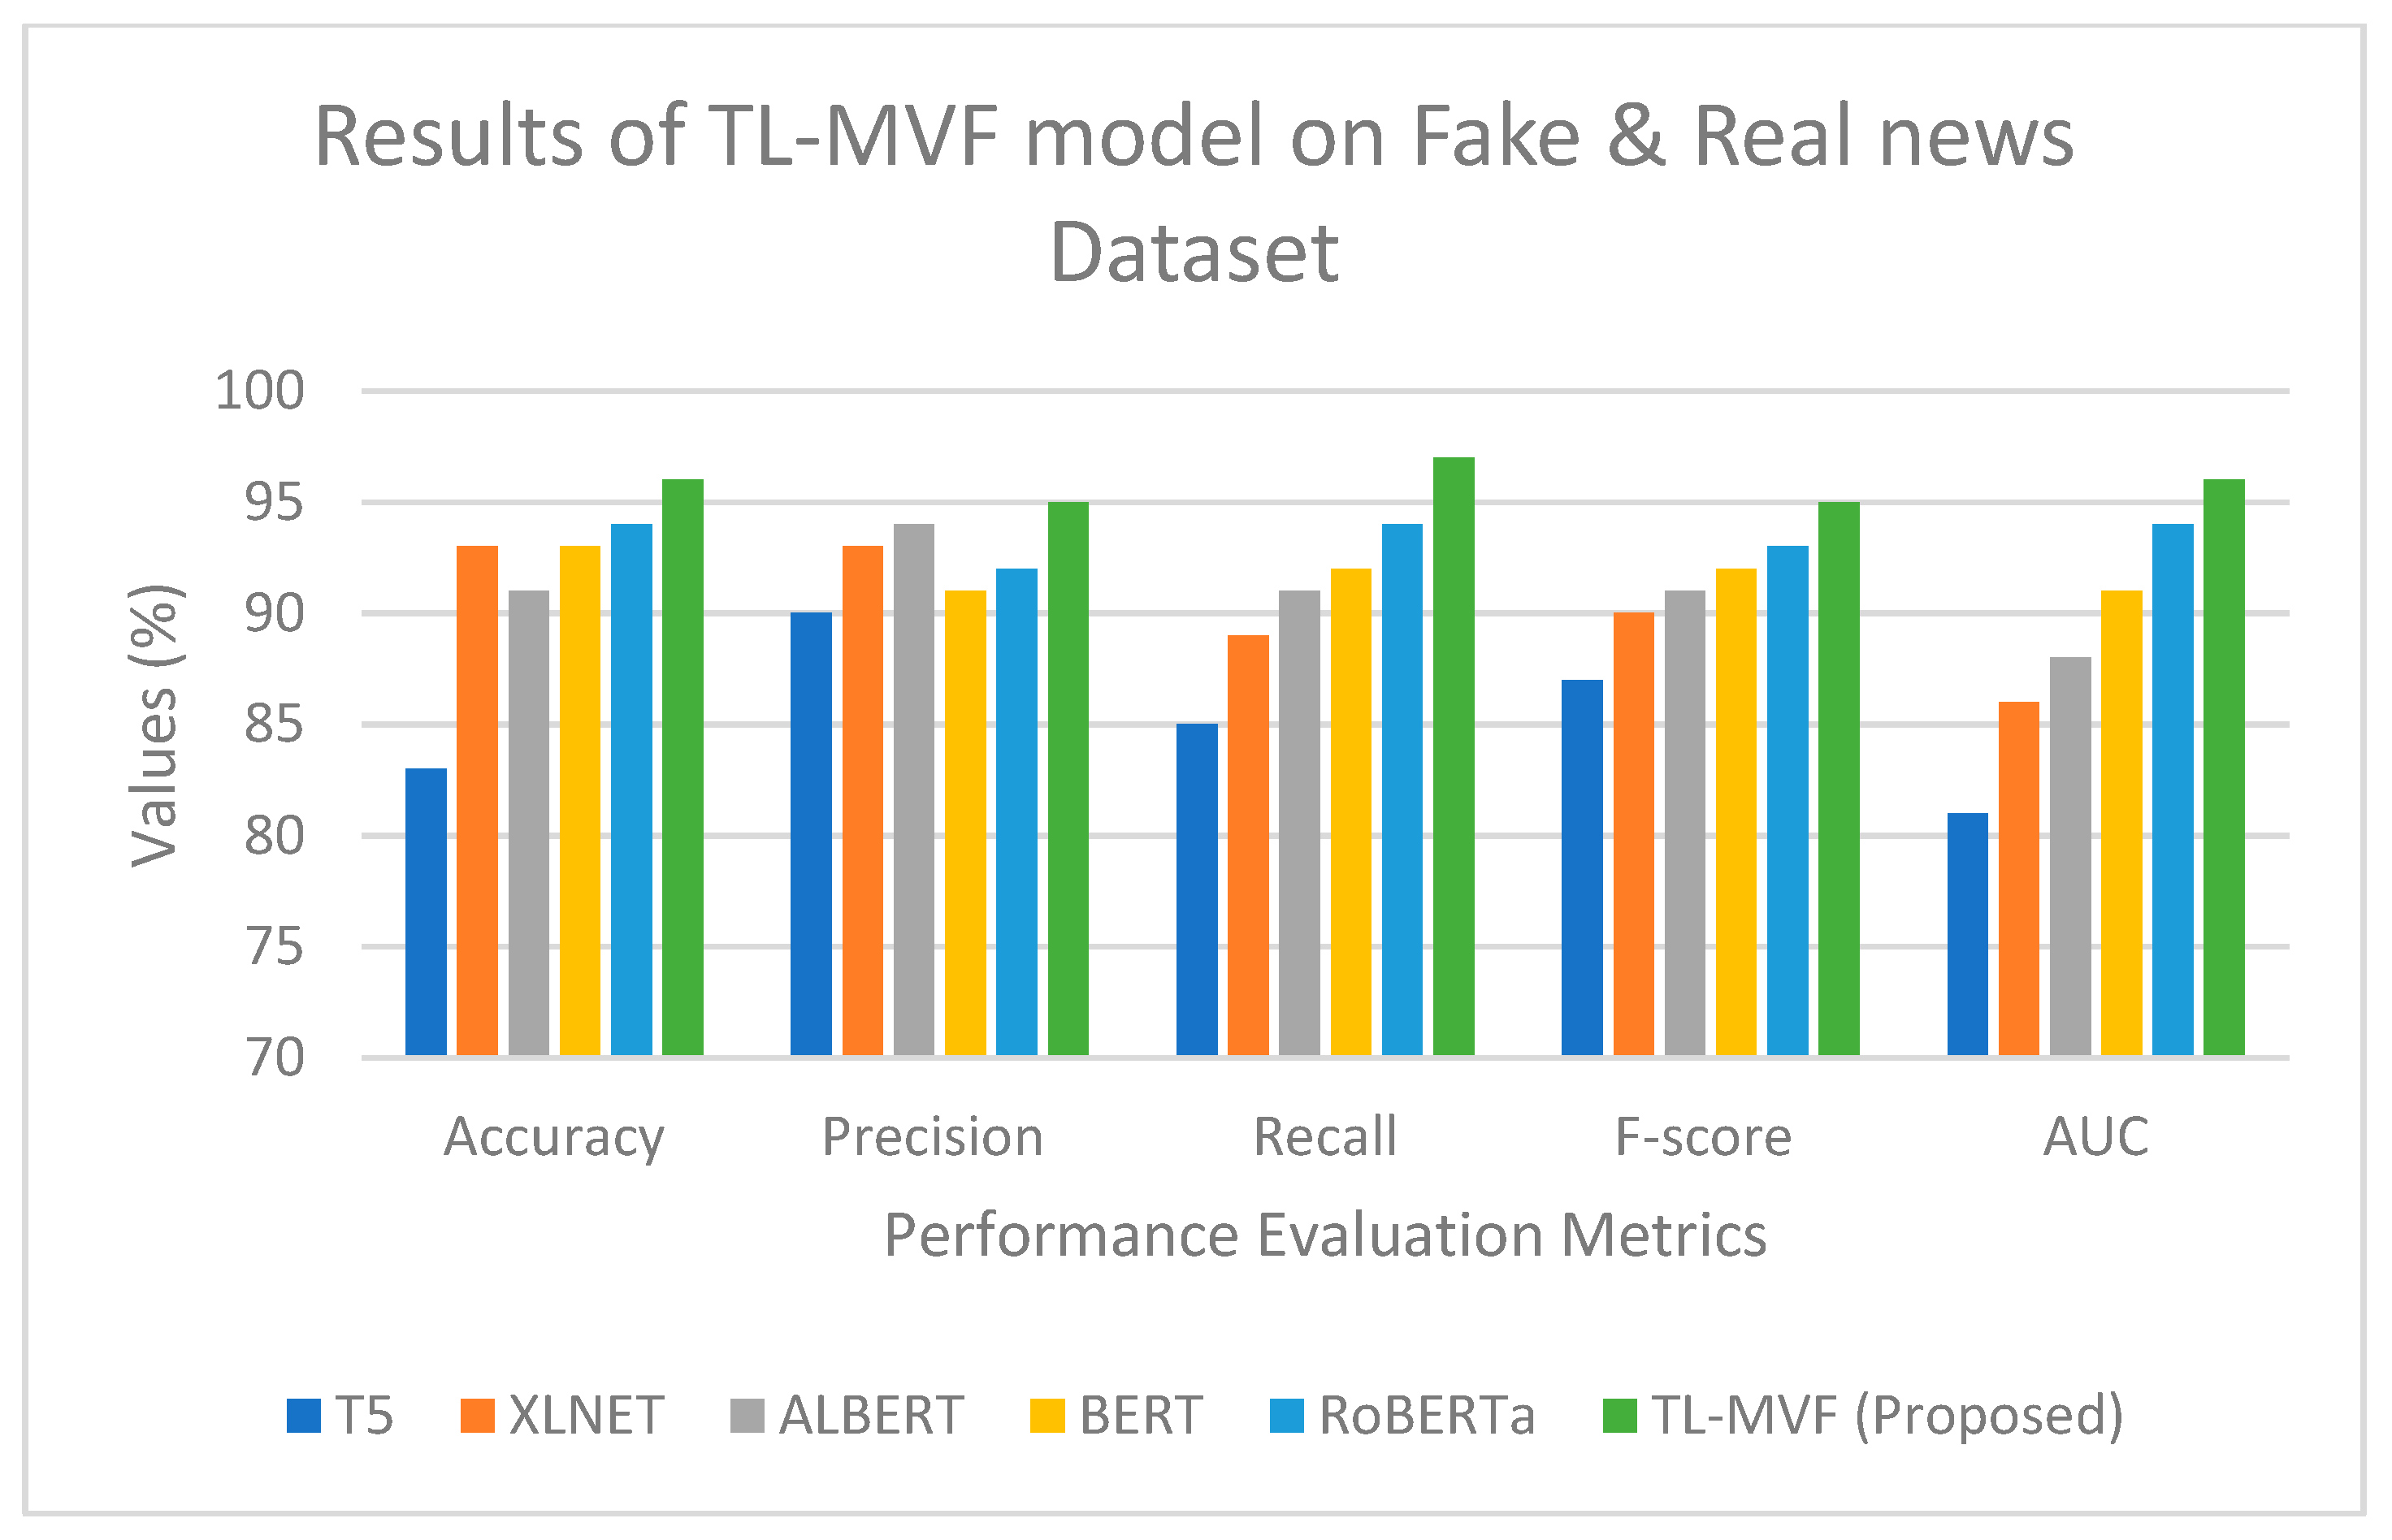
  • We evaluated the TL-MVF model by taking into consideration accuracy, precision, recall, AUC, and F-score.
  • Finally, the proposed TL-MVF model outperformed the existing baseline framework.
In the rest of the paper, we present a background and literature survey on the dissemination of deepfake news throughout social media platforms in Section 2. In Section 3, you will find a description of the proposed methodology. The results and analysis of the proposed model and its implementation are presented in Section 4. Our work is concluded in Section 5, along with possible directions for future research.

2. Background and Literature Survey

There have been various studies conducted on deepfake news detection and classification on social media platforms by various researchers using different techniques. This section deals with the background and literature review of deepfake news detection and classification on social media platforms.

2.1. Preliminaries

In natural language processing (NLP), transformers have played an important role because of their decreased training time and no vanishing gradient descent problem. Training time is reduced because of the use of position encoding in the design. The vanishing gradient problem can be solved by using the attention model and fully connected layers. To fully grasp the RoBERTa model design, we must first understand the context in which it was developed, with the following listed aspects.

2.1.1. Transformers

Over the past decade, sequential model computation has become a major issue for many NLP jobs. Convolutional and recurrent layers were omitted in favor of a more basic topology in transformers. With the use of position embedding, this considerable modification helps reduce the delay even further. Improved efficiency is achieved through the use of a multi-headed attention mechanism. Using transformer models, the NLP field was revolutionized with a shorter training time. There were several new transformers types each year [5,6,7,8]. There was a greater impact on NLP applications for BERT and the generative pre-trained transformer (GPT-2) than for the other models [9].

2.1.2. Self-Attention

Because of this interdependence, the self-attention process can be used to figure out which words go with which. The tokenizer is used to encode the input sequence into a token. During the training phase, the query, key, and value weight matrices are all learned. An extension of the self-attention mechanism, multi-headed self-attention, was used in Google’s BERT [10]. It is possible to adjust the number of heads to fit the model. The Hugging Face transformers library will take care of the complete procedure.

2.1.3. Transformer Learning

Downgrading operations can be made easier with the help of pre-trained models. These pre-training models are typically trained using a large dataset, such as the Book Corpus [11]. A further benefit of this approach is that the weights derived from these models include information about the context or words used in the input samples. Users can fine-tune these models by adding more layers to the vector produced from the pre-trained model [12]. In this proposed work, the original RoBERTa base uncased model’s pre-trained weights were not changed throughout training.

2.1.4. Hyper-Parameter Tuning

Although hyper-parameters are used to improve model performance, parameters are set by the user and can be changed during training [13]. This allows the model to learn and improve its performance as it goes.

2.1.5. Activation Functions

Each layer’s neuron has an associated activation function. Non-linear and differentiable functions are also part of the equation. The model will be able to learn more complicated features and use backpropagation to update the weights for better models if these traits are present [14]. ReLU and log SoftMax were the activation functions employed in this model. Equation (1) expresses ReLU mathematically as follows:
Z x = m a x ( 0 , x )
where x represents the input to the function, and Z(x) is the ReLU activation function.
Multi-class classification issues can be solved using the SoftMax activation function, which is a neural transfer function. Equation (2) expresses the SoftMax function as follows:
Z x i = e x p ( x i ) j e x p ( x j )
Here, Z x i is the SoftMax activation function, and represents the feature values from the neuron to the output layer. Here also, x represents the function’s input, and j indicates the quantity of classes. A new log SoftMax function expands the previous log SoftMax function. This is how Equation (3) expresses the logarithmic SoftMax function:
Z x i = l o g e x p ( x i ) j e x p ( x j )
Log SoftMax function outperformed the sigmoid function in terms of performance since each node’s probability outputs were higher.

2.1.6. Loss Function

To train a model, loss and cost functions are used. The goal is to minimize the loss function to the greatest extent possible. The model performs better when the loss is reduced. As far as cost functions go, the cross-entropy loss ranks high. It is used to enhance classification algorithms. We decided to do a backpropagation process based on model weight derivative values after performing a forward pass using the model’s loss function (which is defined as a loss in this context) [15]. The cross-entropy loss used in this model is expressed as follows in Equation (4):
C r o s s   e n t r o p y   l o s s = j a i l o g p j
Here, a i represents the actual label class, and p j represents the predicted probability of the j t h label class.

2.2. Deep Learning and Transformer Learning for Deepfake News Detection

Detecting fake news has grown increasingly important, as the internet is needed by the majority of people in every country on our planet. A study by Vosoughi et al. [16] and Gentzkov et al. [17] found that social media sites such as Facebook, Twitter, and WhatsApp are primarily used to disseminate fake news.
Fake news is generally detected by classifying the sample from many areas, such as politics, entertainment, and so forth. Once this is accomplished, generalized machine learning models can be deployed. Shu et al. [18] have studied the accuracy of multiple models employing textual and visual characteristic combinations extensively in the same way. Wang et al. [19] proposed that textual traits and metadata be combined with the convolutional neural networks (CNNs) technique. To forecast the results of the provided samples, a bidirectional LSTM model with a fully connected layer was used, and SoftMax was used as an output. The highest accuracy of 27.7% was reached by focusing on political data with better input features. Riedel et al. [20] developed an improved technique for posture identification with four levels: agree, disagree, discuss, or unrelated, with an accuracy rate of 88.46%. To classify data, we employed the author’s proposed model, which incorporates linguistic features for text processing and tokenization.
Benjamin et al. [21] proposed a machine learning (ML) model that utilized distinctive word embedding along with n-gram traits for posture identification in fake articles. Recurrent neural networks were utilized by Ruchansky et al. [22] in a hybrid deep learning model to classify bogus news with an accuracy of about 89.2%. When compared to the current models, the Jwa et al. [23] transformer model for BERT has an increase in the F1-score of 0.14. Szczepanski et al. [24] used only one dataset from Kaggle, which was employed in the BERT and bidirectional LSTM models, and achieved an F1 score of 0.98. The conventional ML algorithms [25], namely SVM and the fed Linguistic Analysis and Word Count (LIWC), exhibited an accuracy of 87%. However, Kaliyar et al. [26] introduced the fake BERT model, which has an accuracy of roughly 98.9% using only one dataset. Ahmad et al. [27] aggregated three publicly available datasets and found that the combined dataset had an accuracy of 91%. By fine-tuning the BERT uncased pre-trained classifier, Vijay et al. [28] developed a universal model for spam detection that could be used to identify spam in any dataset. The final model was trained using all of the samples’ hyperparameters, which were gathered from individual models that performed satisfactorily. According to the recommended finished model, the accuracy was around 97%.
In conclusion, fake news can be identified from social media contexts, malicious user profiles, and user activities. However, despite their benefits, these approaches present several challenges as well [29]. For instance, it is difficult to enumerate social contexts since that is a broad field. Furthermore, detection algorithms may need to be more effective due to large amounts of data and their incompleteness, noise, and unstructured nature.
The following list of limitations is observed over the course of the literature survey:
  • Detecting deepfake news is a challenge because of the lack of a benchmarked, labeled dataset with actual truth labels and a complete information space.
  • False news has become increasingly widespread and difficult to detect in today’s environment.
  • The most challenging aspect of spotting fake news is doing it early. Lack of data to train detection models is another issue with detecting fake news.
  • To identify false news, it is necessary to have a solid awareness of specific authors, entities, and the relationship that exists between each word in a lengthy text.
  • To overcome the above-mentioned issues, we proposed and implemented a transfer learning-based multiplicative vector fusion (TL-MVF) model.

3. Proposed Methodology

The proposed model design is described in detail in this section. The dataset used to train and test the models is also described in depth. This section provides a brief introduction to the T5 and RoBERTa designs, their datasets, and pre-processing methods. Figure 1 displays the general model for content-based categorization of fake news and not fake news.
Many deep learning applications, especially those working with relatively large datasets, rely on fine-tuning deep learning models that have already been trained. Previous research has demonstrated that model performance can be improved by pre-training and fine-tuning the model using data that is similar to task-specific data. To classify the news titles, T5 and RoBERTa models with fusion vector layers were used. The classification model used here is T5 with the RoBERTa model [30]. To obtain contextualized word representations, it leverages a vast number of unlabeled text corpora. The highly complex structure of RoBERTa, along with its excellent capability to learn nonlinear byte representations, led to its success in the NLP tests. The T5 transformer increased efficiency with the help of data pre-processing and tokenization.

3.1. Dataset Description

In the process of evaluating the proposed model, we used one benchmarked dataset and two real-time datasets for both testing and training, such as Fake and Real News [31], the Pymedia dataset [32], and the PolitiFact dataset [33].

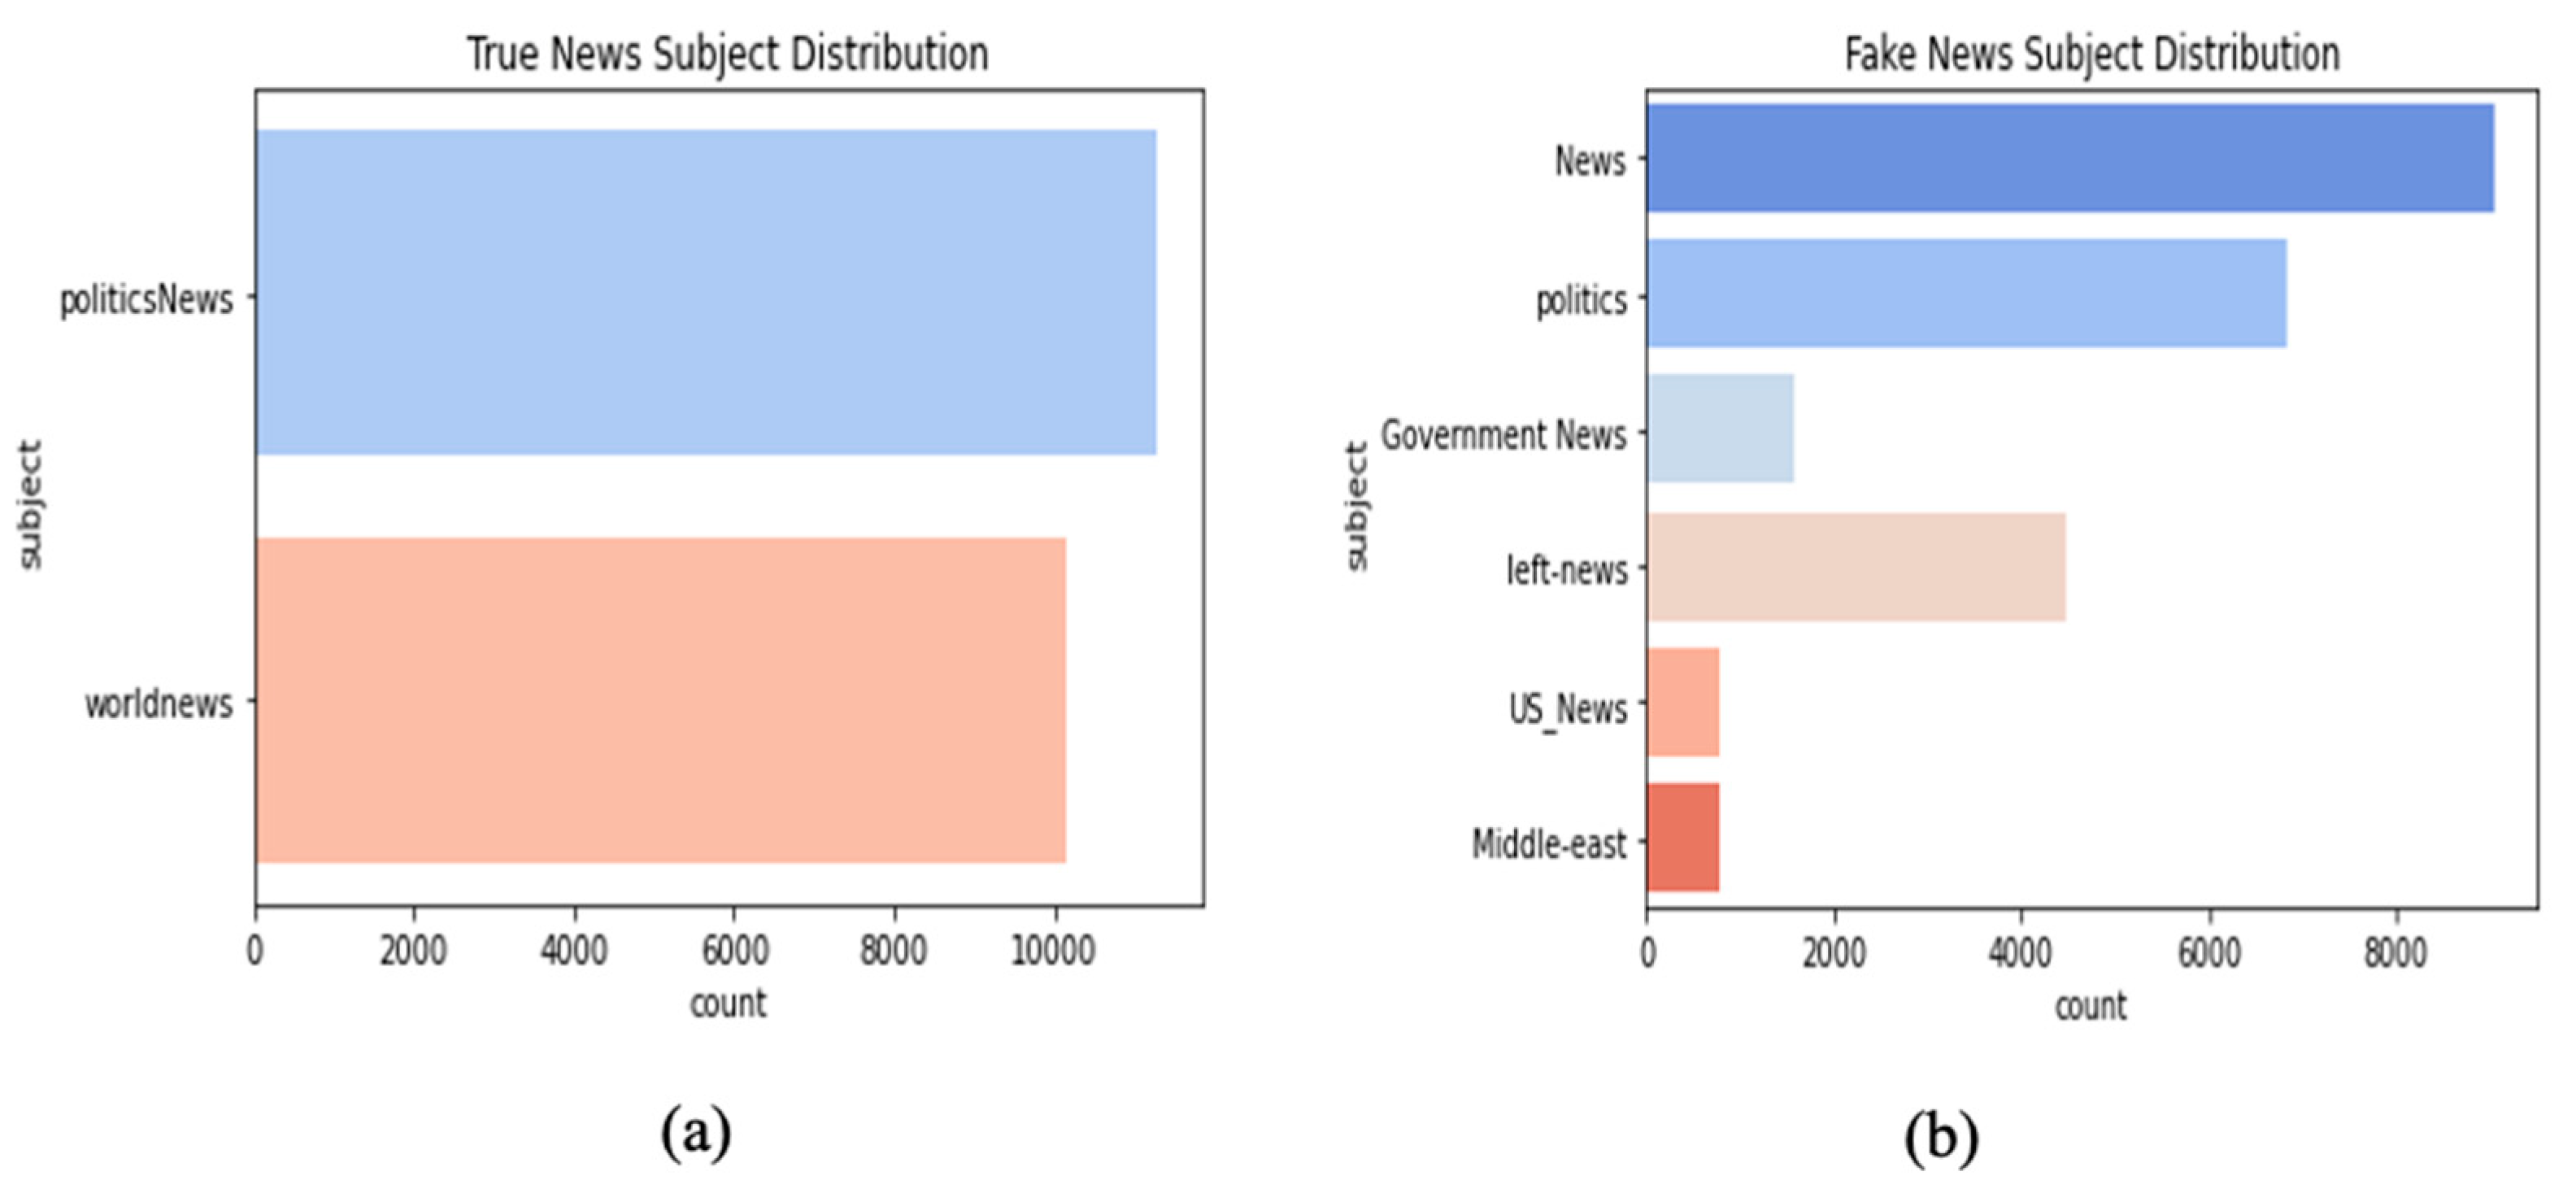
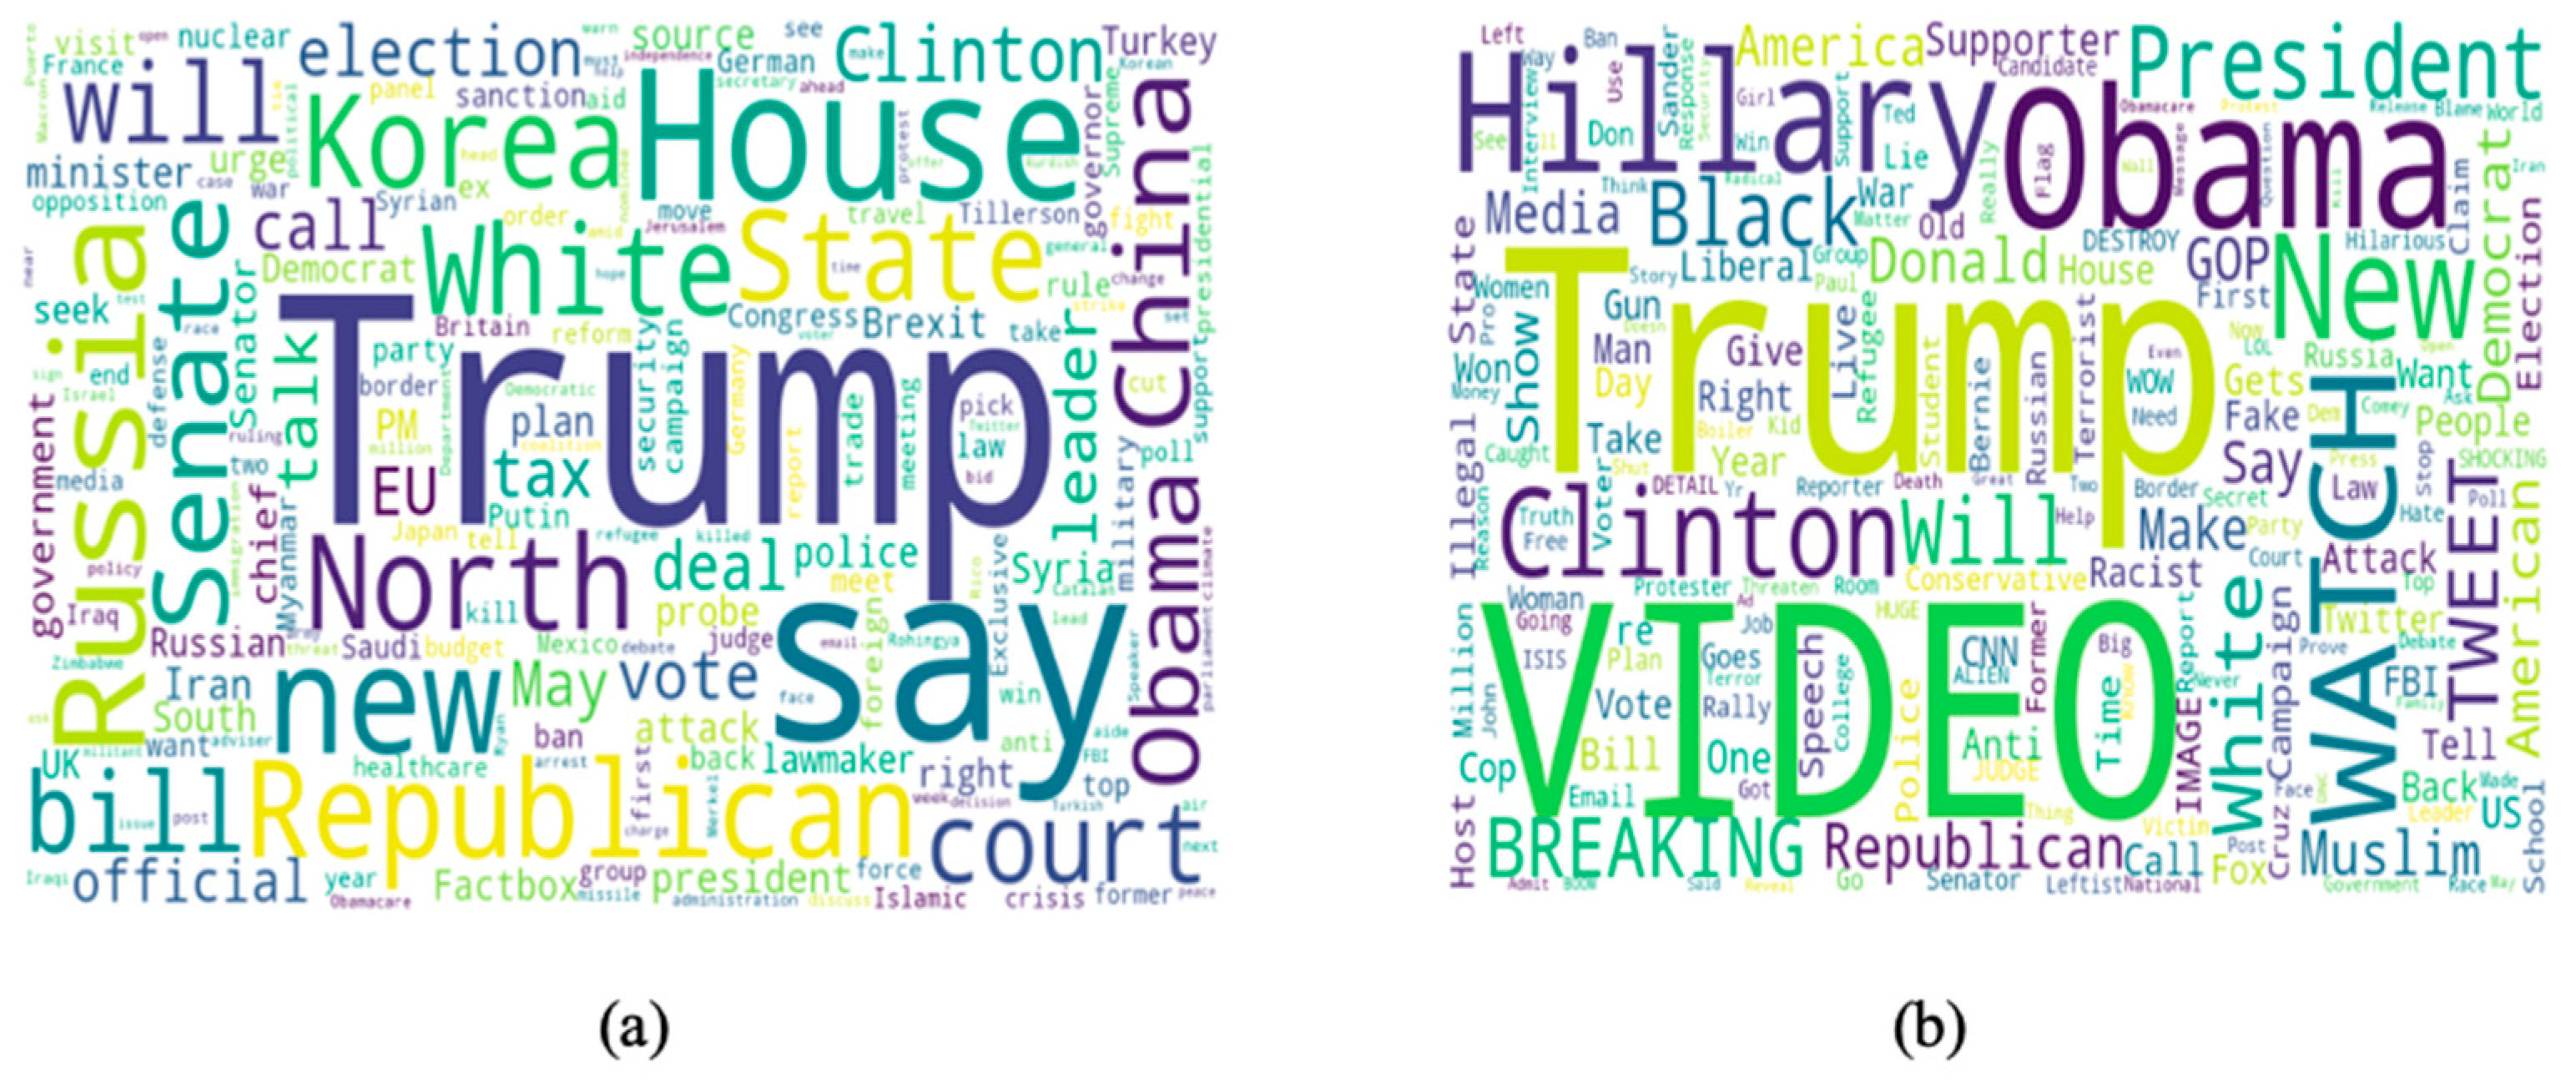
3.1.1. The Fake and Real News Dataset: An Exploration

Initially, we used the Fake and Real News [31] benchmarked dataset for classifying the news, which contains features such as title, text, subject, and date. The True News subject distribution contains political news and world news. The Fake News subject distribution contains news, politics, government news, left news, US news, and middle-east news. This dataset contains 4 features, 21,417 fake news, and 23,502 real news, which are shown in Table 1.

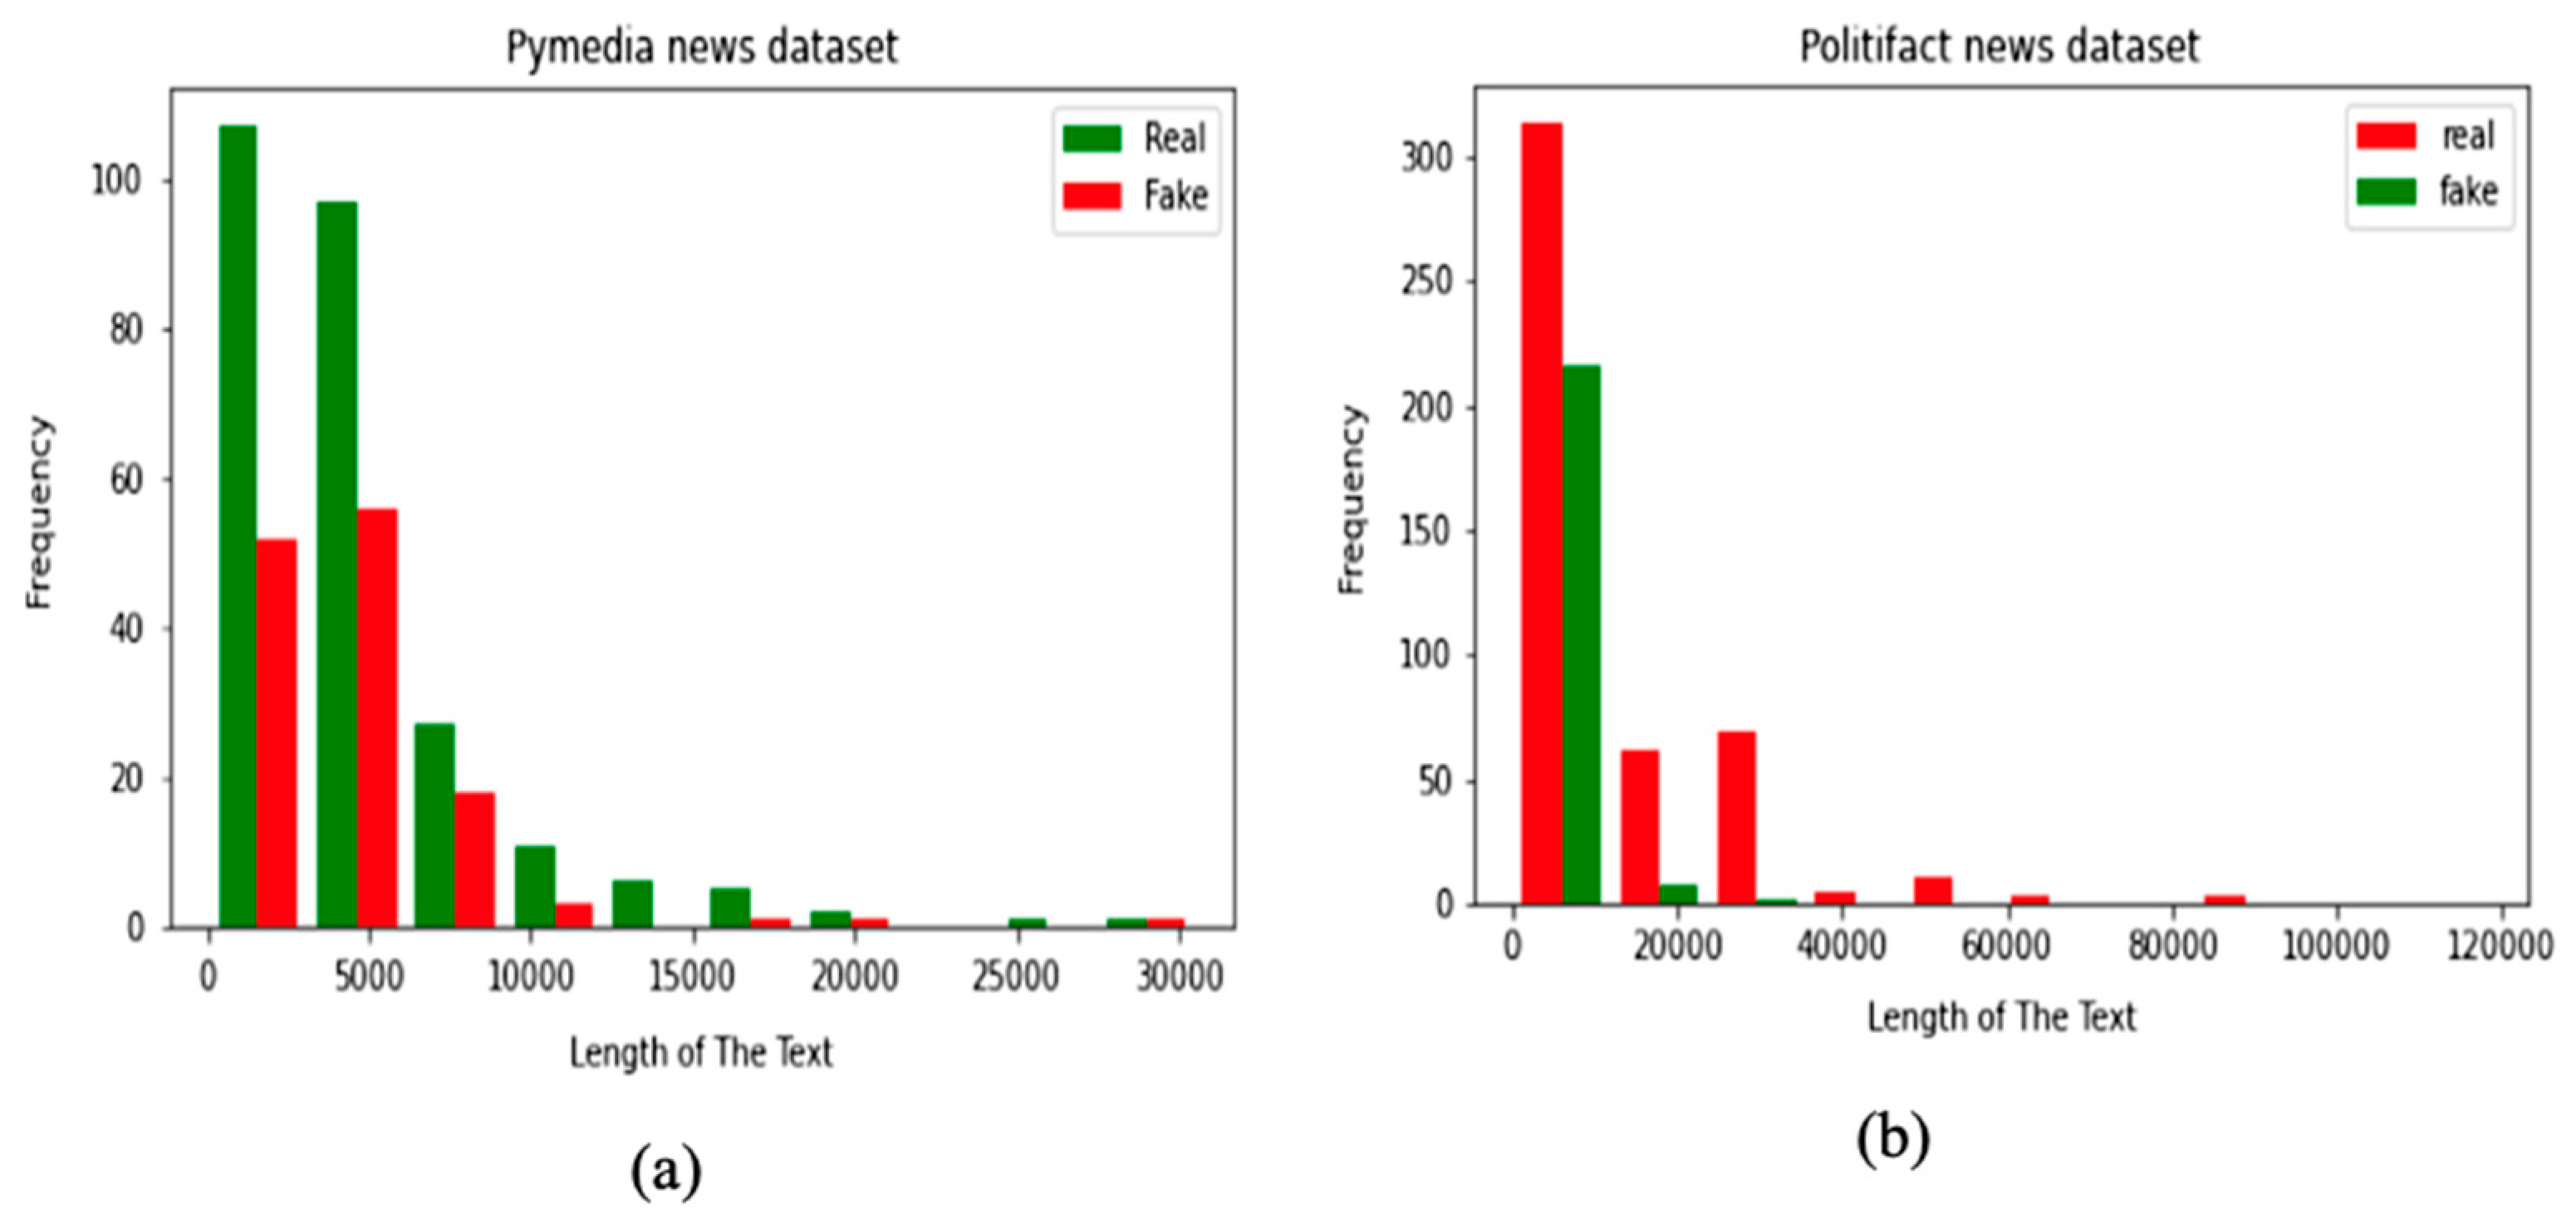
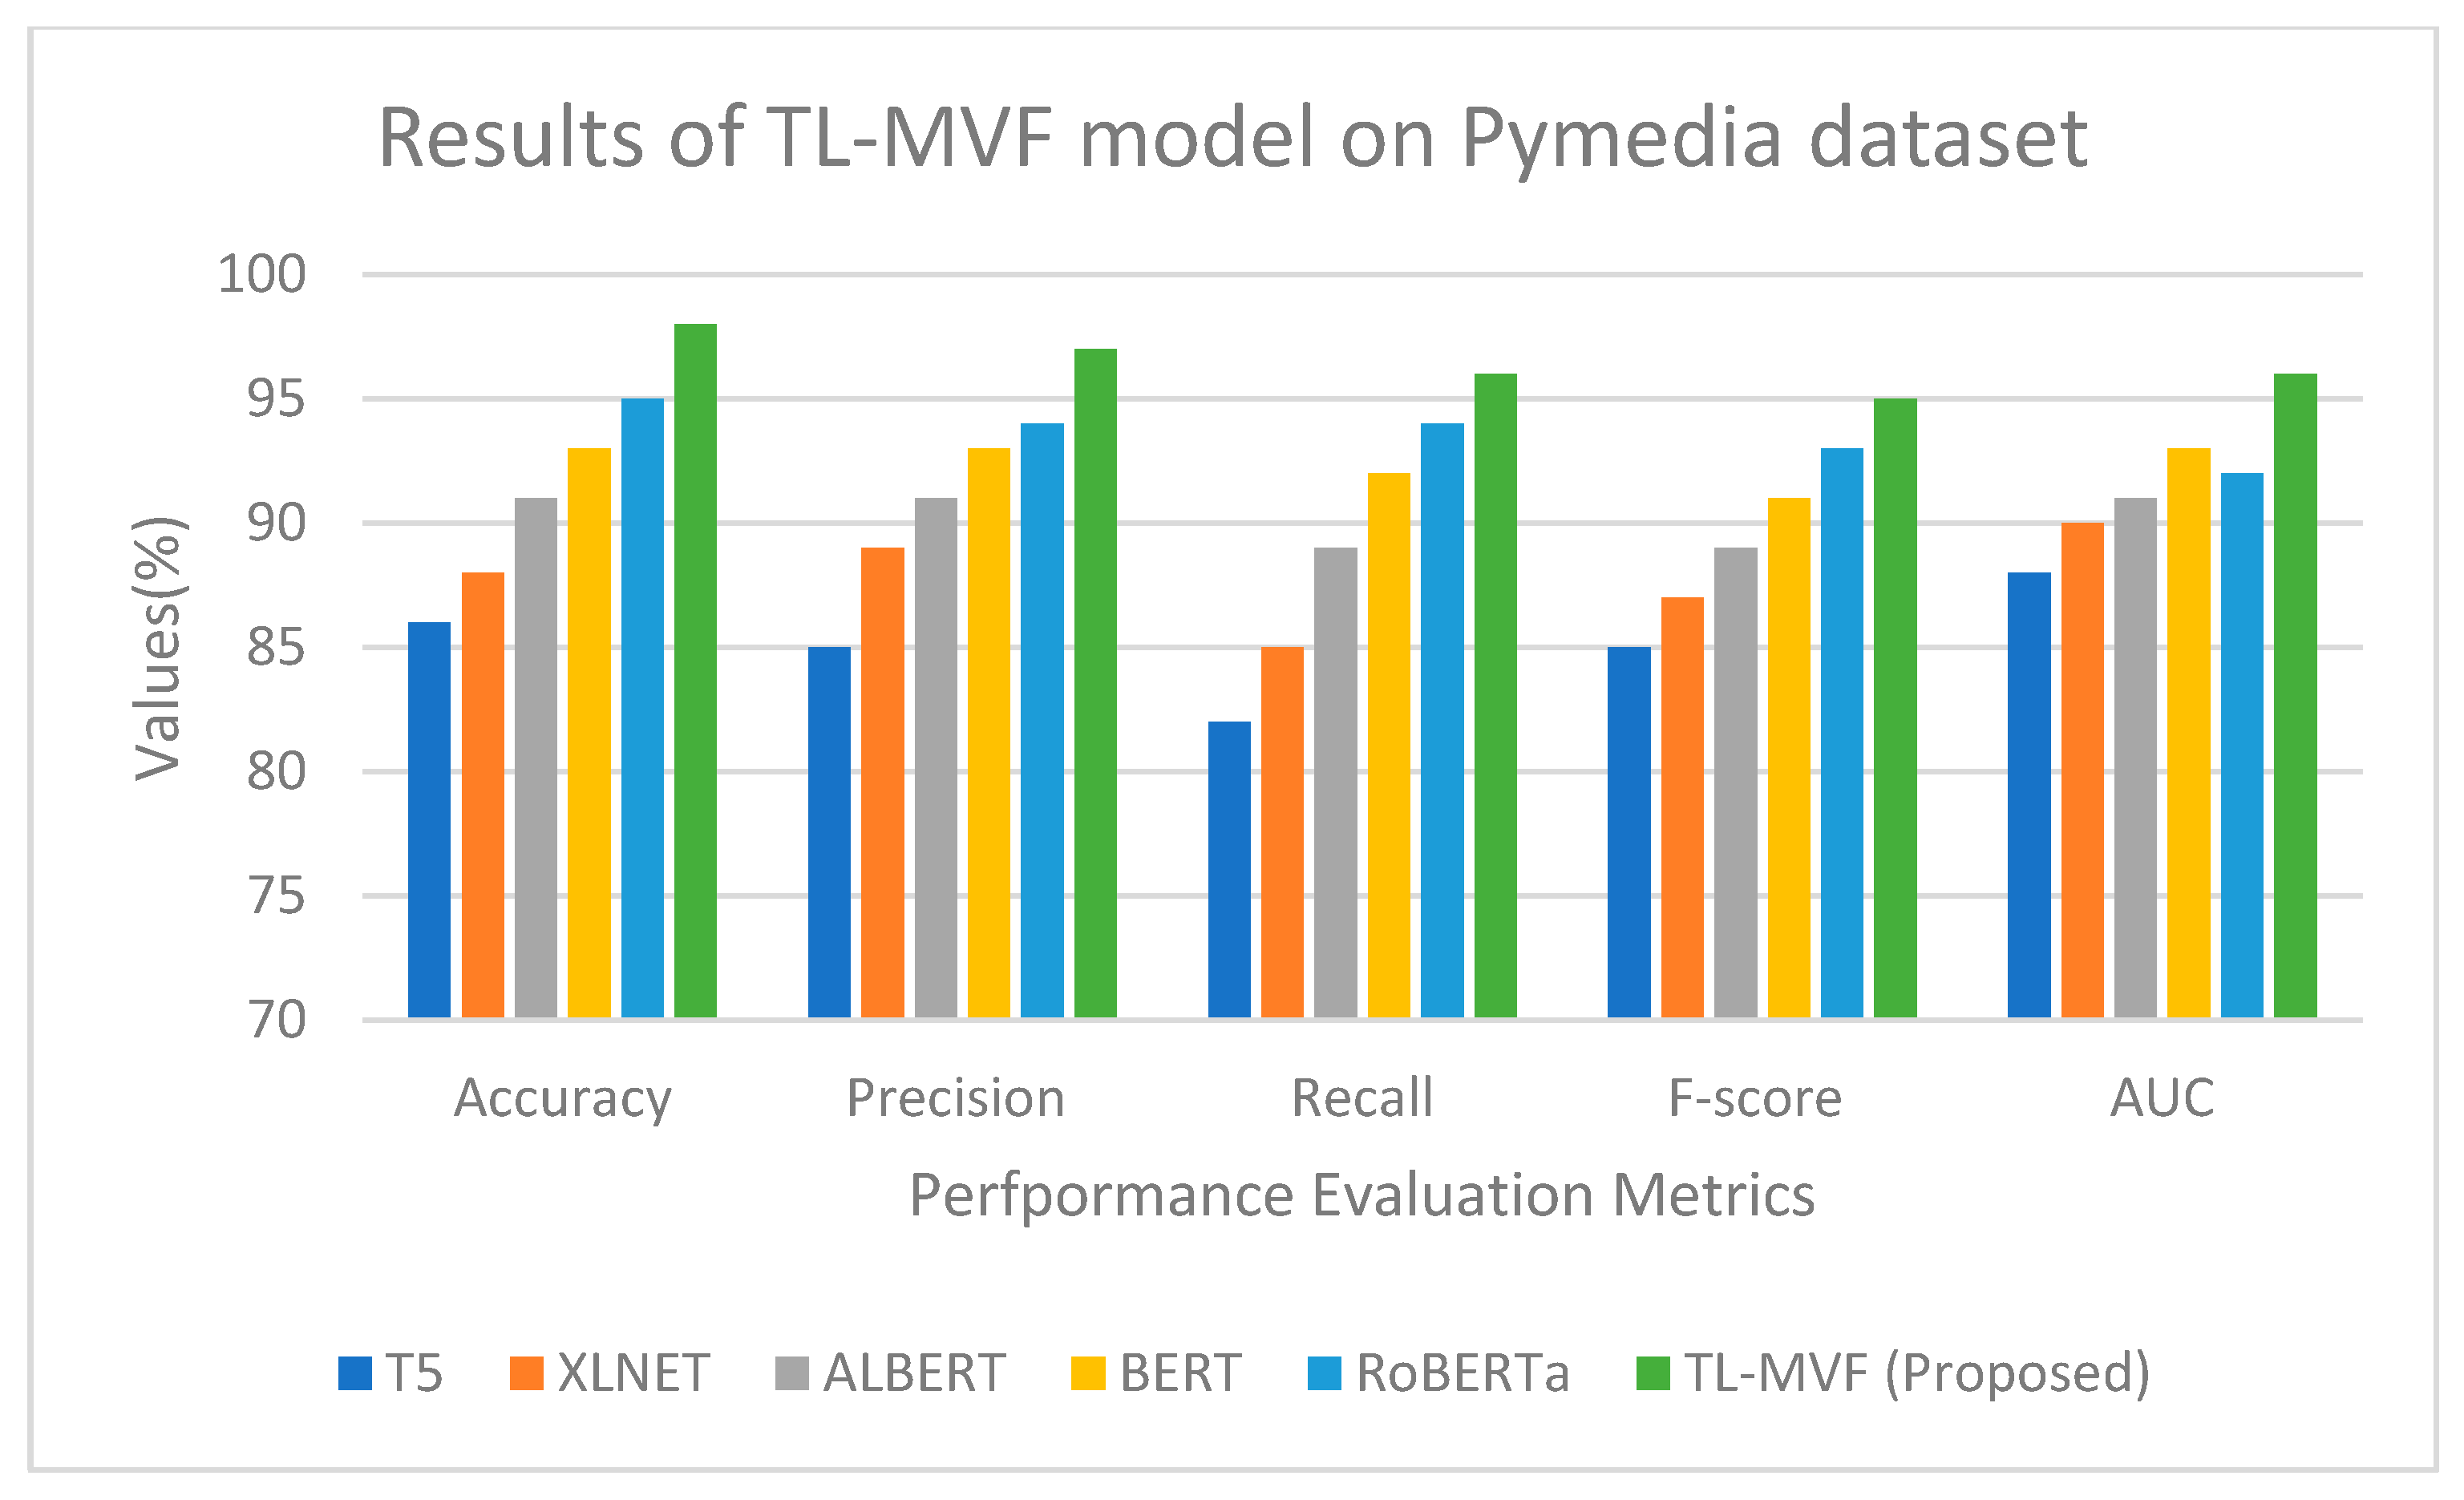
3.1.2. The Pymedia Dataset

The data in this dataset comes from the crawling of Pymedia’s website. News articles from the BBC, CNN, Republic, etc., are available. On average, it contains 20 articles linked to one subject, and is shown in Table 2.

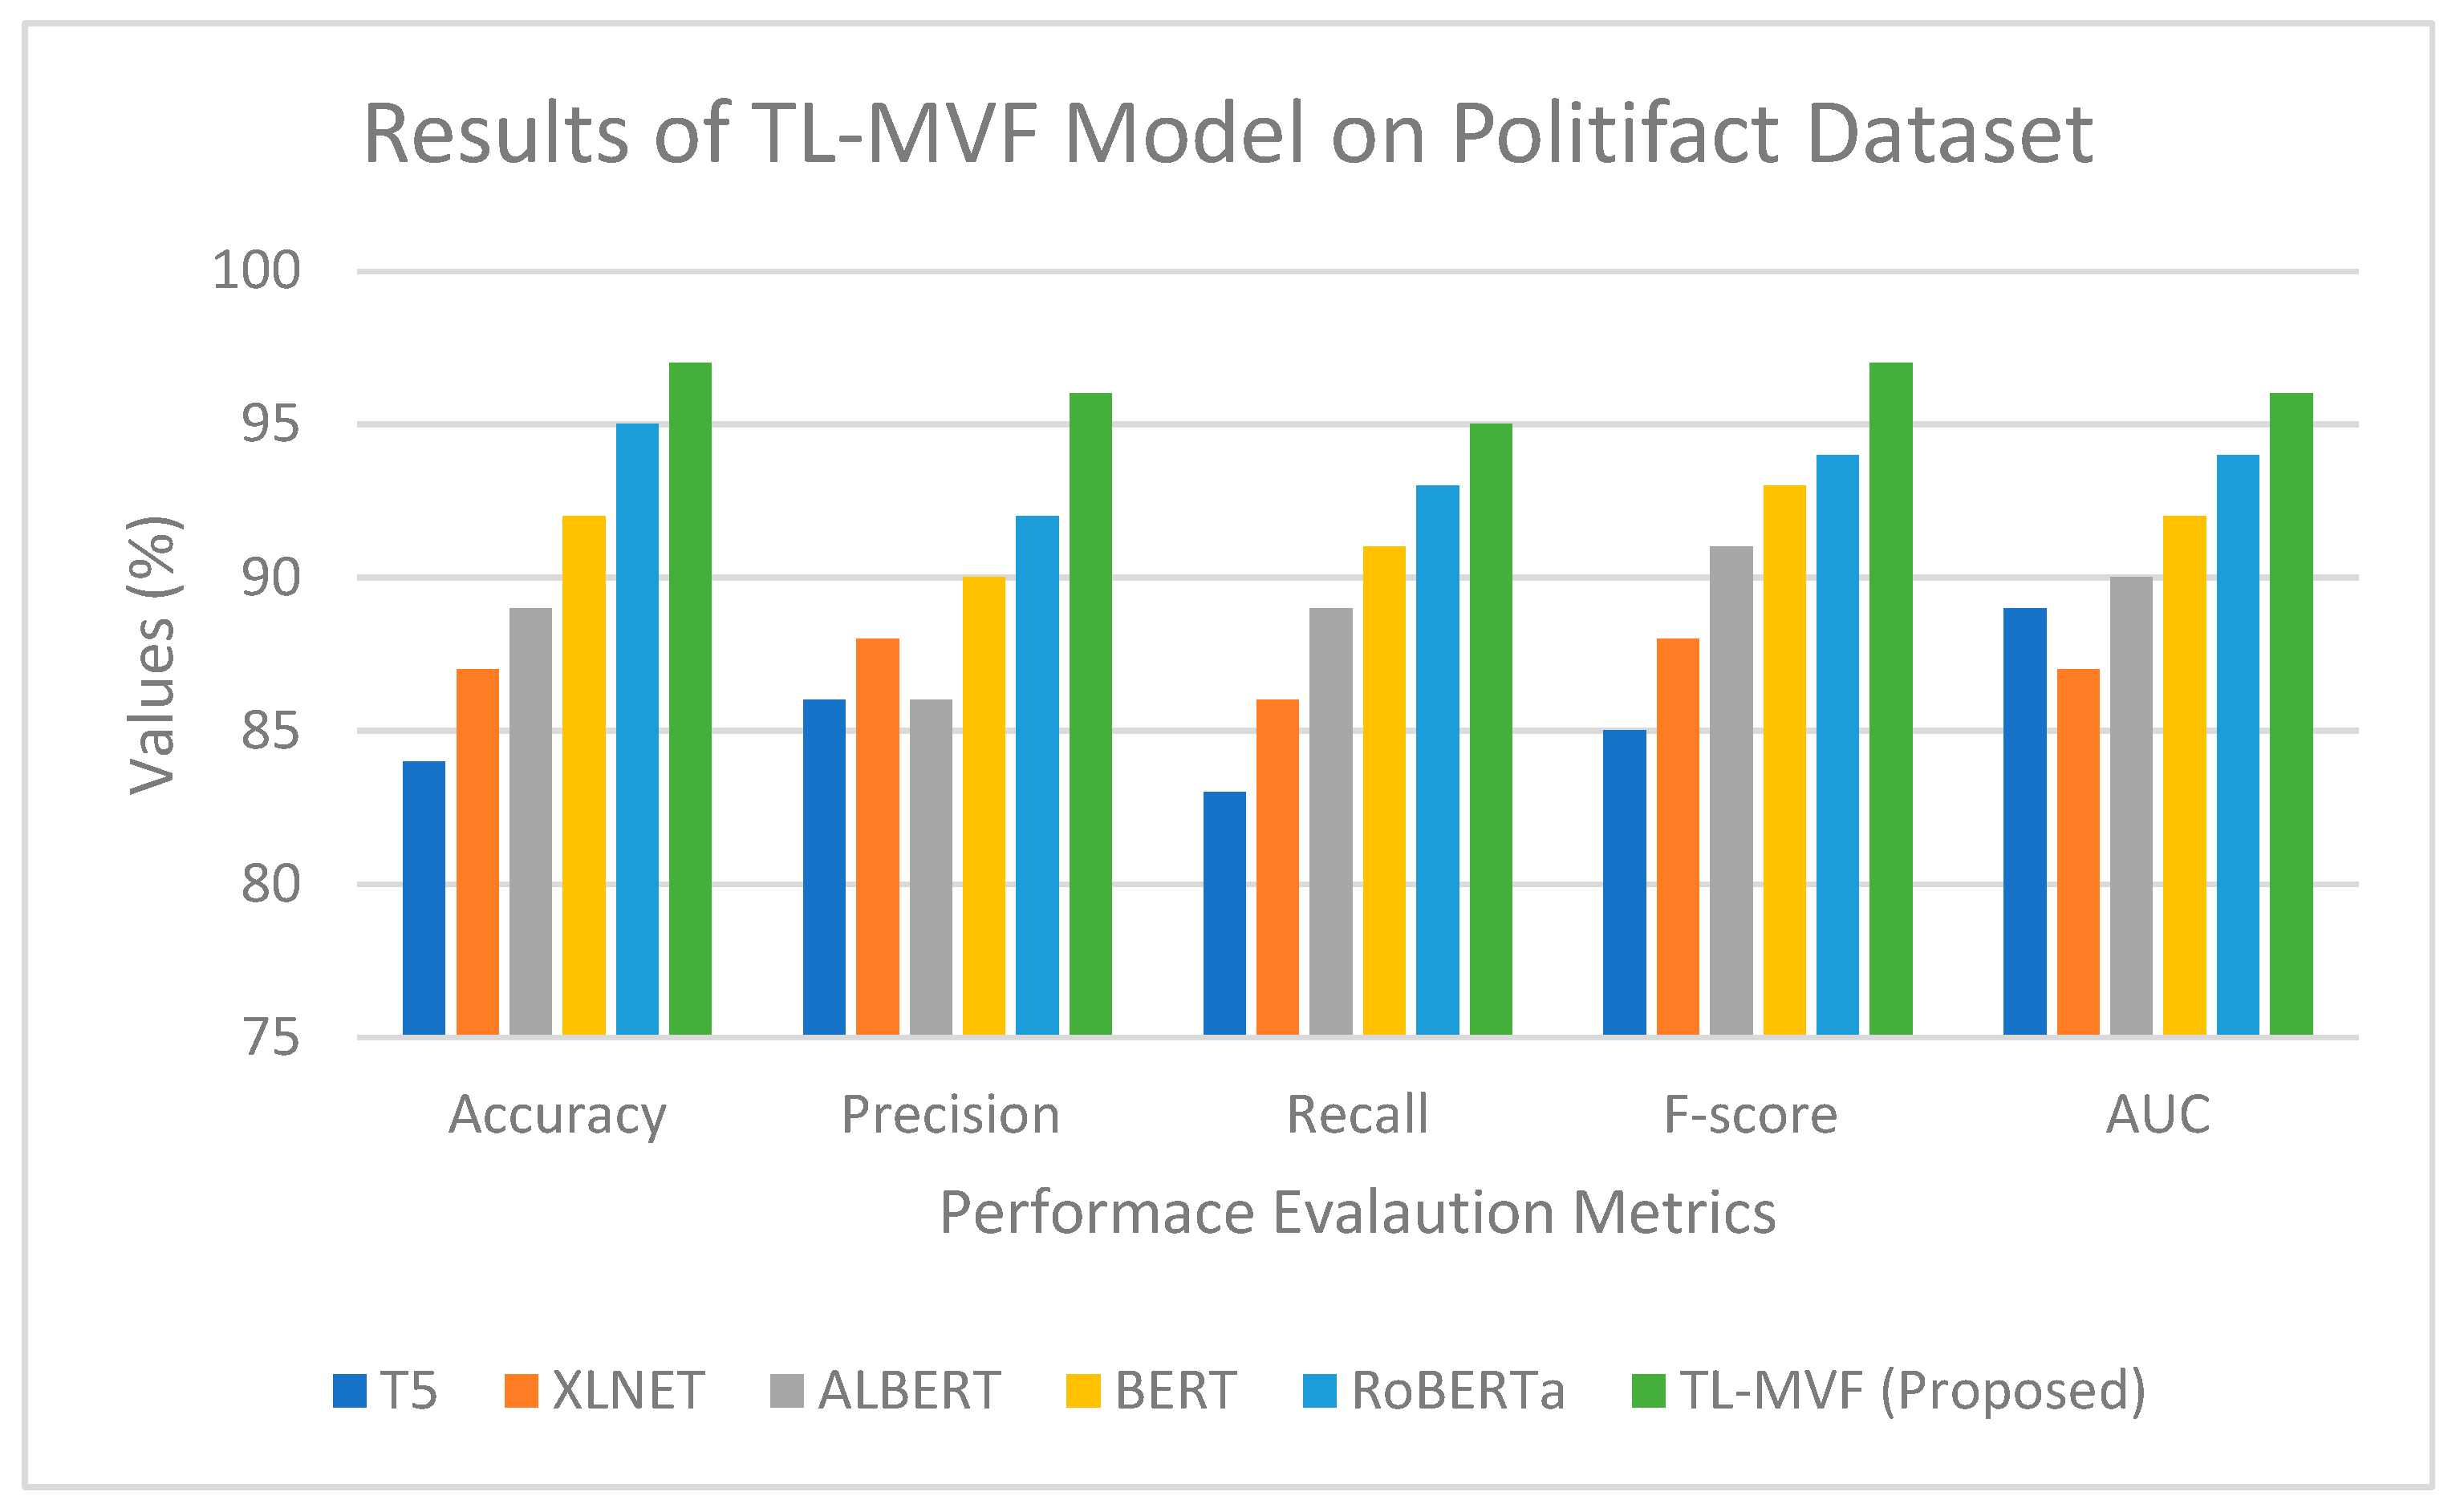
3.1.3. PolitiFact Dataset

This dataset contains articles crawled from the PolitiFact website. These articles are collectively from 3634 authors and 152 subjects. On average, it contains 3.5 articles linked to one subject, as shown in Table 3.

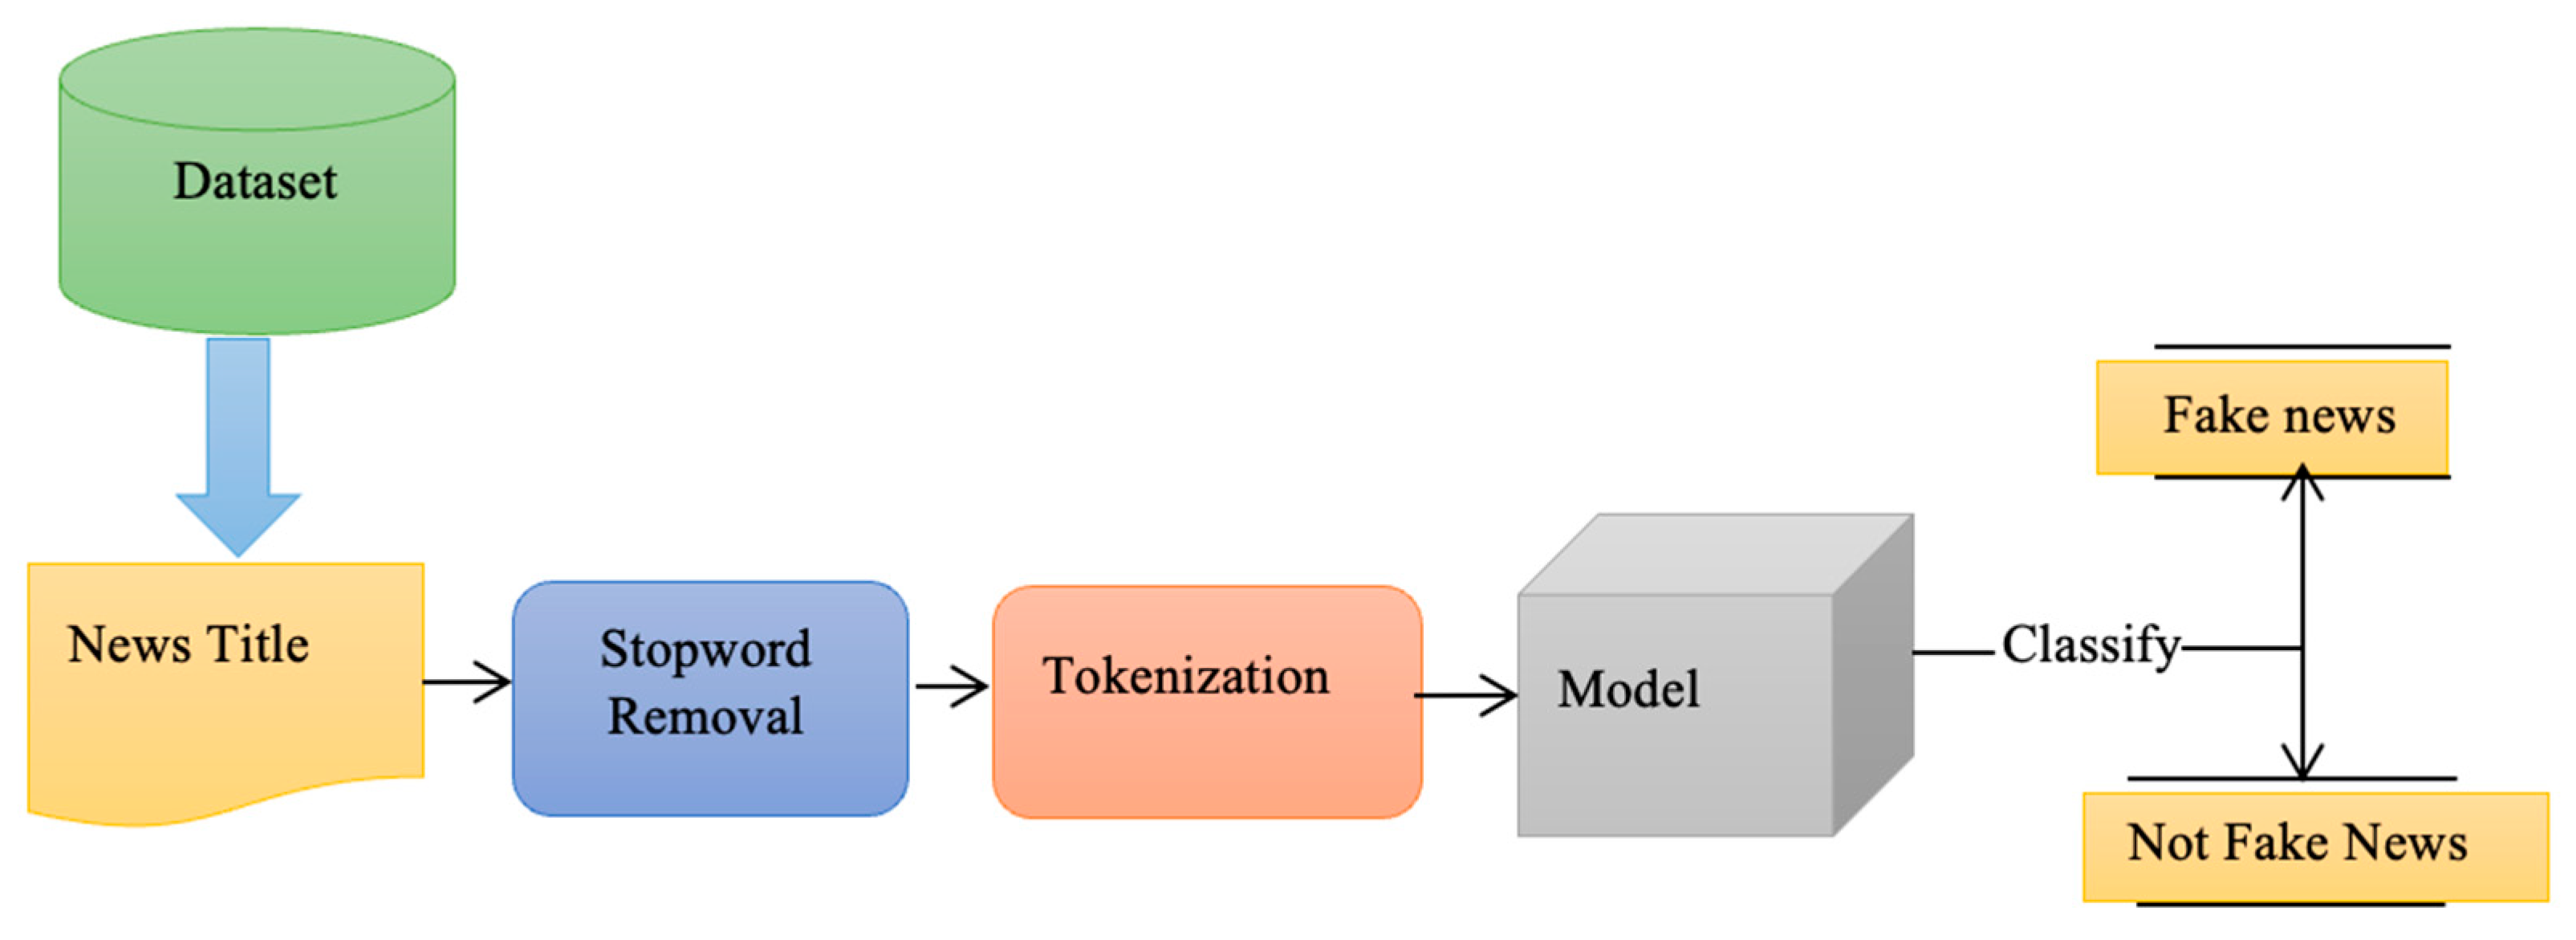
3.2. Dataset Preprocessing

In this data preprocessing, data cleaning such as the removal of noise and tokenization of each sentence was performed. The dataset has to be split in an 80:20 ratio to train and test the news data. Of the fake news data, 80% was used to train the models, and 20% was tested once the models were trained. Accordingly, pertinent comparison graphs, as well as tables and metrics for the proposed model, were analyzed. We removed punctuation, stop words, and symbols. This results in a fixed dataset for implementation. Figure 2a,b, illustrates the subject distribution for both real news and fake news, respectively.
The word clouds for the Fake and Real News datasets are shown in Figure 3a,b. Figure 3a contains news, such that all the word clouds are real news, whereas Figure 3b portrays the fake news word cloud.
The frequency of length of text distribution is shown in the Pymedia news dataset in Figure 4a and the PolitiFact news dataset in Figure 4b. Compared to PolitiFact, the Pymedia dataset contains more real news than fake news.

3.3. Problem Definition

By using a social media dataset that resembles the circumstances faced by news users, fraudulent news identification determines whether a news item is authentic or fake as shown in Figure 5. Assume that N = n 1 , n 2 , n 3 . n N is a collection of news items, with each item labeled as a i 0,1 , a i = 1 (false news) or a i = 0 (real news). Content and metadata make up the body of n i ’s news story (headline, author, entities, body, source, etc.). Social media users U = u 1 , u 2 , u 3 . u N are likely to reply to a news item n i that is a social media post. A formally defined term for fake news is the difficulty in detecting it.
Input: Reports on current events, as well as commentary on the broader societal background.
Output: It must be either fake or real.

3.4. Pre-Processing Data

3.4.1. Data Cleaning

Data is thoroughly inspected by following the processes laid forth below after a text is received using the implementation in Figure 1. The software that removes words includes tokenization, lower case, phrase segmentation, and punctuation removal. Steps were taken to decrease the amount of data and delete any unnecessary information that may have been included. Our generic pre-processing removed punctuation and some non-letter characters from all documents as part of this strategy. Each document’s letter case was then decreased. In order to divide a document’s text, we used an n-gram tokenizer and an n-gram length.

3.4.2. Tokenization

A technique called tokenization was utilized in this procedure to deal with the situation where a given text is broken down into tokens. They are also considered tokens because of the following items: Various symbols and characters can be found within. Additionally, sensitive data elements with no meaning or value were replaced with equivalent non-sensitive elements. This method of tokenization was tested and verified to meet the highest standards for the protection of personal data. Tokens for data processing applications can be obtained through our tokenization framework’s authority and APIs. When necessary and if possible, sensitive data was detokenized. The number of words in a sentence that are news is represented as follows:
N = n 1 , n 2 , . . n m ,   n = total   number   of   news ;
where n represents news, with the m news as tokens. These tokens Input Dimension (ID) are measured by using Equation (5) as follows:
I D = l e n T o k e n i z a t i o n N
The length of each vector, i.e., the number of words as news in a sentence, and the maximum input length of the sentences in a dataset was not fixed. Therefore, it will change irregularly over time. The length of the input is calculated with Equation (6).
I n p u t   L e n g t h = m a x l e n t h   f o r   n   i n   N

3.4.3. Stemming

We converted the tokens into another common format after they were tokenized. In other words, the words can now be transformed back into their original form, but with fewer kinds and/or classes. Our example uses “running,” “ran,”and “runner” which was reduced to “run.” This example illustrates the power of stemming.

3.4.4. Lemmatization

There are many ways to reduce inflectional forms, including stemming and lemmatization. The lemmatization process does not always result in inflections being broken off instead of stemming. It only relies on the foundations of lexical knowledge to acquire the proper kinds of vocabulary.

3.4.5. Stop Words

Text categorization can make use of languages that can generate noise, such as the ones employed in this research. They are known as “stop words.” They can be found in a variety of sentences that not only help us form clearer words but also help us link our thoughts. Stop words include, but are not limited to, articles, prepositions, conjunctions, and some pronouns. Our method extracts frequent phrases such as “a,” “for,” “an,” “like,” “at,” “are,” “by,” “for,” “from,” “how,” and so forth. After that, we store the papers that were processed and prepared for the next step in a secure location.

3.4.6. Lexical Features and Syntactic Features

Fake news has been identified by many studies using feature-based classification. Using textual characteristics, it is easy to detect false information. A few of the features are discussed below:
  • An essential aspect of a text’s semantics is its meaning (semantics). In this way, the data is transformed into meaningful patterns.
  • Word frequency and uniqueness are calculated using lexical features in the TF-IDF vectorization. Hashtags, pronouns, and punctuation are some of the lexical features.
  • Syntactic features are generated by speech tags and various components from a parse tree, whereas lexical features are the target words with unigrams, bigrams, and surface forms.

3.5. The T5 model for Sentence Generation

Using a large-scale study for sentence generation, researchers came up with the T5 (Text-to-Text Transfer Transformer) model [29]. Since the architecture restricts each model to a single task, T5-like models can be adjusted to do several tasks. After constructing a feature vector, it is used as the input to the T5 sentence generator classifier equipped with the RoBERTa model during model training and evaluation. The features of the input data are represented with X i = x 1 , x 2 , . . x n where it contains both discrete features and symbols. In the T5 model, the text token is from the deepfake news dataset using the segment embedding technique. In this technique, there is no sentence separation between deepfake news sentence labelling and sentence generation. The well-defined classification denoted as ([CLS]) is added as an initial token. Later, a separable token ([SEP]) is embedded as a final token. Thereafter, the text news token may be forwarded to the T5 model from sentence generation based on Equation (7):
T = T 5 x 1 , x 2 , . . x n
where T = t 1 , t 2 , . . t n and t i is denoted as a token embedded word representation.
The T5 model contains several layers, which contain sublayers too. Each layer in the T5 model has multi-head self-attention to retrieve connected tokens. The self-attention sublayer measures weighted scores represented with a i j and w s i j , these are calculated with Equations (8) and (9) as follows:
a i j = t i m g ( t j m k ) O d
w s i j = exp ( a i j ) k = 1 N exp ( a i j )
Furthermore, the multi-head self-attention mechanism used a mask matrix to identify a text news segment in deepfake news generation and detection. The attention was calculated under the following conditions:
(i)
jth element by ignoring the ith element. It means that M i , j = 0 and M i , j 1 × = is attained, and the self-attention was designed with Equation (10):
s i m i , j = s o f t m a x Q K p d k i , j + M i , j 1 × , = s o f t m a x
(ii)
ith element by ignoring the jth element. It means that M i , j = 1 and M i , j 1 × = 0 is attained, and the self-attention was designed with Equation (11):
s i m i , j = s o f t m a x Q K p d k i , j + M i , j 1 × , = s o f t m a x Q K p d k i , j
where p represents the matrix parameters mask M 0 , 1 p × p in measuring the self-attention of the T5 model. Here, M denotes the mask, and Q is used as a parameter value to optimize the function.

3.6. A Fine-Tuned RoBERTa Model for Deepfake News Detection

BERT is improved through the removal of next-sentence pre-training, significantly higher learning rates, and enormous mini-batches, among other changes. A new approach to NLP (natural language processing) improvement known as the “transformer method” was recently disclosed by Google. It found that RoBERTa was more effective than BERT at achieving the masked language modeling goal. Further, RoBERTa is compared with BERT’s base model using data with greater magnitudes. RoBERTa [30], a retrained version of BERT, was created using improved training methods and 1000 times more data and processing capacity. Its performance is superior to that of both BERT and XL Net. Material from any source can be used to make up the text (not only tweets). We used a pre-trained RoBERTa model in our proposed strategy to overcome this shortcoming of feature-based approaches.
To detect fake tweets on social media, we have implemented a robustly optimized BERT technique (RoBERTa) that was pre-trained. With our benchmarked data sets, we can fine-tune the RoBERTa model by replacing its last layer with a SoftMax layer. Better performance for the existing model is only achievable through careful hyperparameter fine-tuning. Hyperparameters in this model include the sequence length, linear layer choice, neuron count in each layer, optimizer, learning rate, minibatch size, and epochs. During training, the technique maintains the same weights as the pre-trained model. Aside from the variation in minibatch size, the final produced model with all hyperparameters is the same. This is because the three datasets are of different sizes. Besides capturing left-to-right and right-to-left text directions, RoBERTa can also learn additional context information from a tweet. In comparison to earlier versions such as BERT-base and BERT-large, RoBERTa’s improved performance can be attributed to the following changes:
(i)
The RoBERTa model is pre-trained with 10 times more data and 8 times larger batch sizes.
(ii)
As opposed to character-level vocabulary techniques, the model used BPE (byte-pair-encoding).
(iii)
NSP (next sentence prediction) was removed from the model.
(iv)
Crucial parameters are changed, such as masking patterns applied dynamically, higher learning rates, etc.

3.7. Design of Vector Product Fusion Multiplication Technique

The resultant outcome of the T5 and RoBERTa models was taken into consideration as a probability vector, and a fusion multiplication technique was developed. Fusion approaches are more commonly used for output concatenation for internal models. Maximums, minimums, means, averages, sums, differences, and products are some of these measures. A tweet’s probability vector is refined using the RoBERTa and T5 models. A multiplicative fusion approach is used to combine the two probability vectors (the array of the last layer). The resulting vector is used to forecast the tweet label.
A = x 1 y 1 x 2 y 2 x n y n
B = u 1 v 1 u 2 v 2 u n v n
where x i + y i and u i + v i = 1 .
Here x i and y i represent the likelihoods of fake and true news according to the RoBERTa model, respectively, whereas u i and v i represent the T5 model’s probabilities of fake news versus legitimate news. Algorithm 1 shows a detailed illustration of the proposed multiplicative vector fusion technique.
Algorithm 1 for the proposed Multiplicative Vector Fusion (MVF) technique
Initialization:
  • 1: Real News
  • 0: Fake News
  • A: It represents the probability vector value of the T5 model.
  • B: It represents the probability vector value of the RoBERTa model.
  • N: It represents the size of the validation dataset.
  • Input: N, A, and B
  • Begin
  for j = 1 to N
     F i n a l _ c l a s s i f i e d / p r e d i c t e d _ v a l u e = M V F ( A j , B j )
8.
end
9.
Output: F i n a l _ c l a s s i f i e d / p r e d i c t e d _ v a l u e ( 1 R e a l , 0 F a k e )
To illustrate, supposing that A and B represent the RoBERTa and T5 probability matrices, respectively, then M V F ( A , B ) = A B is the multiplicative fusion vector of A and B in a single vector.
M V F ( A B ) = x 1 u 1 y 1 v 1 x 2 u 2 y 2 v 2 x n u n y n v n
F B E D L T e s t n e w s i = F a k e x i u i > y i v i R e a l x i u i < y i v i N e u t a l E l s e
where x i   a n d   u i is the 1st column’s ith element where A and B are related. Similarly, y i   a n d   v i is the 2nd column’s ith element where A and B are related. Equation (15) depicts these possible outcomes.
  • The news item will be predicted as Fake if x i u i > y i v i is true.
  • The news item will be predicted as Real if x i u i < y i v i is true.
  • The neutral condition rarely occurs because the proposed technique is trained and tested on the dataset as a binary classification.

4. Results and Analysis

The results of this section are discussed in terms of the datasets utilized for the experiment, the baselines used for comparison, the details of the model’s implementation, and the performance measures. This model outperforms others in terms of performance. In a range of application areas, this proposed model may potentially be able to outperform current benchmarks.

4.1. Performance Evaluation Metrics

Based on the confusion matrix shown in Table 4, we calculated the accuracy, precision, recall, AUC and F-score metrics to evaluate the proposed model. To determine the models’ overall performance, their accuracy, precision, recall, and F1 score have all been evaluated.
Accuracy
This has been the primary and most effective metric utilized in classification algorithms, and is calculated by dividing the number of correctly predicted fake news instances by the number of fake news instances detected. In some cases, it may be referred to as the following:
Accuracy = T P + T N T P + F P + F N + T N
Precision
The precision measure is defined as the ratio of the number of accurately identified fake news instances to the total number of instances of predicted fake news. It is represented by the following:
Precision = T P T P + F P
Recall
The recall is a metric that counts the number of fake news instances that are correctly retrieved from the entire fake news dataset and is calculated below as follows:
Recall = T P T P + F N
F-Score
In the following formula, F is the harmonic mean of recall and precision:
F -score = 2     ( p r e c i s i o n r e c a l l ) ( p r e c i s i o n + r e c a l l )
AUC curve for ROC
In binary classification problems, the ROC (receiver operating curve) is used primarily. Using several thresholds for identifying signals in noise, it plots true positive news against false positive news. AUC (area under curve) is used to measure the classifier’s ability under ROC. The TPR and FPR are measured with the following:
TPR = T r u e   P o s i t i v e   n e w s A l l   P o s i t i v e   n e w s
Recall = F a l s e   P o s i t i v e   n e w s A l l   N e g a t i v e   n e w s

4.2. Implementation Details

We used a high-end configuration system to implement the proposed model. All the implementations were performed using the Linux I7 operating system, 16 GB of DDR4 RAM, a 1 TB SSD, and a 32 GB GPU. We utilized the Anaconda navigator with the Spyder environment and also experimented on Keras. All the models and algorithms were programmed on Python. The hyperparameters and their values utilized to build the model are shown in Table 5.

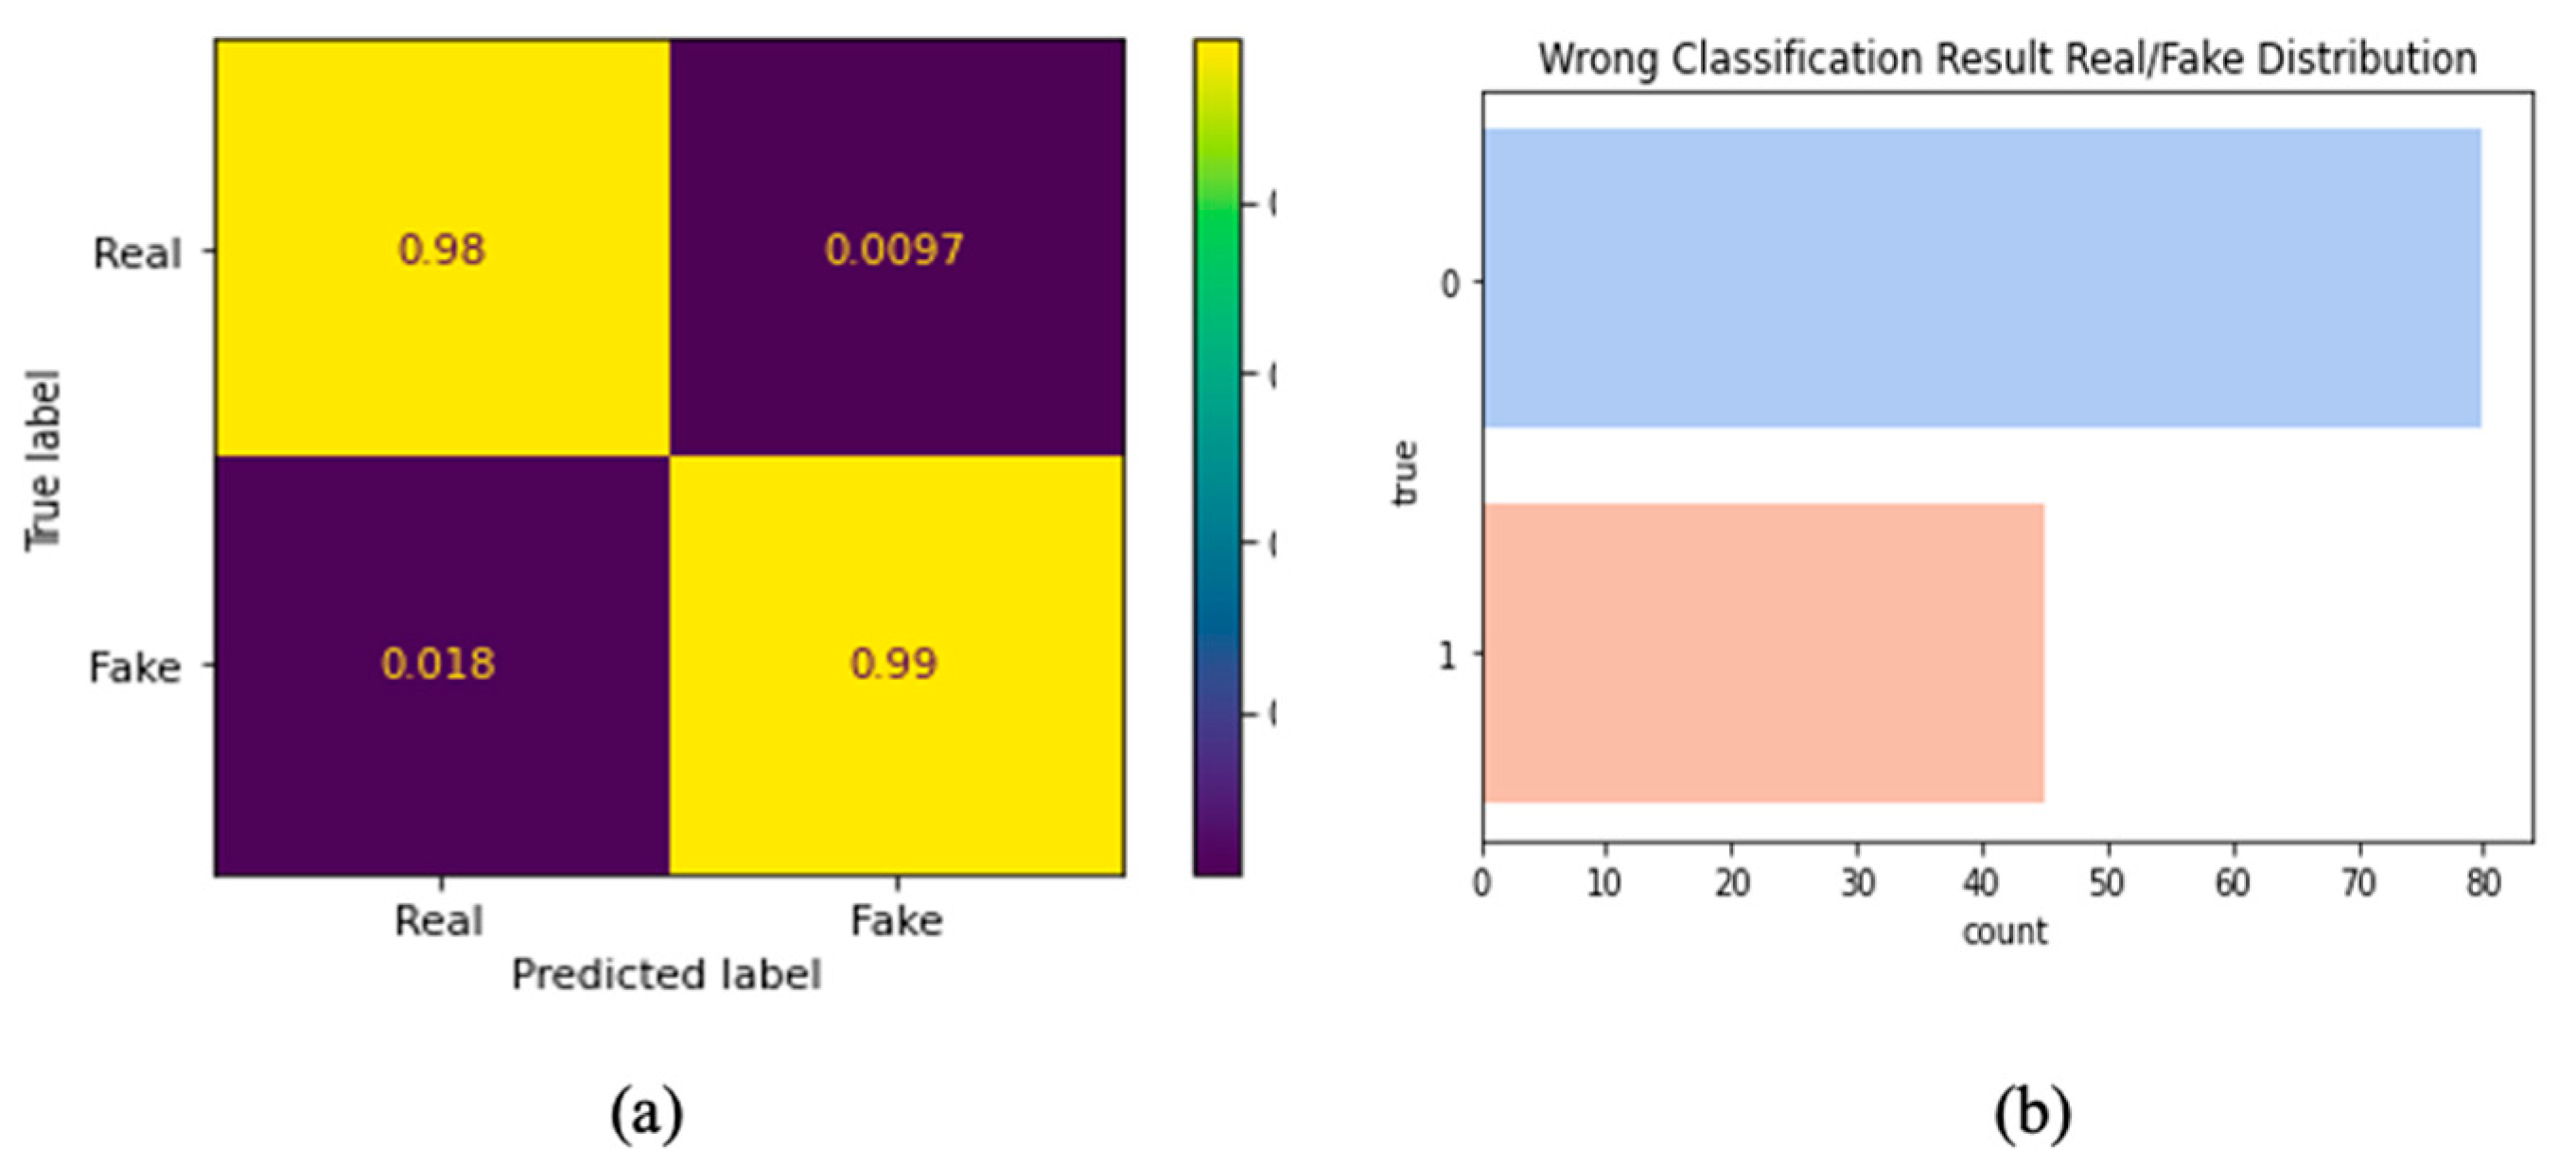
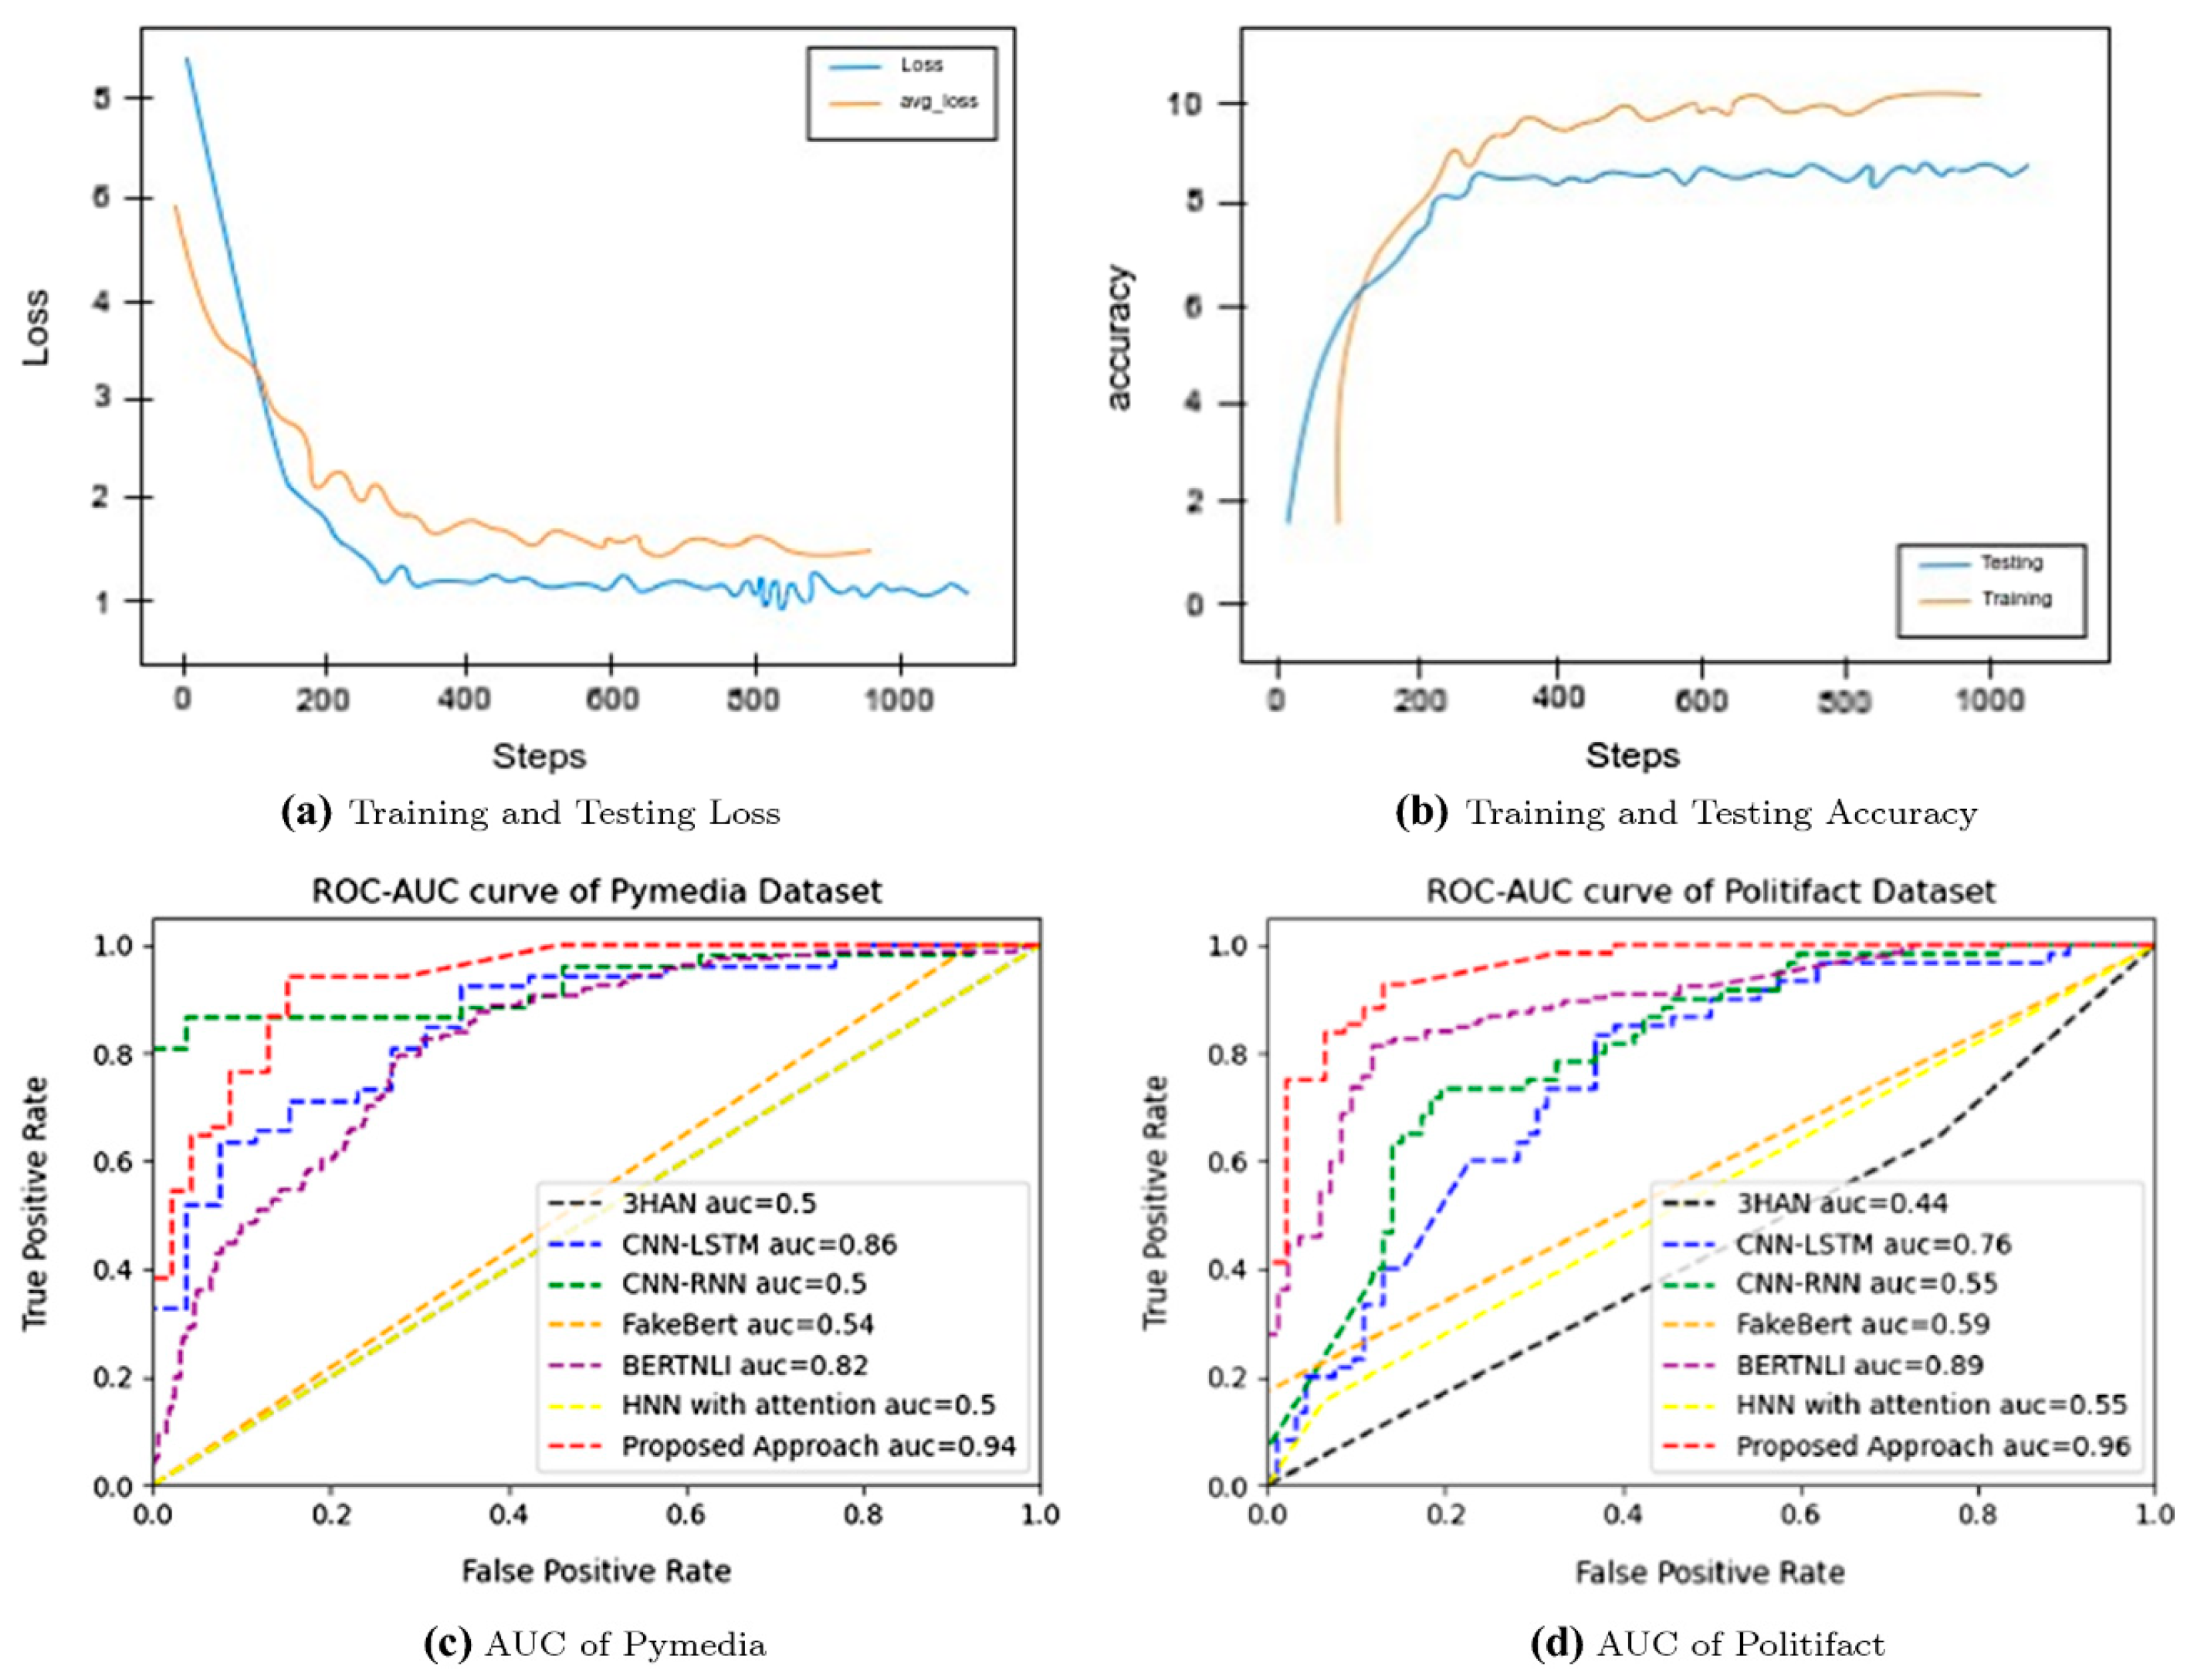
4.3. Result Analysis and Discussions

We then evaluated our approach by contrasting it to baseline other research models such as 3HAN [34], HAN [35], CNN-RNN [36], CNN-LSTM [37], BERT-NLI [38], and Fake BERT [39]. AUC scores, accuracy, precision, recall, and F1-scores are used to evaluate all datasets based on the aforementioned criteria. Our results are obtained from the proposed TL-MVF model on the Fake and Real News dataset. Figure 6a shows the confusion matrix results, which shows that the TN achieved is 98%, the FP is 9.7%, the FN is 1.8%, and the TP is 99%. Figure 6b portrays the wrong classification result in terms of fake and real news distribution. Later, we show the training and testing (loss and accuracy) of the TL-MVF model in Figure 7. From Figure 7a, we can deduce that the training loss is greatest at the outset and decreases to 1.5 after 200 iterations. In addition, between stages 400 and 1000, it varies between 1 and 2. The value drops to zero by the time we reach step 1000. In a similar vein, after 800 iterations, the degradation in test accuracy is minimal. Initially, the training accuracy is low (Figure 7b), but it steadily improves between steps 200 and 400. The maximum is at 100 steps, and then varies between 400 and 1000. The TL-MVF model’s training accuracy (TA) and validation accuracy (VA) results on the dataset are shown in Figure 7b. The experimental results showed that the TL-MVF model had attained its maximum TA and VA values. The TA in particular seemed to be superior to the VA.
In Figure 7c,d, the ROC-AUC curve is shown. Therefore, it can be concluded that attention-based models such as 3HAN [34] and HNN [35] fail miserably when faced with lengthy fake news texts. It stands to reason that the data in news pieces, which tend to be longer than other types of texts, would also be longer and that the reliability of the news would not change if the reader paid more or less attention to various keywords. This finding also lends credence to the idea that word-level representations such as Word2Vec and GloVe can greatly improve the performance of deep neural network models such as CNN-RNN [36] and CNN-LSTM [37]. However, the proposed model can outperform any other models used for comparative analysis. The proposed model also outperforms the most up-to-date BERT model, which is a very good baseline to begin with. The best AUC is shown by the proposed model, indicating that short and lengthy texts may be classified effectively using a multiplicative vector fusion technique.
Table 6 highlights the comparative study of the TL-MVF model with other existing mechanisms over all evaluation measures on the Fake and Real News dataset. The result suggests that the TL-MVF model outperformed other models in terms of all evaluation metrics. It is evident that the accuracy results of the TL-MVF model were 6% more significant than the BERT-NLI model and 3% superior to the Fake BERT model. Similarly, marginal improvements are made to the other models used for comparison with the TL-MVF model. For instance, based on precision, the TL-MVF model obtained a higher precision of 98.28%, whereas the Fake BERT, BERT-NLI, CNN-LSTM, CNN-RNN, HAN, and 3HAN models attained lower precision values of 89.72%, 90.48%, 90.87%, 90.08%, 91.10%, and 92.03%, respectively. In addition, according to the recall factor, the TL-MVF model has reached a superior recall of 97.46%, whereas the Fake BERT, BERT-NLI, CNN-LSTM, CNN-RNN, HAN, and 3HAN models attained lesser recall values of 95.74%, 93.48%, 92.12%, 90.24%, 85.45%, and 87.50%, respectively. Moreover, the TL-MVF model has reached a superior F-score of 97.82%, whereas the Fake BERT, BERT-NLI, CNN-LSTM, CNN-RNN, HAN, and 3HAN models attained lesser recall values of 93.70%, 92.65%, 91.55%, 90.25%, 87.45%, and 88.6%, respectively. Furthermore, the TL-MVF model reached a greater AUC of 97.46%, whereas the Fake BERT, BERT-NLI, CNN-LSTM, CNN-RNN, HAN, and 3HAN models attained lesser AUC values of 94.70%, 91.55%, 88.46%, 86.30%, 81.20%, and 90.4%, respectively.
We also ran experiments on false news detection 10 times and took the average; the results are presented in Table 7 along with our overall evaluation of the model’s performance. As a whole, our approach outperforms benchmarked models on the PolitiFact dataset across our evaluation metrics. The proposed TL-MVF also achieves better results than the Fake BERT does across the board. The accuracy increased by 3%, the precision by 2%, and the recall by 1% compared to the outperforming models. In terms of the F1 score, the proposed approach has a major outbreak. However, on the Pymedia dataset, the TL-MVF may perform better than the most popular of the other models, with an F-score of 93.64%, which was 4% higher than the BERT-NLI model. When compared to the remainder of the baseline, our proposed technique outperforms it with an AUC of 95.68%, while the rest of the baseline models do not touch an AUC of 84%.
On the Pymedia dataset, Table 8 compares the TL-MVF model with other models in terms of all assessment metrics, including accuracy, precision, recall, f-score, and AUC. Table 8 illustrates that the TL-MVF model attained superior values of accuracy, precision, recall, f-score, and AUC over other models. Initially, the accuracy results of the TL-MVF model show an increase of 3% for Fake BERT, 5% for BERT-NLI, 7% for CNN-LSTM, 13% for CNN-RNN, 11% for HAN, and 14% for 3HAN. Likewise, the precision results of the proposed TL-MVF model obtained a dramatic improvement of 2%, 4%, 3%, 8%, 11%, and 7%, respectively. Correspondingly, the recall results were 2%, 2%, 3%, 2%, 6%, and 12% higher than the Fake BERT, BERT-NLI, CNN-LSTM, CNN-RNN, HAN, and 3HAN, respectively. Moreover, the F-score results were 3%, 4%, 5%, 7%, 11%, and 10% superior to the Fake BERT, BERT-NLI, CNN-LSTM, CNN-RNN, HAN, and 3HAN, respectively. For instance, based on AUC, the TL-MVF model obtained a maximal AUC of 98.21%, whereas the 3HAN, HAN, CNN-RNN, CNN-LSTM, BERT-NLI, and Fake BERT approaches obtained reduced AUC values of 92.04%, 92.85%, 83.29%, 93.27%, 91.15%, and 93.65%, respectively. It yields an improvement of 5%, 7%, 5%, 12%, 6%, and 6% when compared with base of Fake BERT, BERT-NLI, CNN-LSTM, CNN-RNN, HAN, and 3HAN, respectively.

4.4. Result Analysis of the Proposed TL-MVF Model on the Existing Benchmarked Models

The proposed TL-MVF model is compared with and analyzed using benchmarked models, namely T5 [40], XLNET [41], ALBERT [42], BERT [43], and RoBERTa [30] over the three datasets. Initially, Figure 8 shows the comparative results of the TL-MVF over the Fake and Real News dataset. The results indicate that the TL-MVF model outperforms accuracy by 2% on the RoBERTa model, 3% on the BERT model, 5% on the ALBERT model, 3% on the XLNET model, and 13% on the T5 model. Similarly, the precision results are increased by 3%, 4%, 1%, 2%, and 5% for models that are modern under comparison. Besides, the recall results are 3%, 5%, 6%, 8%, and 12% higher than benchmarked models, respectively. The F-score and AUC are more encouraging than the other models. The reason behind these superior results of the TL-MVF model is the multiplicative vector fusion technique employed with fine-tune hyperparameters over the RoBERTa model.
The results of the TL-MVF obtained on the Politifact and Pymedia datasets are presented in Figure 9 and Figure 10, respectively. We found that the proposed TL-MVF model performed better on the Politifact dataset, with accuracy values at 97.02%, precision values at 96.52%, recall values at 95.46%, F-score values at 95.85%, and AUC values at 96.0%, respectively, than the benchmarked models. In addition, the results of the proposed TL-MVF model on the Pymedia dataset are more efficient than the benchmarked models in terms of all evaluation parameters, such as accuracy of 98.25%, precision of 97.10%, recall of 96.35%, F-score of 95.70%, and AUC of 96.45%, respectively.

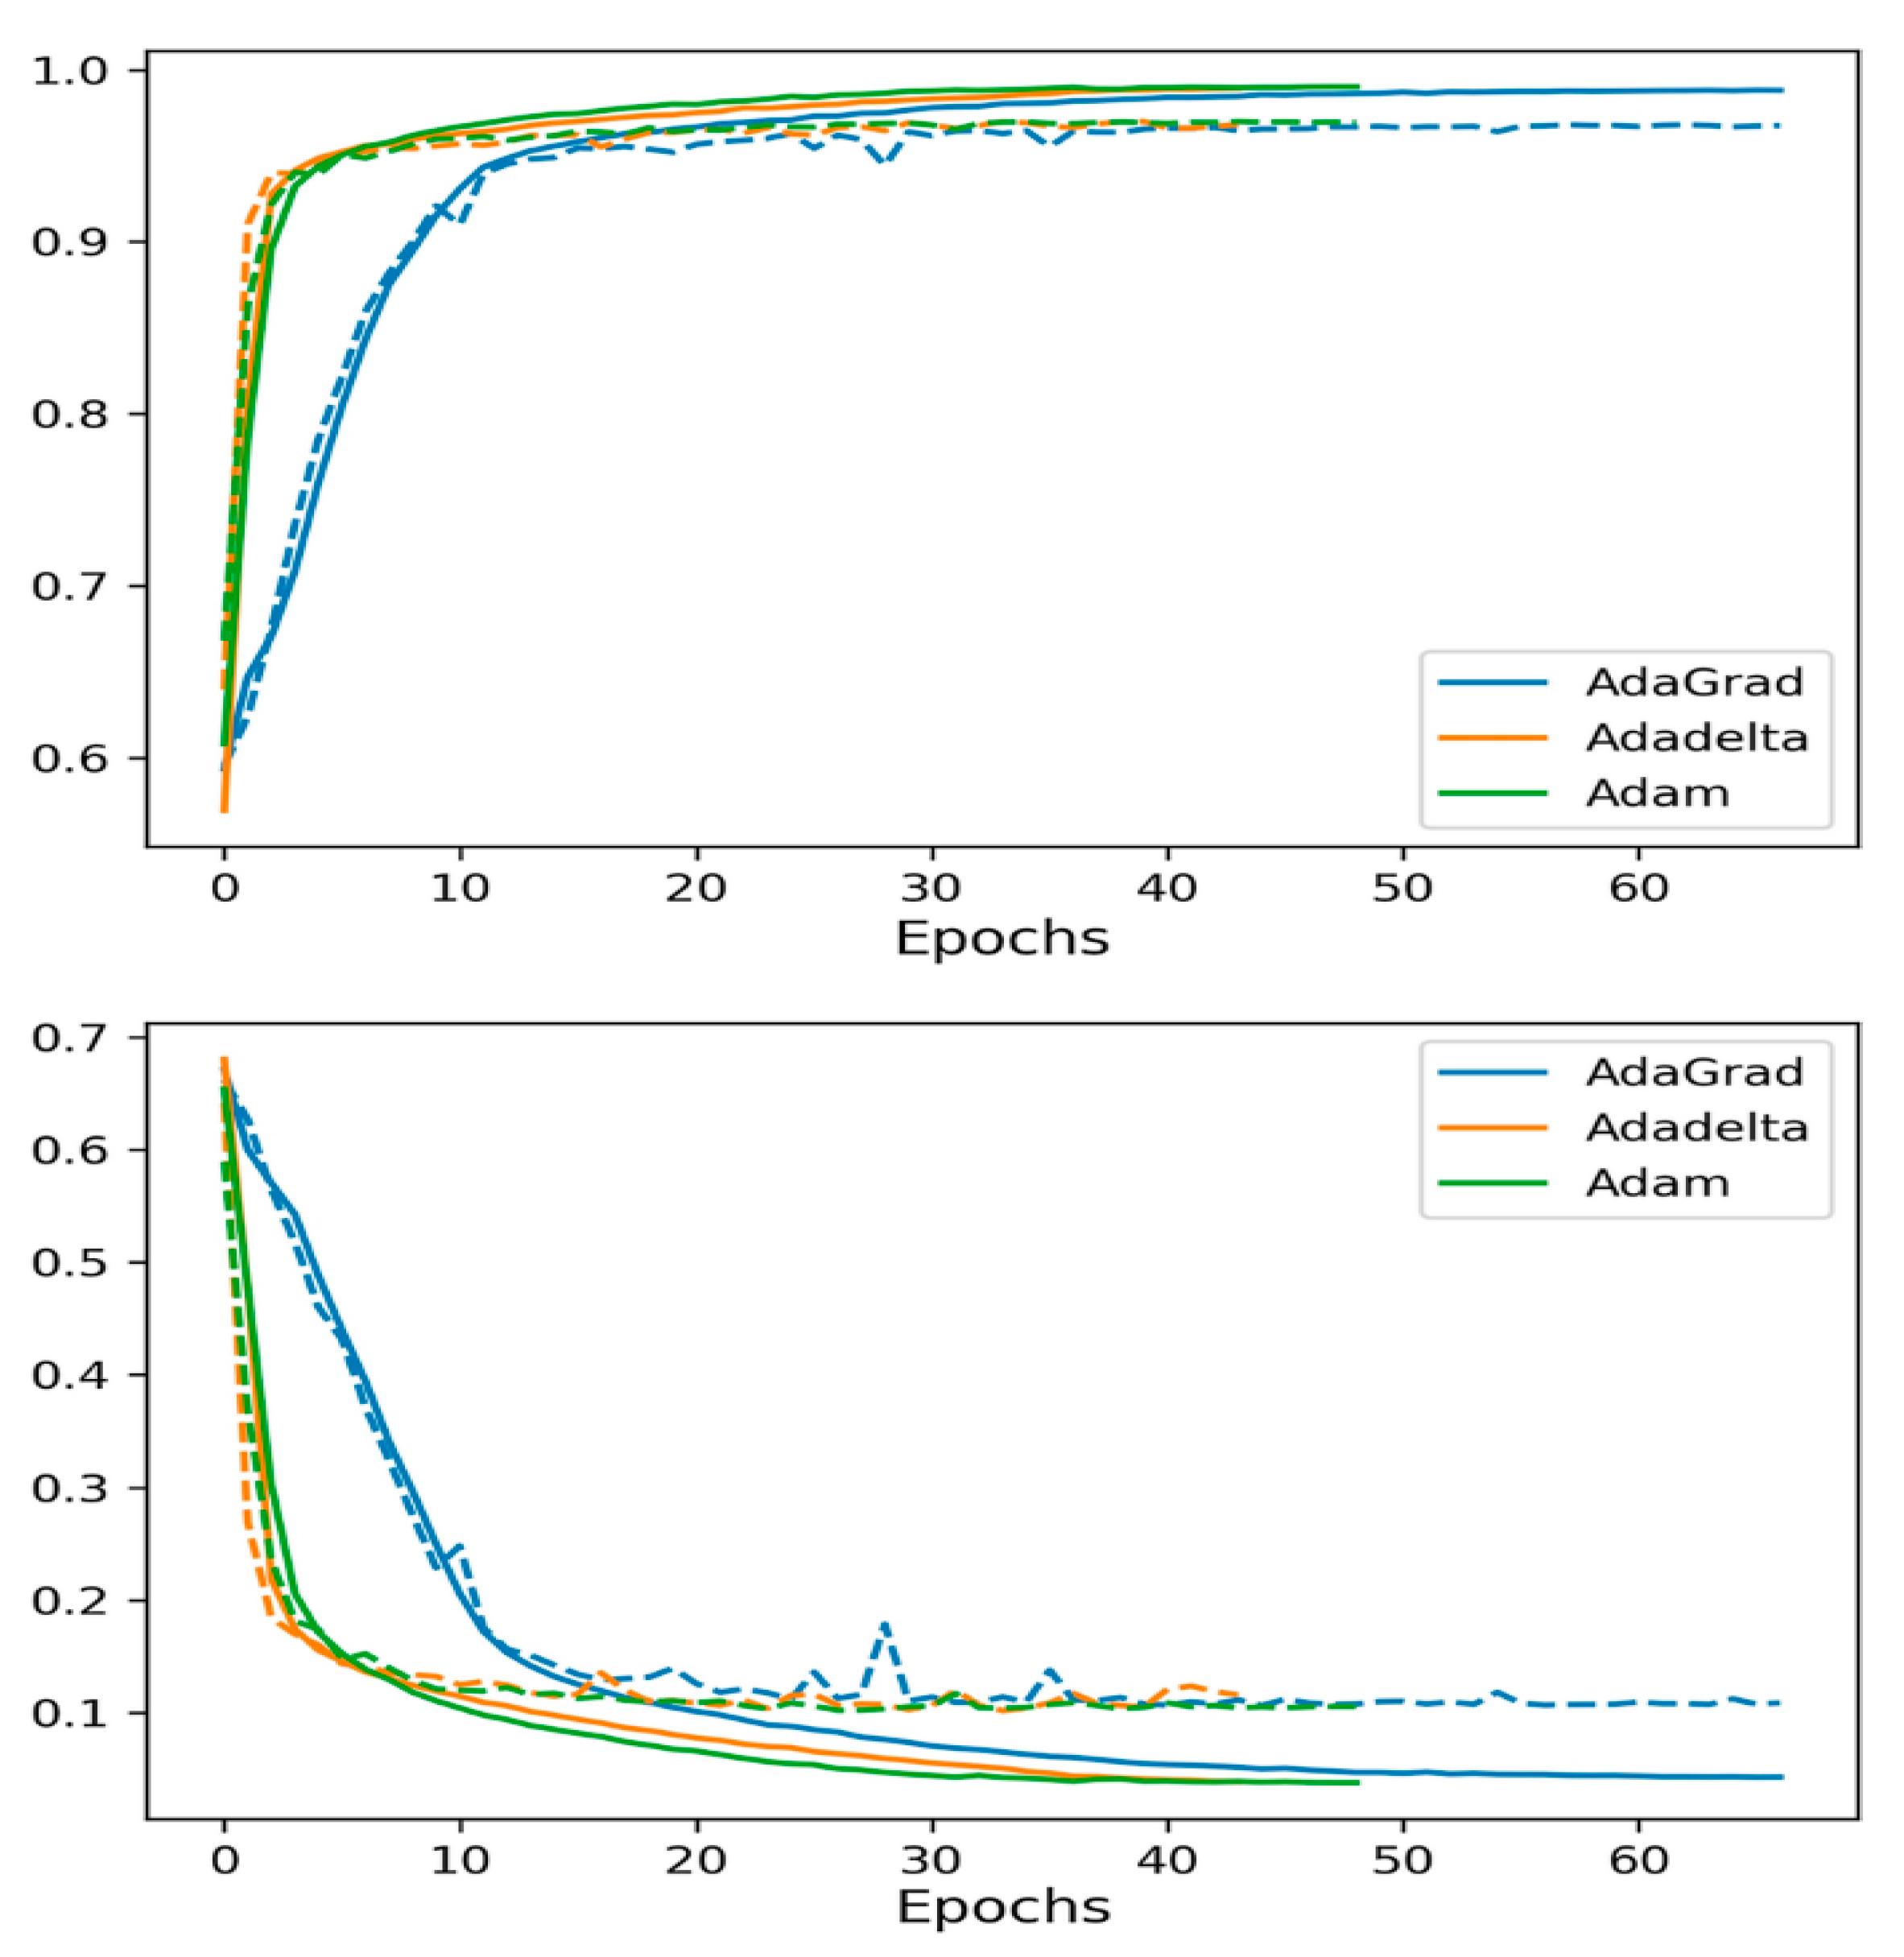
4.5. Hyperparameter Selection

Overfitting is a problem that must be addressed with special care when it comes to transfer learning networks that are accomplished by the proposed model. To address the overfitting problem, model training along with validation performance are measured. The results of this monitoring are collectively presented across various optimizers in Figure 11. When comparing the various optimizers, it is important to keep in mind that the value range on the y-axis varies from one to the next. This allows for a more accurate depiction of the variations. In addition to that, the findings achieved from the experiments with various optimizers and learning settings are described in detail.
The Adam, AdaGrad, and Adadelta optimizers are used in many tests with learning rates ranging from 0.1 to 0.0001. We determined that the learning rates for Adam (0.0001), Adadelta (0.1), and AdaGrad (0.01) are appropriate for hyperparameter selection. When there is no noteworthy performance increase, the training of the model is stopped using an optimal early stopping mechanism after a variable number of epochs (up to 200) for each architecture. After all the optimizers converge, then there is little to no difference in performance, making training time a crucial parameter. The Adam optimizer provided the best stable performance across all architectures with the fewest necessary epochs; hence, it is the one utilized for all of the findings shown there. There appears to be no clear overfitting given the use of the early stopping mechanism, and the accuracy and loss while validating the model may not ensure that they regularly diminish throughout epochs of training. Keep in mind that the reported findings are the average of five independent experiments, making the likelihood of overfitting even smaller.

5. Conclusions and Future Work

During the past decade, transformers’ effectiveness has grown dramatically in NLP applications. An extensive range of social media applications is used to validate current deep learning models for detecting fake news. However, models do not perform well in real-world applications if they are not generalizable. Improving performance in clinical contexts requires training in a universal rather than a specialized model. Fake news classification and detection is a vital area in the current social media world, and the paper discusses the work that has been performed in this regard. TL-MVF is a novel model proposed in this paper for detecting and categorizing fake news in social media. The TL-MVF model involves a series of sub-processes, namely data precession, the T5 model for text-text sentence generation, the RELU activation function for optimizing the results, the RoBERTa model for fake news detection (fine-tuned), and Adam-based hyperparameter tuning. Based on the titles of the long texts, a multiplicative fusion-based classification technique is proposed for classifying news as fake or real. The experimental results of the TL-MVF model are performed utilizing one benchmark dataset and two real-time datasets, and the outcomes are investigated under distinct measures. The comparison study highlighted the enhanced performance of the TL-MVF model compared to existing approaches. TL-MVF is therefore an effective model for detecting and categorizing fake news on social media. For the purpose of this study, we simply considered text to identify bogus news on social media. As an added benefit of this research, the cyber cell of the police department can use it to adopt appropriate measures and methods for dealing with fake data, which will lower levels of crime and improve the quality of life for everyone. As the system was designed to analyze text data, its only limitation is that it only produces results for text data; however, in the future, it can be extended to include images alongside text to create broad and heterogeneous analysis results. Going forward, it is possible to study and test the given model in a variety of transformer models to improve the overall classification performance on fake images and video data. In addition, we plan to fine-tune the RoBERTa and subsequent layer hyperparameters and analyze their layered process in depth.

Author Contributions

Conceptualization, Y.S.; methodology, J.H.; validation, Y.S., J.H.; formal analysis, Y.S., J.H.; investigation, Y.S.; resources, J.H.; data curation, Y.S.; writing-original draft preparation, Y.S.; writing- review and editing, J.H.; supervision. All authors have read and agreed to the published version of the manuscript.

Funding

This research received no external funding.

Institutional Review Board Statement

Not applicable.

Informed Consent Statement

Not applicable.

Data Availability Statement

Not applicable.

Conflicts of Interest

The authors declare no conflict to interest.

References

  1. Shubha, M.; Shukla, P.; Agarwal, R. Analysing machine learning enabled fake news detection techniques for diversified datasets. Wirel. Commun. Mob. Comput. 2022, 2022, 1575365. [Google Scholar]
  2. Raza, S.; Ding, C. Fake news detection based on news content and social contexts: A transformer-based approach. Int. J. Data Sci. Anal. 2022, 13, 335–362. [Google Scholar] [CrossRef]
  3. Lai, C.-M.; Chen, M.-H.; Kristiani, E.; Verma, V.K.; Yang, C.-T. Fake News Classification Based on Content Level Features. Appl. Sci. 2022, 12, 1116. [Google Scholar] [CrossRef]
  4. Truică, C.O.; Apostol, E.S.; Paschke, A. Awakened at CheckThat! 2022: Fake news detection using Bi-LSTM and sentence transformer. In Proceedings of the CLEF 2022: Conference and Labs of the Evaluation Forum, Bologna, Italy, 5–8 September 2022. [Google Scholar]
  5. Alonso, M.A.; Vilares, D.; Gómez-Rodríguez, C.; Vilares, J. Sentiment analysis for fake news detection. Electronics 2021, 10, 1348. [Google Scholar] [CrossRef]
  6. Liu, W.; Zhou, P.; Zhao, Z.; Wang, Z.; Ju, Q.; Deng, H.; Wang, P. K-BERT: Enabling Language Representation with Knowledge Graph. arXiv 2019. [Google Scholar] [CrossRef]
  7. Spradling, M.; Straub, J.; Strong, J. Protection from ‘fake news’: The need for descriptive factual labeling for online content. Future Internet 2021, 13, 142. [Google Scholar] [CrossRef]
  8. He, P.; Liu, X.; Gao, J.; Chen, W. DeBERTa: Decoding-enhanced BERT with Disentangled Attention. arXiv 2020, arXiv:2006.03654. [Google Scholar]
  9. Dai, Z.; Yang, Z.; Yang, Y.; Carbonell, J.; Le, Q.V.; Salakhutdinov, R. Transformer-XL: Attentive language models beyond a fixed-length context. In Proceedings of the ACL 2019—57th Annual Meeting of the Association for Computational Linguistics, Florence, Italy, 28 July–2 August 2020. [Google Scholar]
  10. Devlin, J.; Chang, M.W.; Lee, K.; Toutanova, K. BERT: Pre-training of deep bidirectional transformers for language un-derstanding. In Proceedings of the NAACL HLT 2019—2019 Conference of the North American Chapter of the Association for Computational Linguistics: Human Language Technologies, Minneapolis, MN, USA, 2–7 June 2019. [Google Scholar]
  11. Al-Ahmad, B.; Al-Zoubi, A.; Abu Khurma, R.; Aljarah, I. An Evolutionary Fake News Detection Method for COVID-19 Pandemic Information. Symmetry 2021, 13, 1091. [Google Scholar] [CrossRef]
  12. Tan, C.; Sun, F.; Kong, T.; Zhang, W.; Yang, C.; Liu, C. A survey on deep transfer learning. In Lecture Notes in Computer Science, Proceedings of the 27th International Conference on Artificial Neural Networks, Rhodes, Greece, 4–7 October 2018; Lecture Notes in Artificial Intelligence and Lecture Notes in Bioinformatics; Elsevier: Amsterdam, The Netherlands, 2018. [Google Scholar]
  13. Abonizio, H.Q.; De Morais, J.I.; Tavares, G.M.; Junior, S.B. Language-Independent Fake News Detection: English, Portuguese, and Spanish Mutual Features. Futur. Internet 2020, 12, 87. [Google Scholar] [CrossRef]
  14. Zhu, Y.; Sheng, Q.; Cao, J.; Nan, Q.; Shu, K.; Wu, M.; Wang, J.; Zhuang, F. Memory-Guided Multi-View Multi-Domain Fake News Detection. IEEE Trans. Knowl. Data Eng. 2022, 1–14. [Google Scholar] [CrossRef]
  15. Mouratidis, D.; Nikiforos, M.; Kermanidis, K. Deep Learning for Fake News Detection in a Pairwise Textual Input Schema. Computation 2021, 9, 20. [Google Scholar] [CrossRef]
  16. Segura-Bedmar, I.; Alonso-Bartolome, S. Multimodal Fake News Detection. Information 2022, 13, 284. [Google Scholar] [CrossRef]
  17. Allcott, H.; Gentzkow, M. social media and Fake News in the 2016 Election. J. Econ. Perspect. 2017, 31, 211–236. [Google Scholar] [CrossRef] [Green Version]
  18. Shu, K.; Sliva, A.; Wang, S.; Tang, J.; Liu, H. Fake News Detection on social media. ACM SIGKDD Explor. Newsl. 2017, 19, 22–36. [Google Scholar] [CrossRef]
  19. Wang, W.Y. “Liar, liar pants on fire”: A new benchmark dataset for fake news detection. In Proceedings of the ACL 2017—55th Annual Meeting of the Association for Computational Linguistics, Vancuver, BC, Canada, 30 July–4 August 2017. [Google Scholar]
  20. Riedel, B.; Augenstein, I.; Spithourakis, G.P.; Riedel, S. A simple but tough-to-beat baseline for the Fake News Challenge stance detection task. arXiv 2017, arXiv:1707.03264. [Google Scholar]
  21. Ghanem, B.; Rosso, P.; Rangel, F. Stance Detection in Fake News a Combined Feature Representation. In Proceedings of the First Workshop on Fact Extraction and VERification (FEVER), Brussels, Belgium, November 2018. [Google Scholar] [CrossRef] [Green Version]
  22. Rastogi, S.; Bansal, D. A review on fake news detection 3T’s: Typology, time of detection, taxonomies. Int. J. Inf. Secur. 2022, 22, 177–212. [Google Scholar] [CrossRef]
  23. Jwa, H.; Oh, D.; Park, K.; Kang, J.M.; Lim, H. exBAKE: Automatic fake news detection model based on Bidirectional En-coder Representations from Transformers (BERT). Appl. Sci. 2019, 9, 4062. [Google Scholar] [CrossRef] [Green Version]
  24. Fake News. Available online: https://www.kaggle.com/c/fake-news (accessed on 23 December 2020).
  25. Szczepański, M.; Pawlicki, M.; Kozik, R.; Choraś, M. New explainability method for BERT-based model in fake news detection. Sci. Rep. 2021, 11, 23705. [Google Scholar] [CrossRef] [PubMed]
  26. Dhiman, P.; Kaur, A.; Iwendi, C.; Mohan, S.K. A Scientometric Analysis of Deep Learning Approaches for Detecting Fake News. Electronics 2023, 12, 948. [Google Scholar] [CrossRef]
  27. Ahmad, I.; Yousaf, M.; Yousaf, S.; Ahmad, M.O. Fake News Detection Using Machine Learning Ensemble Methods. Complexity 2020, 2020, 8885861. [Google Scholar] [CrossRef]
  28. Tida, V.S.; Hsu, S. Universal spam detection using transfer learning of BERT model. arXiv 2022, arXiv:2202.03480. [Google Scholar]
  29. Raffel, C.; Shazeer, N.; Roberts, A.; Lee, K.; Narang, S.; Matena, M.; Zhou, Y.; Li, W.; Liu, P.J. Exploring the limits of transfer learning with a unified text-to-text transformer. J. Mach. Learn. Res. 2020, 21, 5485–5551. [Google Scholar]
  30. Pavlov, T.; Mirceva, G. COVID-19 Fake News Detection by Using BERT and RoBERTa models. In Proceedings of the 2022 45th Jubilee International Convention on Information, Communication and Electronic Technology (MIPRO), Opatija, Croatia, 23–27 May 2022; pp. 312–316. [Google Scholar] [CrossRef]
  31. Available online: https://www.kaggle.com/datasets/clmentbisaillon/fake-and-real-news-dataset (accessed on 23 December 2020).
  32. POLITICO. World Net Daily. 2020. Available online: https://www.politico.com/news/world-net-daily (accessed on 23 December 2020).
  33. Politifact. 2020. Available online: https://www.Politifact.com (accessed on 23 December 2020).
  34. Singhania, S.; Fernandez, N.; Rao, S. 3HAN: A Deep Neural Network for Fake News Detection. In Neural Information Processing, Proceedings of the 24th International Conference, ICONIP 2017, Guangzhou, China, 14–18 November 2017; Springer: Berlin/Heidelberg, Germany, 2017; pp. 572–581. [Google Scholar] [CrossRef]
  35. Okano, E.Y.; Liu, Z.; Ji, D.; Ruiz, E.E.S. Fake News Detection on Fake.Br Using Hierarchical Attention Networks. In Computational, Proceedings of the Portuguese Language 14th International Conference, PROPOR 2020, Evora, Portugal, 2–4 March 2020; Springer: Berlin/Heidelberg, Germany, 2020; pp. 143–152. [Google Scholar] [CrossRef]
  36. Salini, Y.; HariKiran, J. Deepfakes on Retinal Images using GAN. Int. J. Adv. Comput. Sci. Appl. 2022, 13. [Google Scholar] [CrossRef]
  37. Umer, M.; Imtiaz, Z.; Ullah, S.; Mehmood, A.; Choi, G.S.; On, B.-W. Fake News Stance Detection Using Deep Learning Architecture (CNN-LSTM). IEEE Access 2020, 8, 156695–156706. [Google Scholar] [CrossRef]
  38. Yang, K.; Niven, T.; Kao, H. Fake news detection as natural language inference. arXiv 2019, arXiv:1907.07347. [Google Scholar]
  39. Kaliyar, R.K.; Goswami, A.; Narang, P. FakeBERT: Fake news detection in social media with a BERT-based deep learning approach. Multimed. Tools Appl. 2021, 80, 11765–11788. [Google Scholar] [CrossRef]
  40. Ni, J.; Abrego, G.H.; Constant, N.; Ma, J.; Hall, K.; Cer, D.; Yang, Y. Sentence-T5: Scalable Sentence Encoders from Pre-trained Text-to-Text Models. arXiv 2021, arXiv:2108.08877. [Google Scholar]
  41. Kumar, A.; Trueman, T.E.; Cambria, E. Fake news detection using XLNet fine-tuning model. In Proceedings of the 2021 International Conference on Computational Intelligence and Computing Applications (ICCICA), Nagpur, India, 26–27 November 2021; IEEE: Washington, DC, USA, 2021; pp. 1–4. [Google Scholar]
  42. Gundapu, S.; Mamidi, R. Transformer based automatic COVID-19 fake news detection system. arXiv 2021, arXiv:2101.00180. [Google Scholar]
  43. Amer, E.; Kwak, K.-S.; El-Sappagh, S. Context-Based Fake News Detection Model Relying on Deep Learning Models. Electronics 2022, 11, 1255. [Google Scholar] [CrossRef]
Figure 1. General model for the classification of fake news over social media.
Applsci 13 04207 g001
Figure 2. (a) True News subject distribution (b) Fake News subject distribution.
Applsci 13 04207 g002
Figure 3. (a) Word cloud: Real News (b) Word cloud: Fake News.
Applsci 13 04207 g003
Figure 4. (a) Pymedia news dataset frequency distribution. (b) PolitiFact news dataset frequency distribution.
Applsci 13 04207 g004
Figure 5. Proposed model for identifying fake news on social media.
Applsci 13 04207 g005
Figure 6. (a) Confusion matrix (b) Wrong classification result (fake/real).
Applsci 13 04207 g006
Figure 7. (a) Loss in training and testing (Pymedia dataset). (b) Accuracy in training and testing (Politifact dataset). (c) Results of ROC-AUC curves (dataset from Pymedia). (d) Results of ROC-AUC curves (dataset from Politifact).
Applsci 13 04207 g007
Figure 8. Comparative result analysis of TL-MVF with existing benchmarked models over the Fake and Real News dataset.
Applsci 13 04207 g008
Figure 9. Comparative result analysis of the TL-MVF with existing benchmarked models on the PolitiFact dataset.
Applsci 13 04207 g009
Figure 10. Comparative result analysis of the TL-MVF model with existing benchmarked models over the Pymedia dataset.
Applsci 13 04207 g010
Figure 11. The training and validation (loss and accuracy) of the TL-MVF model for various optimizers. Validation scores--dashed lines; training scores--solid lines.
Applsci 13 04207 g011
Table 1. Fake and Real News dataset details.
DatasetFeaturesFakeReal
Fake and Real News [31]4 (title, text, subject, and date)21,41723,502
Table 2. Pymedia dataset details.
DatasetFeaturesCount
Pymedia dataset [32]Authors3634
Subjects152
Generated articles140,55
Total article subjects48,756
Table 3. PolitiFact dataset details.
DatasetFeaturesCount
Politifact dataset [33]Websites68
Subjects1020
Web links1619
Table 4. Confusion matrix.
Predicted
Real NewsFake News
ActualReal newsTNFP
Fake newsFNTP
TN (True Negative)—the actual text was real news, and the predicted text was real news; FP (False Positive)—the actual text was real news, and the predicted text was fake news; FN (False Negative)—the actual text was fake news, and the predicted text was real news. FP (False Positive)—the actual text was fake news, and the predicted text was fake news.
Table 5. Hyperparameter values used under the RoBERTa model with MVF technique.
Name of the HyperparameterValue
Batch size32
Learning rate0.001
Hidden layers12
Patience5
Dropout0.1
Annealing factor5
Time steps150
Number of epochs5
Max. training epoch50
Encoding layer dimensions768
Feedforward layer dimensions3072
OptimizerAdam, Adagrad, and Adadelta
ActivationReLU and Softmax
Table 6. Comparative results of the proposed TL-MVF with other mechanisms over Fake and Real News dataset.
ModelsAccuracy
(%)
Precision (%)Recall (%)F-score (%)AUC (%)
3HAN [34]96.7789.7287.5088.690.4
HAN [35]83.2990.4885.4587.4581.20
CNN-RNN [36]93.2790.8790.2490.2586.30
CNN-LSTM [37]91.1590.0892.1291.5588.46
BERT-NLI [38]93.6591.1093.4892.6591.55
Fake BERT [39]96.8492.0395.7493.7094.70
TL-MVF (Proposed)99.1298.2897.4697.8298.34
Table 7. Comparative results of the proposed TL-MVF with other models over the PolitiFact dataset.
ModelsAccuracy
(%)
Precision (%)Recall (%)F-Score (%)AUC
(%)
3HAN [34]88.6091.2085.4687.3092.42
HAN [35]86.4086.4590.2588.4591.56
CNN-RNN [36]81.9593.4080.7586.7484.80
CNN-LSTM [37]86.7490.7579.3285.9289.54
BERT-NLI [38]85.6592.3288.7689.4390.25
Fake BERT [39]91.4293.4085.2488.5091.35
TL-MVF (Proposed)94.5095.4691.4293.6495.68
Table 8. Comparative results of the proposed TL-MVF with other models over the Pymedia dataset.
ModelsAccuracy
(%)
Precision (%)Recall (%)F-Score (%)AUC (%)
3HAN [34]82.3590.6584.7287.3692.4
HAN [35]85.1486.7587.0086.1592.85
CNN-RNN [36]83.7089.2392.4190.4283.29
CNN-LSTM [37]89.3692.4593.1292.7693.27
BERT-NLI [38]91.2593.6294.1593.9591.15
Fake BERT [39]93.8595.4094.2594.7693.65
TL-MVF (Proposed)96.2097.5596.4597.0598.21
Disclaimer/Publisher’s Note: The statements, opinions and data contained in all publications are solely those of the individual author(s) and contributor(s) and not of MDPI and/or the editor(s). MDPI and/or the editor(s) disclaim responsibility for any injury to people or property resulting from any ideas, methods, instructions or products referred to in the content.

