Communication

A Probabilistic Forecast Algorithm of Nonconvective Turbulence over the Tibetan Plateau

1
Institute of Atmospheric Physics, Chinese Academy of Sciences, Beijing 100029, China
2
University of Chinese Academy of Sciences, Beijing 100049, China
3
Hebei Institute of Meteorological Sciences, Shijiazhuang 050021, China
4
College of Atmospheric Sciences, Nanjing University of Information Science & Technology, Nanjing 210044, China
*
Authors to whom correspondence should be addressed.
Appl. Sci. 2023, 13(7), 4131; https://doi.org/10.3390/app13074131
Submission received: 31 January 2023 / Revised: 15 March 2023 / Accepted: 19 March 2023 / Published: 24 March 2023
(This article belongs to the Section Earth Sciences)

Abstract

:

Featured Application

The aim of this work is to improve turbulence forecasting in the Tibetan Plateau region.

Abstract

The development of upper-level turbulence forecast algorithms is important for enhancing flight safety. Seventeen nonconvective turbulence indices were calculated over the Tibetan Plateau for August from 2012–2021 with ERA5 reanalysis data. The thresholds for these turbulence indices were reclassified by using the percentile method based on the Richardson number. The reclassified thresholds were found to be more reasonable than the empirical thresholds. A turbulence probability index was used to aggregate the 17 turbulence indices without requiring observational data. The validity of the turbulence probability index was preliminarily confirmed by comparing it with turbulence events. Further research revealed that the turbulence probability index exhibited interannual fluctuation.

1. Introduction

Upper-level turbulence has an impact on flight safety and is rarely accompanied by evident weather phenomena, and may cause aircraft damage and injury to passengers and crew. It is therefore important to improve the skill required for forecasting it. Upper-level turbulence comes from three main sources: tropopause/jet stream, mountain waves, and convective systems. Turbulence caused by these three sources is referred to as clear air turbulence (CAT), mountain wave turbulence (MWT), and convective induced turbulence (CIT) [1,2,3,4,5]. Kim and Chun [6] investigated possible sources of the observed turbulence events over South Korea using lightning flash data, Regional Data Assimilation and Prediction System (RDAPS) analysis data, and a digital elevation model (DEM) dataset. Many CAT indices incorporating different factors have been proposed, such as the Richardson number (Ri; Dutton and Panofsky, 1970) for determining Kelvin–Helmholtz instability (K–H instability), the CP index incorporating vertical wind shear [7] and TI1 [8], the turbulent dissipation rate (EDR; [9]), NCSU1 [10], and MOS CAT [11]. Sharman and Pearson [12] used combinations of low-level wind speed and CAT diagnostics to produce 3D MWT diagnostics. S.-H. Kim et al. [13] proposed near-cloud turbulence (NCT) diagnostics using a convective gravity wave drag (CGWD) parameterization scheme. These NCT diagnostics were then tested and evaluated [14]. These indices can be used to characterize turbulence intensity by assigning different thresholds and classifying them into different intensity classes. Ensemble forecasting methods of turbulence using multiple turbulence indices have also been developed, such as the Met Office Global and Regional Ensemble Prediction System (MOGREPS; [15]) and NOAA’s Graphical Turbulence Guidance (GTG; [12,16]), which are important tools for current turbulence forecasting. The ensemble algorithm requires a uniform measure of the turbulence indices. An early algorithm by GTG normalized the turbulence indices [16]. With the development of airborne equipment, Sharman and Pearson [12] improved the algorithm with statistical methods to map the turbulence indices to the energy dissipation rate (EDR). Kim et al. [17] developed the global Graphical Turbulence Guidance (G-GTG), which is based on the GTG over the United States. The system uses a multidiagnostic-based en route nonconvective turbulence forecasting algorithm, which captures multiple turbulence sources of CAT and MWT. In terms of the threshold classification of turbulence indices, Sharman et al. [16] normalized the indices and defined five classes of 0, 0.25, 0.5, 0.75, and 1 as none, light, moderate, strong, and very strong, respectively. Based on the empirical threshold of the EDR, Williams [18] classified the percentile of turbulence intensity and then classified 21 other clear-air turbulence indices.
The Tibetan Plateau has unique atmospheric dynamics and thermal structures owing to its prominent and complicated terrain [19]. Zhang et al. [20] found significant differences in the atmospheric turbulent vertical structure in different regions of the Tibetan Plateau. The route over the plateau is affected by turbulence year-round [20,21,22], posing a serious threat to the flight. Thus, we focus on the forecast method for the upper-level turbulence in this region. Shen [23] and Li et al. [24] applied Sharman’s [16] method for calculating the turbulence index thresholds for several indices in Beijing and China using the WRF model and T213 model, respectively. However, their results differed from those reported by Sharman. These discrepancies highlight the fact that the threshold values for the turbulence indices can vary based on the geographical region of study and the data sources utilized. Therefore, the thresholds of the turbulence indices should be redefined when applied to the Tibetan Plateau. The uncertainty of the turbulence index thresholds and the lack of availability and resolution of the observations over the Tibetan Plateau are the main issues in the turbulence forecast practice.
In this study, we reclassify the turbulence index thresholds for the Tibetan Plateau based on the negative Richardson number. The ERA5 reanalysis data were used to calculate the indices, with a horizontal resolution of 0.25°. Furthermore, a probabilistic turbulence forecast algorithm was used to aggregate the turbulence indices. The probability index (PI) successfully identified several real turbulence events, and its statistical results were consistent with those found in previous studies, providing evidence for its practicality and validity. As there are currently few available CIT indices and due to the difficulty in verifying their performance after incorporating them into the probabilistic algorithm, this study focused on nonconvective turbulence and calculated only the CAT and MWT indices.

2. Materials and Methods

Kelvin–Helmholtz (K–H) instability is thought to be the root cause of CAT, and a Ri smaller than 0.25 is typically thought to allow K–H instability [25]. However, due to the numerical model’s resolution, Ri rarely approaches 0.25 when calculating grid data; hence, the turbulence threshold should be adjusted [1]. Here, we use 17 turbulence indices, including 11 CAT indices and 6 MWT indices. A list of the 11 CAT and 6 MWT indices can be found in Appendix A.
Recent studies have mapped indices to a benchmark index [12,17,18]. The percentile division method in Ref. [18] is used. We choose -Ri as the benchmark index and calculate its threshold percentile (Table 1), taking the thresholds −20, −5, −2, −0.5, and 0.5. The threshold percentile of -Ri is then used to calculate the turbulence intensity threshold of the other 16 indices (Table 2).
Previous studies on CAT used the output data of numerical weather prediction models such as NCEP’s 20 km horizontal resolution model (RUC20), the earlier 40 km version (RUC40), and a 30 km horizontal resolution version of MM5 [26]. Williams et al. [18,27] investigated the clear-air turbulence in response to climate change by using the data of the GFDL-CM2.1 coupled atmosphere–ocean model, with a resolution of 2.5° longitude and 2.0° latitude. Here, the ERA5 reanalysis data on pressure levels are used, with a horizontal resolution of 0.25° × 0.25° and a temporal resolution of 1 h [28]. ERA5 is the fifth generation ECMWF reanalysis for the global climate and weather and has replaced the ERA-Interim reanalysis. It combines model data with observations from across the world into a globally complete and consistent dataset using the laws of physics. ERA5 data have high spatial and temporal resolution and reliability of data quality. The ERA5 data is assumed to accurately represent the state of the atmosphere to support this study. When calculating the threshold percentile of -Ri, we used the data for the altitude of 200 hPa from 2012 to 2021 (only August) in the airspace within 74–104° E and 25–40° N, with a temporal resolution of 3 h, and a total of 61 × 121 × 31 × 8 × 10 = 18,304,880 data points.

3. Results

3.1. Thresholds of the Turbulence Indices

Table 1 shows the threshold percentile of -Ri divided according to the above method. Table 2 shows the intensity thresholds of the other five turbulence indices, which are subdivided according to the threshold percentiles in Table 1. Figure 1 presents some turbulence indices with the threshold used in previous studies [16] (Figure 1a,b) and the redivided threshold (Figure 1c–e). The calculation of the CP index is related to the vertical grid spacing. The CP index divided by the empirical threshold shows that in the Qinghai Tibet Plateau region, the turbulence is moderate (Figure 1a). NCSU1 shows light turbulence across the whole region (Figure 1b). These results using empirical thresholds are unlikely to occur in reality. The division of the Richardson number turbulence intensity threshold is more reasonable, showing the contrast of turbulence intensity in the region (Figure 1e). Turbulence occurs in the southern Qinghai–Tibet Plateau, where there is moderate–severe turbulence in the southwest and moderate turbulence in the southeast. Figure 1c,d are the CP and NCSU1 redivided according to the threshold percentiles of -Ri. Their distribution is similar to that of Ri (Figure 1a). In Section 4, a turbulence probability index was generated by aggregating the 17 turbulence indices, and its effectiveness was confirmed through validation with turbulence events. This further supports the necessity and correctness of the threshold reclassification mentioned earlier in the section. Therefore, instead of individually evaluating the ability of each turbulence index to describe turbulence, the focus of this work was on the performance analysis of the turbulence index set by determining if turbulence events were detected.

3.2. Statistical Results

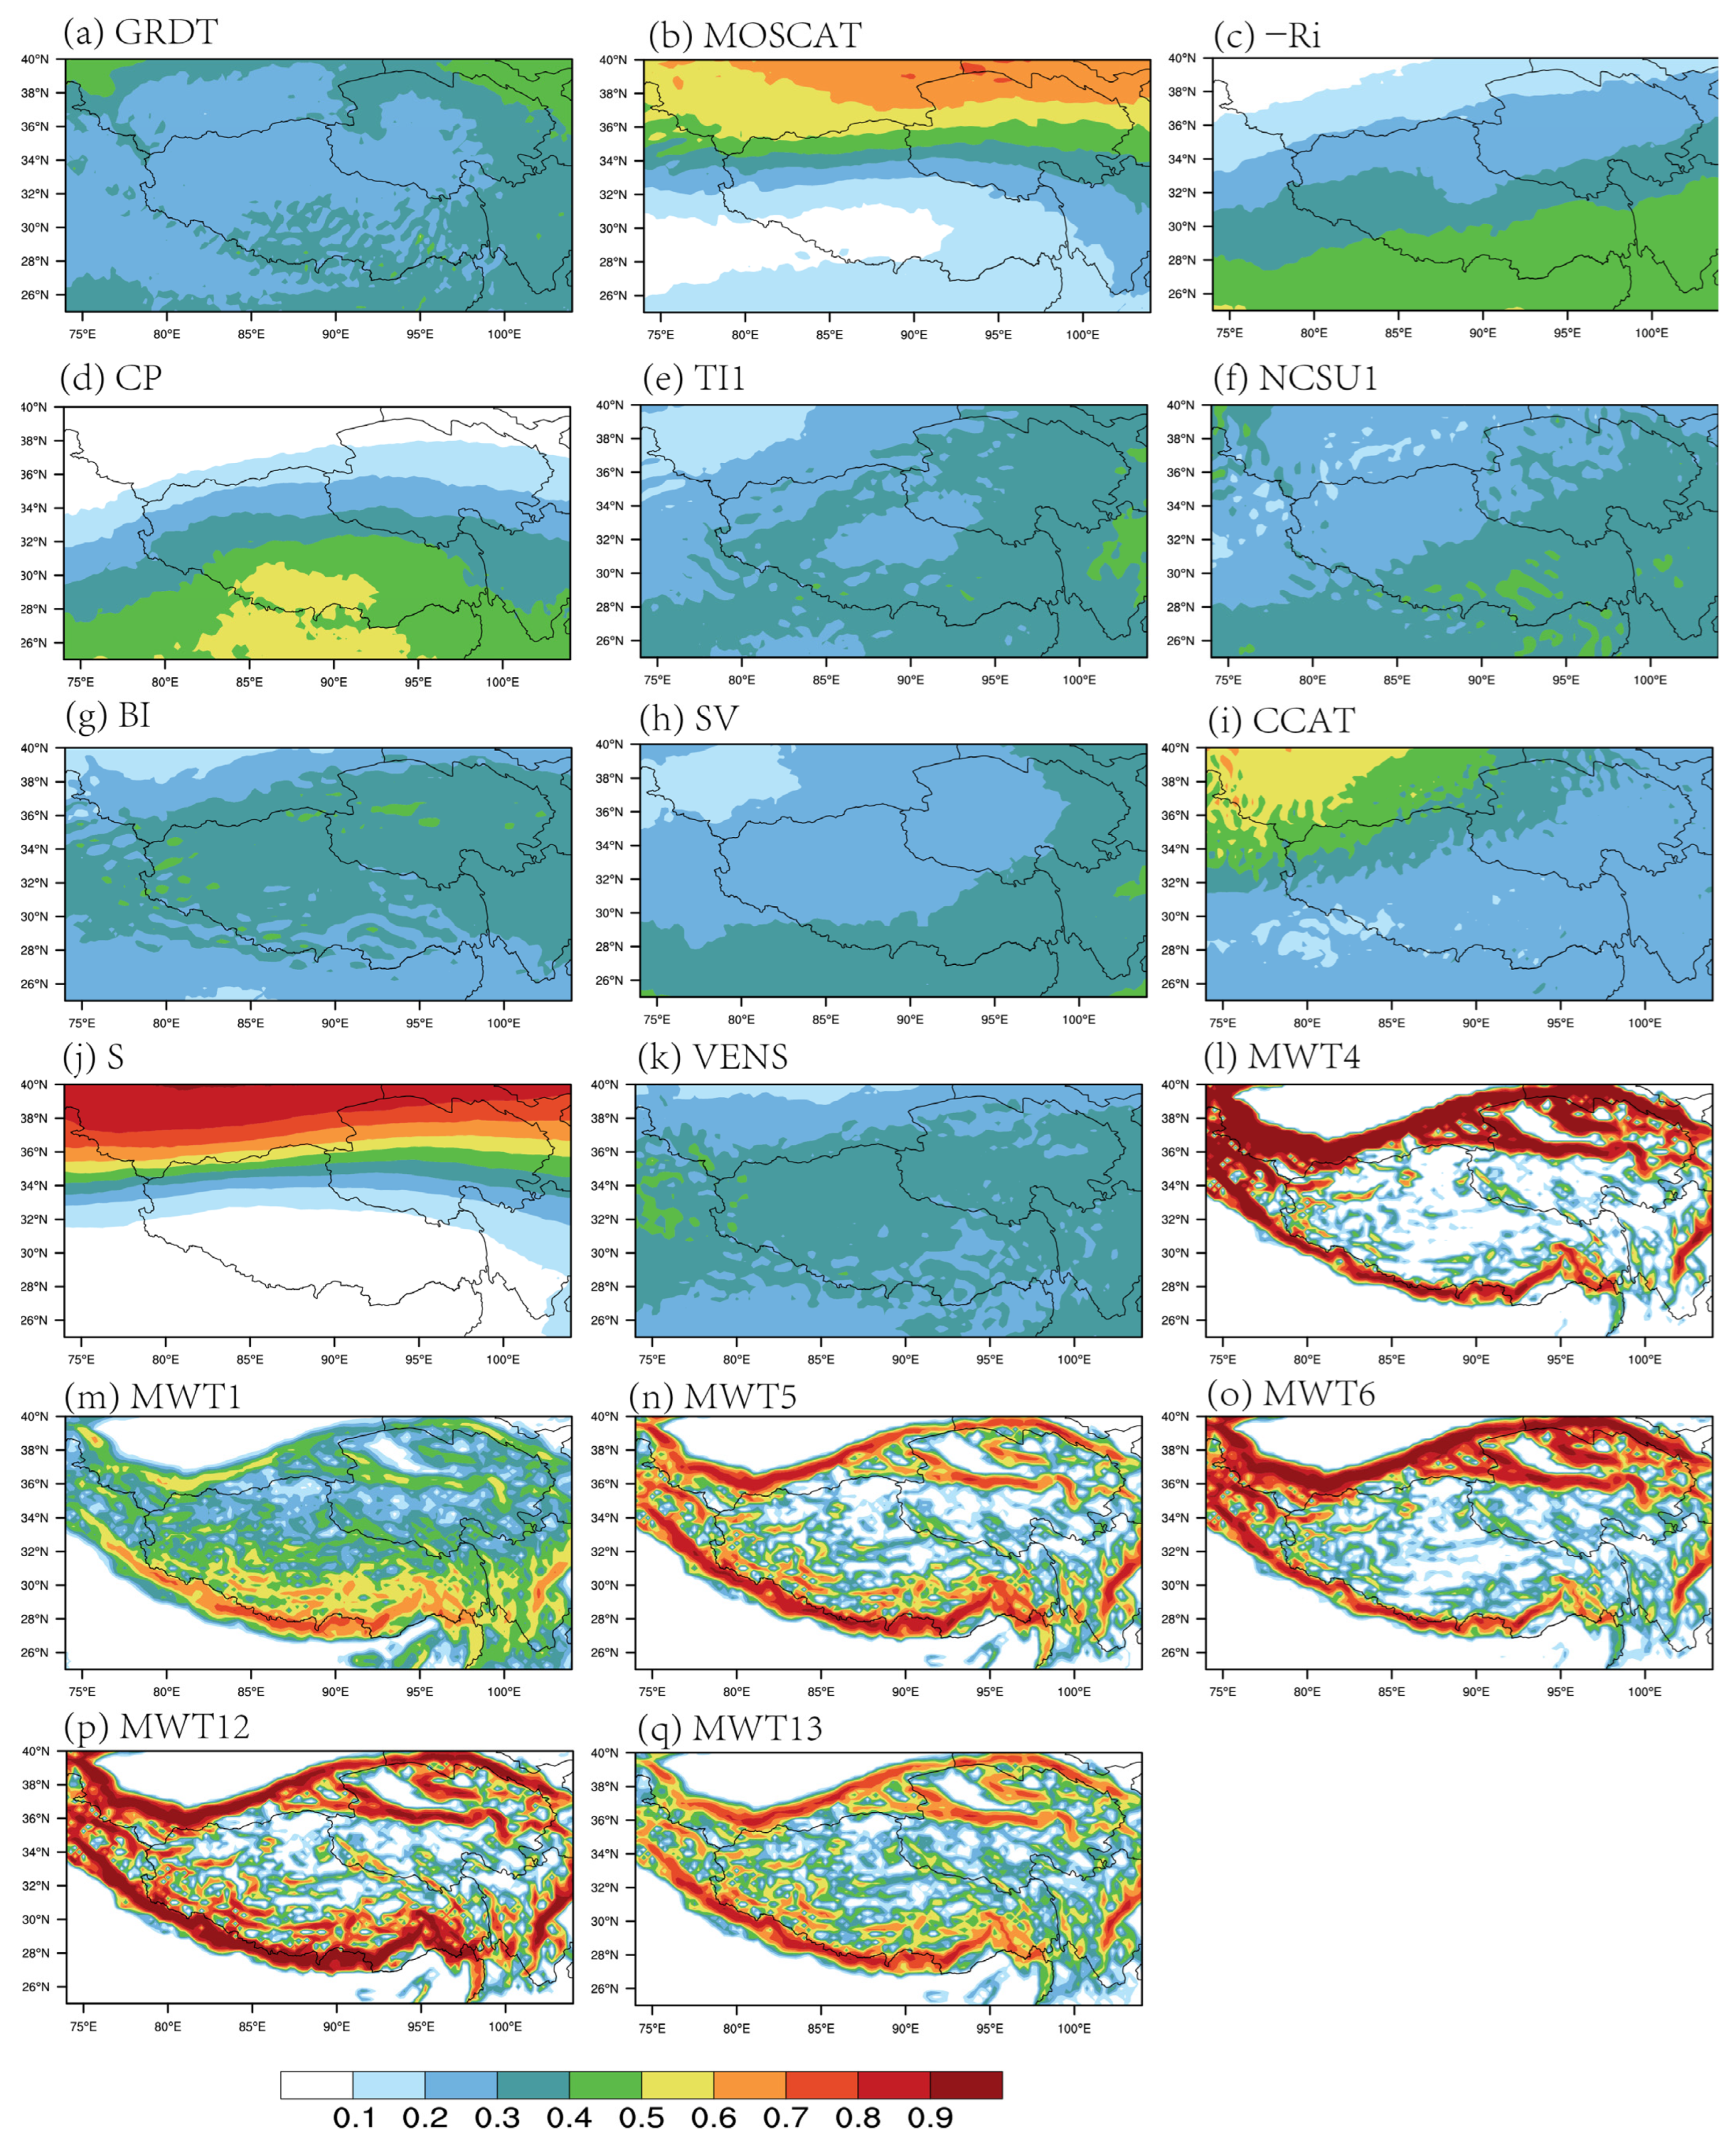
Figure 2 shows the frequency distribution of the 17 turbulence indices for light or greater (LOG) turbulence. As shown in Figure 2, different turbulence indices show different distribution patterns. GRDT indicates high-frequency turbulence areas in southwestern Xinjiang, northeastern Qinghai, and southeastern Tibet (Figure 2a). MOSCAT (Figure 2b) and S (Figure 2j) indicate high-frequency turbulence north of 34° N. In contrast to GRDT and MOSCAT, the -Ri and CP indices indicate high-frequency turbulence in the southern part of the Tibetan Plateau. As shown in Figure 2c,d, the most high-frequency region of turbulence characterized by -Ri is located in southwest Tibet, while the CP index is located on the south side. The TI1 (Figure 2e) and SV (Figure 2h) statistics show that turbulence is more frequent in Sichuan and eastern Qinghai on the eastern side of the Tibetan Plateau. The distribution of NCSU1 is similar to that of -Ri but less frequent than that of -Ri (Figure 2f). BI (Figure 2g) and VENS (Figure 2k) show a high turbulence frequency in northwestern Tibet. The high-value areas of the MWT indices (Figure 2l–q) are almost all around the edge of the Tibetan Plateau terrain, indicating that turbulence caused by the terrain is more likely to occur in these areas. MWT4 (Figure 2l), MWT5 (Figure 2n), MWT6 (Figure 2o), MWT12 (Figure 2p), and MWT13 (Figure 2q) have similar distributions, with some differences in frequency values. MWT5 (Figure 2n) and MWT13 (Figure 2q) indicate a lower turbulence frequency than MWT4 (Figure 2l), MWT6 (Figure 2o), and MWT12 (Figure 2p). Unlike the other MWT indices, MWT1 (Figure 2m) shows that the turbulence frequency is significantly higher on the south side of the Tibetan Plateau than on the north side. There are many discrepancies in the patterns of these turbulence indices, either because the intrinsic physical processes are different or because some indices are insufficient to accurately characterize the turbulence distribution in the Tibetan Plateau region. This indicates that using a single index to describe the turbulence distribution results in inaccuracy. Therefore, the aggregation of multiple turbulence indices is considered to reduce this uncertainty.

4. Turbulence Probability Index

The aggregation methods for turbulence indices have been mentioned in many studies [11,12,13,16]. In general, the indices are normalized and given different weights according to the turbulence forecast accuracy, and then a deterministic forecast for the turbulence intensity is made. Kim et al. [17] employed a multidiagnostic approach to account for potential uncertainties in their first attempt at producing probabilistic forecasts of turbulence. They developed an ensemble of turbulence diagnostics that provided a percentage agreement on the likelihood of exceeding a specific EDR threshold. In Section 3.1, we did not normalize or map the turbulence indices to EDR but instead calculated the threshold values for each turbulence index. Considering this approach, utilizing a probabilistic method for ensembles would be more practical. Therefore, referring to Kim’s approach [17], a turbulence probability index was defined by aggregating the 17 turbulence indices in this study.
The probability index (PI) of a turbulence event with a certain intensity at a given grid point is defined as follows:
PI = i = 1 n s i / n
where n is the number of turbulence indices and s i is recorded as 1 when the turbulence index “ i ” hits a certain intensity of turbulence and otherwise is recorded as 0. A higher probability index means that turbulence with a threshold intensity will more likely occur.
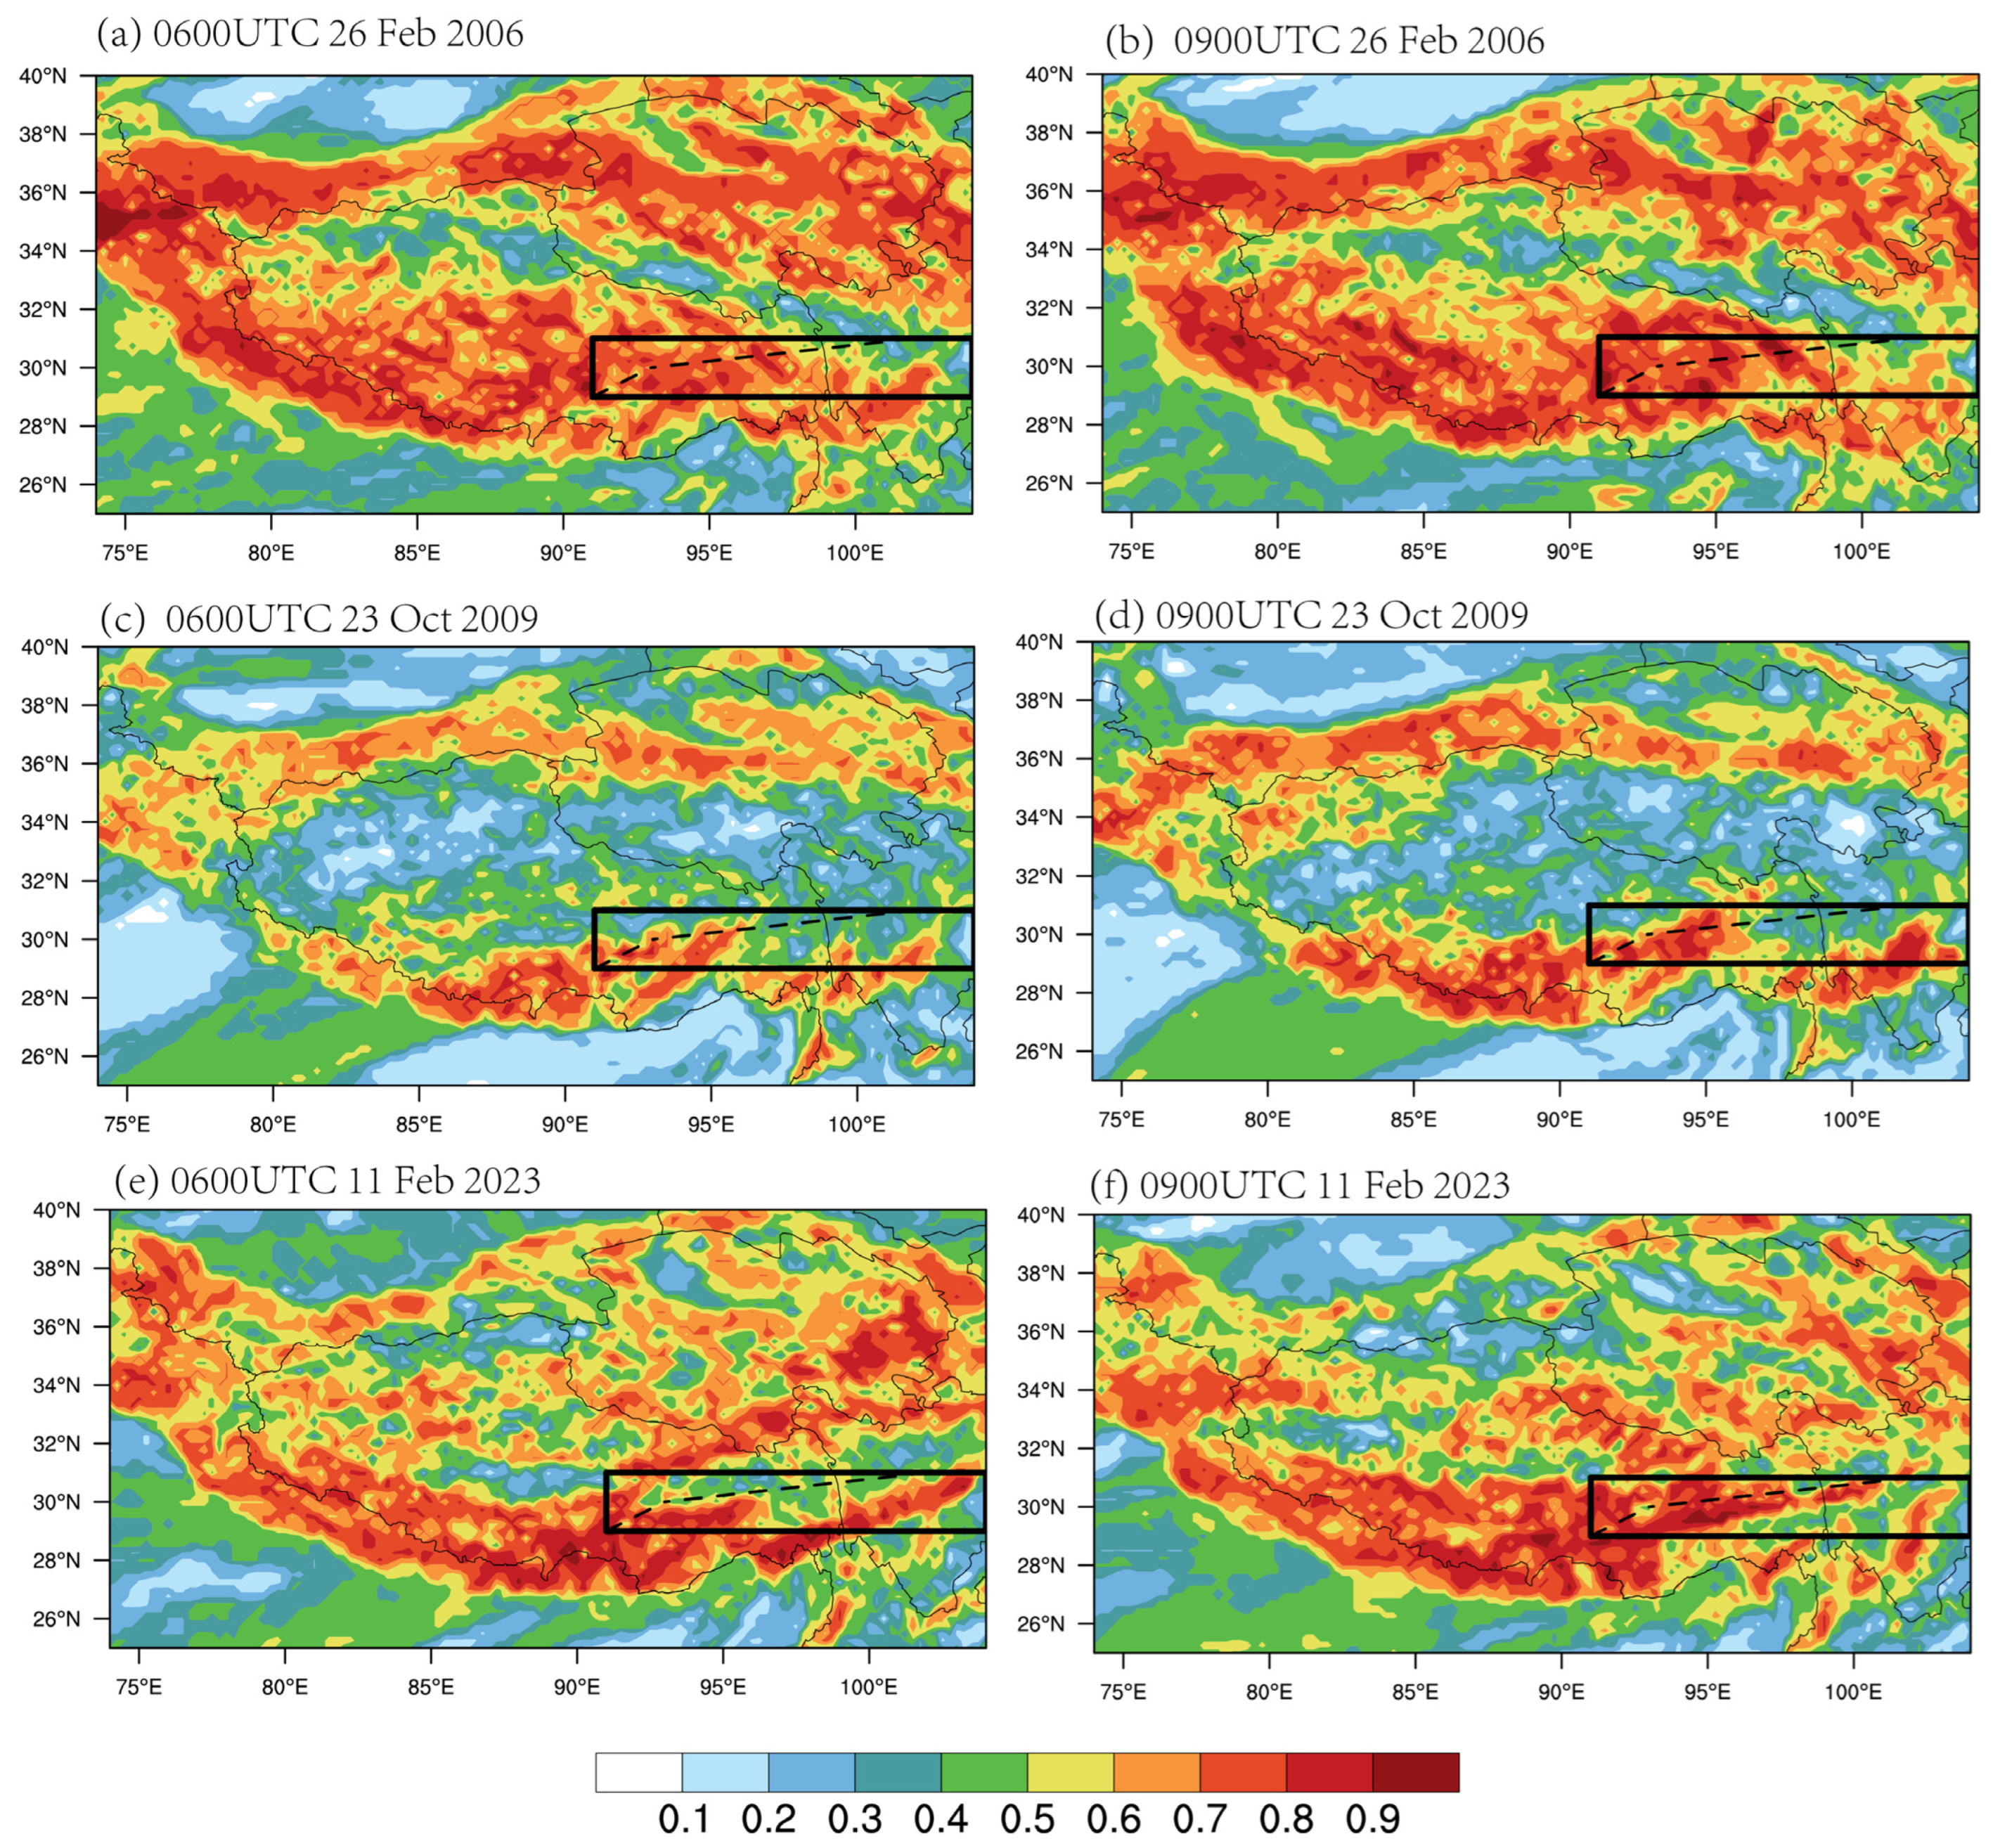
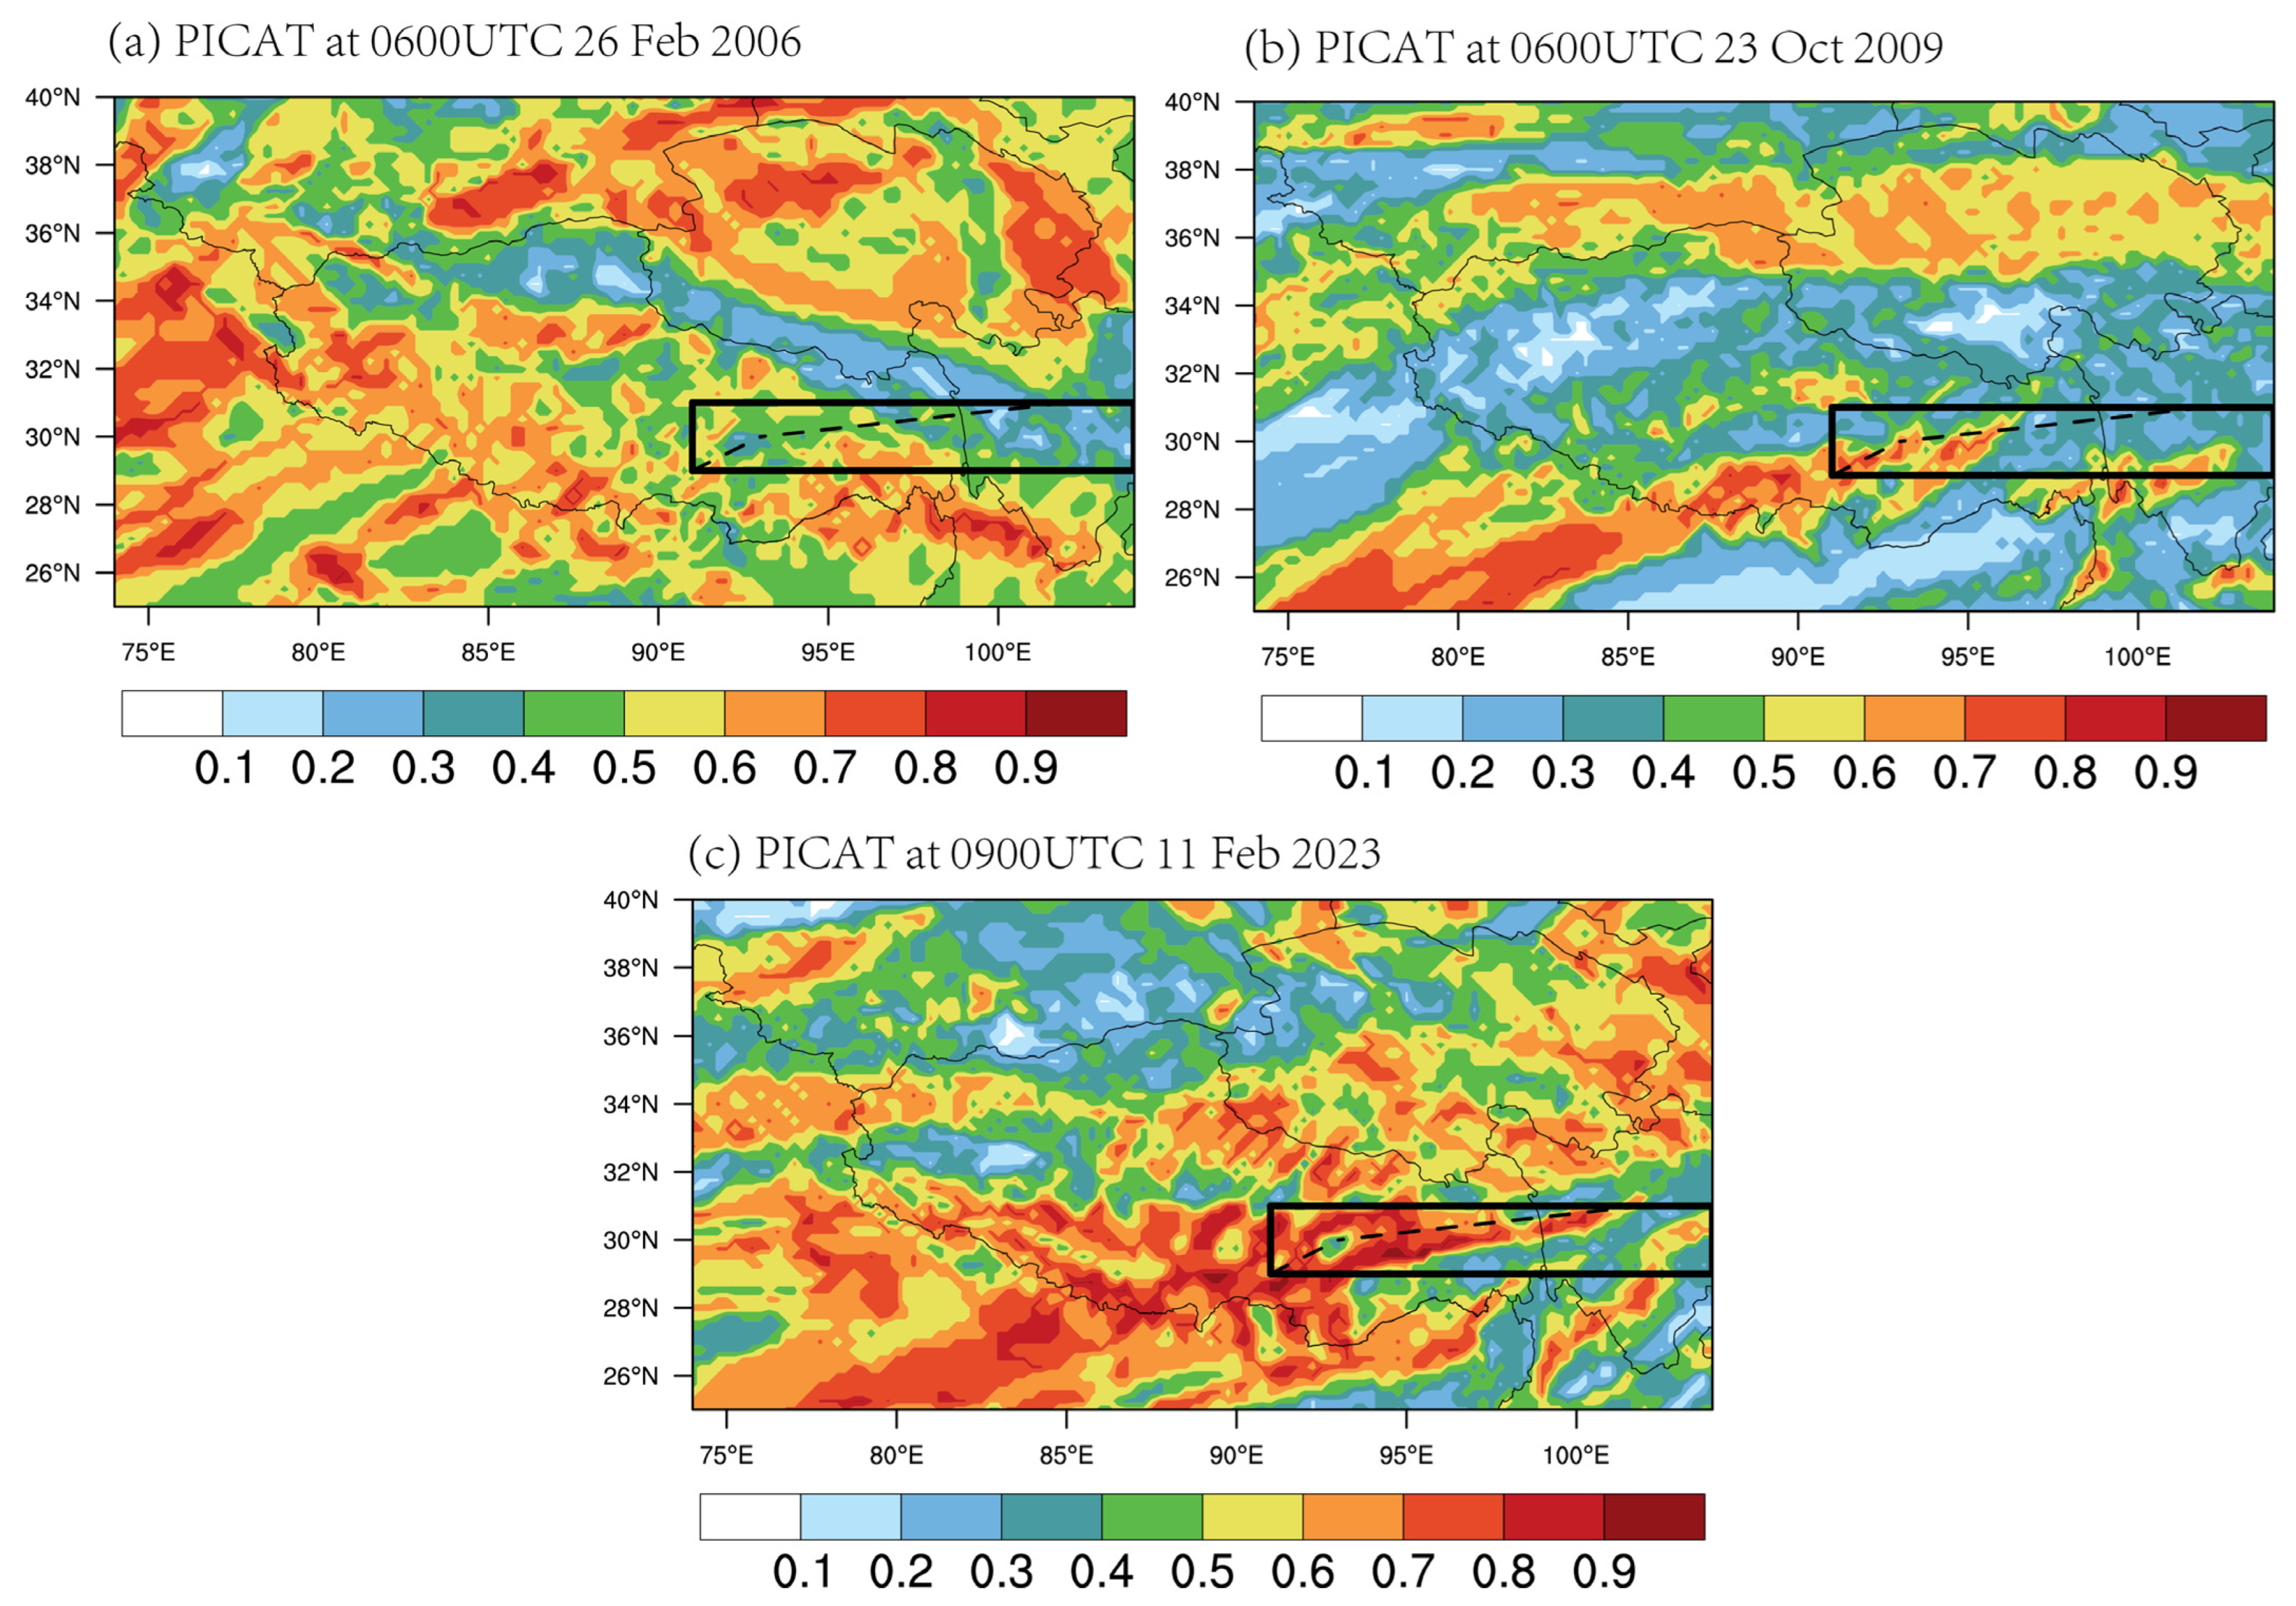
Previous studies evaluated the forecasting capabilities of turbulence diagnostics for turbulence events based on observations, such as PIREPs (pilot reports) [12,16,17,29,30]. Unfortunately, for this study, we were unable to obtain observational data due to a lack of co-operation with the civil aviation department. As an alternative, we selected three turbulence events that occurred on the Chengdu–Lhasa route on 26 February 2006, 23 October 2009 [22], and 11 February 2023 (https://www.dimsumdaily.hk/china-west-air-flight-heading-towards-chongqing-plummets-suddenly-during-turbulence-many-passengers-scream-incessantly/, accessed on 5 March 2023), between 0600–0800 UTC for analysis. The Chengdu–Lhasa route is a plateau route located between 91–104° E and 29–31° N, with a total length of 1250 km. The black box in Figure 3 represents the range of the route, and the black dashed line represents the route itself. We compared the timing, location, and probability index (PI) calculation results of three turbulence events on the Chengdu–Lhasa route. Figure 3 shows the PI distribution calculated using 17 turbulence indices during these three turbulence events. Since we do not have observational data to support the correction algorithm for the turbulence intensity description, it is difficult to verify the correctness of the turbulence intensity description. Therefore, we focused on whether the PI could reflect the turbulence events and used light or greater PI values. During these periods, the turbulence index on the route reached above 0.8, indicating a high probability of turbulence occurrence (Figure 3a–f). This to some extent demonstrates the validity of the turbulence index used in this paper to represent turbulence. Furthermore, we removed the MWT indices and only used 11 CAT indices to calculate the turbulence probability index (PICAT). Figure 4 shows the PICAT results of the three turbulence events. We found that using only the CAT index is not sufficient to accurately capture turbulence events. The PICAT result of the 2023 event is similar to the PI result (Figure 3f and Figure 4c). However, for the 2006 event, the PICAT on the route is only approximately 0.4 (Figure 4a), and the high-value zone of PICAT is not within the range of the route. For the 2009 event, the PICAT on the route reached above 0.7 (Figure 4b) but was still slightly smaller than the PI result (Figure 3c). This also indicates that turbulence related to mountain waves cannot be ignored in the Tibetan Plateau region.
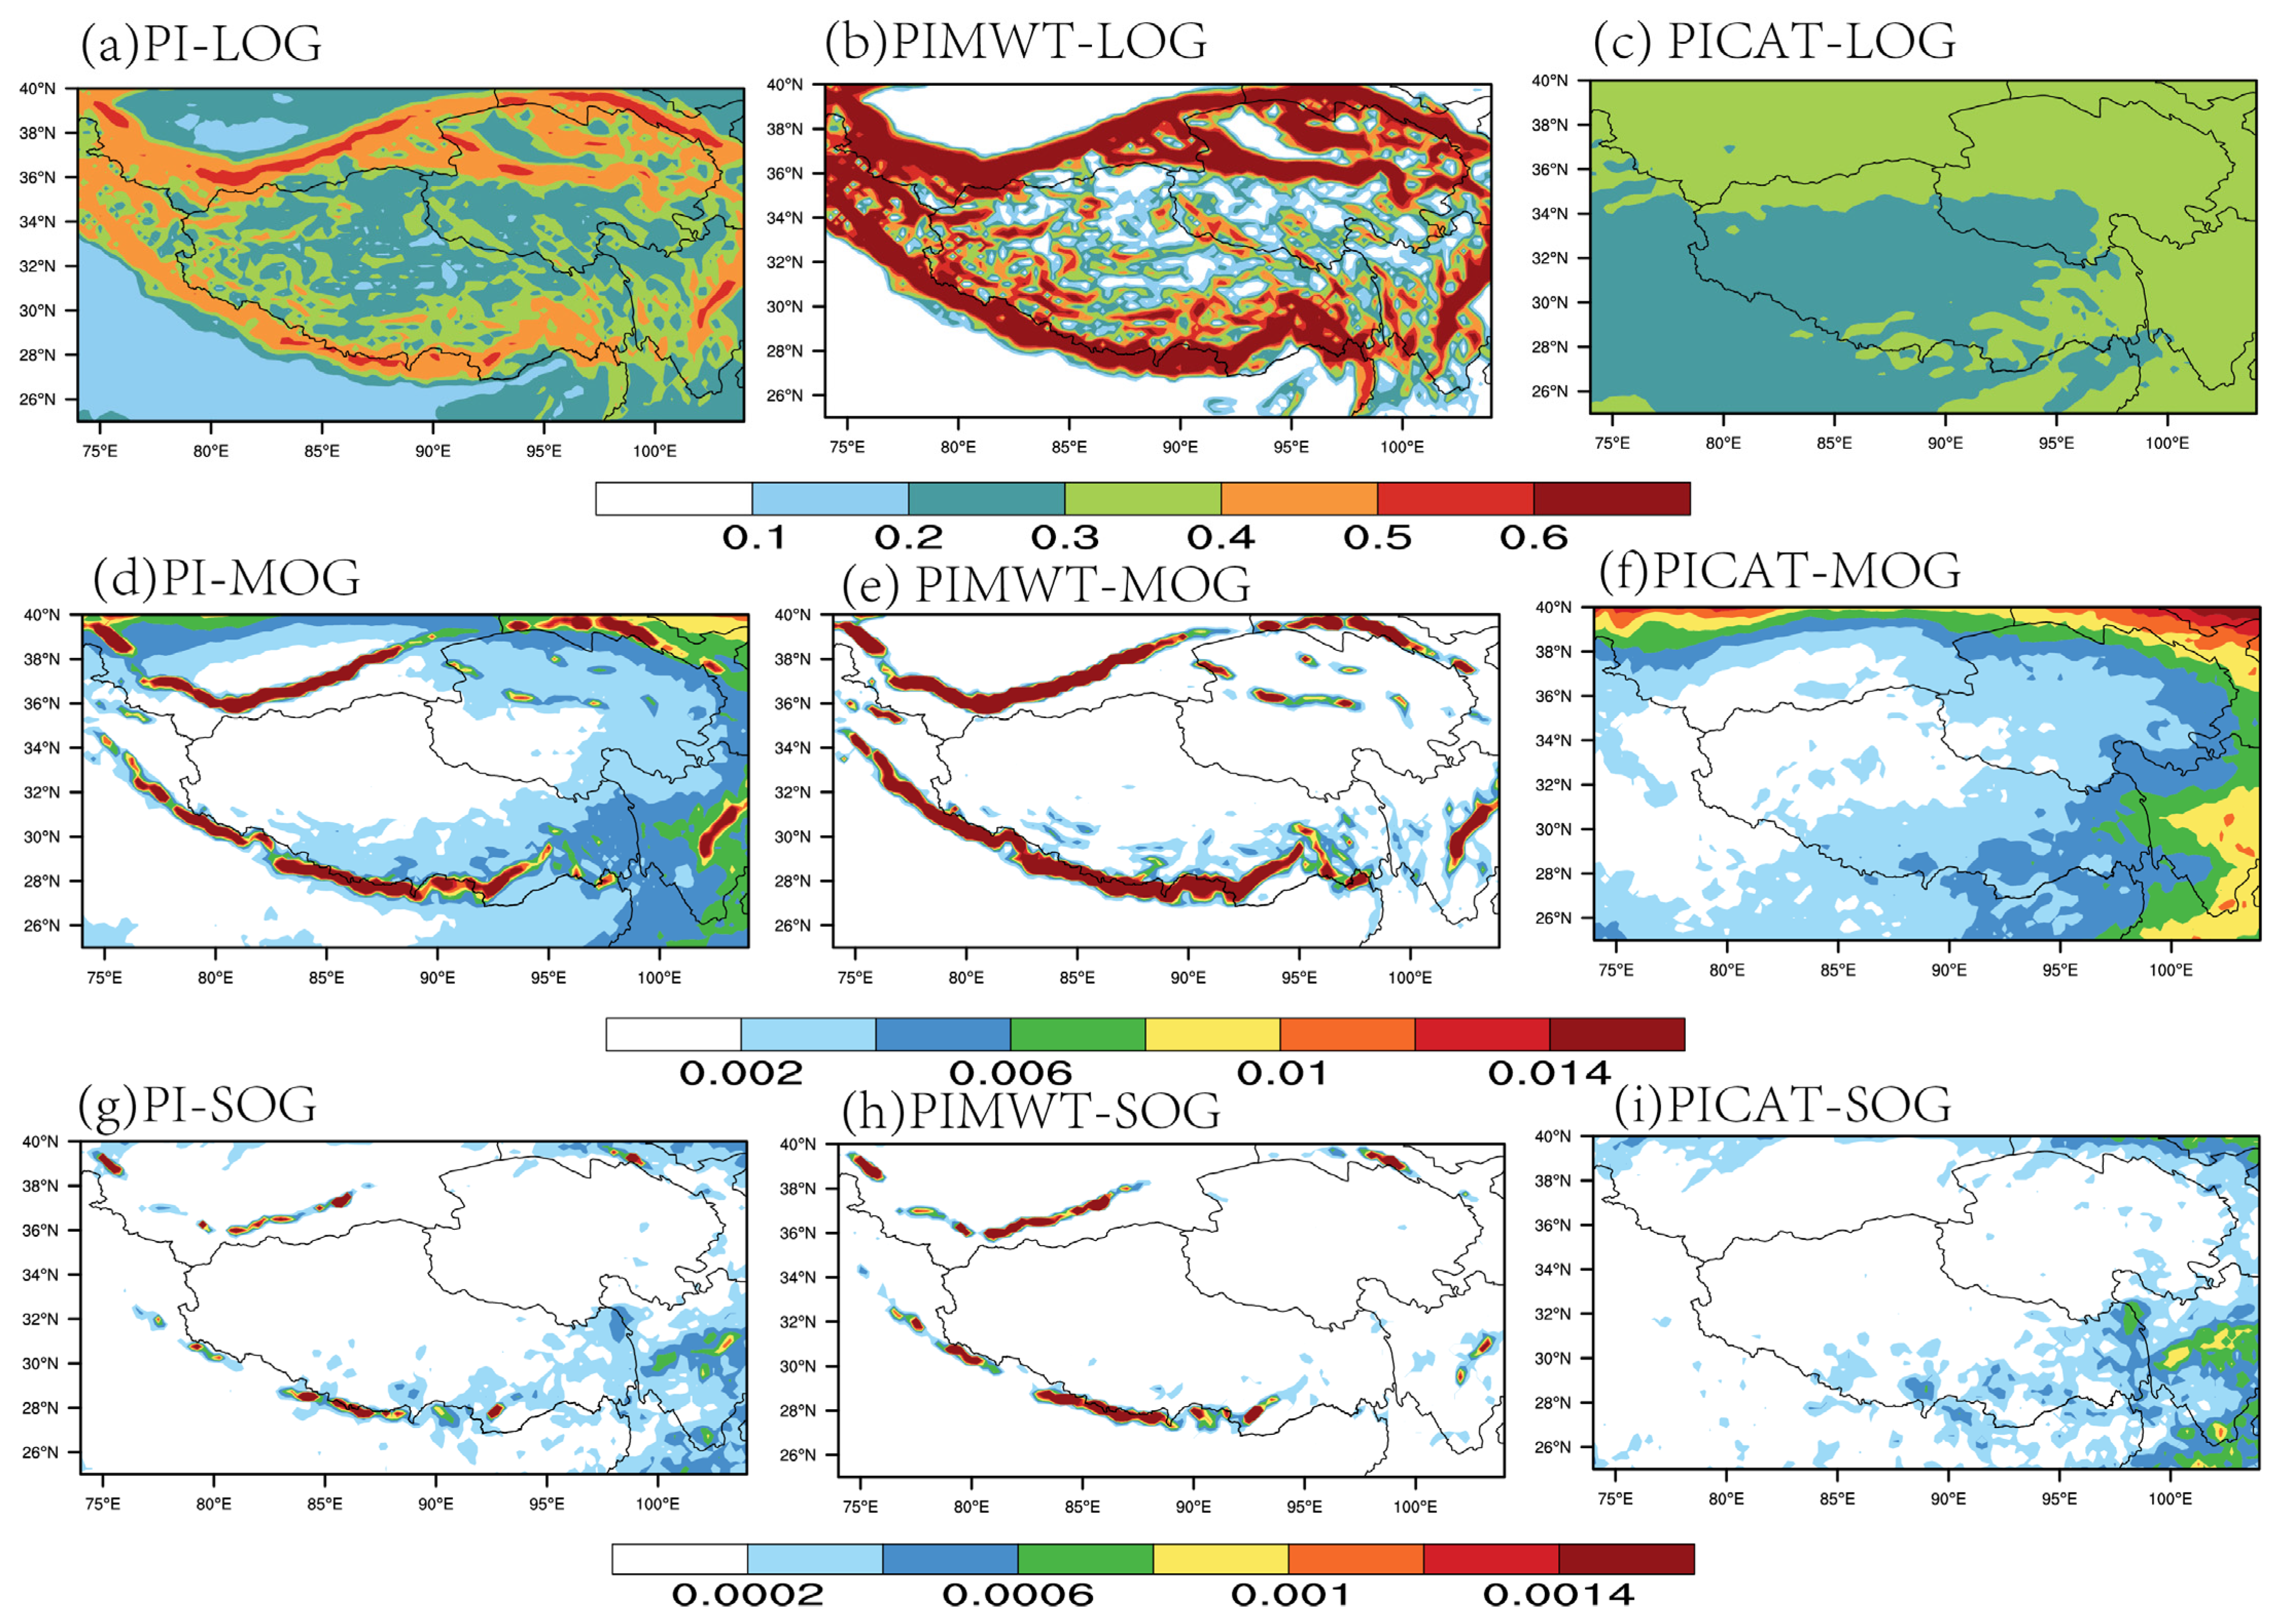
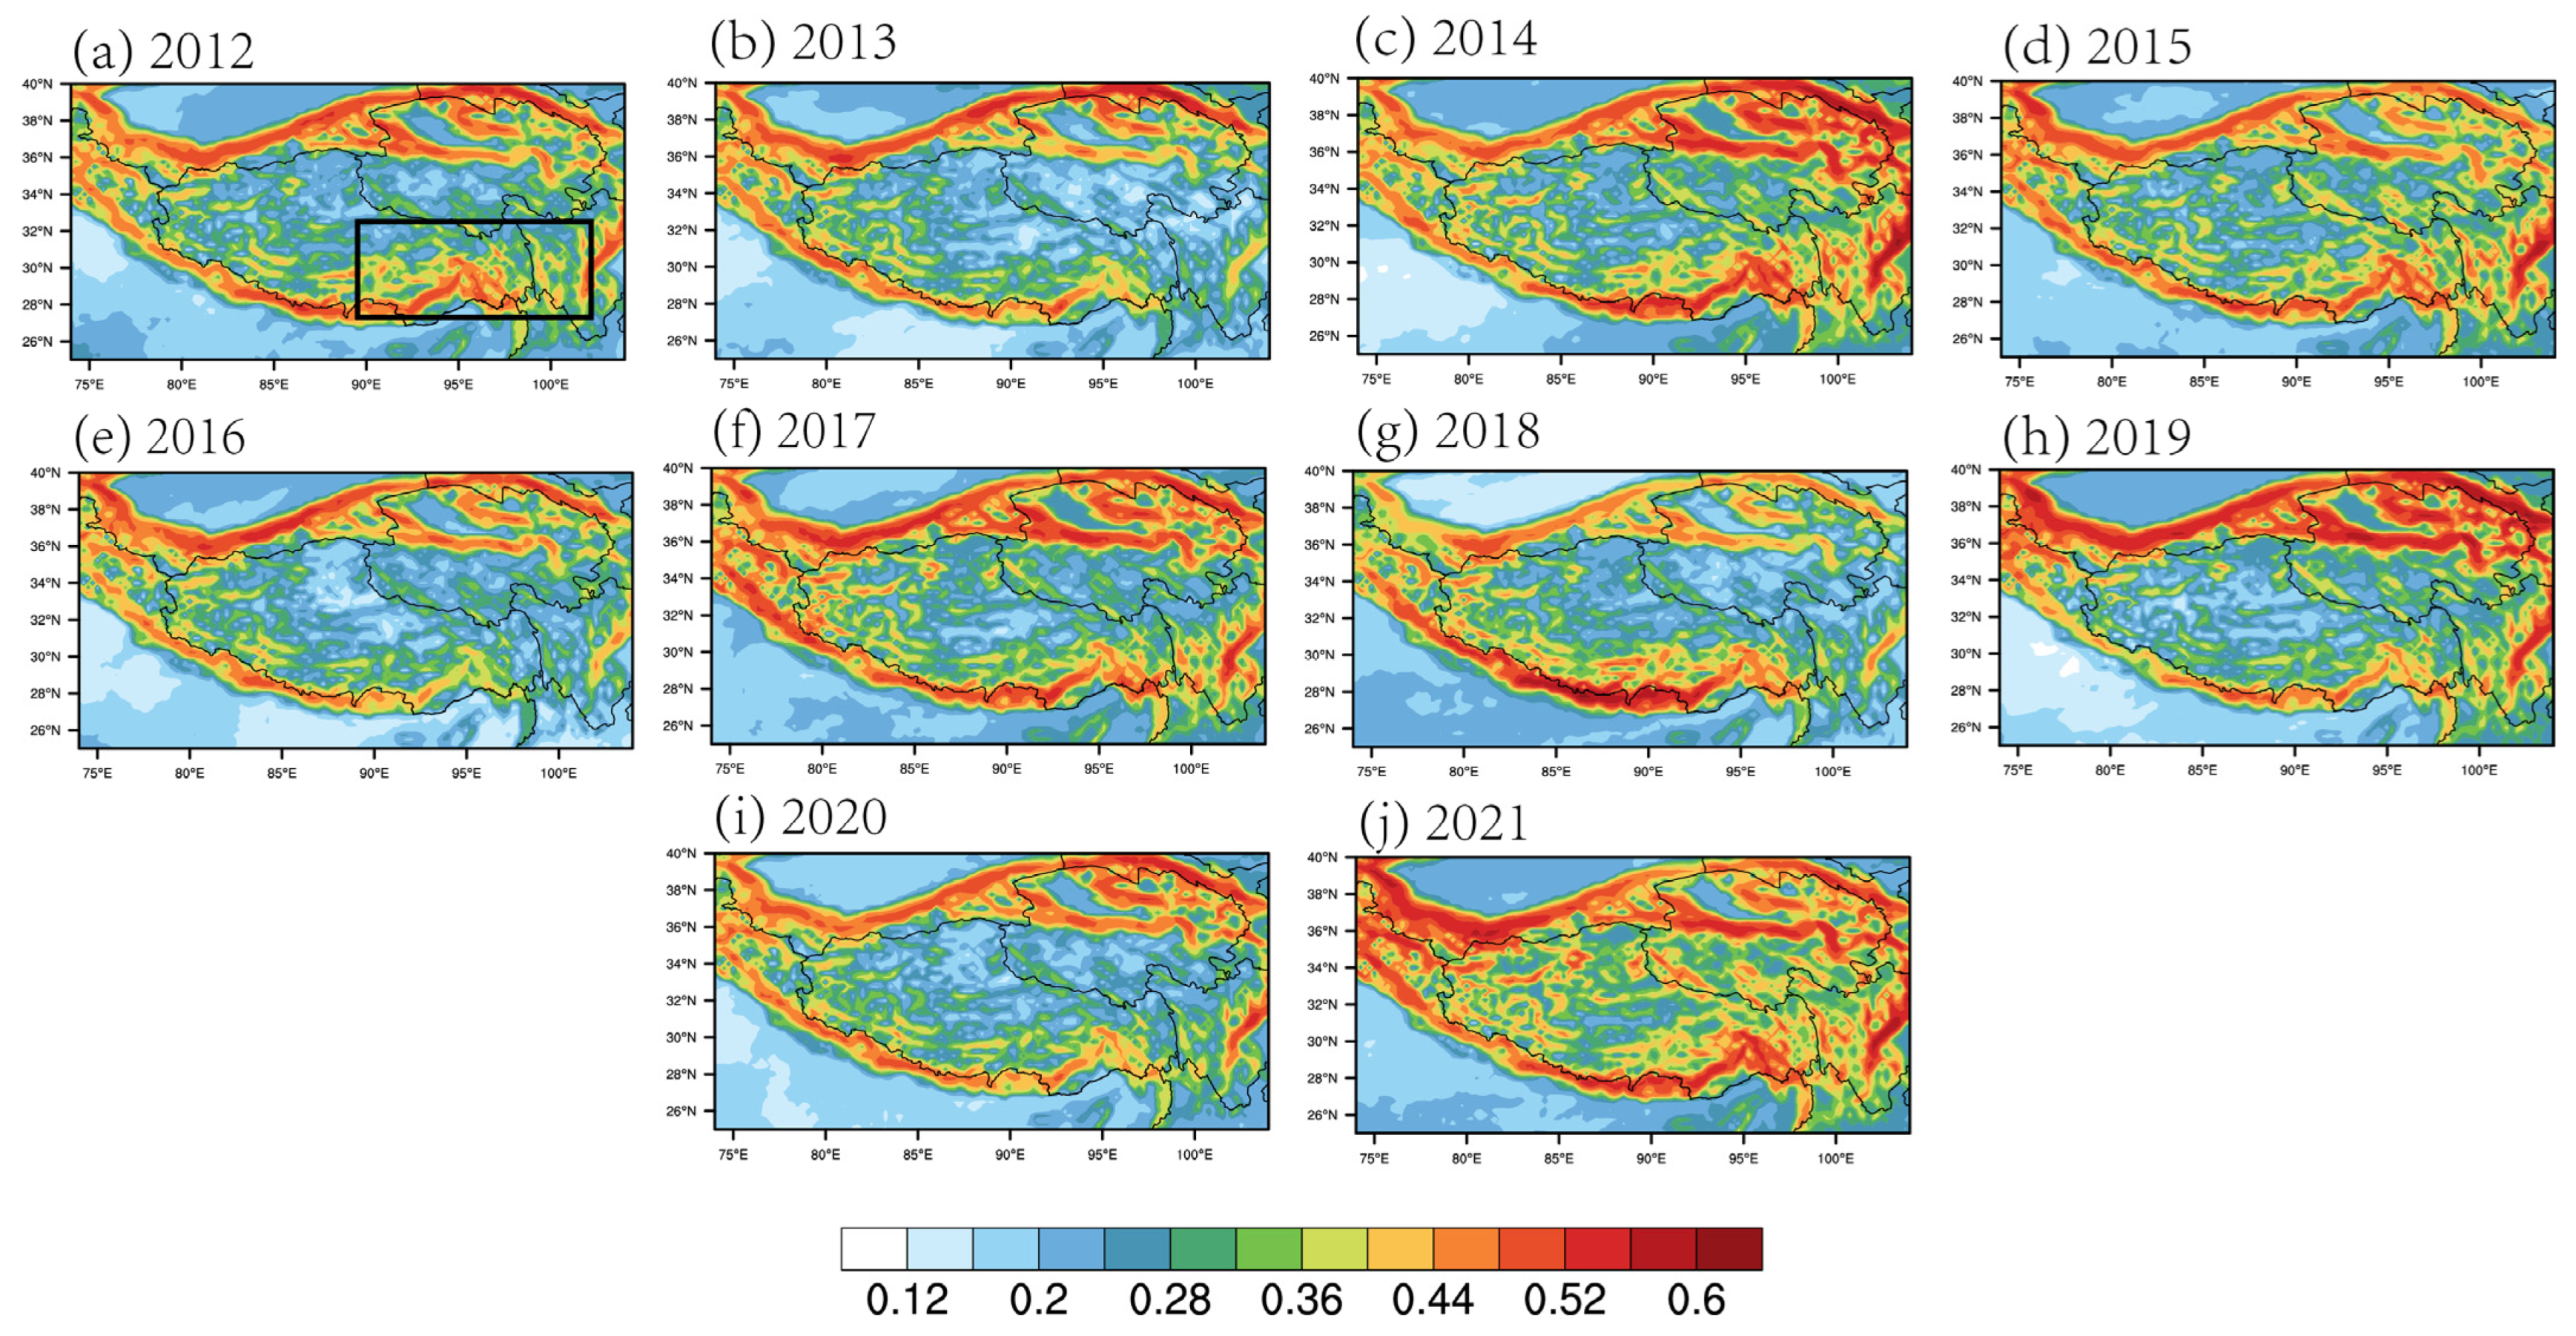
Figure 5 displays the PI, PICAT, and PIMWT (probability index based on six MWT diagnostics) averaged over 2480 instances from August 2012 to 2021. Figure 5a indicates that the edges of the Tibetan Plateau, including southern and northern Tibet, western Sichuan, and east–central Qinghai, are regions of high turbulence probability. Western Sichuan, southern Tibet, and the northern slope of the Tibetan Plateau between 36–40° N are likely to experience moderate or greater (MOG) turbulence (Figure 5d). Severe or greater (SOG) turbulence is more likely to occur on the western edge of the Tibetan Plateau and in north–central Sichuan (Figure 5g). Despite being directly linked to aircraft turbulence, statistics that specifically address turbulence at high altitudes in China are limited. According to a statistic released by the Chinese civil aviation authorities [31], bumps at high altitudes (>7500 m) are most frequently reported in the Gansu and Ningxia regions, Chongqing and Chengdu regions, and the Lhasa region. Xu et al. [21] studied the temporal and spatial characteristics of aircraft turbulence from 2011 to 2015 and found that turbulence in eastern Tibet and northern Sichuan had a greater likelihood of occurrence. The PI in Figure 5 (left column) indicates a high probability of turbulence in the Lhasa area (91.1° E, 29.6° N), which is consistent with the findings of previous studies. Fang [32] conducted a statistical analysis of turbulence on high-altitude flight routes in China in 2014 based on airborne detection data and analyzed the causes of turbulence. The results showed that the Lhasa route was the most severely affected, with a turbulence frequency as high as 78%. This route was most affected by turbulence induced by jet streams, with a frequency of 42.82%, as well as by turbulence from mountain waves. Our results from Figure 5 show that the Lhasa route (black box in Figure 4) is located at the intersection of the high probability areas for CAT and MWT (middle and right columns in Figure 5), which is consistent with Fang’s conclusion.
The characteristics of the turbulence probability index have been analyzed above. Figure 6 shows the average PI in August from 2012 to 2021 at 200 hPa. The Tibetan Plateau region has interannual variability in the upper-level turbulence spatial distribution. Due to the persistent impact of mountain waves, turbulence is always prone to occur around the edges of the Tibetan Plateau. In some years, there are significant differences in the turbulence probability between the northern and southern edges, such as in 2016 and 2019 when the probability was higher in the north, and in 2018 when it was higher in the south. Certain regions within the Tibetan Plateau, including the eastern part of Tibet, and the central–western part of Sichuan Province (black box in Figure 6) show interannual variations in the turbulence probability index. The high PI (such as 0.44) in this region was highest in 2012, 2014, 2015, 2017, and 2021, but less in other years such as in 2013, 2016, 2019, and 2020.

5. Conclusions

In this study, 17 turbulence indices for nonconvective turbulence at 200 hPa over the Tibetan Plateau from 2012 to August 2021 were calculated by using ERA5 reanalysis data. These turbulence indices with different intensities were reclassified based on the percentile threshold of -Ri. Compared with some empirical turbulence index thresholds, the new threshold delineation is more reasonable. It also suggests that the thresholds for turbulence intensity should be adjusted according to regions and altitude.
Due to indicating the different physical processes, these turbulence indices show inconsistency with each other in their depiction of areas with a high turbulence occurrence. This means that the statistical results of a single index are inferior. Drawing on the principles of ensemble and probabilistic forecasting, a turbulence probability index is defined, which aggregates the various turbulence indices. The statistical results show that the edges of the Tibetan Plateau, including southern and northern Tibet and parts of Qinghai, Gansu, and Sichuan, are turbulence-prone areas. The validity of the turbulence probability index is preliminarily confirmed by comparing them with three turbulence events. Our results indicate that the impact of the complex terrain of the Tibetan Plateau cannot be ignored, and the inclusion of the MWT indices is necessary. Furthermore, the interannual variation analysis reveals that the probability and distribution of turbulence occurrence vary from year to year, especially in eastern Tibet and central–western Sichuan.
In previous studies, the normalization method has been chosen to map the turbulence indices onto EDR [12,18,26]. In this study, the percentile method is used to map the turbulence indices onto -Ri, taking advantage of the simplicity and accuracy of the calculation. This study is a preliminary attempt to diagnose turbulence over the Tibetan Plateau using the probabilistic method. We further aim to apply this algorithm to model data and improve turbulence forecasting in this area. Statistical verification could be more precise if there were more observational data, such as PIREPs, and, thus, future collaboration with the civil aviation department will be necessary. An evaluation of the types of turbulence resources needs to be performed in future work. Furthermore, due to the limited availability of CIT indices, future research should expand the number of CIT indices and validate their effectiveness in probabilistic diagnostic methods.

Author Contributions

Methodology, investigation, writing-original draft, visualization and writing-review & editing, D.S.; methodology, writing-review & editing, and funding acquisition, L.R. and L.T.; software and resources, K.Z. and J.T. All authors have read and agreed to the published version of the manuscript.

Funding

This research was supported by the Strategic Priority Research Program of the Chinese Academy of Sciences (Grant XDA17010105), the Key Research and Development Program of Hebei Province (Grant 22375404D) and the National Natural Science Foundation of China (Grant U2233218, 42275010).

Institutional Review Board Statement

Not applicable.

Informed Consent Statement

Not applicable.

Data Availability Statement

Not applicable.

Conflicts of Interest

The authors declare no conflict of interest.

Appendix A

Here, we list the 11 CAT and 6 MWT indices used in PI in this work. See Refs. [12,16] for a more complete description.
11 CAT indices
(1)
-Ri: Negative Richardson number (Ref. [16])
(2)
CP (m2 s−2): Colson–Panofsky TKE (Ref. [7])
(3)
GRDT (K m−1): Horizontal temperature gradient (Ref. [16])
(4)
MOSCAT (m s−2): Wind speed × |deformation|(Ref. [11])
(5)
TI1 (s−2): Ellrod1 index (Ref. [8])
(6)
NCSU1 (s−3), Advection × |vorticity gradient|/Ri* (Ref. [10])
(7)
VENS (s−2) |Vertical vorticity|2
(8)
CCAT (s−2), Clark’s CAT (Ref. [33])
(9)
S (m s−1), Wind speed (Ref. [34])
(10)
SV (s−1), Vertical shear of horizontal wind (Ref. [34])
(11)
BI (s−1), Simplified DRi/Dt (Ref. [35])
6 MWT indices. See Ref. [12] for details of the MWT indices. Note that, to isolate regions related to the MWT and to represent topographic forcing, the mws used here = gridpoint height (m) × horizontal gradient of the height (m km–1) referring to Ref. [17] This is different from the diagnostic including low-level wind speed and terrain height, which is called ds in Ref. [12].
(1)
MWT1 (m3 s–2): mws × Vertical velocity (w) squared/Ri
(2)
MWT4 (m2 s–1): mws × horizontal wind speed
(3)
MWT5 (m s–1): mws × |DIV|
(4)
MWT6 (m2 s–2): mws × MOSCAT
(5)
MWT12 (K): mws × |GRADT|
(6)
MWT13 (m s–2): mws × |Total deformation|2

References

  1. Storer, L.N.; Williams, P.D.; Gill, P.G. Aviation Turbulence: Dynamics, Forecasting, and Response to Climate Change. Pure Appl. Geophys. 2019, 176, 2081–2095. [Google Scholar] [CrossRef] [Green Version]
  2. Knox, J.A.; McCann, D.W.; Williams, P.D. Application of the Lighthill–Ford Theory of Spontaneous Imbalance to Clear-Air Turbulence Forecasting. J. Atmos. Sci. 2008, 65, 3292–3304. [Google Scholar] [CrossRef] [Green Version]
  3. Trier, S.B.; Sharman, R.D.; Lane, T.P. Influences of Moist Convection on a Cold-Season Outbreak of Clear-Air Turbulence (CAT). Mon. Weather Rev. 2012, 140, 2477–2496. [Google Scholar] [CrossRef]
  4. Trier, S.B.; Sharman, R.D. Convection-Permitting Simulations of the Environment Supporting Widespread Turbulence within the Upper-Level Outflow of a Mesoscale Convective System. Mon. Weather Rev. 2009, 137, 1972–1990. [Google Scholar] [CrossRef] [Green Version]
  5. Lane, T.P.; Sharman, R.D.; Trier, S.B.; Fovell, R.G.; Williams, J.K. Recent Advances in the Understanding of Near-Cloud Turbulence. Bull. Am. Meteorol. Soc. 2012, 93, 499–515. [Google Scholar] [CrossRef] [Green Version]
  6. Kim, J.H.; Chun, H.Y. Statistics and Possible Sources of Aviation Turbulence over South Korea. J. Appl. Meteorol. Climatol. 2011, 50, 311–324. [Google Scholar] [CrossRef]
  7. Colson, D.; Panofsky, H.A. An Index of Clear Air Turbulence. Q. J. R. Meteorol. Soc. 1965, 91, 507–513. [Google Scholar] [CrossRef]
  8. Ellrod, G.P.; Knapp, D.I. An Objective Clear-Air Turbulence Forecasting Technique: Verification and Operational Use. Weather Forecast. 1992, 7, 150–165. [Google Scholar] [CrossRef]
  9. Convection, B. Buoyant Convection in Geophysical Flows; Springer: Berlin/Heidelberg, Germany, 1998; ISBN 9789401061254. [Google Scholar]
  10. Kaplan, M.L.; Charney, J.J.; Waight, K.T.; Lux, K.M.; Cetola, J.D.; Huffman, A.W.; Riordan, A.J.; Slusser, S.D.; Kiefer, M.T.; Suffern, P.S.; et al. Characterizing the Severe Turbulence Environments Associated with Commercial Aviation Accidents. A Real-Time Turbulence Model (RTTM) Designed for the Operational Prediction of Hazardous Aviation Turbulence Environments. Meteorol. Atmos. Phys. 2006, 94, 235–270. [Google Scholar] [CrossRef] [Green Version]
  11. Reap, R.M.; SOC, A.M. Probability Forecasts of Clear-Air-Turbulence for the Contiguous US. In Proceedings of the 13th Conference on Probability and Statistics in the Atmospheric Sciences, San Francisco, CA, USA, 21–23 February 1996; pp. 66–71. [Google Scholar]
  12. Sharman, R.D.; Pearson, J.M. Prediction of Energy Dissipation Rates for Aviation Turbulence. Part I: Forecasting Nonconvective Turbulence. J. Appl. Meteorol. Climatol. 2017, 56, 317–337. [Google Scholar] [CrossRef]
  13. Kim, S.H.; Chun, H.Y.; Sharman, R.D.; Trier, S.B. Development of Near-Cloud Turbulence Diagnostics Based on a Convective Gravity Wave Drag Parameterization. J. Appl. Meteorol. Climatol. 2019, 58, 1725–1750. [Google Scholar] [CrossRef]
  14. Kim, S.-H.; Chun, H.-Y.; Lee, D.-B.; Kim, J.-H.; Sharman, R.D. Improving Numerical Weather Prediction-Based Near-Cloud Aviation Turbulence Forecasts by Diagnosing Convective Gravity Wave Breaking. Weather Forecast. 2021, 36, 1735–1757. [Google Scholar] [CrossRef]
  15. Bowler, N.E. Accounting for the Effect of Observation Errors on Verification of MOGREPS. Meteorol. Appl. 2008, 15, 199–205. [Google Scholar] [CrossRef]
  16. Sharman, R.; Tebaldi, C.; Wiener, G.; Wolff, J. An Integrated Approach to Mid- and Upper-Level Turbulence Forecasting. Weather Forecast. 2006, 21, 268–287. [Google Scholar] [CrossRef]
  17. Kim, J.-H.; Sharman, R.; Strahan, M.; Scheck, J.W.; Bartholomew, C.; Cheung, J.C.H.; Buchanan, P.; Gait, N. Improvements in Nonconvective Aviation Turbulence Prediction for the World Area Forecast System. Bull. Am. Meteorol. Soc. 2018, 99, 2295–2311. [Google Scholar] [CrossRef] [Green Version]
  18. Williams, P.D. Increased Light, Moderate, and Severe Clear-Air Turbulence in Response to Climate Change. Adv. Atmos. Sci. 2017, 34, 576–586. [Google Scholar] [CrossRef] [Green Version]
  19. Liu, X.; Chen, B. Climatic Warming in the Tibetan Plateau during Recent Decades. Int. J. Climatol. 2000, 20, 1729–1742. [Google Scholar] [CrossRef]
  20. Zhang, K.; Wu, Y.; Wang, F.; Li, X.; Cui, S.; Zhang, Z.; Wu, X.; Weng, N.; Luo, T.; Huang, Y. Characteristics of the Vertical Structure of the Atmospheric Turbulence in the Tibetan Plateau. Science. Sci. China Earth Sci. 2022, 65, 1368–1378. (In Chinese) [Google Scholar] [CrossRef]
  21. Xu, J.; Wang, D.; Gong, Y.; Duan, Y. Quantitative Diagnostic and Distribution Characteristics of Aircraft Turbulence in China. J. Chengdu Univ. Inf. Technol. 2018, 33, 704–712. (In Chinese) [Google Scholar] [CrossRef]
  22. Li, Y.; Yang, J.; Xu, H.; Meng, Q. Numerical Simulation and Analysis of a Process of Turbulence on Lasa Airway. Plateau Mt. Meteorol. Res. 2011, 31, 56–60. (In Chinese) [Google Scholar]
  23. Shen, Q.; Shen, W. A New Synthesis Algorithm for Clear Air Turbulence Forecast. Meteorology And Disaster Reduction Research. Meteorol. Disaster Reduct. Res. 2009, 32, 44–49. (In Chinese) [Google Scholar] [CrossRef]
  24. Li, Z.; Wang, X.; Zhou, L. Forecasting Results of Different Air Turbulence Environment Indexes Based on WRF Model. Equip. Environ. Eng. 2019, 16, 70–75. (In Chinese) [Google Scholar]
  25. Miles, J. Richardson’s Criterion for the Stability of Stratified Shear Flow. Phys. Fluids 1986, 29, 3470. [Google Scholar] [CrossRef]
  26. Frehlich, R.; Sharman, R. Estimates of Turbulence from Numerical Weather Prediction Model Output with Applications to Turbulence Diagnosis Data Assimilation. Mon. Weather Rev. 2004, 132, 2308–2324. [Google Scholar] [CrossRef]
  27. Williams, P.D.; Joshi, M.M. Intensification of Winter Transatlantic Aviation Turbulence in Response to Climate Change. Nat. Clim. Chang. 2013, 3, 644–648. [Google Scholar] [CrossRef]
  28. Hersbach, H.; Bell, B.; Berrisford, P.; Hirahara, S.; Horányi, A.; Muñoz-Sabater, J.; Nicolas, J.; Peubey, C.; Radu, R.; Schepers, D.; et al. The ERA5 Global Reanalysis. Q. J. R. Meteorol. Soc. 2020, 146, 1999–2049. [Google Scholar] [CrossRef]
  29. Gill, P.G.; Buchanan, P. An Ensemble Based Turbulence Forecasting System. Meteorol. Appl. 2014, 21, 12–19. [Google Scholar] [CrossRef]
  30. Kim, J.H.; Chun, H.Y.; Sharman, R.D.; Keller, T.L. Evaluations of Upper-Level Turbulence Diagnostics Performance Using the Graphical Turbulence Guidance (GTG) System and Pilot Reports (PIREPs) over East Asia. J. Appl. Meteorol. Climatol. 2011, 50, 1936–1951. [Google Scholar] [CrossRef]
  31. Li, X.; A, L.; Shi, D. Statistics of Aircraft Turbulence Reports and Evaluation Analysis of the Forecasts. Air Traffic Manag. 2016, 4, 46–47. (In Chinese) [Google Scholar]
  32. Fang, L. Research on Charactercistics and Causes of Aircraft Turbulence on Plateau Based on Aircraft Detection Data. Master’s Thesis, Civil Aviation Flight University of China, Guanghan, China, 2021. (In Chinese). [Google Scholar]
  33. Vogel, G.N.; Sampson, C.R. Clear Air Turbulence Indices Derived from U.S. Navy Numerical Model Data: A Verification Study; Naval Research Lab Monterey CA Decision Aid Section: Washington, DC, USA, 1996. [Google Scholar]
  34. Endlich, R.M. The Mesoscale Structure of Some Regions of Clear-Air Turbulence. J. Appl. Meteorol. 1964, 3, 261–276. [Google Scholar] [CrossRef]
  35. Brown, R. New indexes to locate clear-air turbulence. Meteorol. Mag. 1973, 102, 347–361. [Google Scholar]
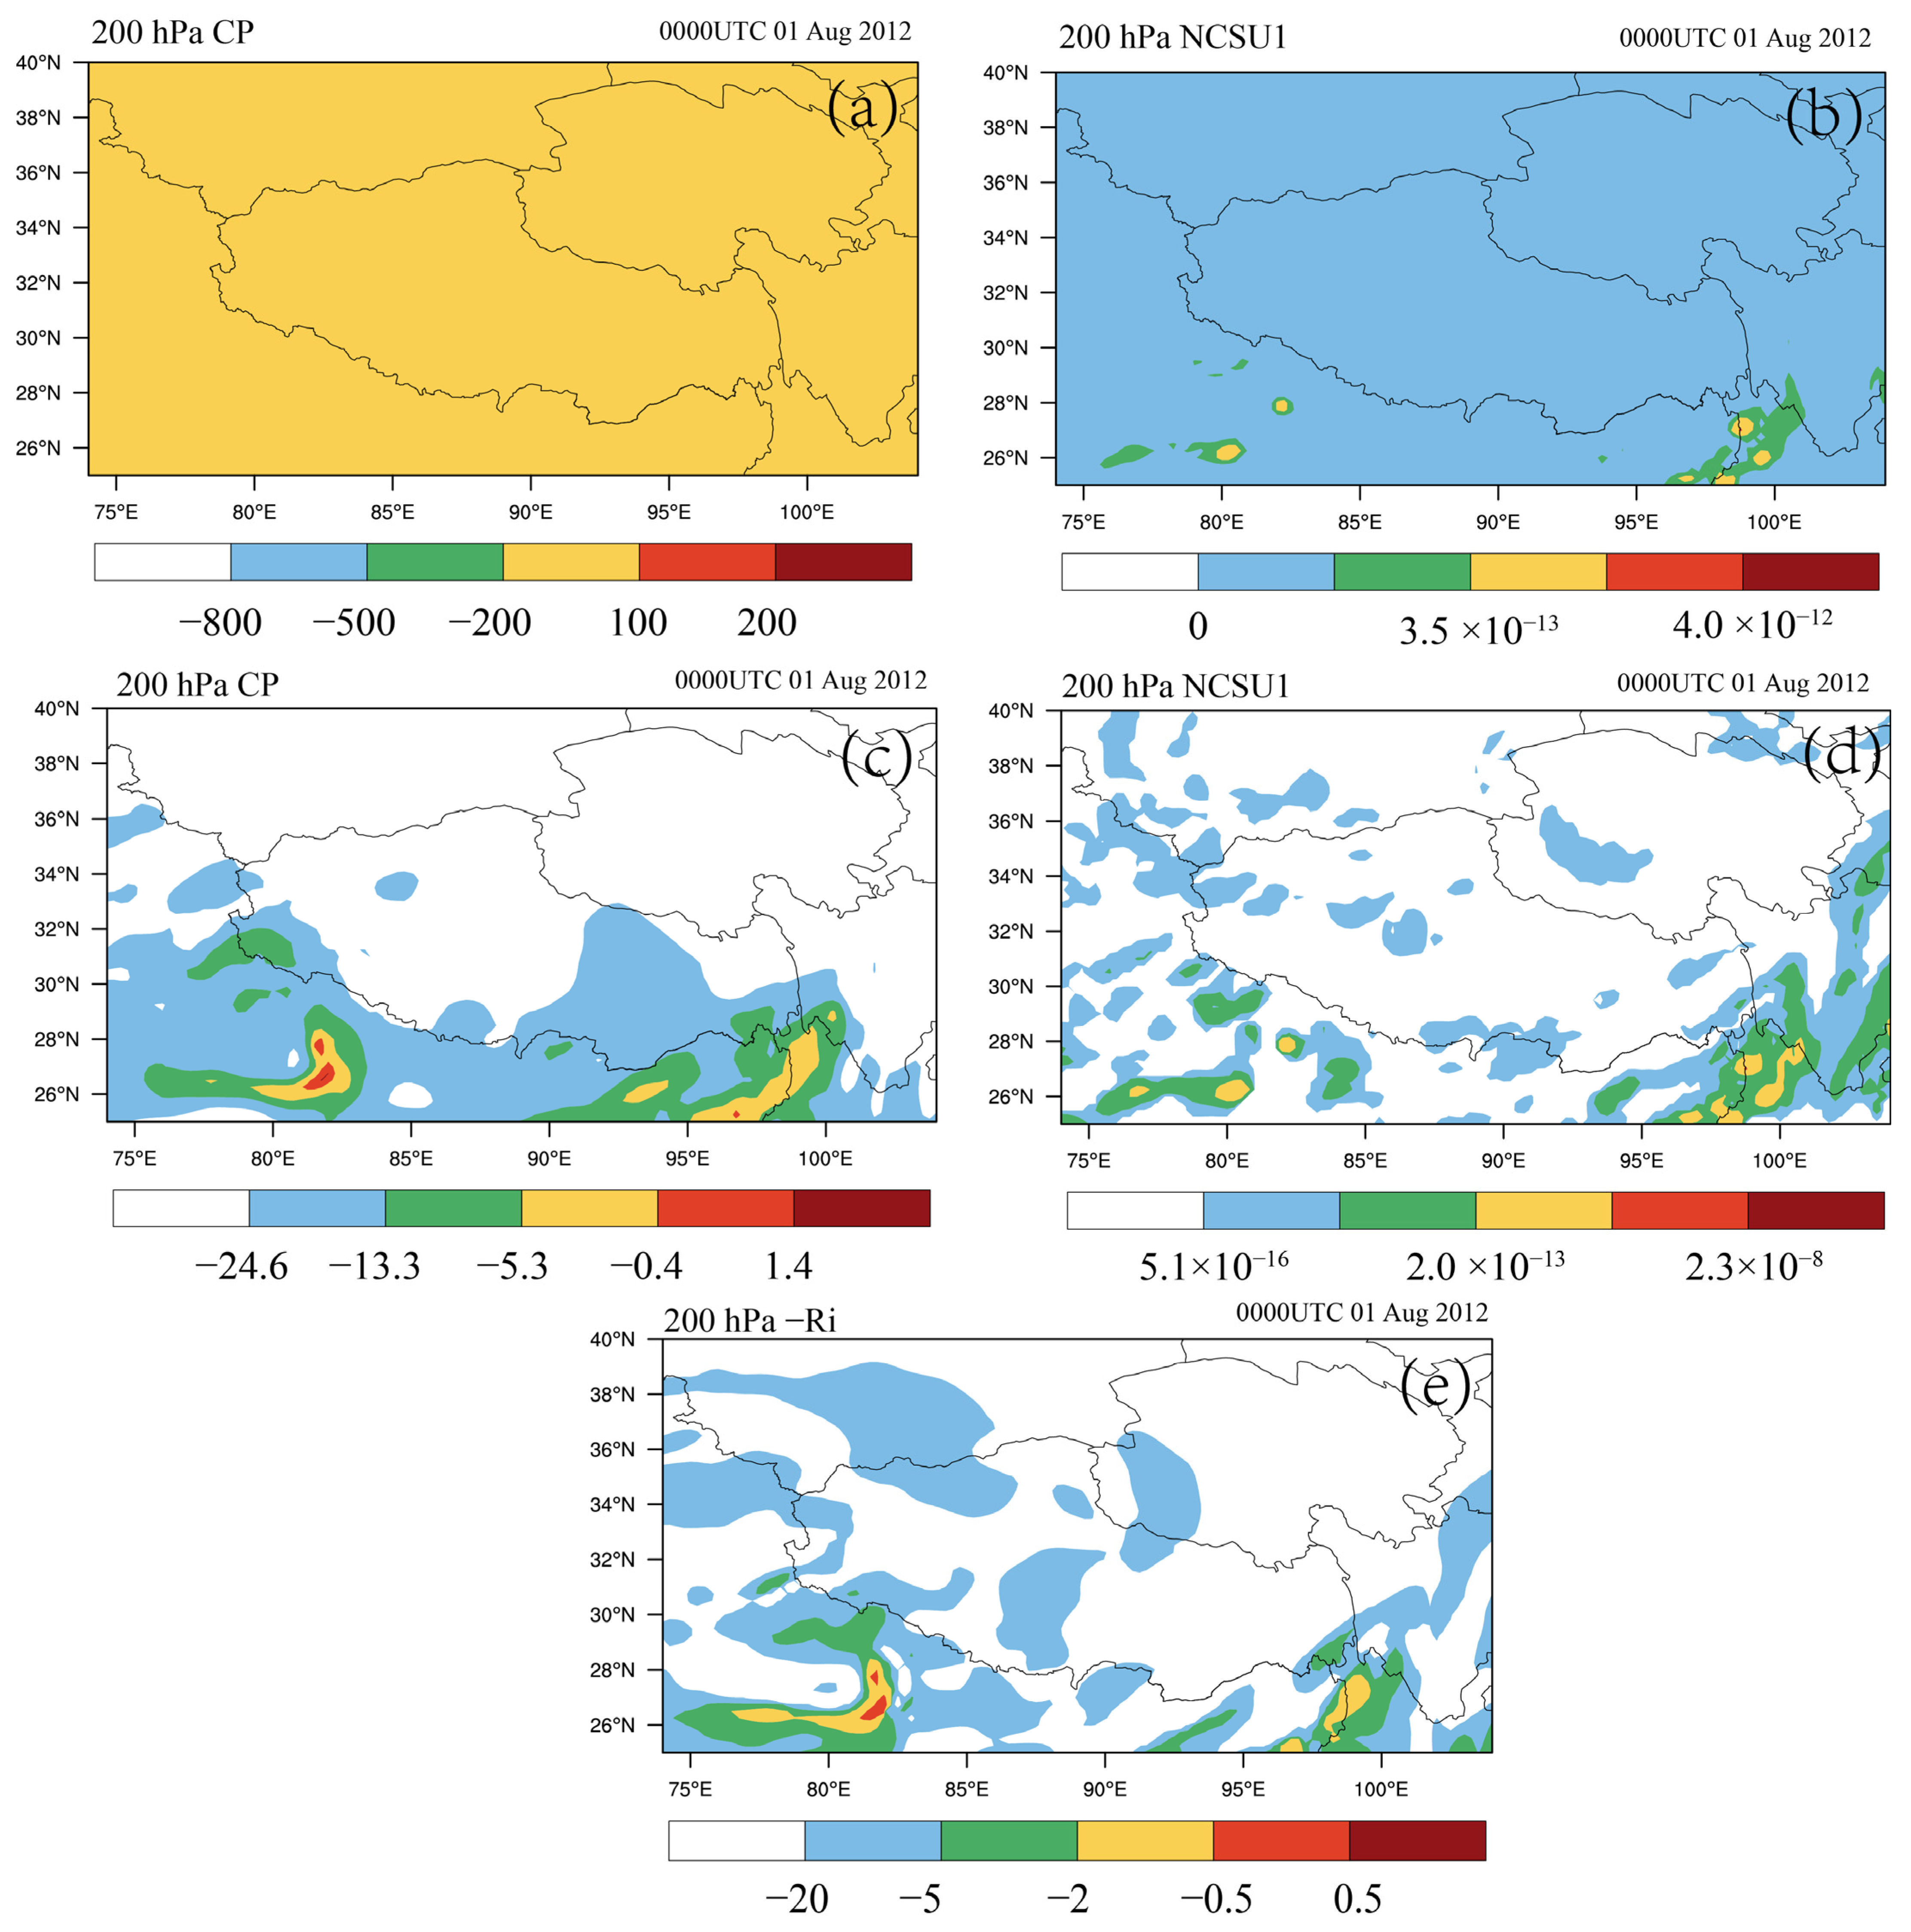
Figure 1. 200 hPa (a) CP index and (b) NCSU1 at 0000 UTC on 1 August 2012, color-coded as empirical thresholds. 200 hPa, (c) CP index, (d) NCSU1, and (e) Ri at 0000 UTC on 1 August 2012, color-coded as thresholds reclassified with negative Richardson number percentiles.
Applsci 13 04131 g001
Figure 2. Frequency distribution of 17 turbulence diagnostics for light or greater turbulence at 200 hPa (2480 epochs in August from 2012 to 2021).
Applsci 13 04131 g002
Figure 3. PI for light or greater turbulence at 200 hPa at (a) 0600 UTC 26 February 2006, (b) 0900 UTC 26 February 2006, (c) 0600 UTC 13 October 2009, (d) 0900 UTC 13 October 2009, (e) 0600 UTC 11 February 2023, and (f) 0900 UTC 11 February 2023. The black squares represent the range of the Chengdu–Lhasa route.
Applsci 13 04131 g003
Figure 4. PICAT for the intensity of light or greater at 200 hPa at (a) 0600 UTC on 26 February 2006, (b) 0600 UTC on 13 October 2009, and (c) 0900 UTC on 11 February 2023. The black squares represent the range of the Chengdu–Lhasa route.
Applsci 13 04131 g004
Figure 5. Averaged (left column) PI, (middle column) PIMWT, and (right column) PICAT over August 2012–2021 (31 × 10 × 8 = 2480 epochs in total) on 200 hPa for intensities of (ac) light or greater, (df) moderate or greater, and (gi) severe or greater.
Applsci 13 04131 g005
Figure 6. The average PI for LOG turbulence on 200 hPa in August from 2012–2021. The black square in Figure 6a represents the key area of interannual variation in PI.
Applsci 13 04131 g006
Table 1. The range of turbulence intensity percentiles according to the Richardson number.
Turbulence IntensityNullLightLight–ModerateModerateModerate–SevereSevere
-Ri<−20−20~−5−5~−2−2~−0.5−0.5~0.5>0.5
Percentile0–69.2569.25–95.8495.84–99.6099.60–99.9799.97–99.9999.99–100
Table 2. Thresholds (T1, T2, T3, T4, and T5) corresponding to light, light–moderate, moderate, moderate–severe, and severe turbulence categories for individual diagnostics according to the percentile in Table 1.
Index NameUnitsT1T2T3T4T5
GRDTK m−15.3 × 10−61.1 × 10−51.9 × 10−53.2 × 10−53.8 × 10⁻⁵
CPm2 s−2−24.6−13.3−5.3−0.4−1.4
MOSCATm s−21.0 × 10−32.6 × 10−34.1 × 10−35.9 × 10−36.8 × 10⁻³
TI1s−25.3 × 10−81.5 × 10−73.0 × 10−75.1 × 10−76.2 × 10⁻⁷
NCSU1s−35.1 × 10−162.3 × 10−142.0 × 10−131.5 × 10−122.3 × 10⁻⁸
VENSs−28.6 × 10−103.4 × 10−97.8 × 10−91.6 × 10−82.1 × 10−8
CCATs−22.8 × 10−102.5 × 10−97.6 × 10−91.8 × 10−82.4 × 10−8
Sm s−121.940.850.356.758.8
SVs−11.1 × 10−32.0 × 10−32.9 × 10−33.9 × 10−34.3 × 10⁻³
BIs−19.7 × 10−51.3 × 10−41.8 × 10−42.5 × 10−43.0 × 10⁻⁴
MWT1m3 s–30.5515.0154.75335.22.62 × 107
MWT4m2 s–24.7 × 1052.2 × 1064.5 × 1066.5 × 1067.1 × 106
MWT5m s–20.73.28.416.420.6
MWT6m s–221.4115.7285.7498.5598.3
MWT12K s–10.10.51.32.43.0
MWT13m s–27.6 × 10−54.4 × 10−41.3 × 10−33.4 × 10−34.9 × 10⁻³
Disclaimer/Publisher’s Note: The statements, opinions and data contained in all publications are solely those of the individual author(s) and contributor(s) and not of MDPI and/or the editor(s). MDPI and/or the editor(s) disclaim responsibility for any injury to people or property resulting from any ideas, methods, instructions or products referred to in the content.