1. Introduction
One of the most important groups in the energy transition toward a greener and cleaner future is academia [
1,
2]. It is through education that long-term societal advancements can occur. In several academic institutions, students create teams and develop projects using the knowledge they receive in class and by researching further on their own.
TLMoto was founded in 2012 by a group of students in Instituto Superior Técnico, University of Lisbon. The main intent of the project is to design, build and race a motorcycle prototype in a biennial competition for universities worldwide that takes place in Spain, called MotoStudent. This competition has already gathered universities from 22 countries in 4 different continents. With an estimated EUR 5 million spent in R&D, this is an event that moves a substantial amount of money. The competing teams are evaluated in two phases: static tests, or MS1, and dynamic tests, or MS2. The static tests evaluate the projects as real business project models, where teams not only explain the engineering behind their prototypes but also the marketing, economic and financial plans they applied. Before advancing to the MS2 phase, all prototypes are subjected to a scrutineering procedure that ensures safety and functionality. After obtaining approval from the organization, motorcycles perform a series of dynamic tests and ultimately race at the Circuit of MotorLand Aragon.
For the sixth edition of the MotoStudent competition, TLMoto built its third prototype, the second electric one—the TLM03e. This vehicle will be used in this paper and can achieve the performance marks displayed in
Table 1.
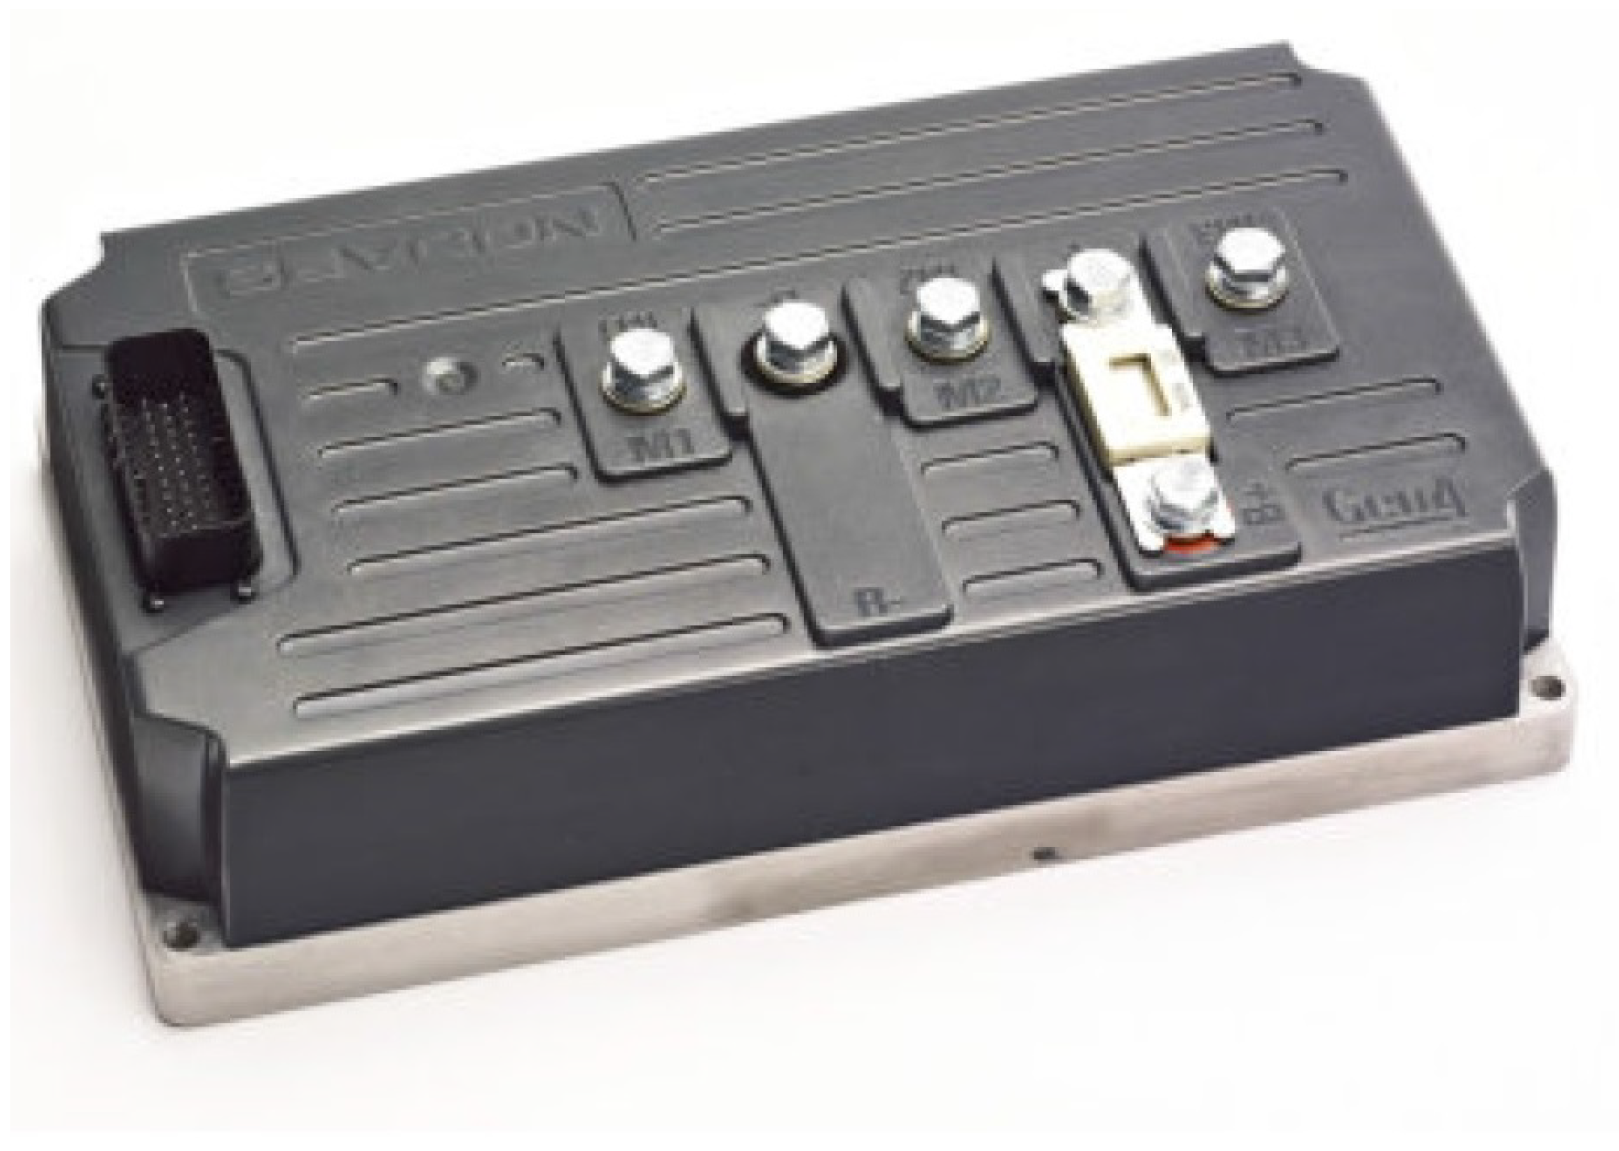
When the rider accelerates, a signal is sent to the controller, where the signal is transformed into a direct specific current request for the battery storage unit. The signal is transformed into a specific torque request, which corresponds to a certain current that the accumulators need to provide to the controller (seen in
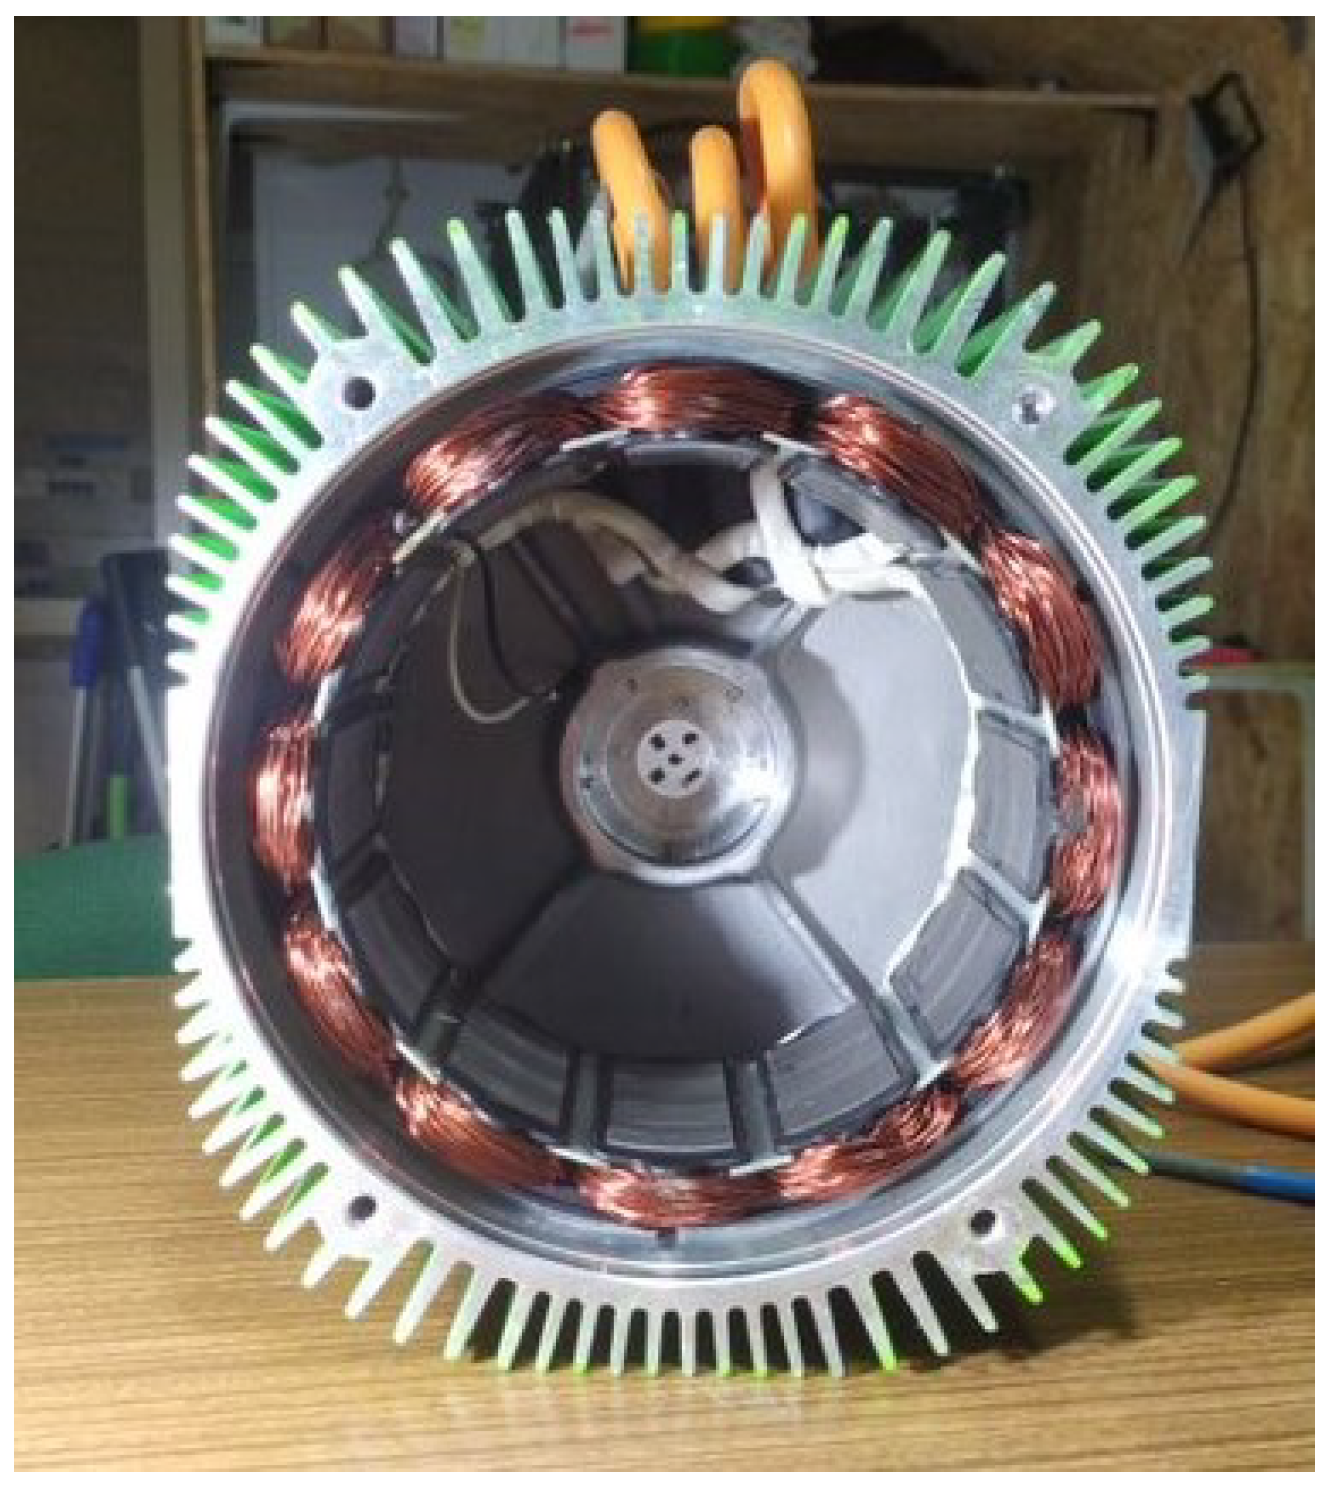
Figure 1), which also contains an inverter that transforms the DC current from the batteries into an AC current that can be used by the motor. The motor’s stator receives the alternating (3 phase) AC current in its copper windings (seen in
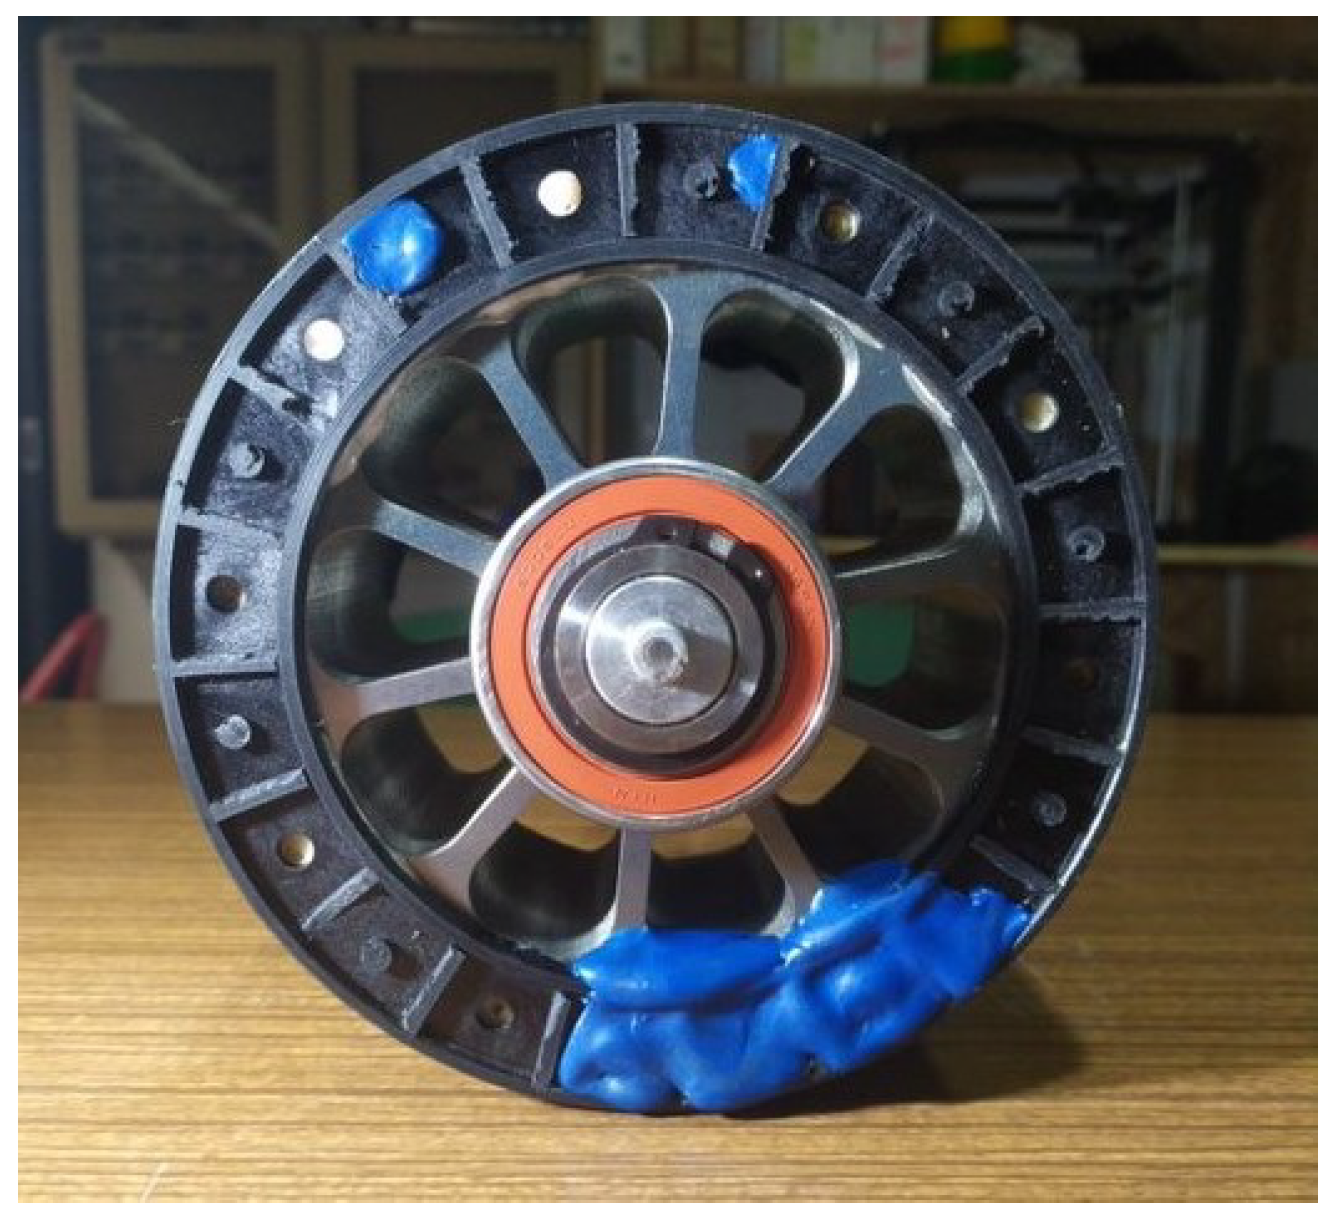
Figure 2), which induces a magnetic field with a flow perpendicular to the axis of rotation—radial flux motor. The rotor (seen in
Figure 3) has permanent magnets which have a magnetic field. The induced magnetic field in the stator interacts with the permanent magnetic field in the rotor, making it move. This movement is transmitted to the wheel (without a gear box) and this is how the motorcycle accelerates. Note that
Figure 2 and
Figure 3 show the motor of the team’s previous prototype, the TLM02e. The TLM03e’s motor is not equal to the one shown in this section and it was shown merely for representational purposes.
The reverse situation can also happen in which the wheel’s movement turns the rotor, thus inducing an alternating current in the stator. This current can then be transformed into a DC current in the controller and sent to the battery units where it is stored. This situation, in which the motor acts as a generator, is what will be discussed throughout this paper—regenerative braking. Regenerative braking is the act of recovering kinetic energy from the vehicle rather than losing it as heat with typical brakes.
In electric vehicles (EVs) or plug-in hybrid electric vehicles (PHEVs), the process of regeneration is entirely automatic and occurs when the motor’s speed exceeds the demanded speed that is requested by the controller.
However, in motorcycles, a lever needs to be triggered by the rider (similar to a conventional braking system), and the motor is slowed down. This can significantly reduce wear and tear caused by friction in a hydraulic system, and both braking systems can be used simultaneously, combining in an improved braking performance.
As the motor is slowed down, the regenerative current is reduced, which also reduces the available braking force. This is why mechanical braking is also required in vehicles with regenerative braking.
Electric vehicles have to be designed in a way that minimizes weight and optimizes autonomy. Seen as a promising solution for extended range and weight reduction, the following work’s major contribution is to investigate the regenerative braking capacity of a given electric racing motorcycle. What sets this work apart from other analyzed studies is the variability in circuits, with a total of 25 different racetracks, leading to conclusions not only on recovered energy values but also on their dependence on track variables: lap distance, number of turns and average track speed.
To achieve said results, software was developed to simulate the motorcycle’s speed in all circuits. The obtained values were used in a developed MATLAB/Simulink software (Matlab R2022a version) to obtain the regenerated energy values for each track.
This report is structured as follows. In
Section 2, relevant studies on the subject are analyzed.
Section 3 contains an overview of the studied system’s components and the two developed Matlab/Simulink software (Matlab R2022a version) used to obtain lap times and the results in
Section 4. Recovered energy and distance results are further explored in a sensitivity analysis on mass and on the percentage of regenerative braking in
Section 5. All the obtained results and possible future studies on the subject are discussed in
Section 6.
2. Literature Review
Electric vehicles store energy in their accumulator, which can be composed of different storage solutions. Batteries are not ideal for delivering energy quickly. This may be required for load leveling, or when providing a burst of current to turn on a motor. These scenarios may put stress on the battery and shorten its capacity and operating life.
The selection of the type of battery for a vehicle is crucial in racing scenarios. High grades of specific energy and energy density are required to balance performance and range. Since high power is required in a competitive situation, high specific power and power density are required.
Lithium-ion batteries were invented a century after their lead–acid counterparts and perform much better in terms of the chosen cradle-to-grave environmental impact categories in [
3] and are techno-economically more viable than lead–acid batteries under the considered specifications used in a MATLAB simulation in [
4].
Ameli et al. [
5] studied the relation between the life cycle and depth of sischarge (DoD) of a Li-ion battery and obtained the expression in Equation (
1), where a = 4000 and b = −1.632. From this relation, it is possible to conclude that the higher the depth of discharge (
DoD), the lower the life expectancy of a Li-ion battery (
Ncycle) since there is a decrease in the discharge capacity of the batteries as the cycle numbers increase:
In [
6], Murtiningrum et al. analyzed the public perception of electric motorcycles (EMs) and found that environmental and economic benefits combined with incentive policies positively affect the attitude regarding EMs. A total of 36% of the study’s participants expressed intentions to purchase an EM as their next two-wheeled vehicle, despite the high costs and perceived risk.
In a study conducted in 2014, Ahmadi et al. [
7] stated that the benefits of the electrification of motorized vehicles could be doubled by extending the life of EV batteries and via a well-managed use of off-peak energy.
The authors in [
8,
9] investigated several types of energy storage for zero-emission motorcycles and observed that lithium-ion is the most used battery storage method and offers high grid-to-wheel energy conversion efficiency, although low energy storage density along with low specific energy, limited range, high charging time and costs are still hindering the public from these types of two-wheelers. Thus, lithium-ion battery two-wheelers are affected by low-range, which deters potential customers and slows down the electrification of the global transportation fleet.
Regenerative braking can be used in all types of electric vehicles that also have mechanical brakes, such as trains [
10] and buses [
11].
Motorsport is a great means to catch the public’s eye and increase the visibility of new vehicular technologies and improve them. A formula SAE team in [
12] developed a regenerative braking strategy for racing scenarios and observed that recovered energy values enable a mass reduction of the studied car.
MotoE is a competition that uses only electric motorcycles that regenerate energy by using the motor brake in about 30% of each race, according to the competition’s official website [
13]. Regenerative braking systems are currently designed with a low fixed maximum regeneration rate in order not to cause the rear wheel to lose grip when using the motor brake [
14].
Cui et al. [
15] simulated in MATLAB/Simulink software the regenerative potential of a road motorcycle and found improvements in driving range and costs. The benefits of regenerative braking were also investigated in [
16] using MATLAB/Simulink software. Results point to an increase in range of 4% to 14%.
MATLAB/Simulink software was used in [
17] to simulate regenerative braking via neural network control in a motorcycle with a boost converter. Results not only showed an increase in driving distance and battery performance but also in the accumulator’s life cycle.
3. Methodology and Simulation Conditions
In this section, the most important components in the propulsion system of the TLM03e prototype are presented. The overall efficiency of this system is calculated, and the developed software is explained.
3.1. Tlm03e Prototype
The powertrain system, as seen in
Figure 4, is a simple energy storage system directly connected to the motor controller, which is then connected to the motor, with a direct drive chain transmission to the rear wheel.
The team’s powertrain department researched different kinds of transmission types and decided to use a simple direct drive transmission due to its simplicity, high maintainability and excellent efficiency over other options. This transmission consists of a pinion directly connected to the motor, directly connected to a sprocket on the rear wheel through a chain. As the electric motor provides high torque in an extensive rotational speed range, the disadvantages (high mass and introduced losses in the system) of a gearbox outweigh its advantages (always utilizing the motor at peak power in a narrow rotational speed band).
3.1.1. Batteries
The selected accumulator has to ensure an appropriate energy capacity for the purposes of the competition. If the capacity is too low, either lower power modes have to be used, which does not bode well for a racing scenario, or there might even be a risk of not finishing the race. If, however, the installed capacity is too high, there are a few disadvantages to be considered: increased cost, which is a make-or-break factor in a project with limited funding and increased volume and weight, which contribute to an inferior on-track performance.
Since the purpose of all the team’s prototypes is to race in the MotoStudent competition in the Aragón circuit, the team calculates the energy required to complete a race, then adds a safety factor. A team-developed software optimizes the number of parallel and series connections in the battery pack.
The TLM03e prototype has 754 Sony US18650VTC6 cylindrical rechargeable lithium-ion batteries with the properties presented in
Table 2, which combine into the total energy (
E) that is calculated in Equation (
2) by multiplying the nominal voltage (
V), the nominal capacity (
C), the number of cells in series (
) and the number of cells in parallel (
):
The recommended depth of discharge given in the manufacturer’s datasheet is between 50% and 80% for long-term storage. This work uses the value of DoD = 80%, from a state of charge (SOC) of 90% (=7650 Wh) to SOC = 10% (=850 Wh). From Equation (
1), it is concluded that a higher DoD means a lower number of cycles and a lower discharge capacity for the batteries. This can be explained since high performance is required at all times, which surpasses sustainability purposes.
Energy storage units can be used in significantly different ways, according to the power mode of the motorcycle (100% power is not always the case, particularly for a better endurance performance). Hence, manufacturer datasheets do not contain efficiency values, as they are not constant.
Not having the charge/discharge efficiency of the selected lithium-ion batteries would diminish the quality of the achieved results. Therefore, this paper uses a simplified constant efficiency of 98%, as reported by Wang et al. [
19], even though in the most realistic scenario possible, the charge/discharge efficiency values vary.
3.1.2. Motor
In MotoStudent, all the teams receive equal motors to work with about a year before the competition. For the 2019/2020 competition in which the TLM03e took part, the 20 kg ENGIRO-MS1920 motor was provided, whose specifications are summarized in
Table 3. It is an internal permanent magnet (magnetic anisotropy: magnetic reluctance opposing the stator magnetic force is rotor angle-dependent) synchronous (the rotor rotates at the same speed as the rotating magnetic field) motor (PMSM). Compared to brushless DC electric motors (BLDC), PMSMs are more efficient and have a more linear torque response [
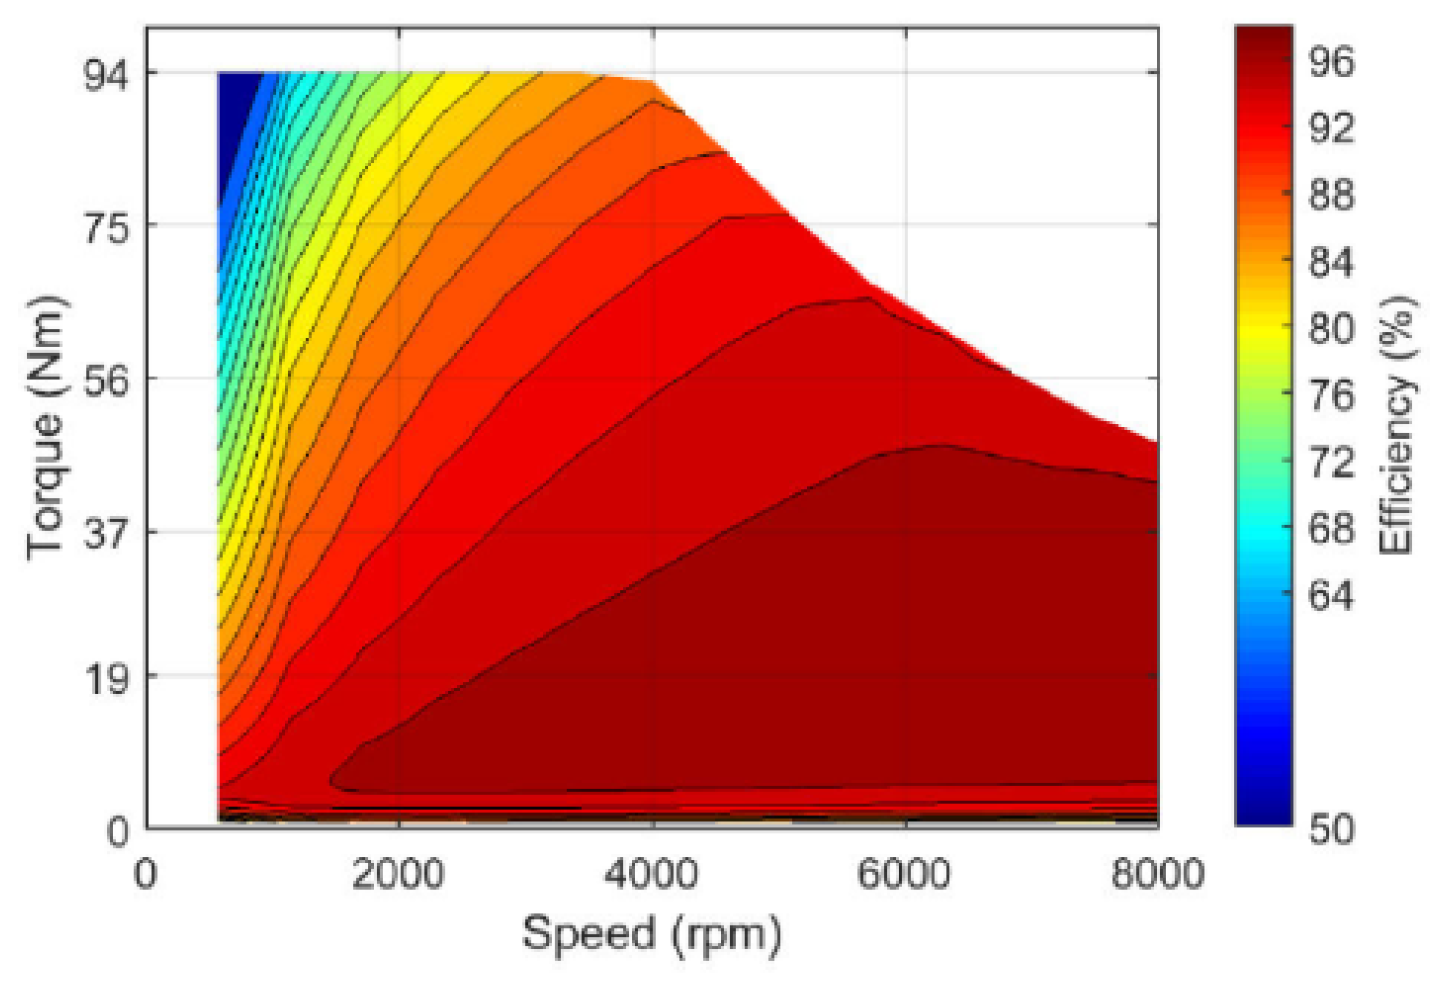
20]. Its simulated efficiency is provided in the manufacturer’s datasheet and presented in
Figure 5, from which a value of 92% efficiency was selected for this paper.
The torque that is generated by the engine must be delivered to the rear wheel through a chain. This introduces losses into the system since the efficiency of this process is not 100%. In a study on the transmission efficiency values of racing motorcycles [
22], authors reported transmission efficiencies of over 95% for a motorcycle racing at up to 170 km/h (the top speed of the TLM03e prototype). Therefore, this paper uses the conservative value of 95% of the transmission efficiency.
3.1.3. Controller
A motorcycle’s controller is its brain. It brings together all components of the vehicle by receiving inputs (from the battery, from speed or brake sensors, etc.) and translating them into signals that dictate the behavior of the motorcycle’s components.
The selected controller unit needs to uphold the following requirements: (1) the maximum output current needs to be at least the motor maximum current (780 ); (2) the maximum input voltage must be at least the maximum voltage of the battery pack (126 V); (3) the communication protocol should be CAN, to be compatible with the team’s electronics department’s protocols; and (4) the maximum output frequency needs to be at least the motor frequency at max speed (8000 rpm).
The chosen controller for the TLM03e was a Sevcon Gen4 size 6. This work uses an empirically observed efficiency of 95% since one is not provided in the controller manufacturer’s datasheet. This paper assumes 100% efficiency in cables due to their relatively short length. The total efficiency of the system was calculated by multiplying the efficiencies of the batteries, the motor, the transmission, the controller and the cables.
3.2. LapTime
3.2.1. LapTime Software
The LapTime software was created by the TLMoto team in order to mathematically simulate a perfect lap of a given motorcycle in a given trajectory. It is a point mass model with longitudinal weight transfer of the motorcycle and requires the input of four files in order to run: the route, which will be discussed in
Section 3.2.2; the motorcycle, by inputting its main physical characteristics, some of which are presented in
Table 4; the tires’ characteristics; and the motor’s torque based on the rpm (rotations per minute).
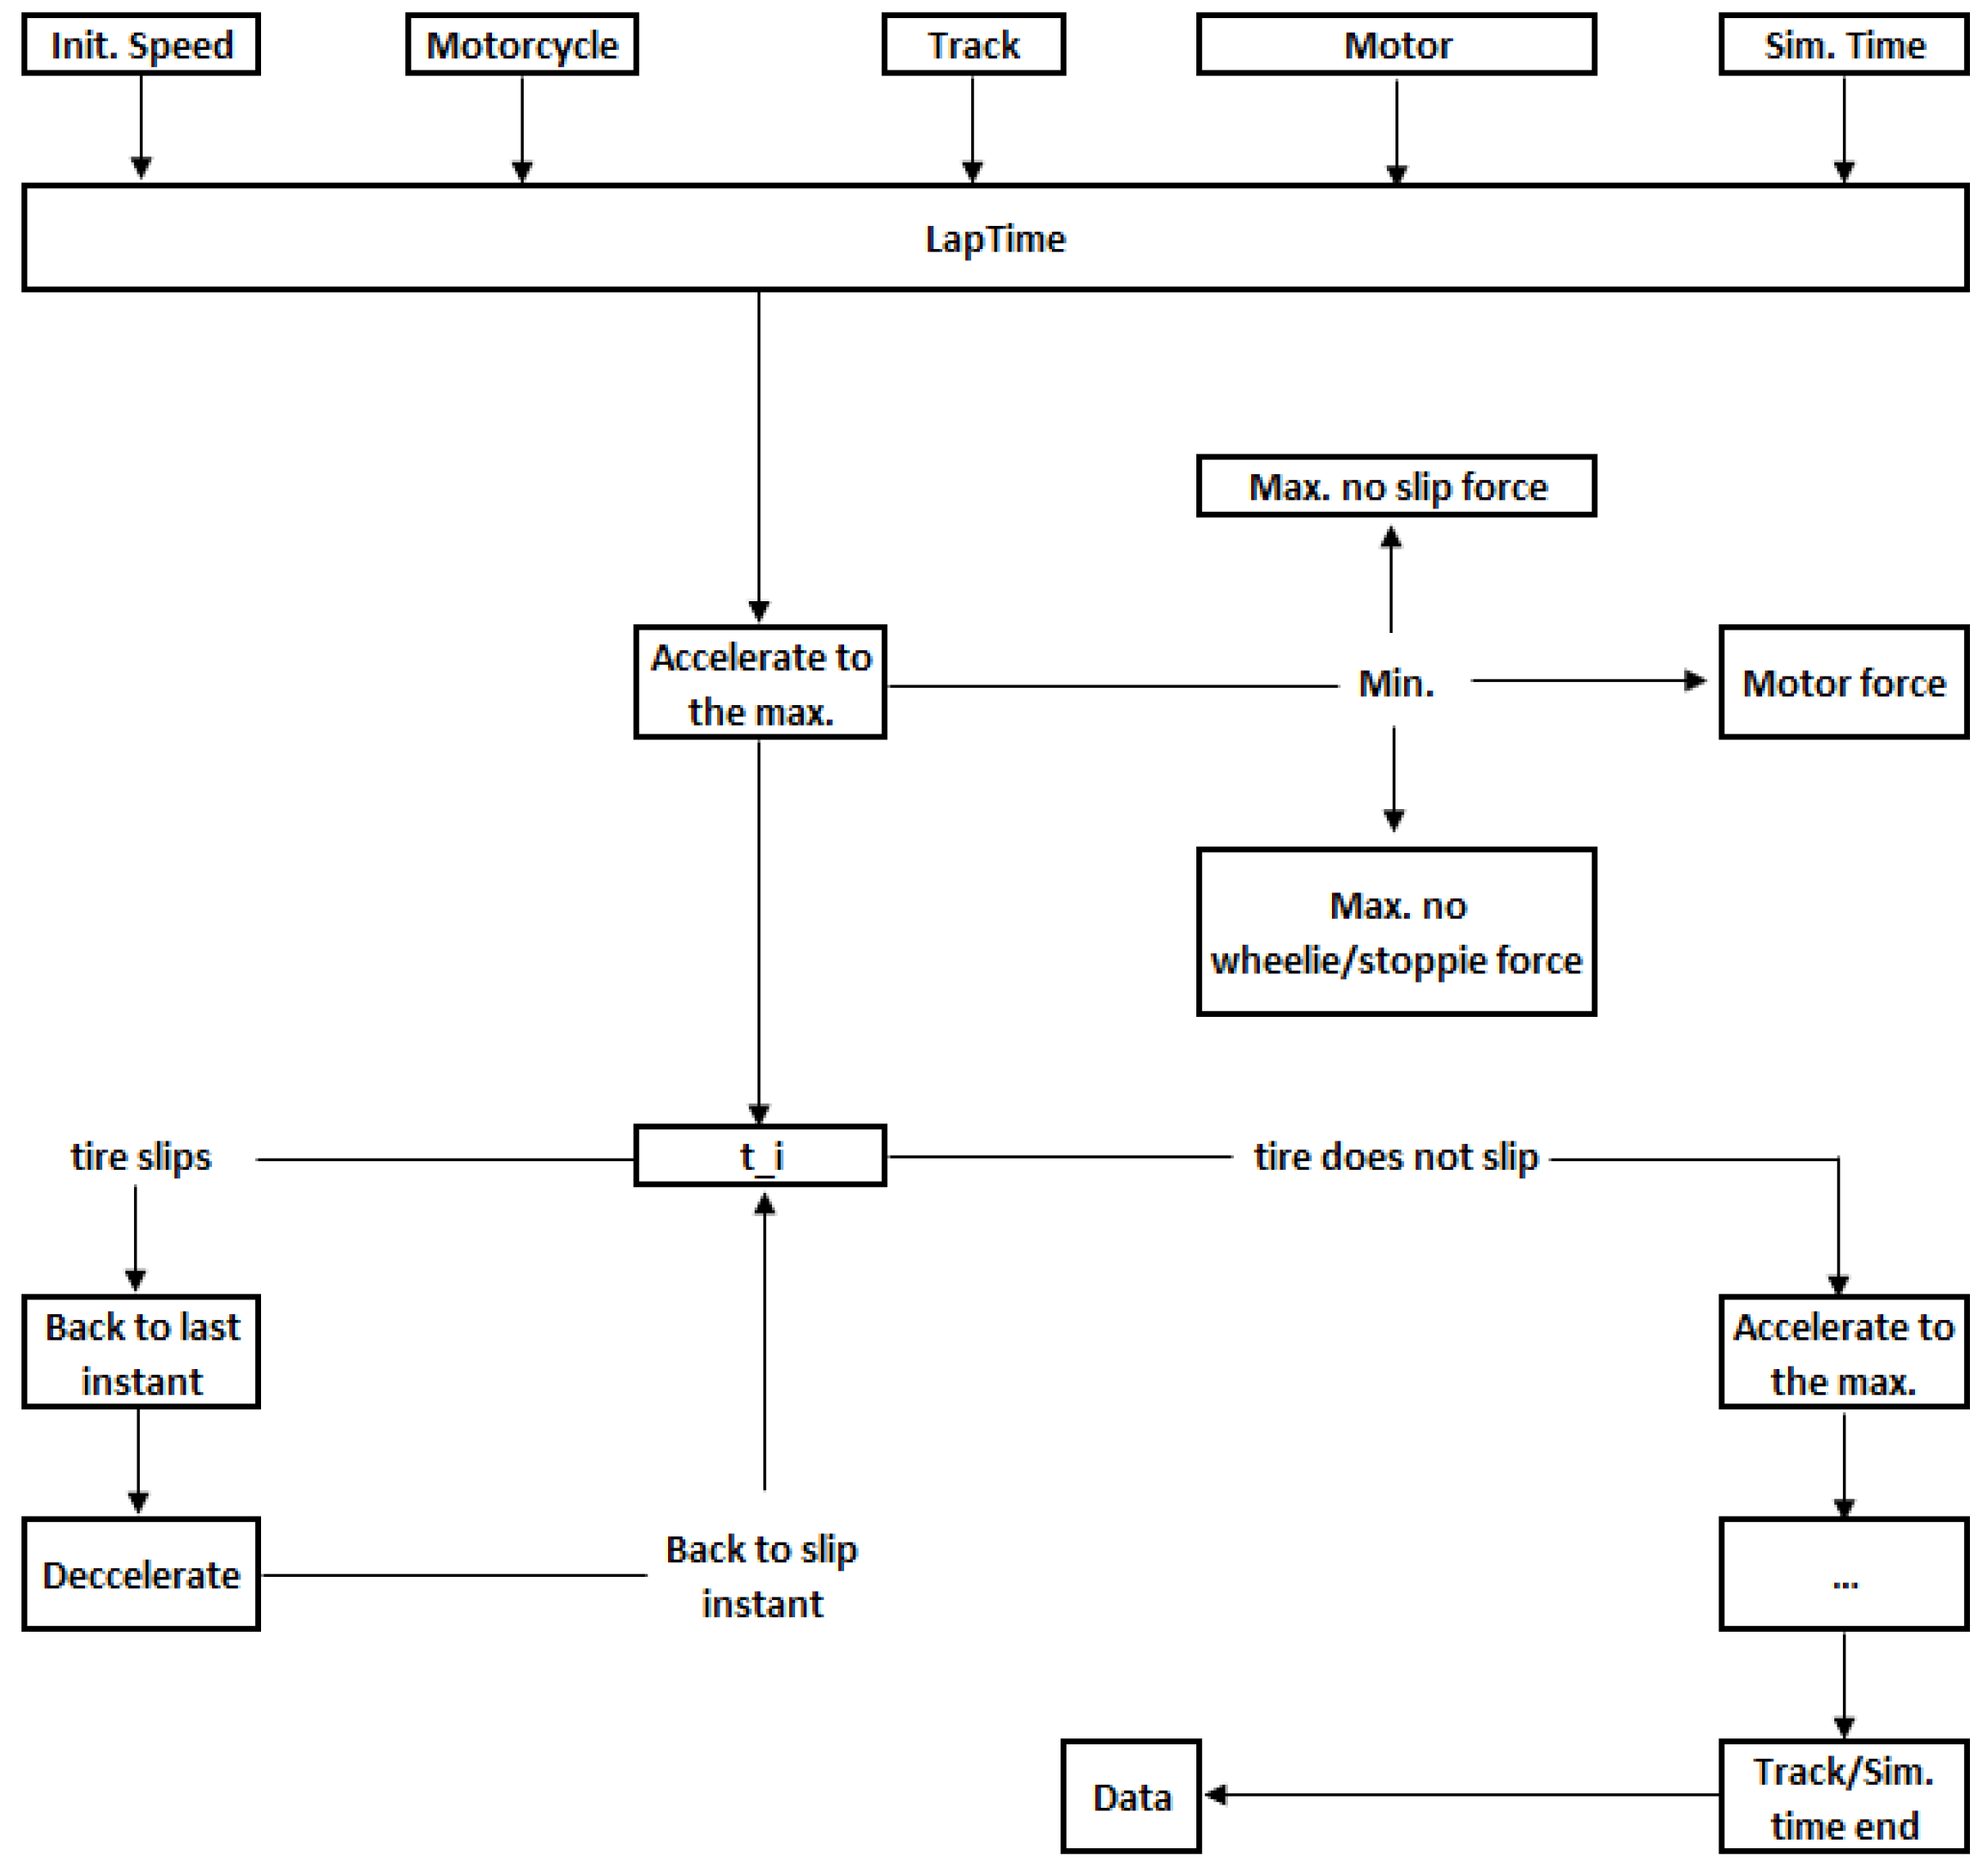
With these, the program had to be run twice for each track, the first with the initial speed of 0 km/h and the second one with the initial speed equal to the speed the motorcycle achieved in the last instant of the first lap, thus creating what is called a
flying lap. The software then creates an output with a velocity time series of the lap, which was treated with a developed Matlab and Simulink implementation, described further in
Section 3.3. A simplified fluxogram of this process is presented in
Figure 6.
3.2.2. Simulated Racetracks
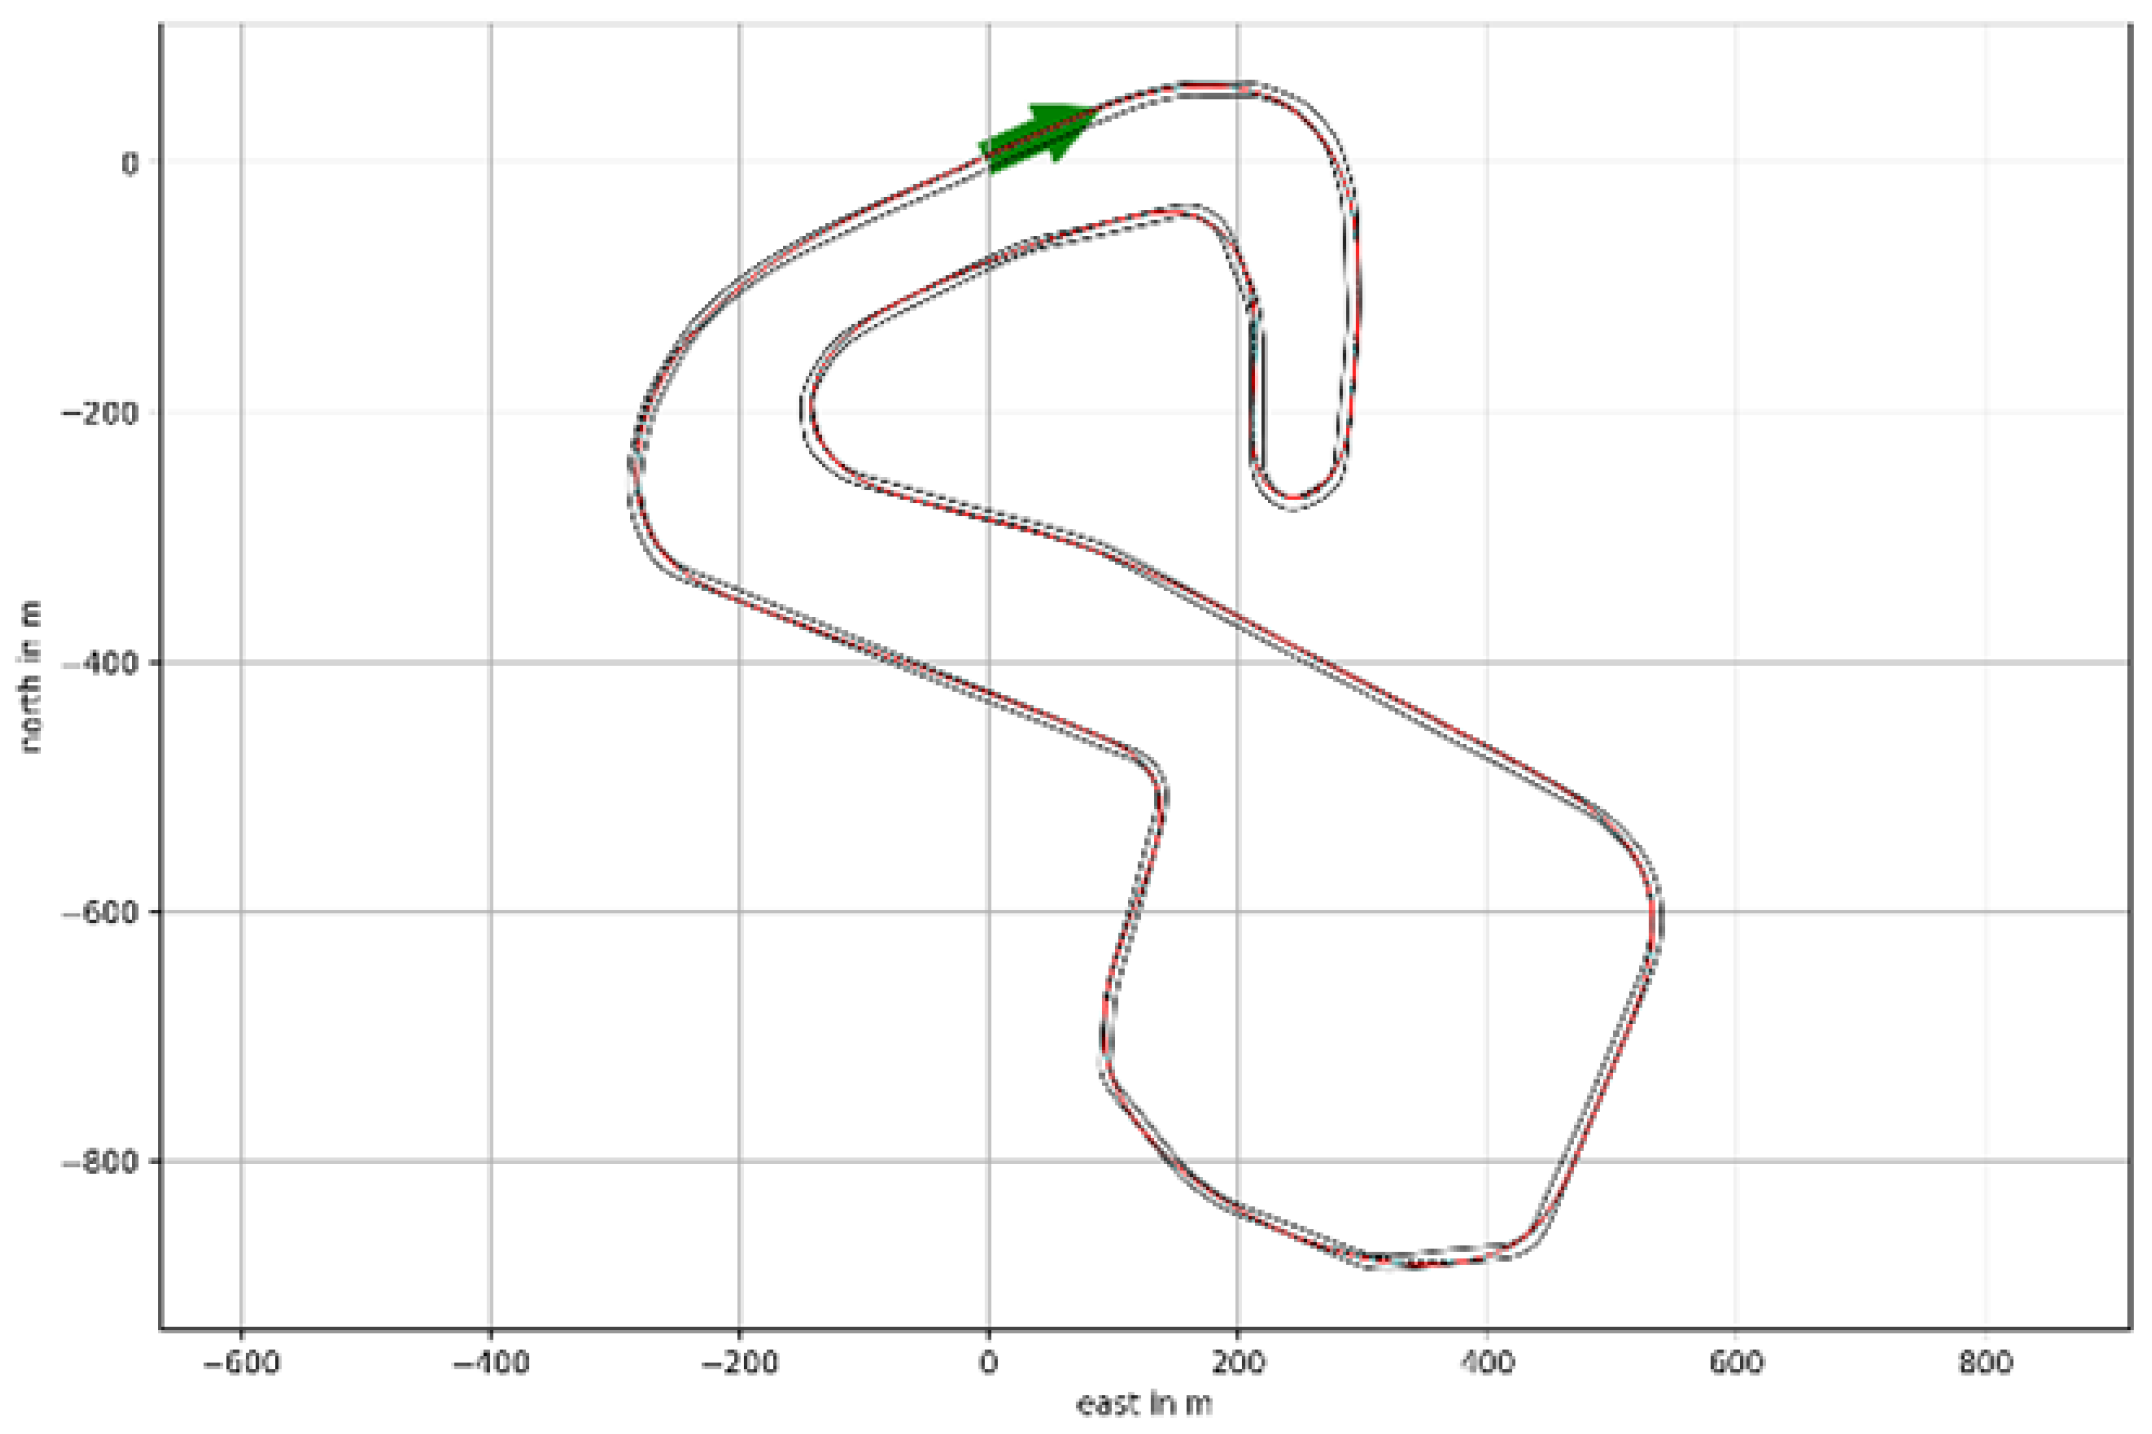
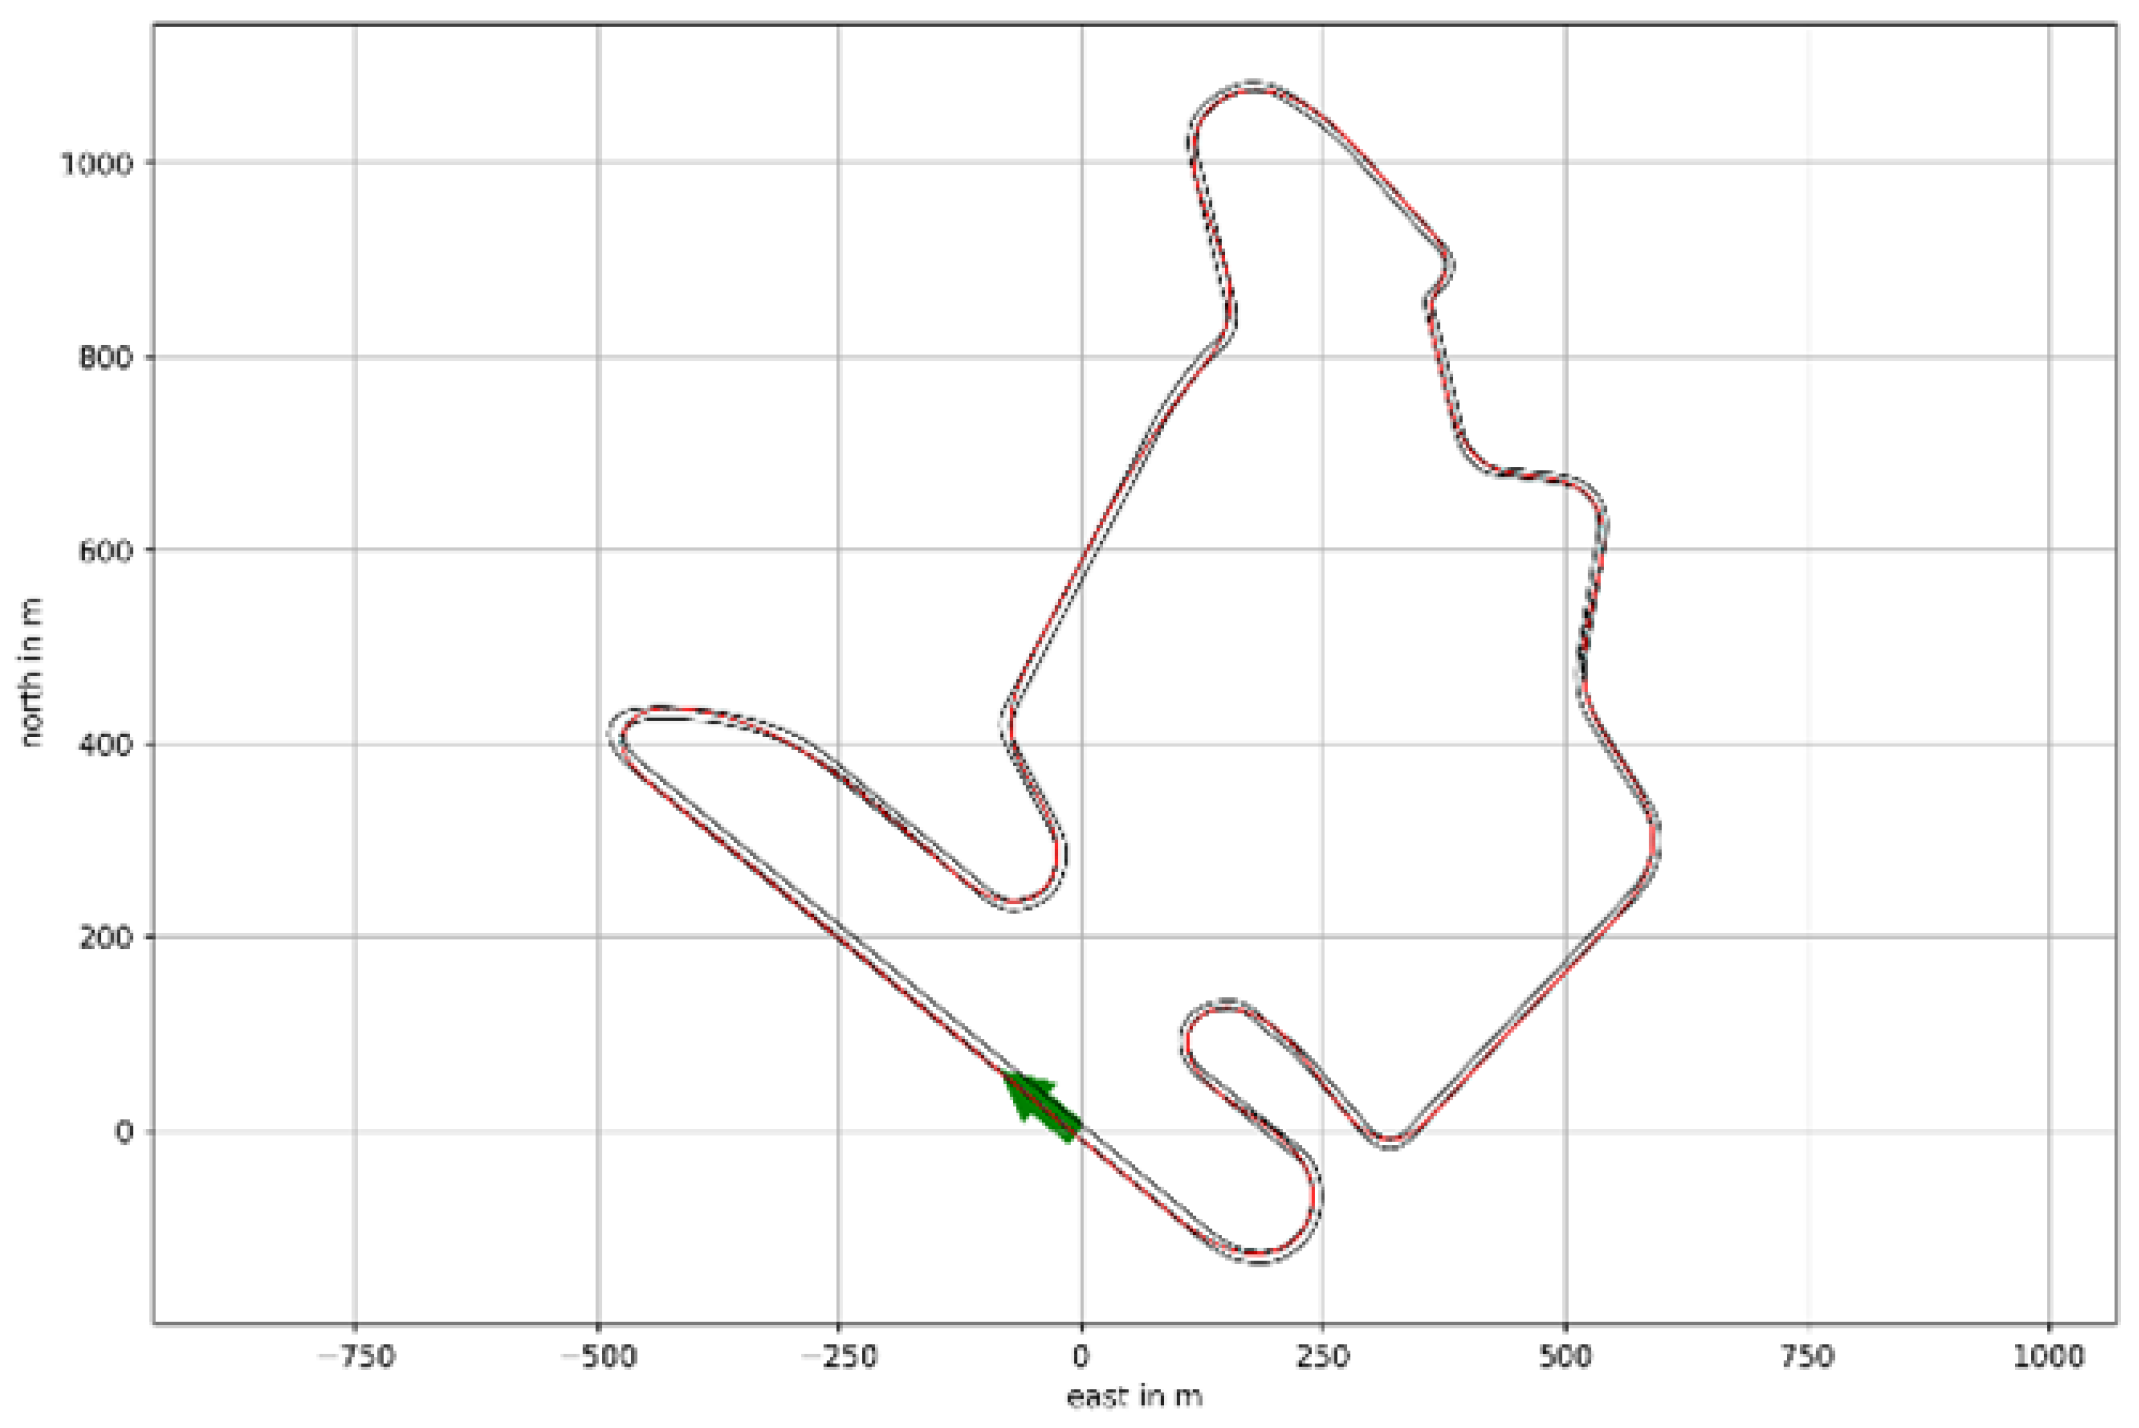
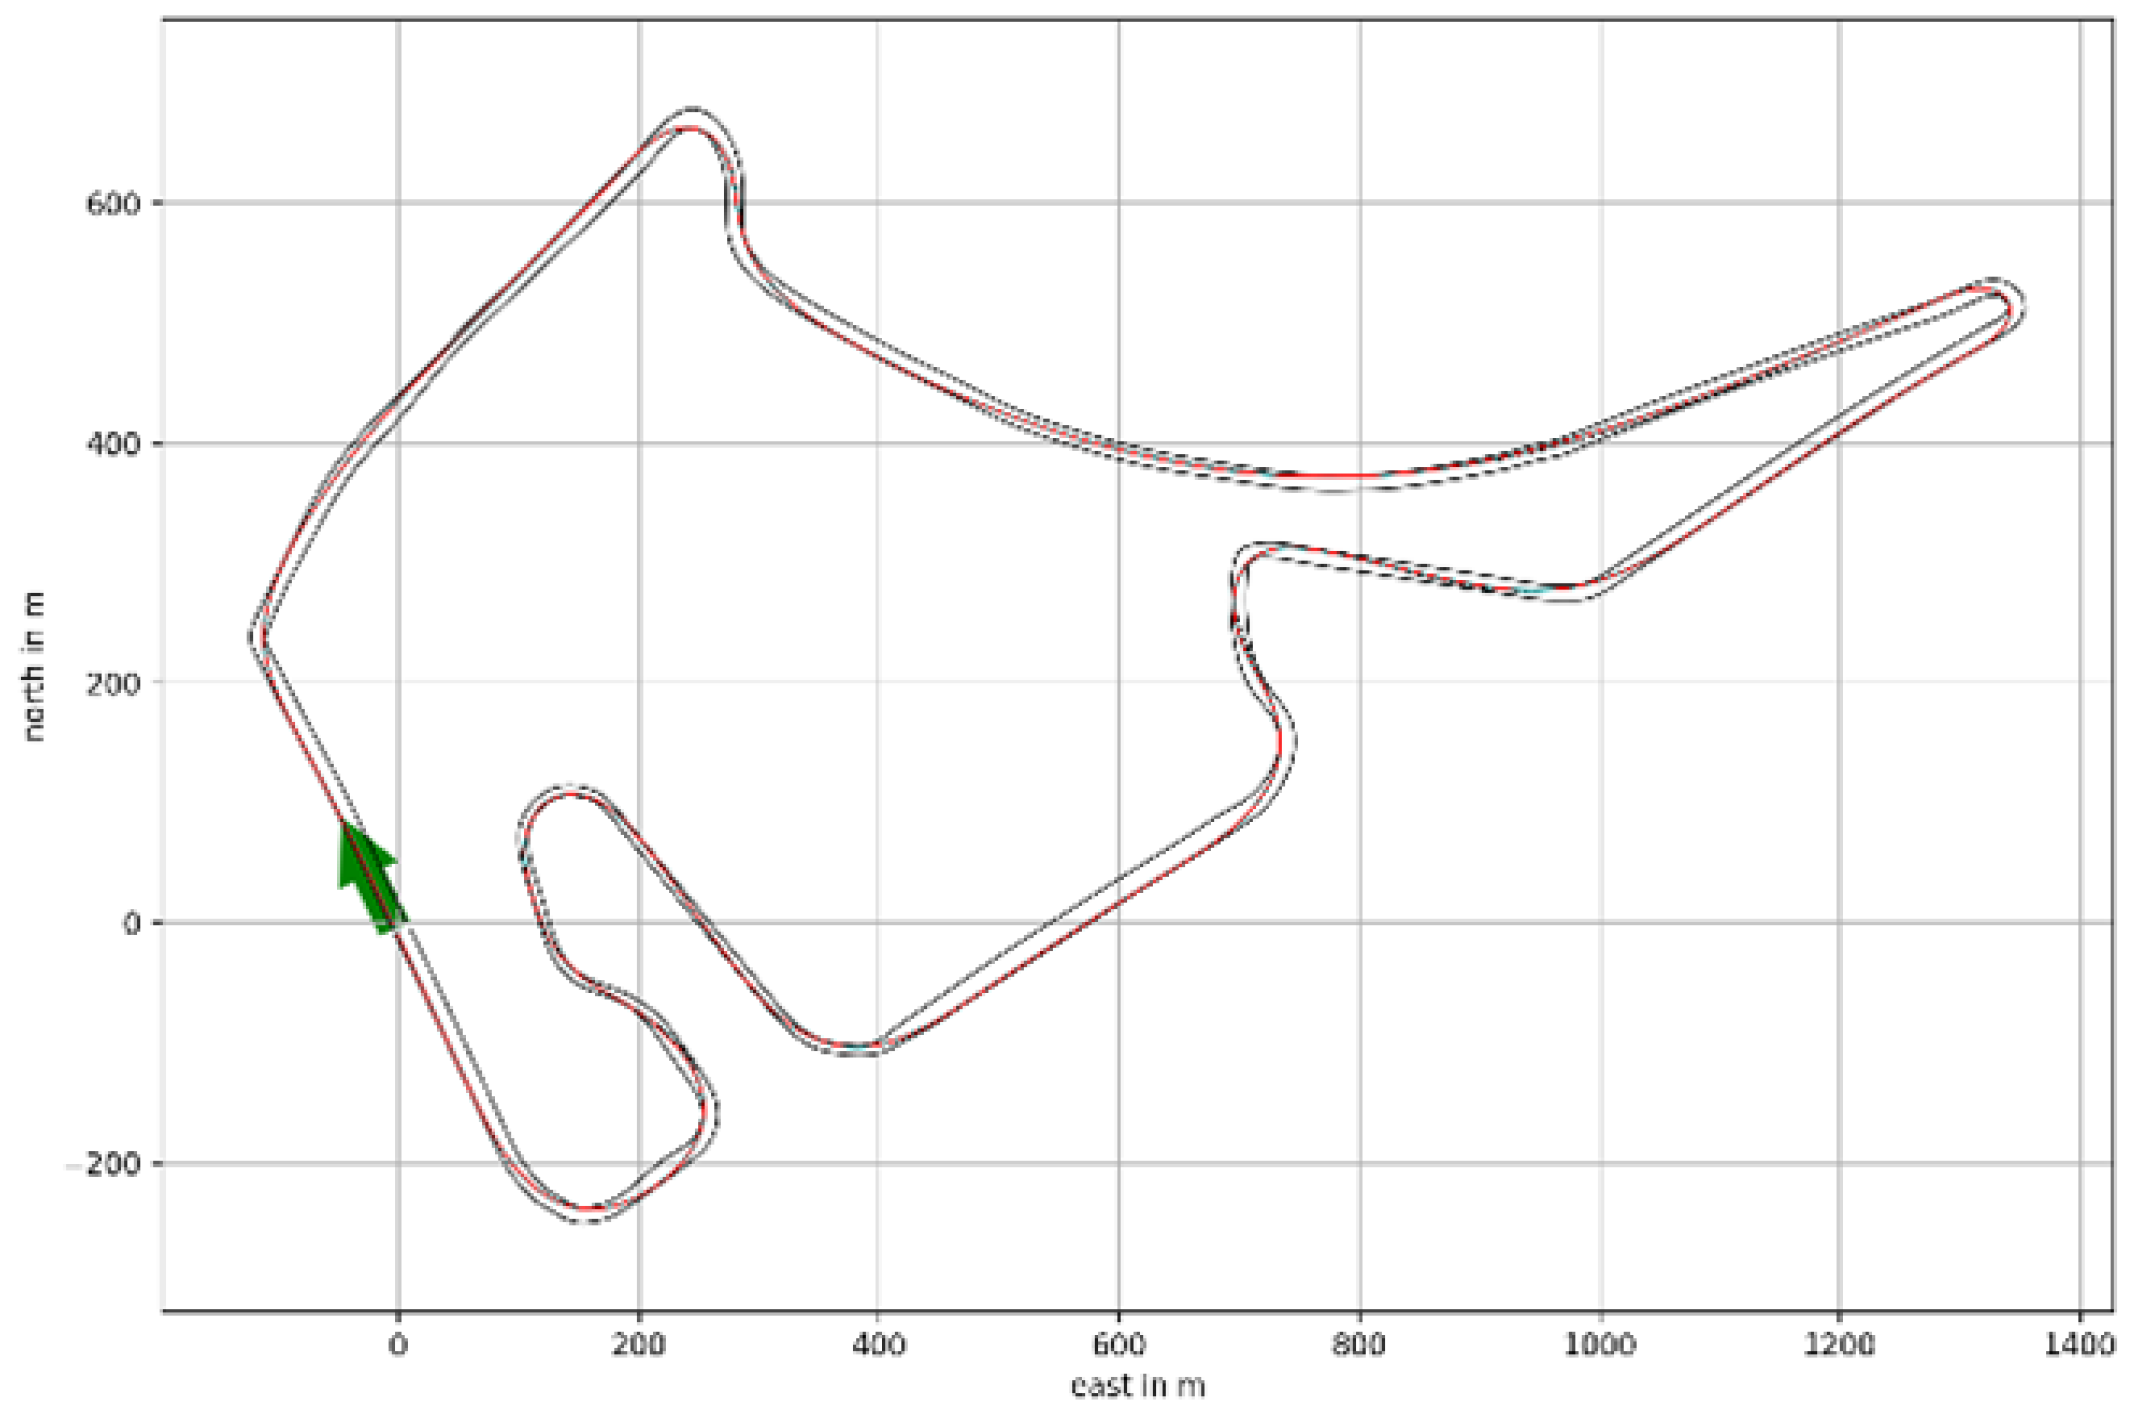
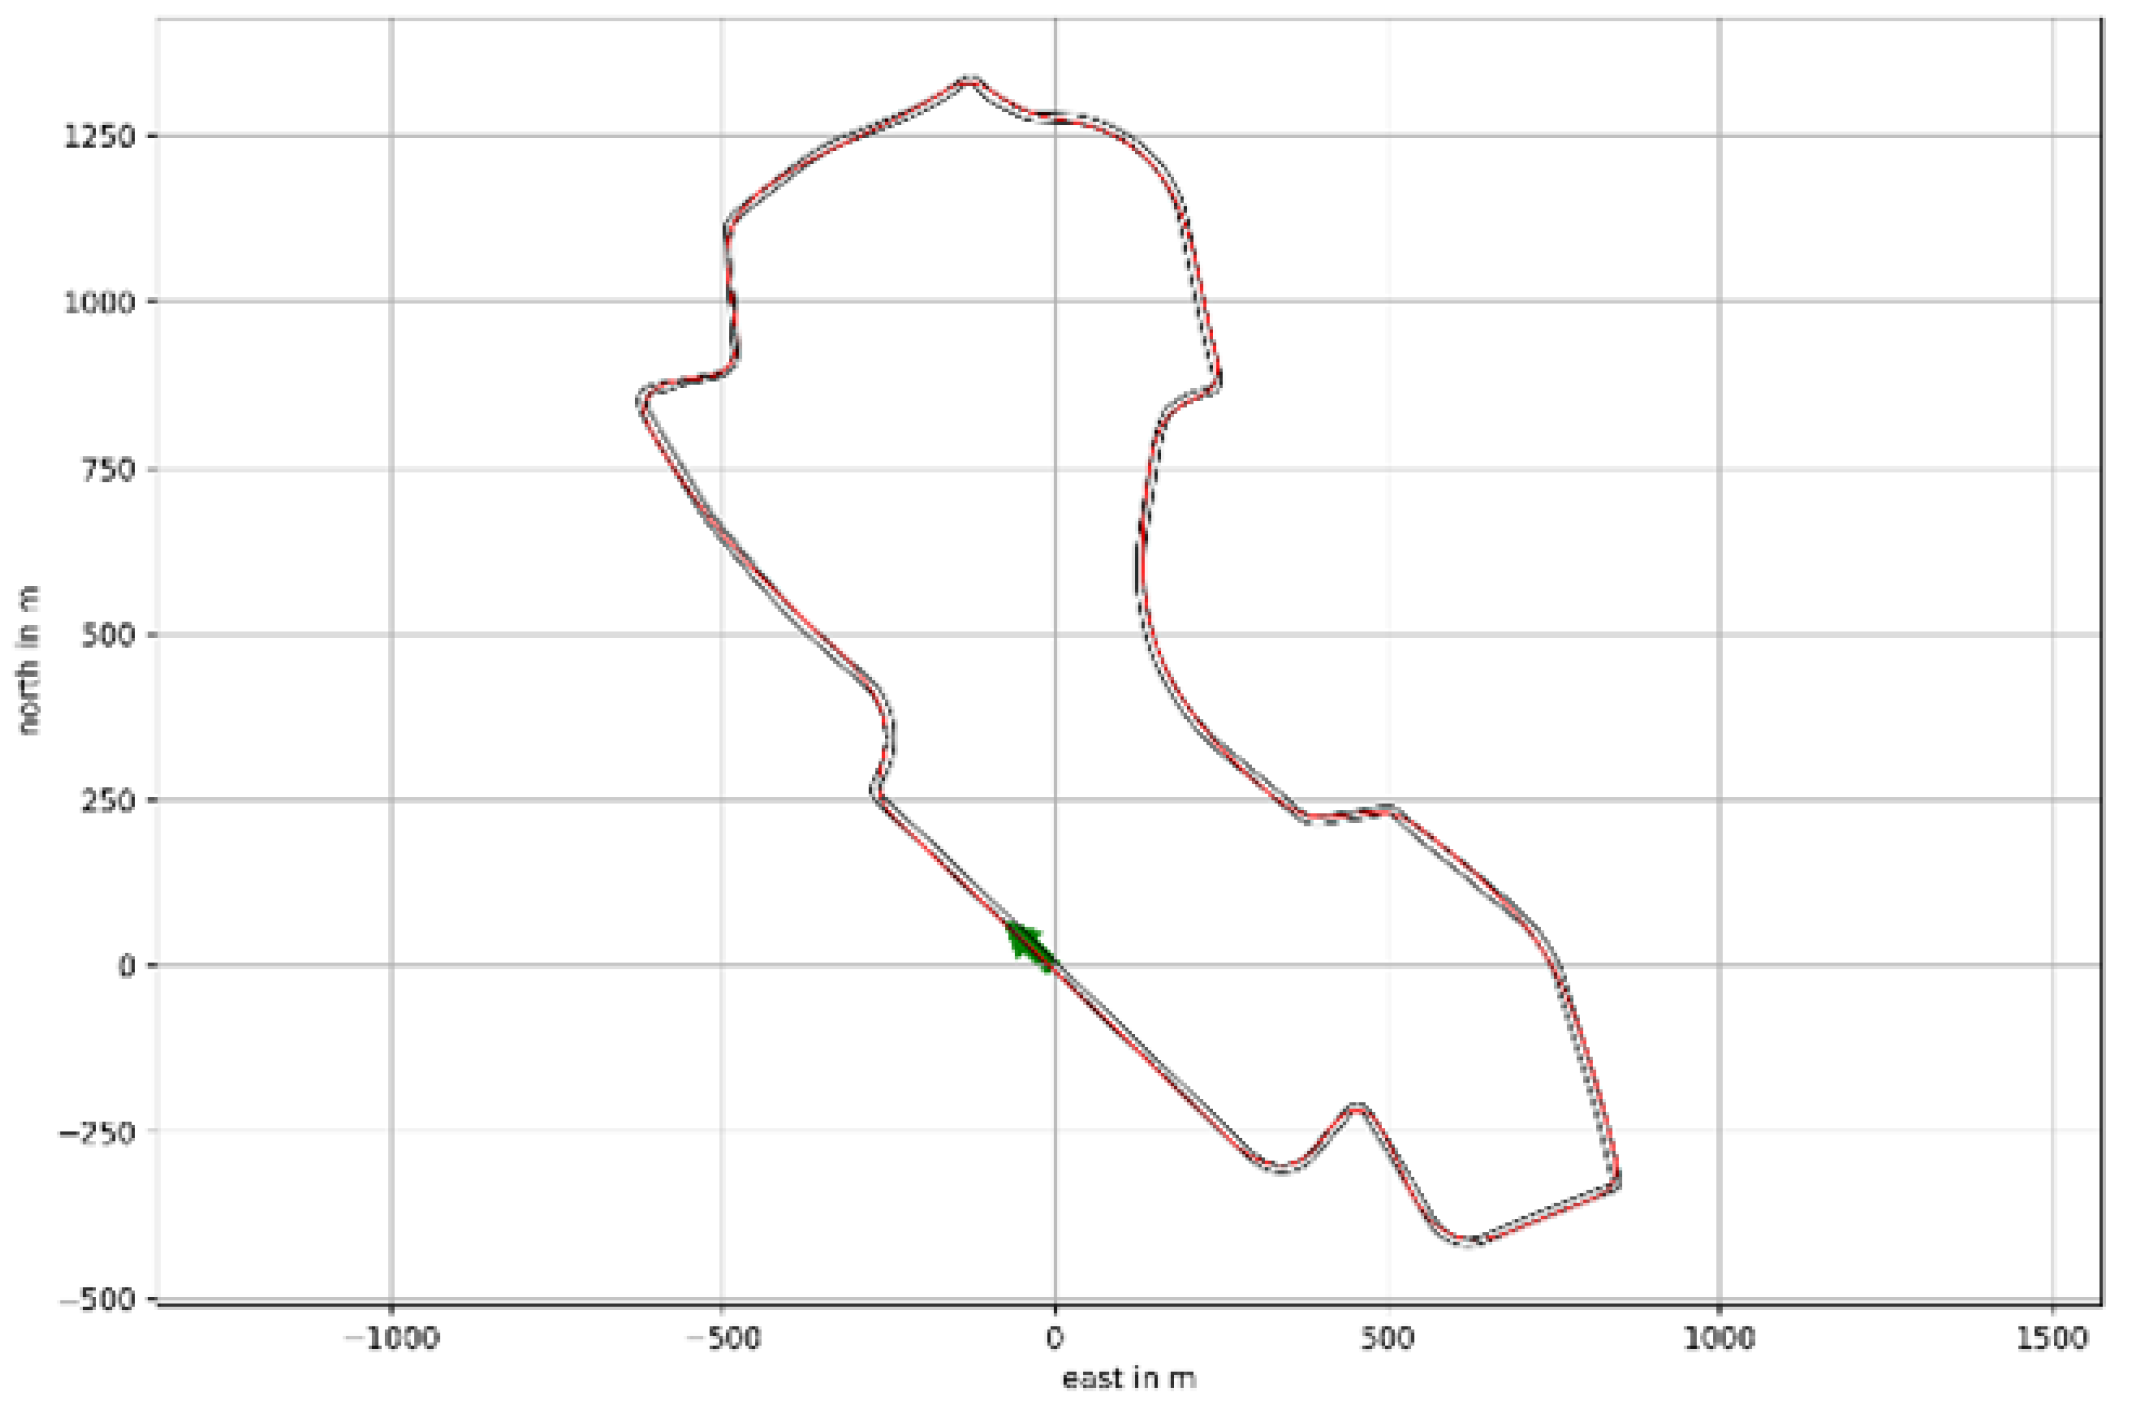
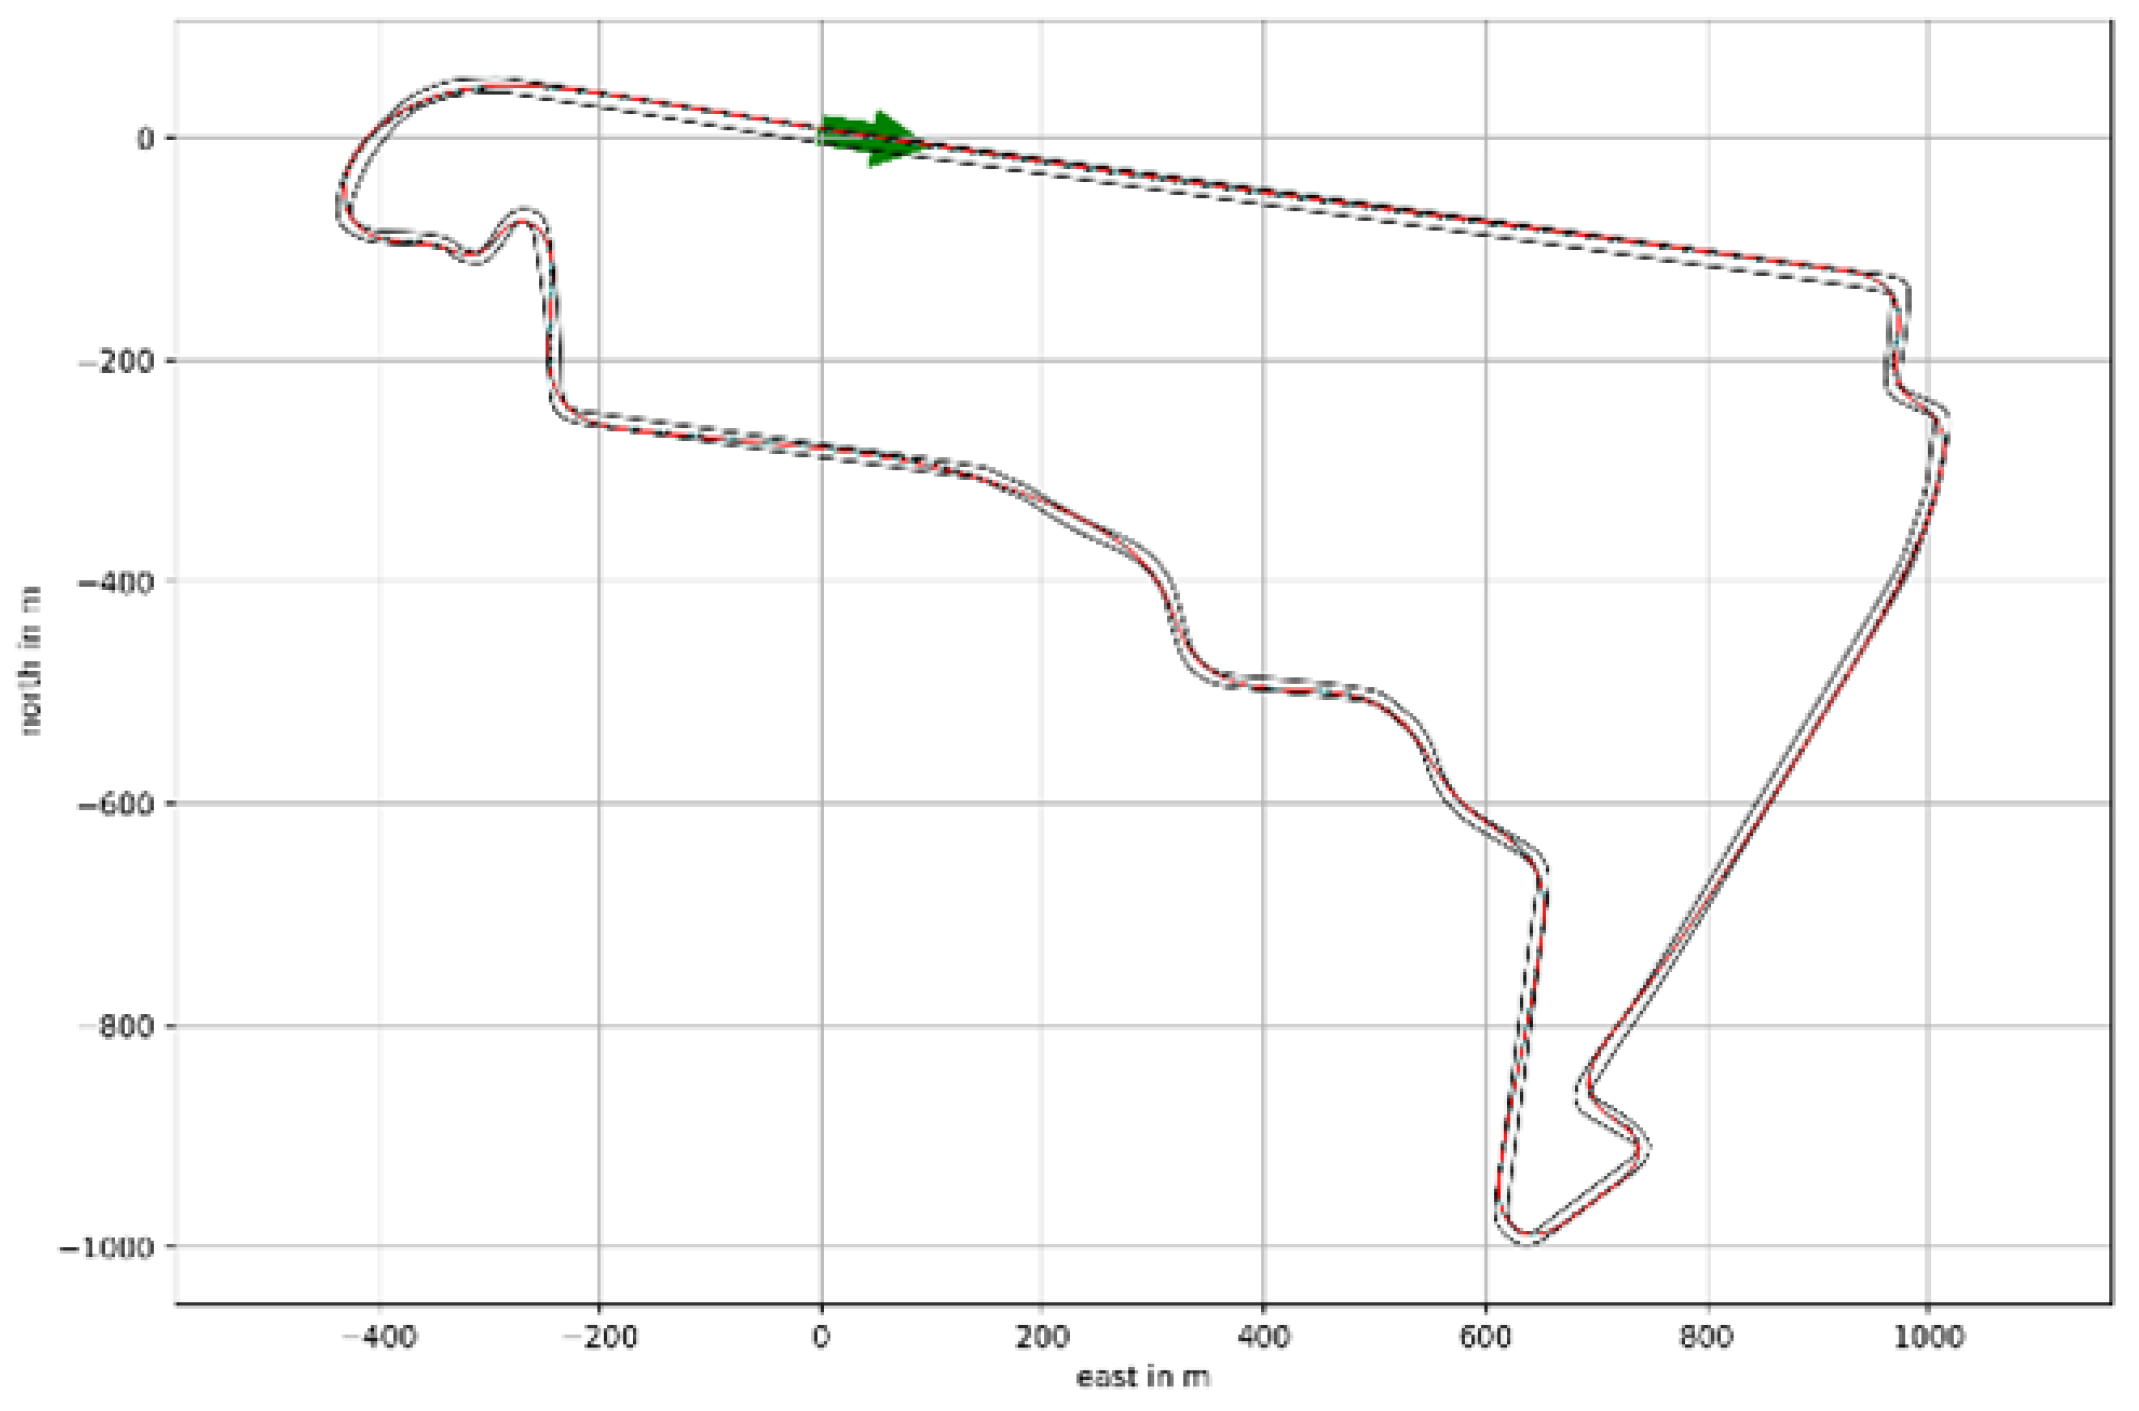
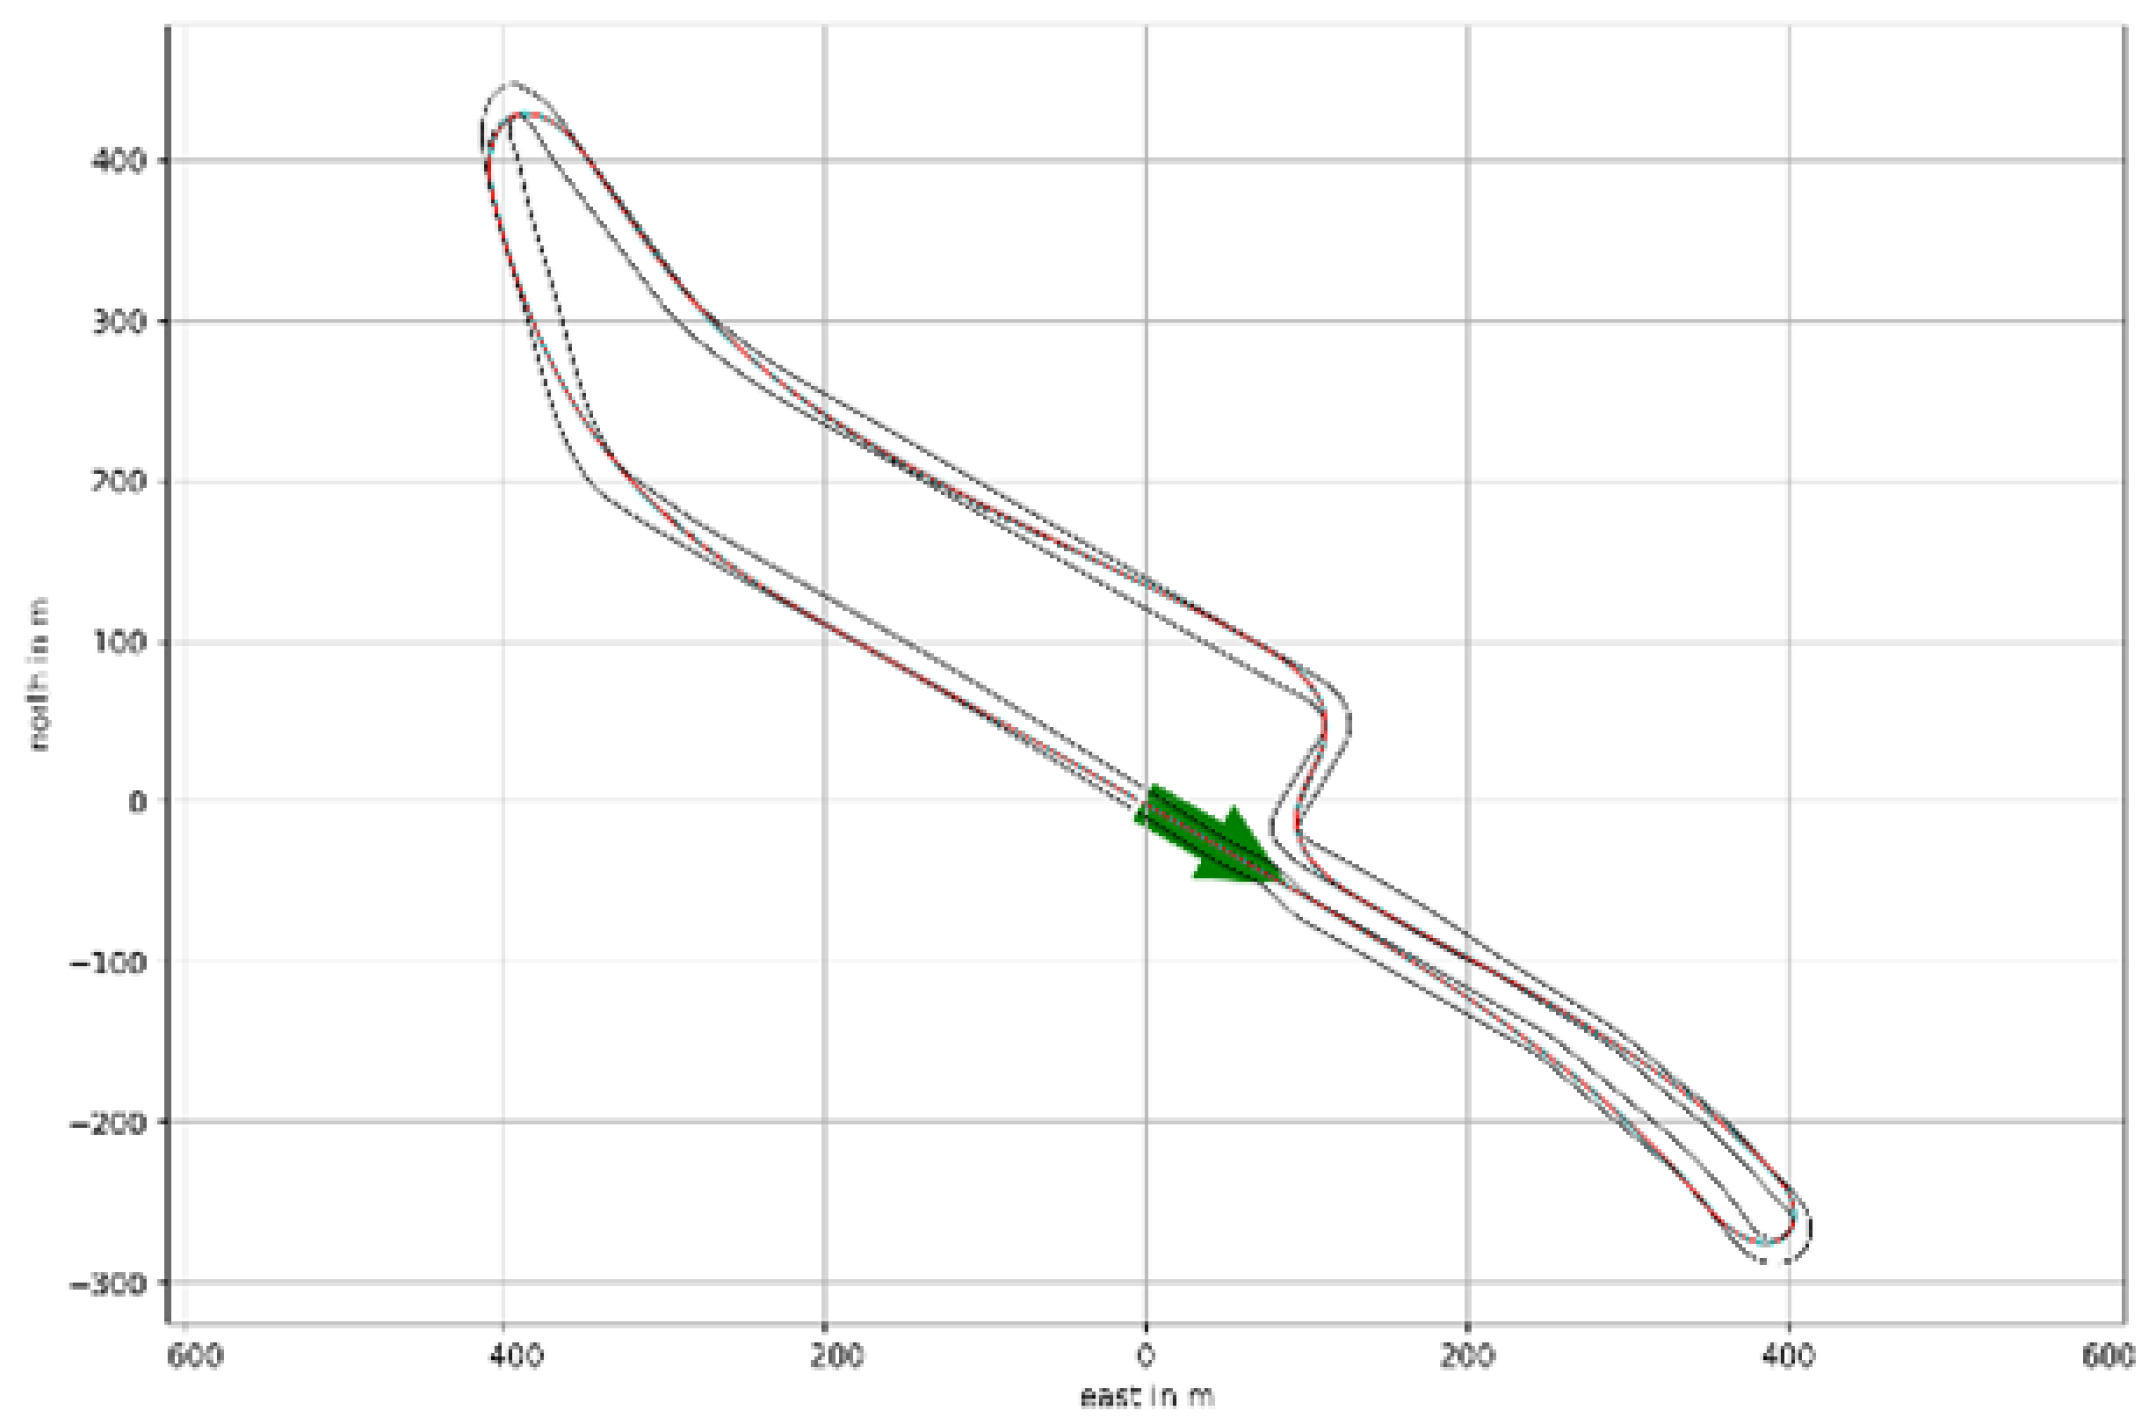
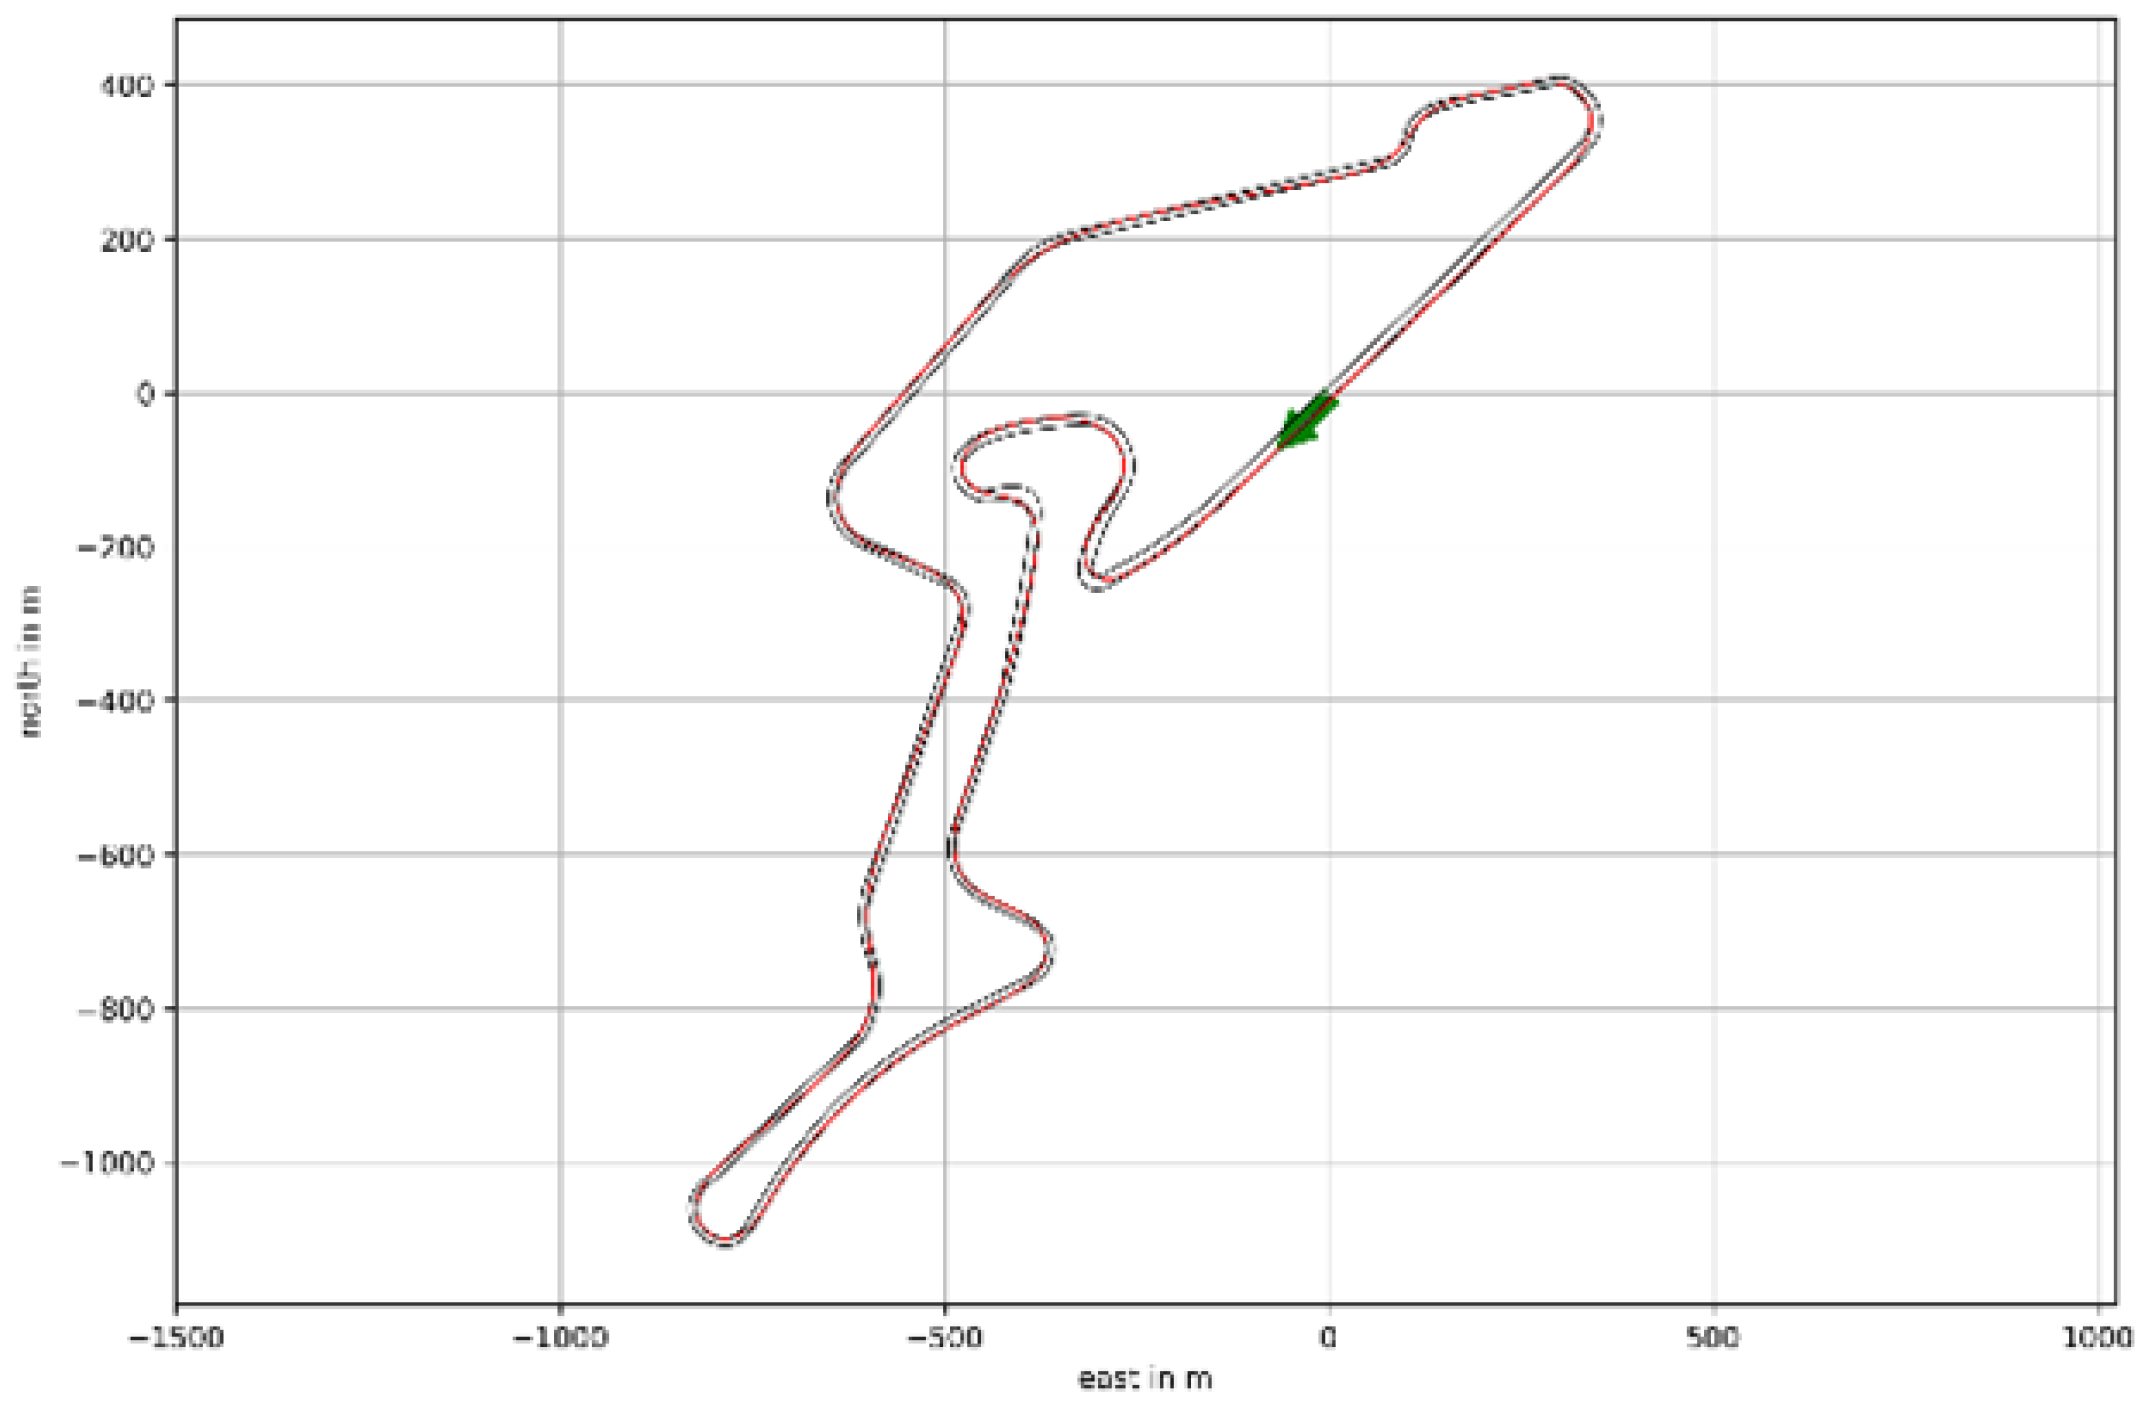
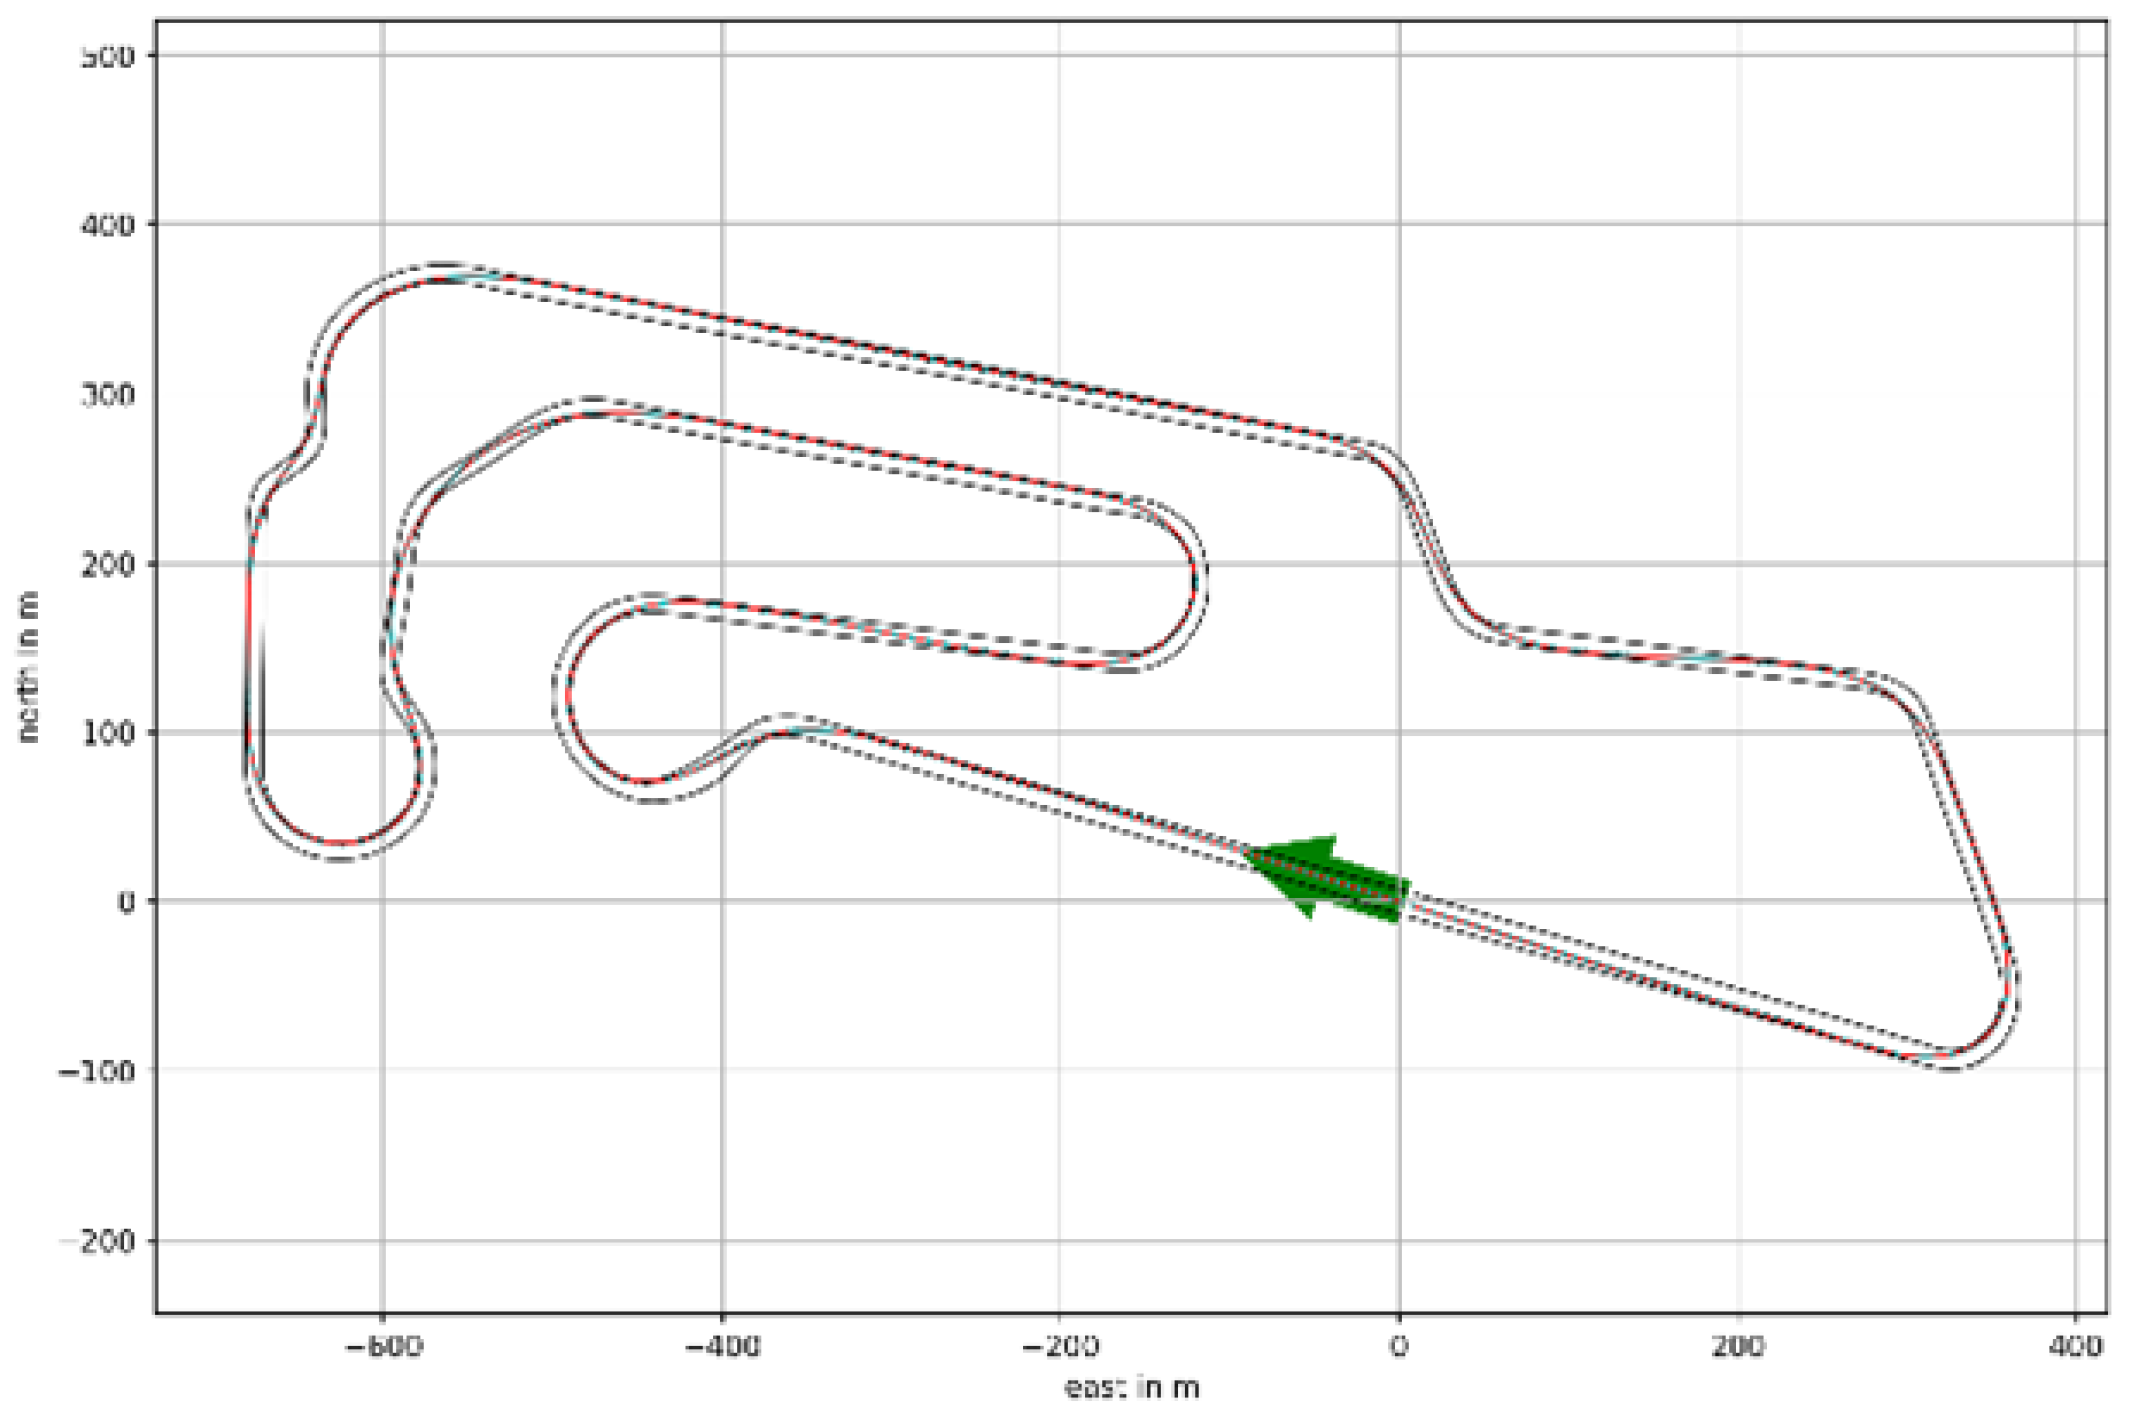
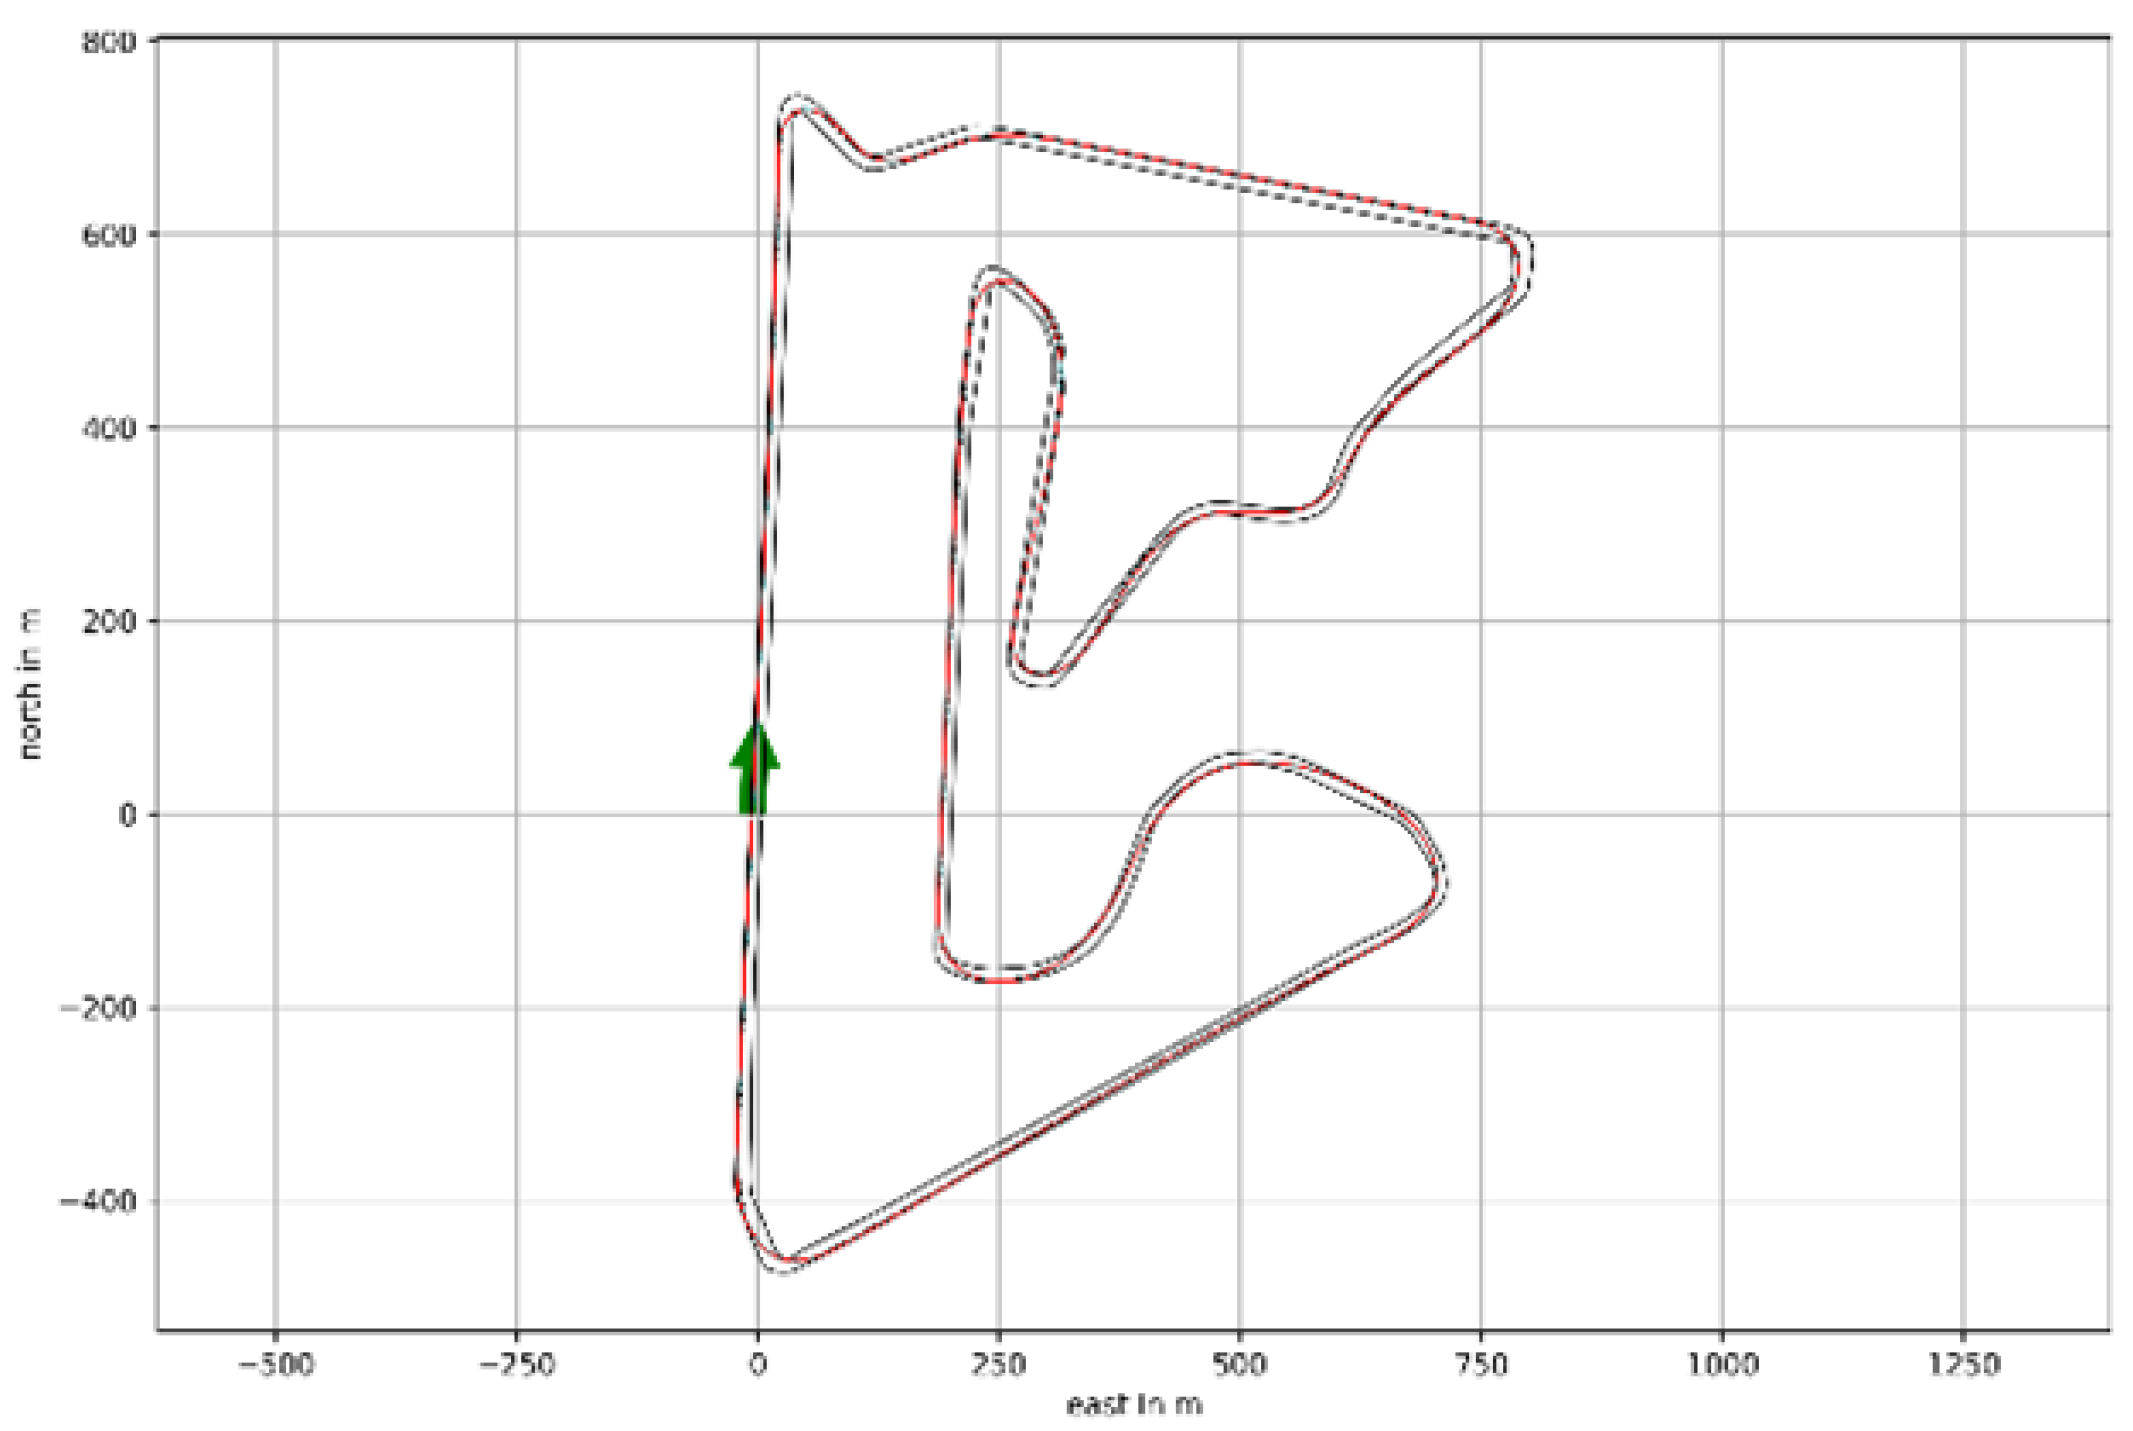
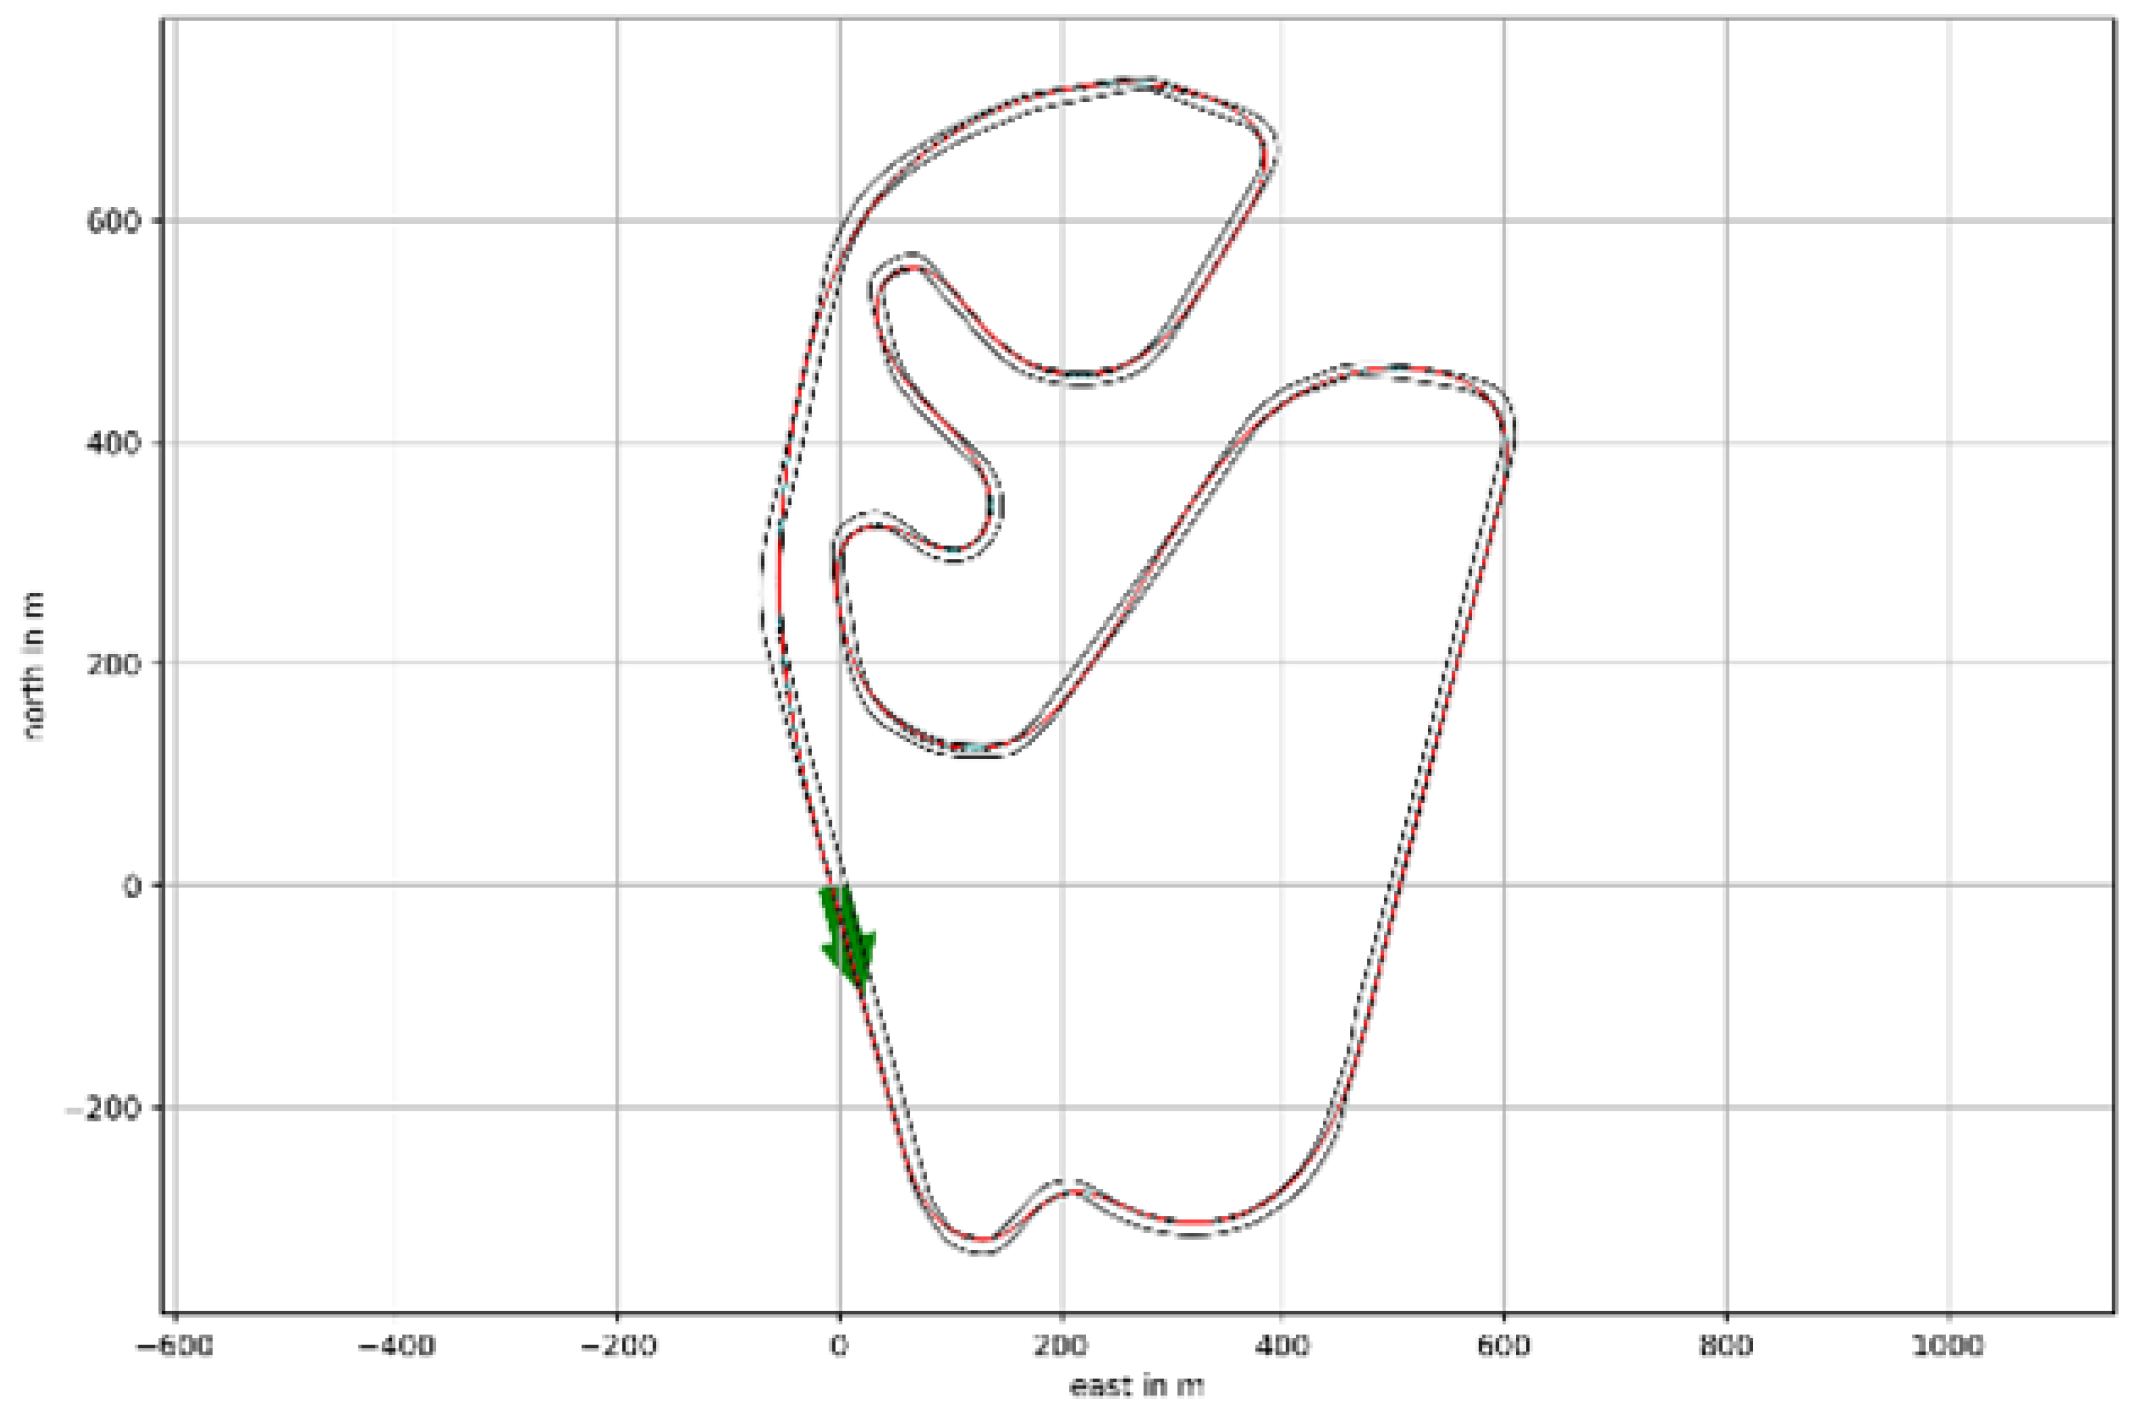
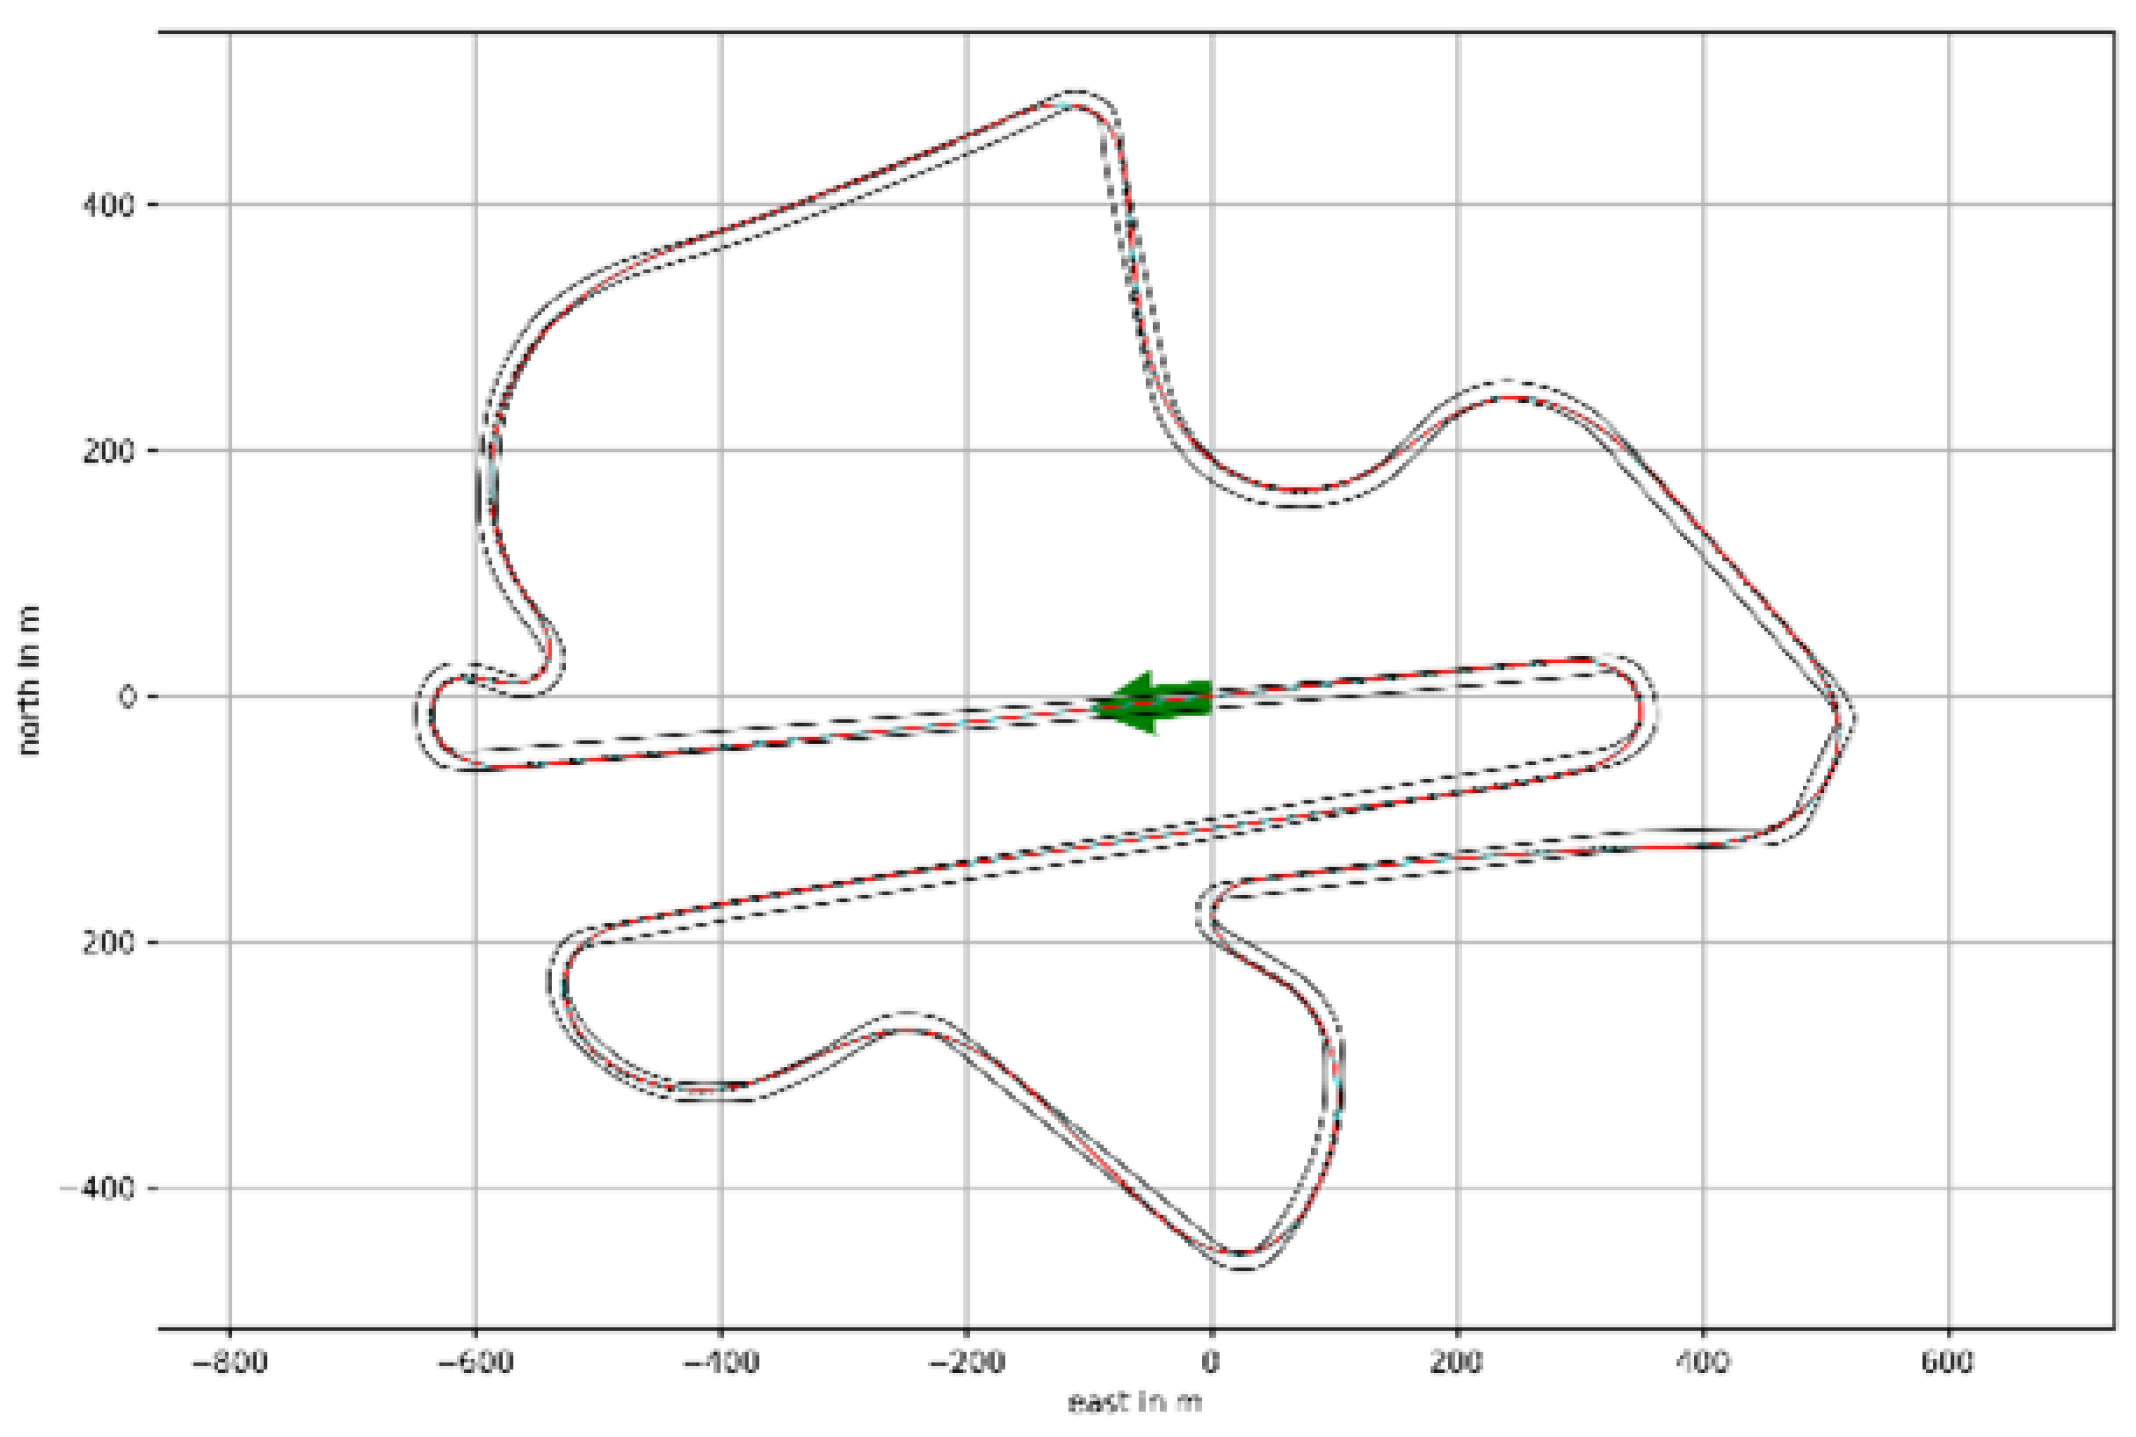
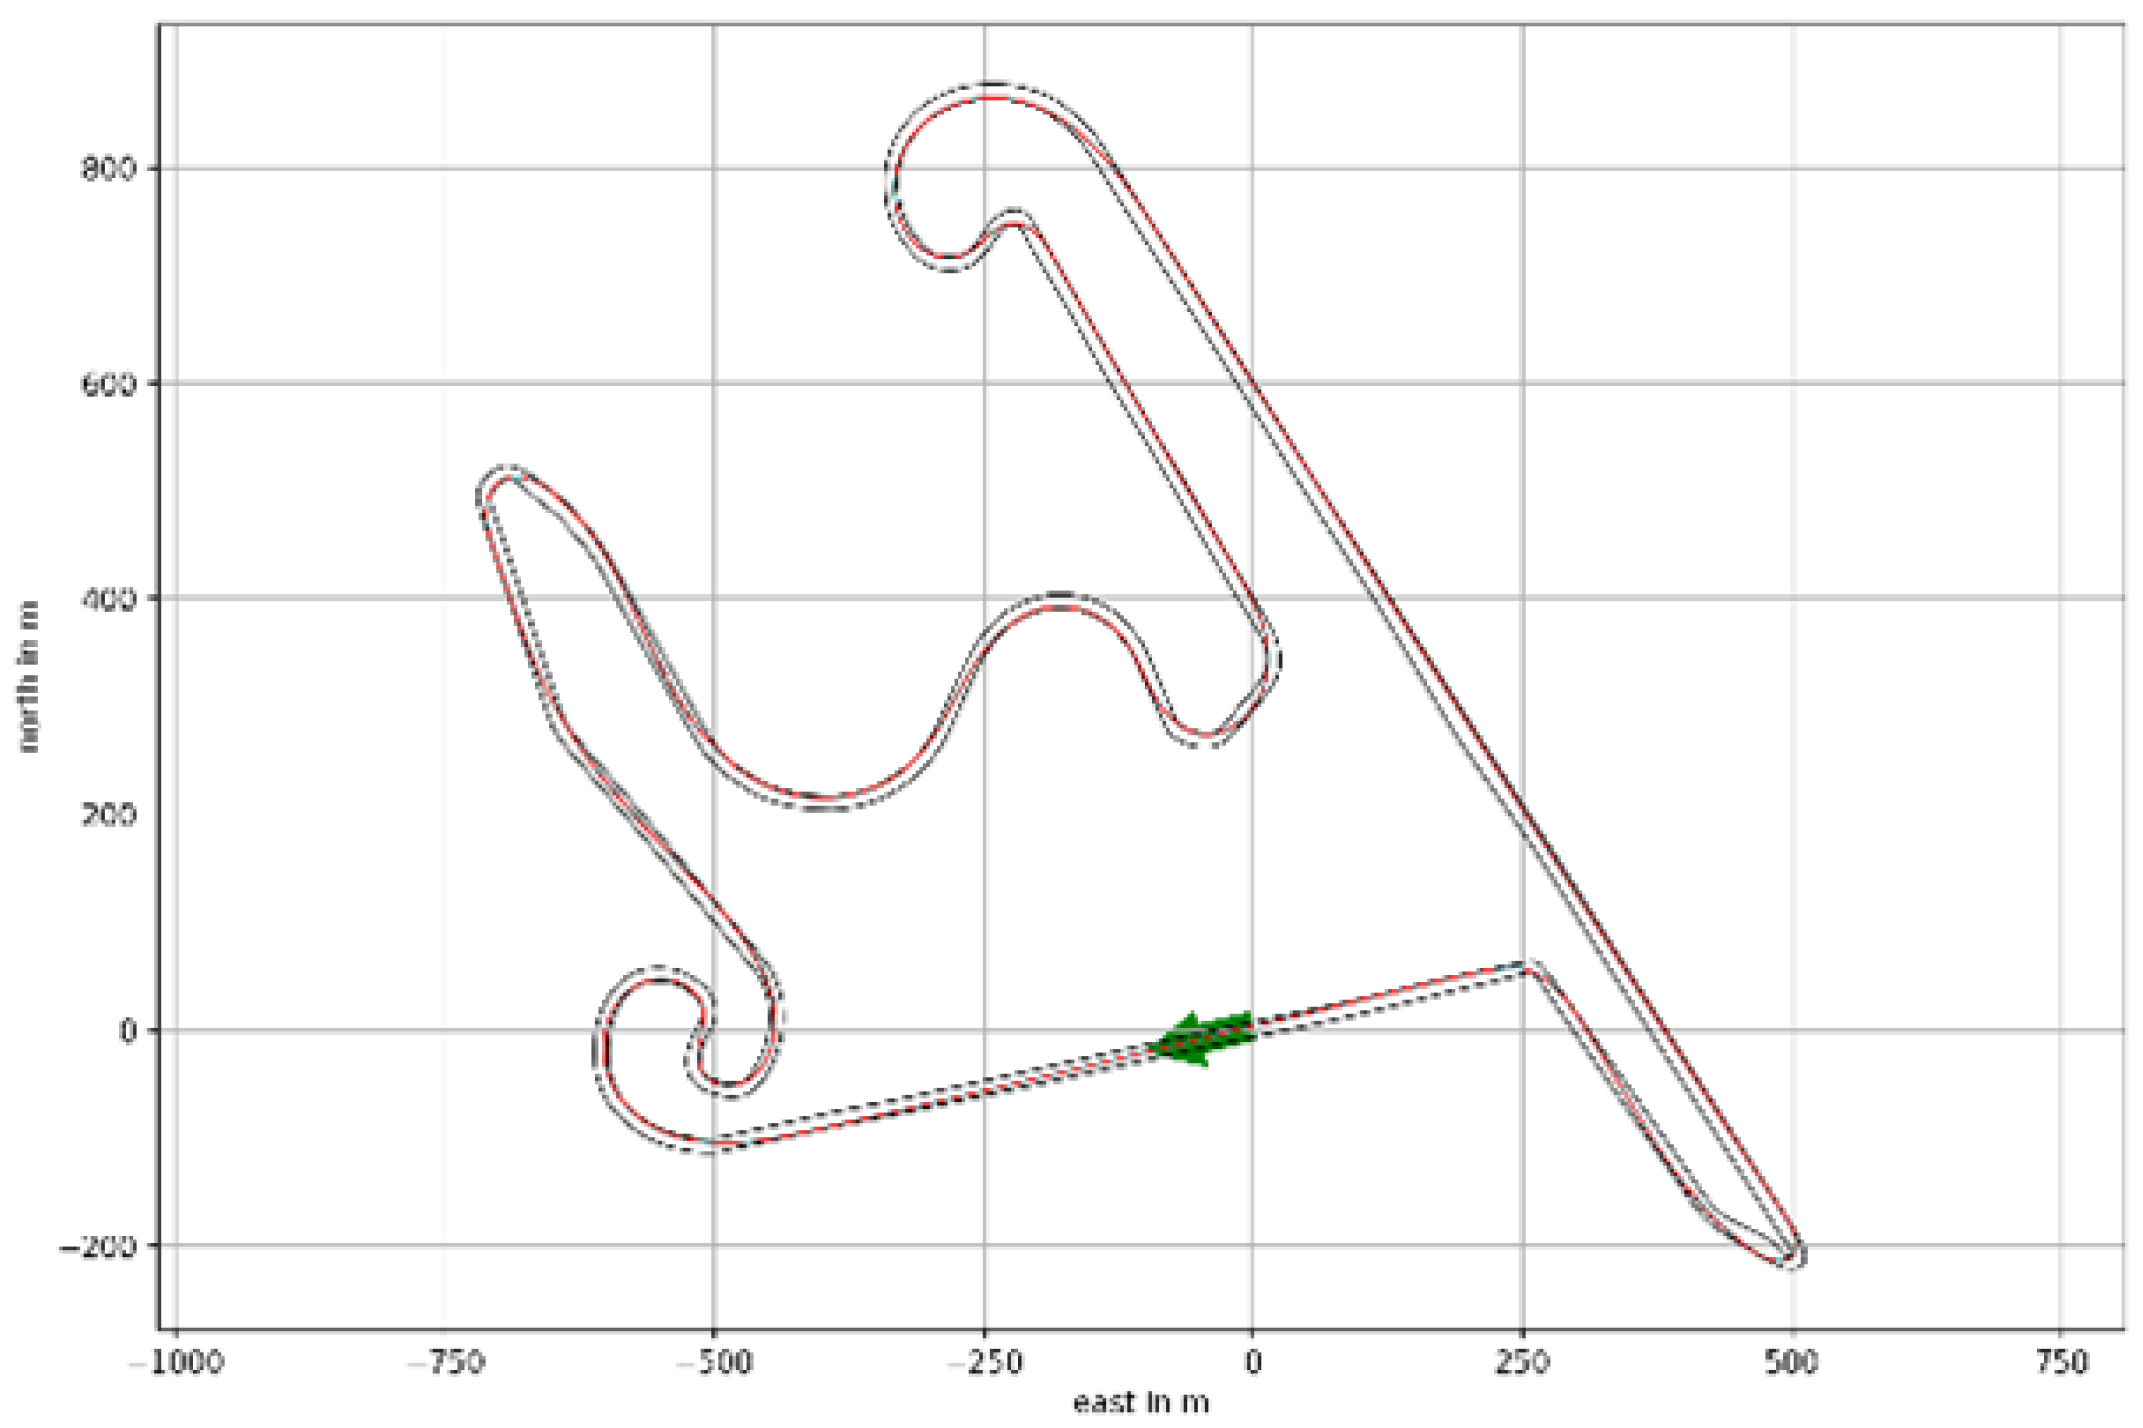
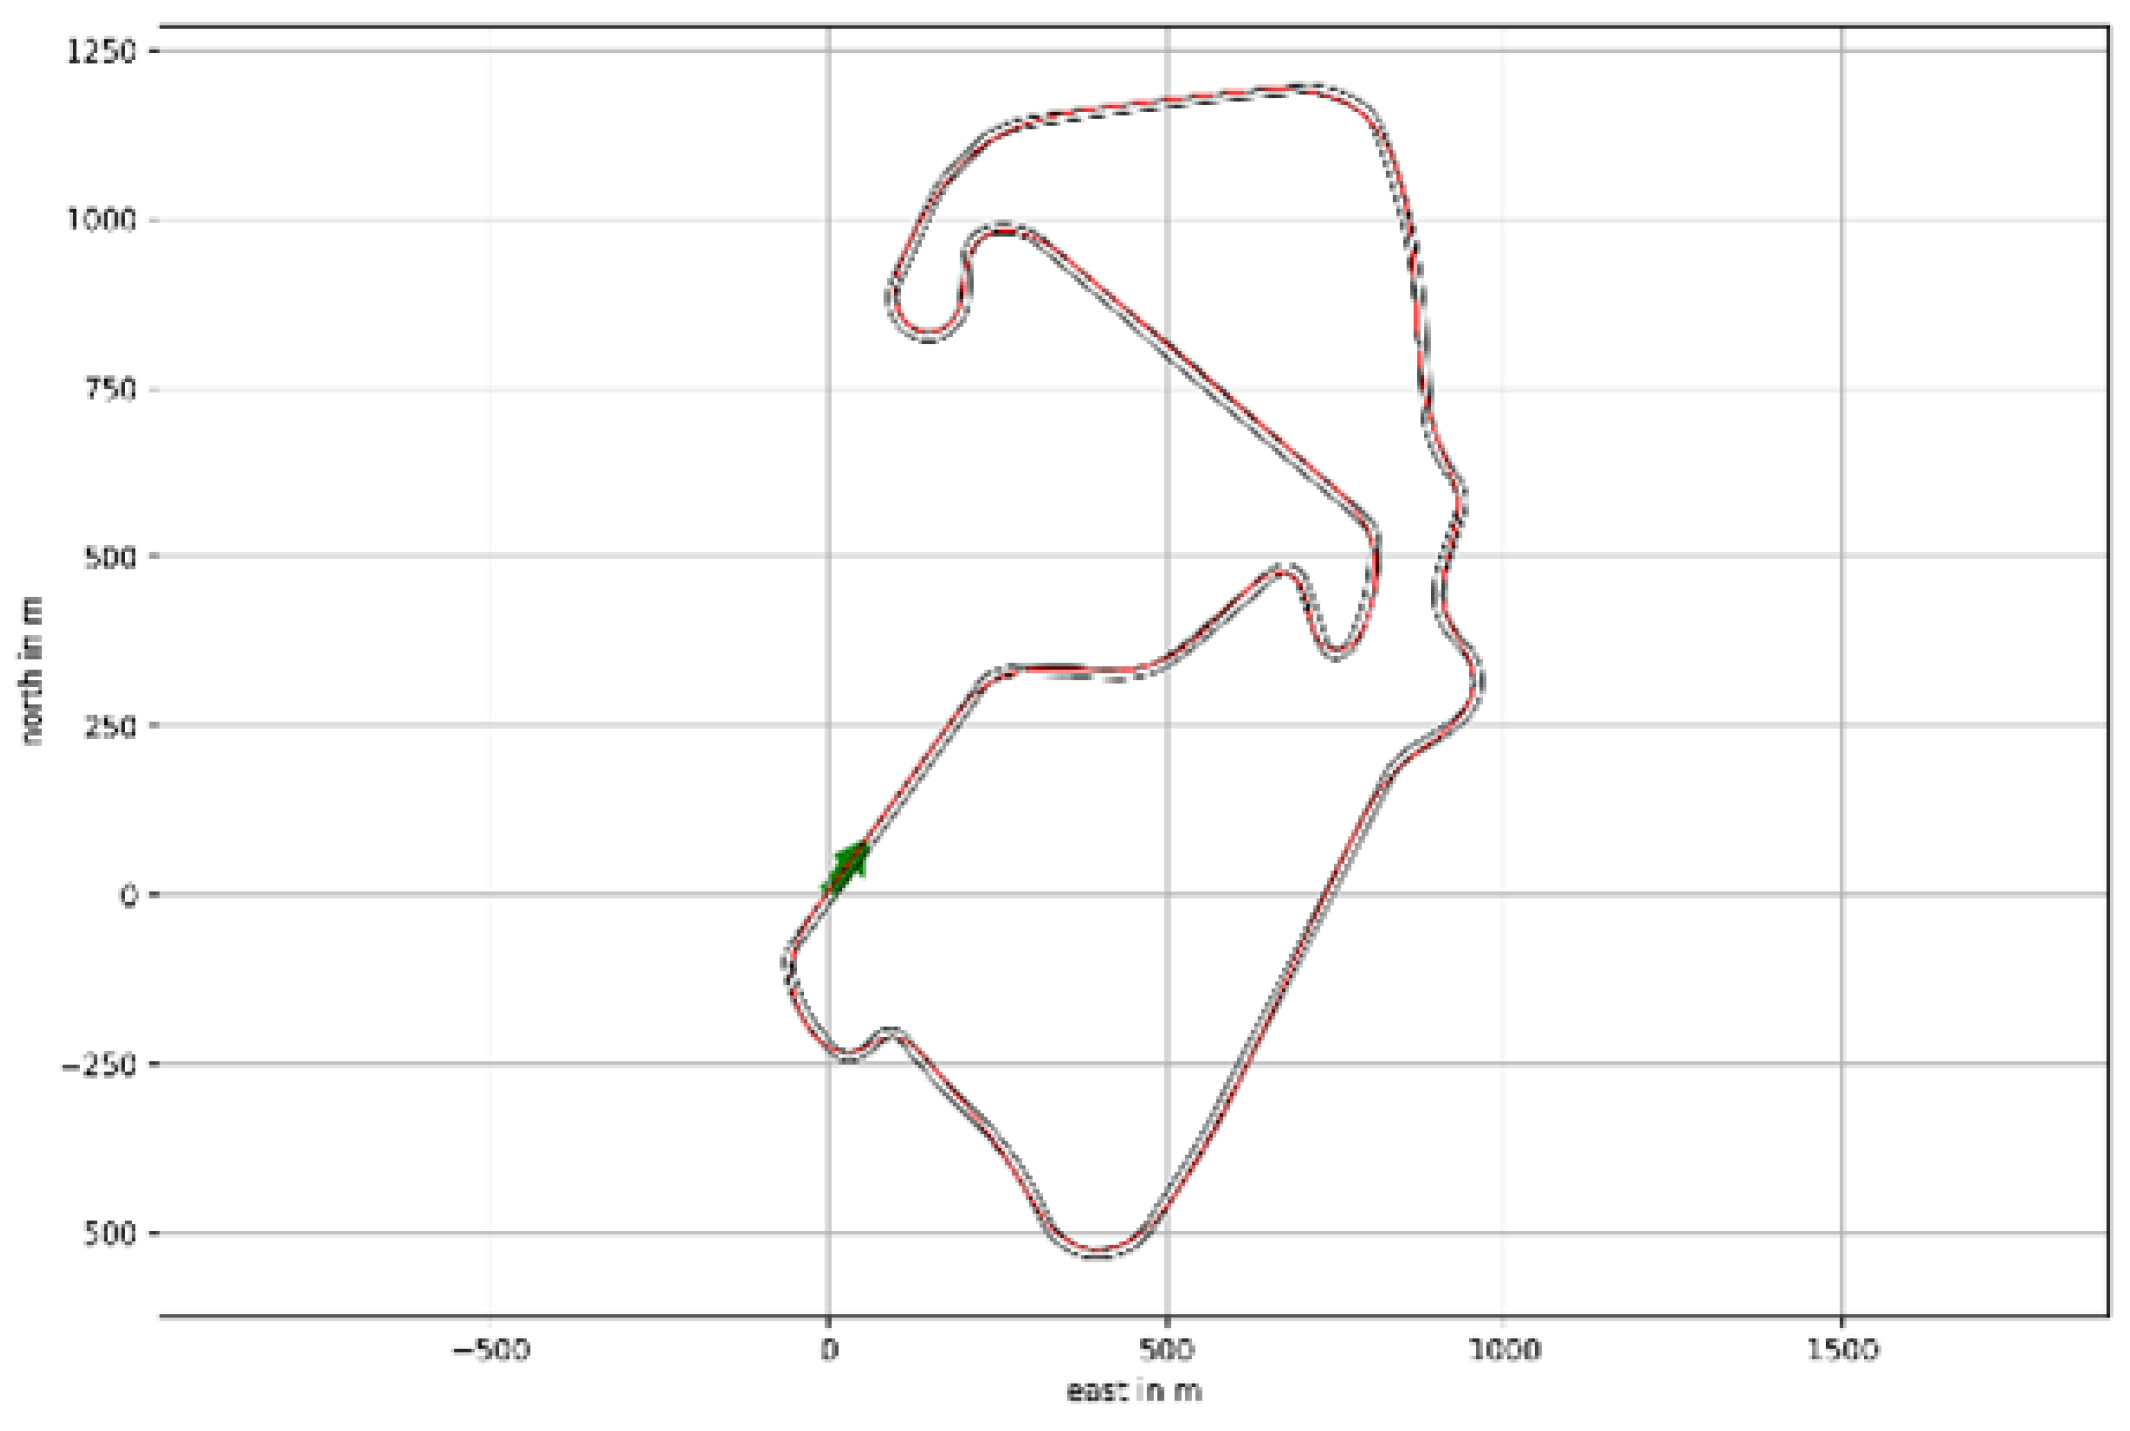
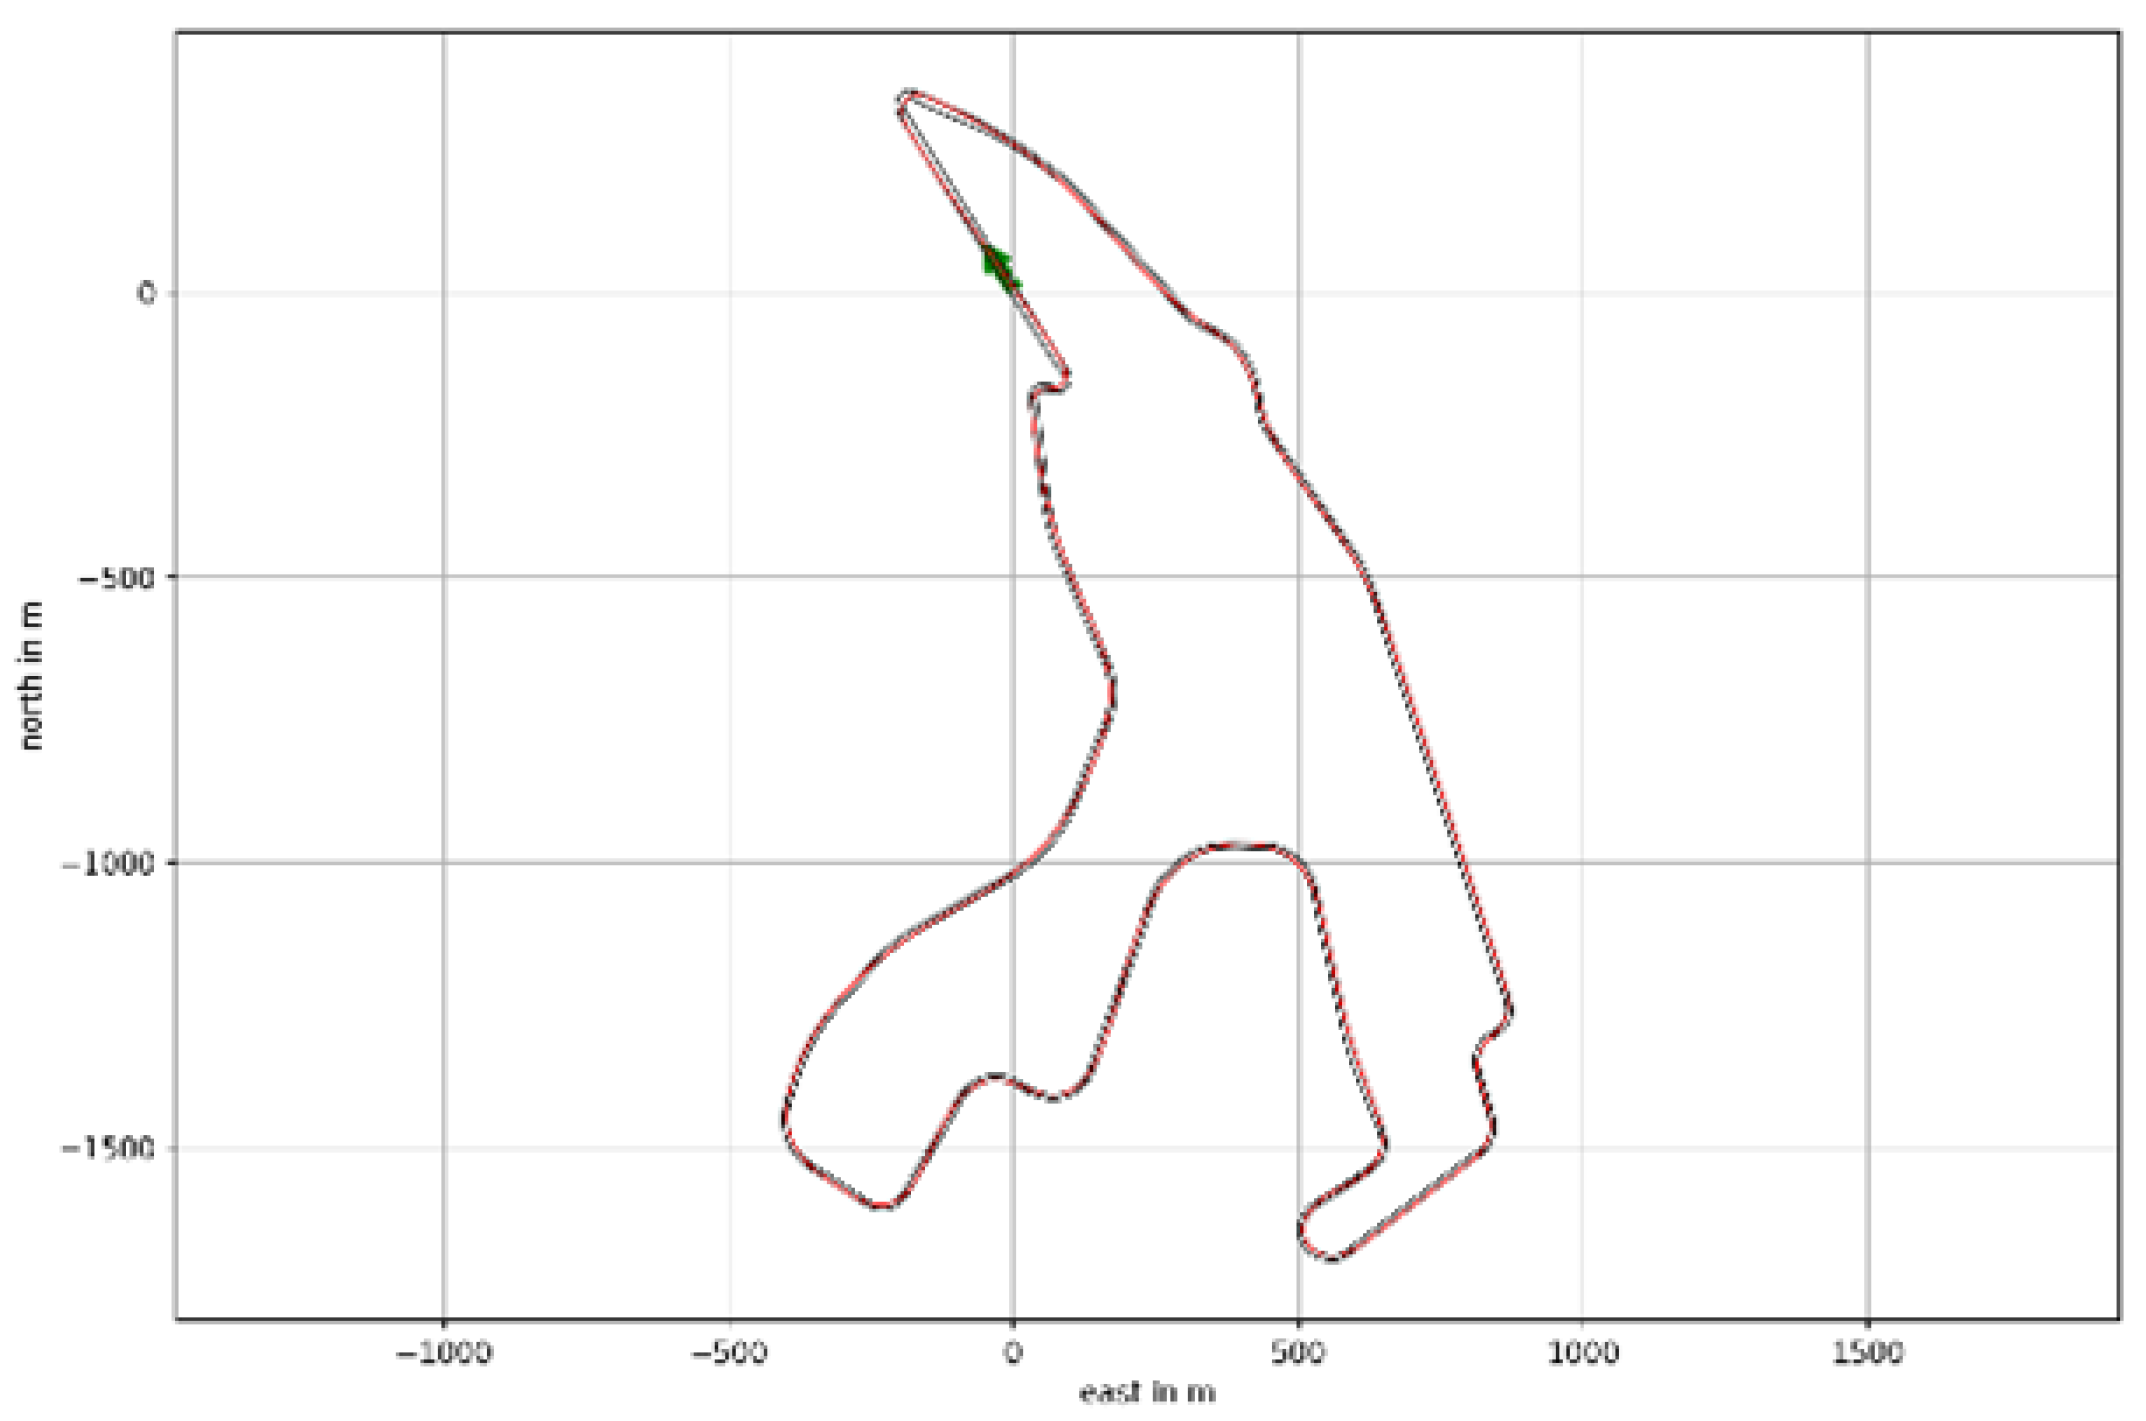
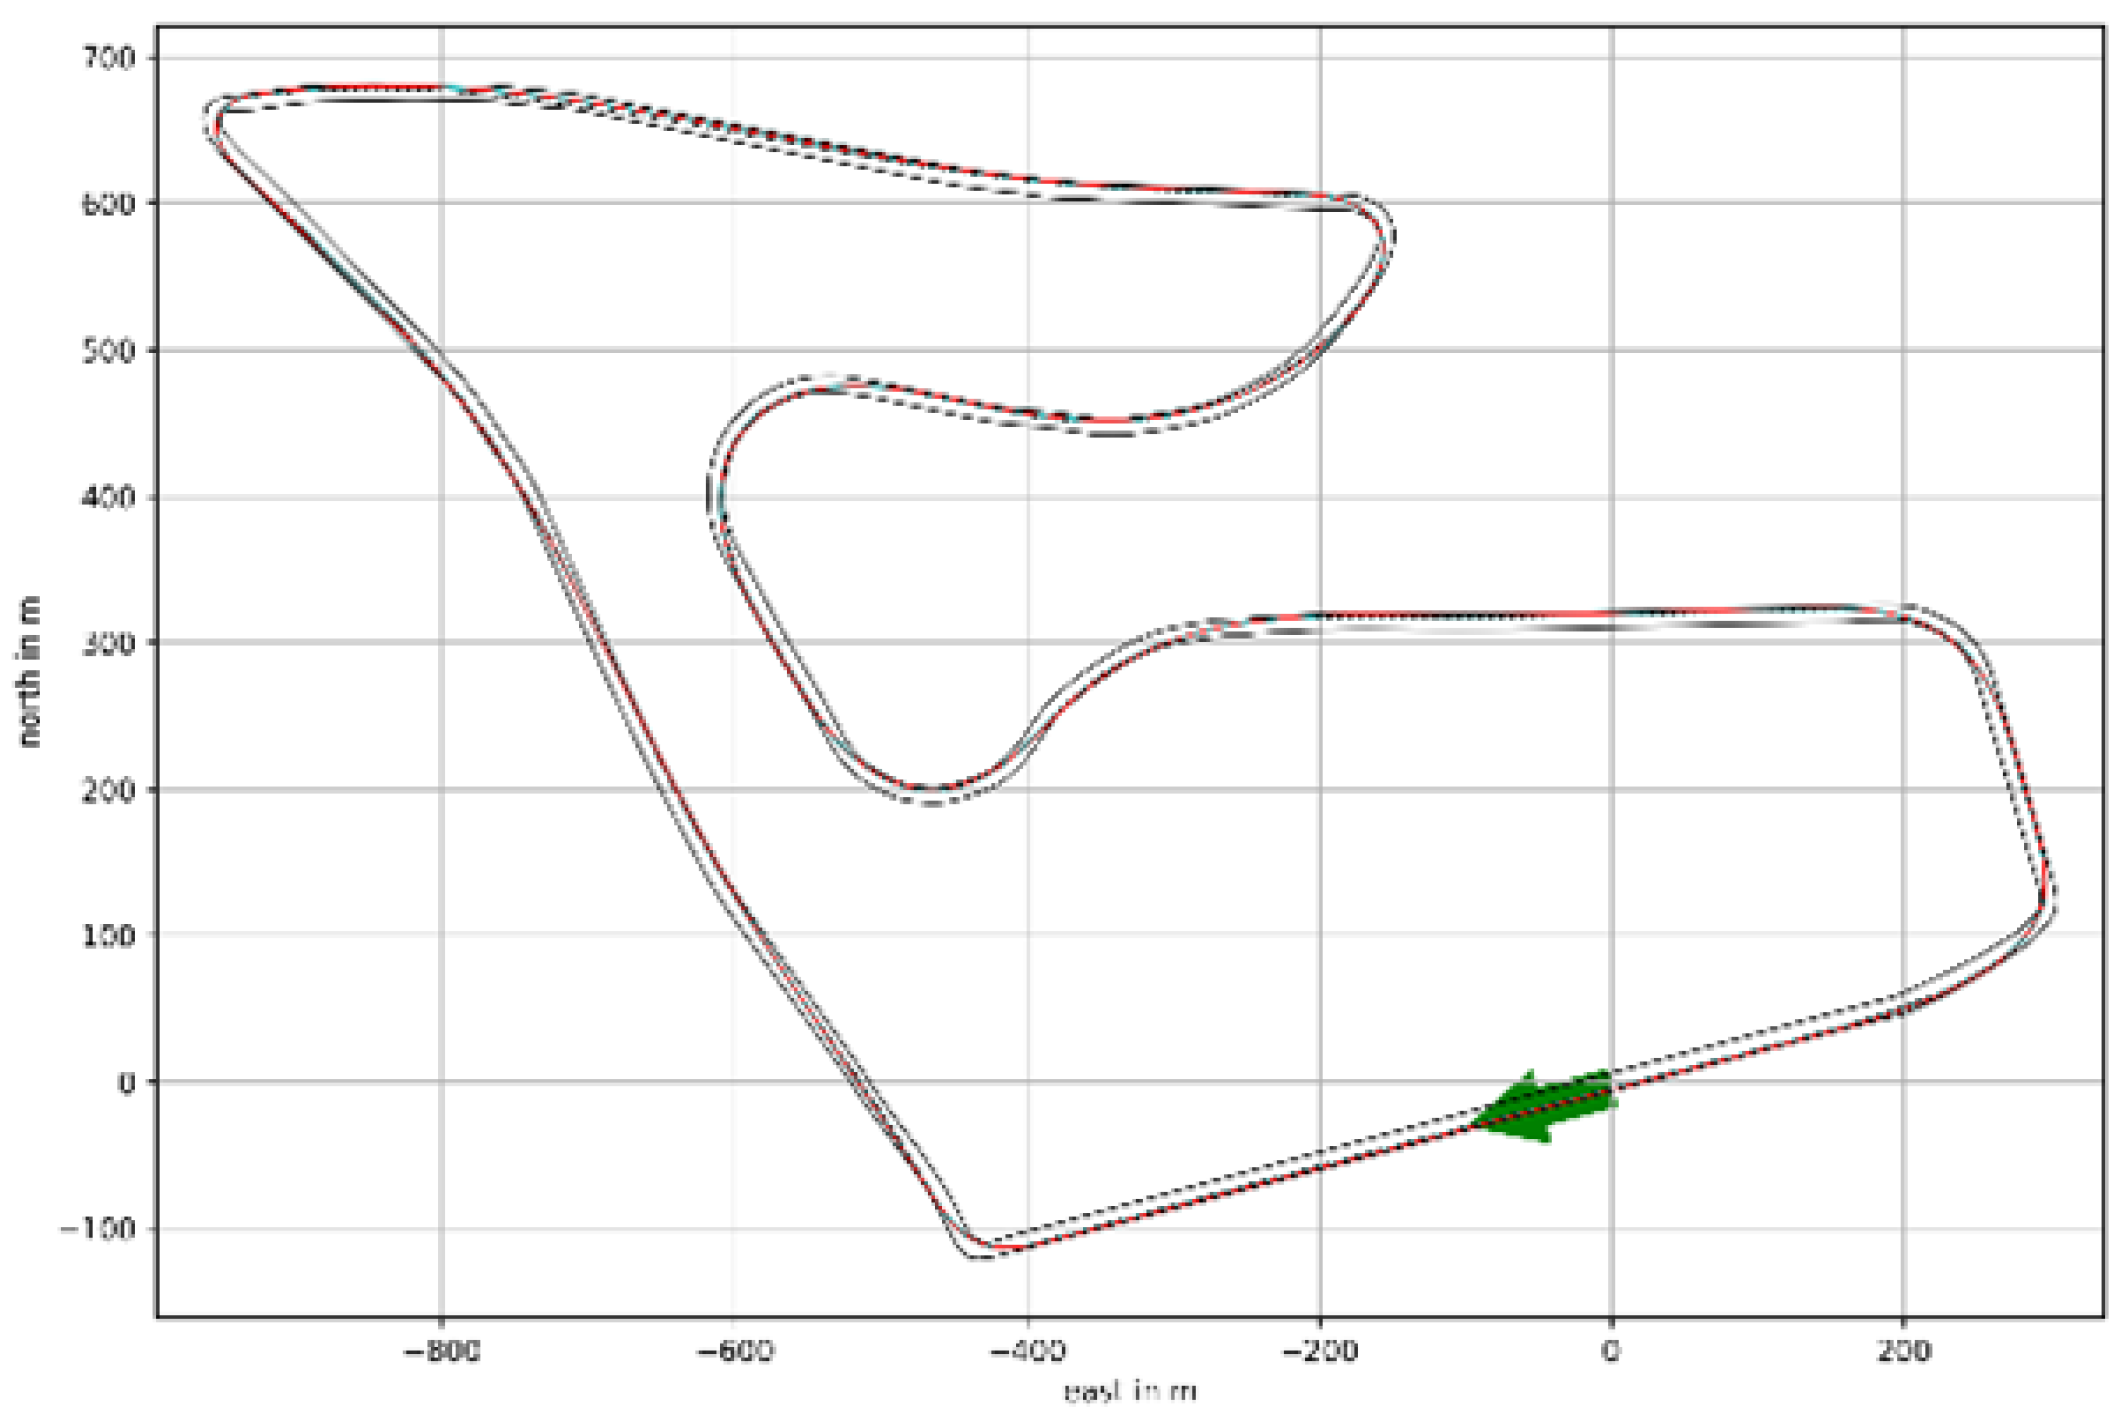
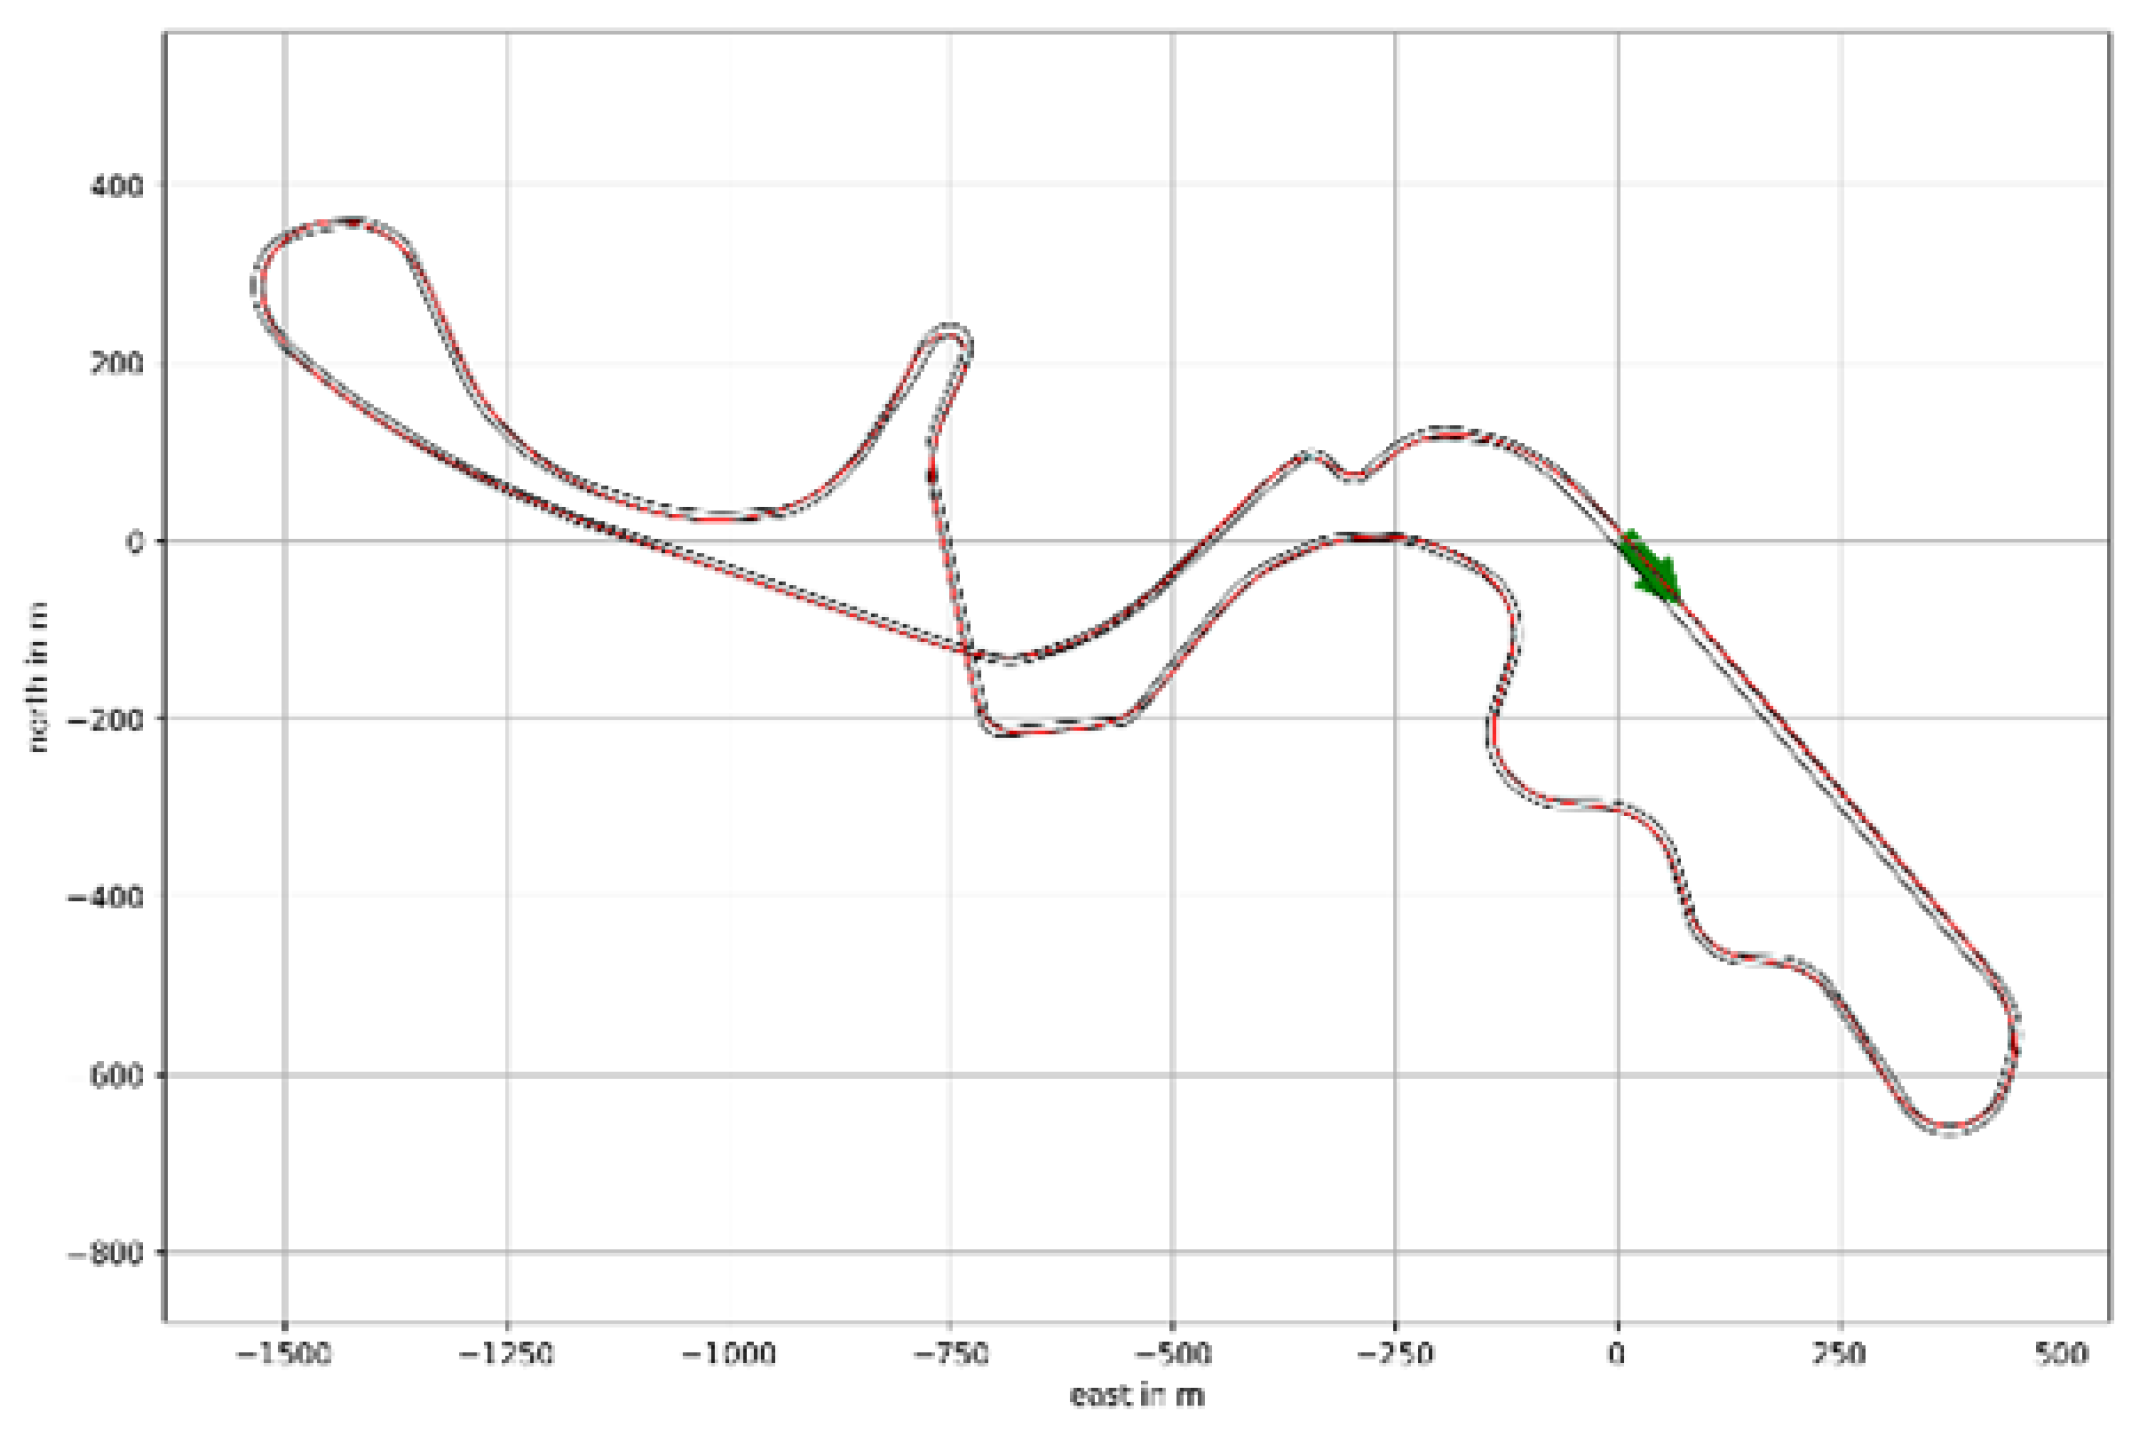
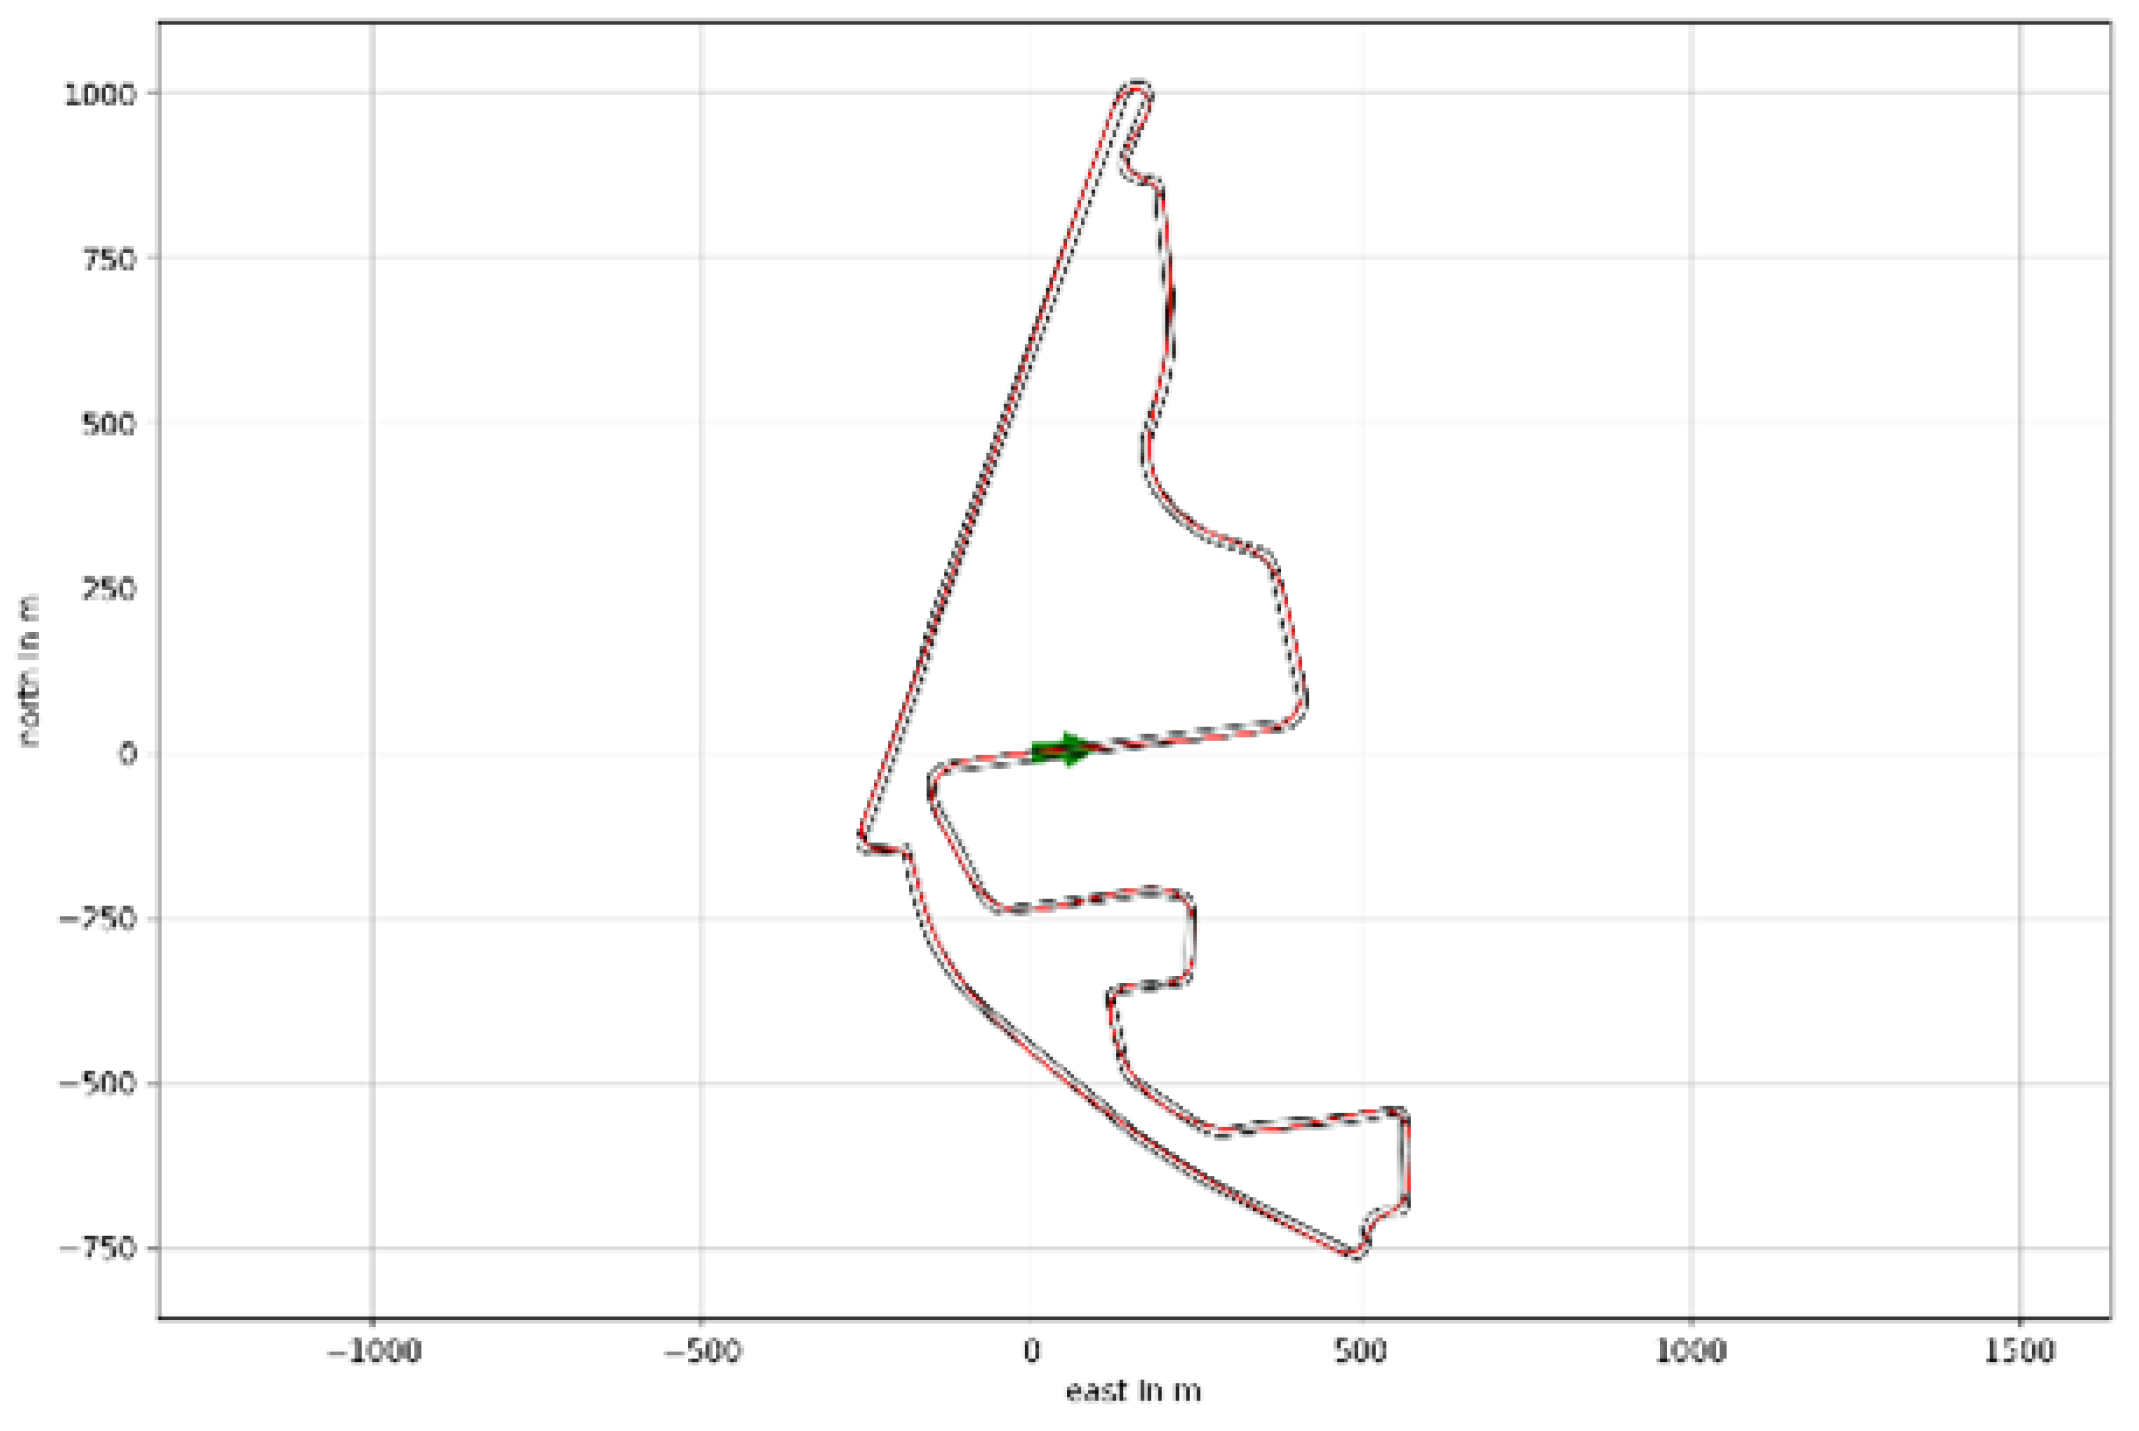
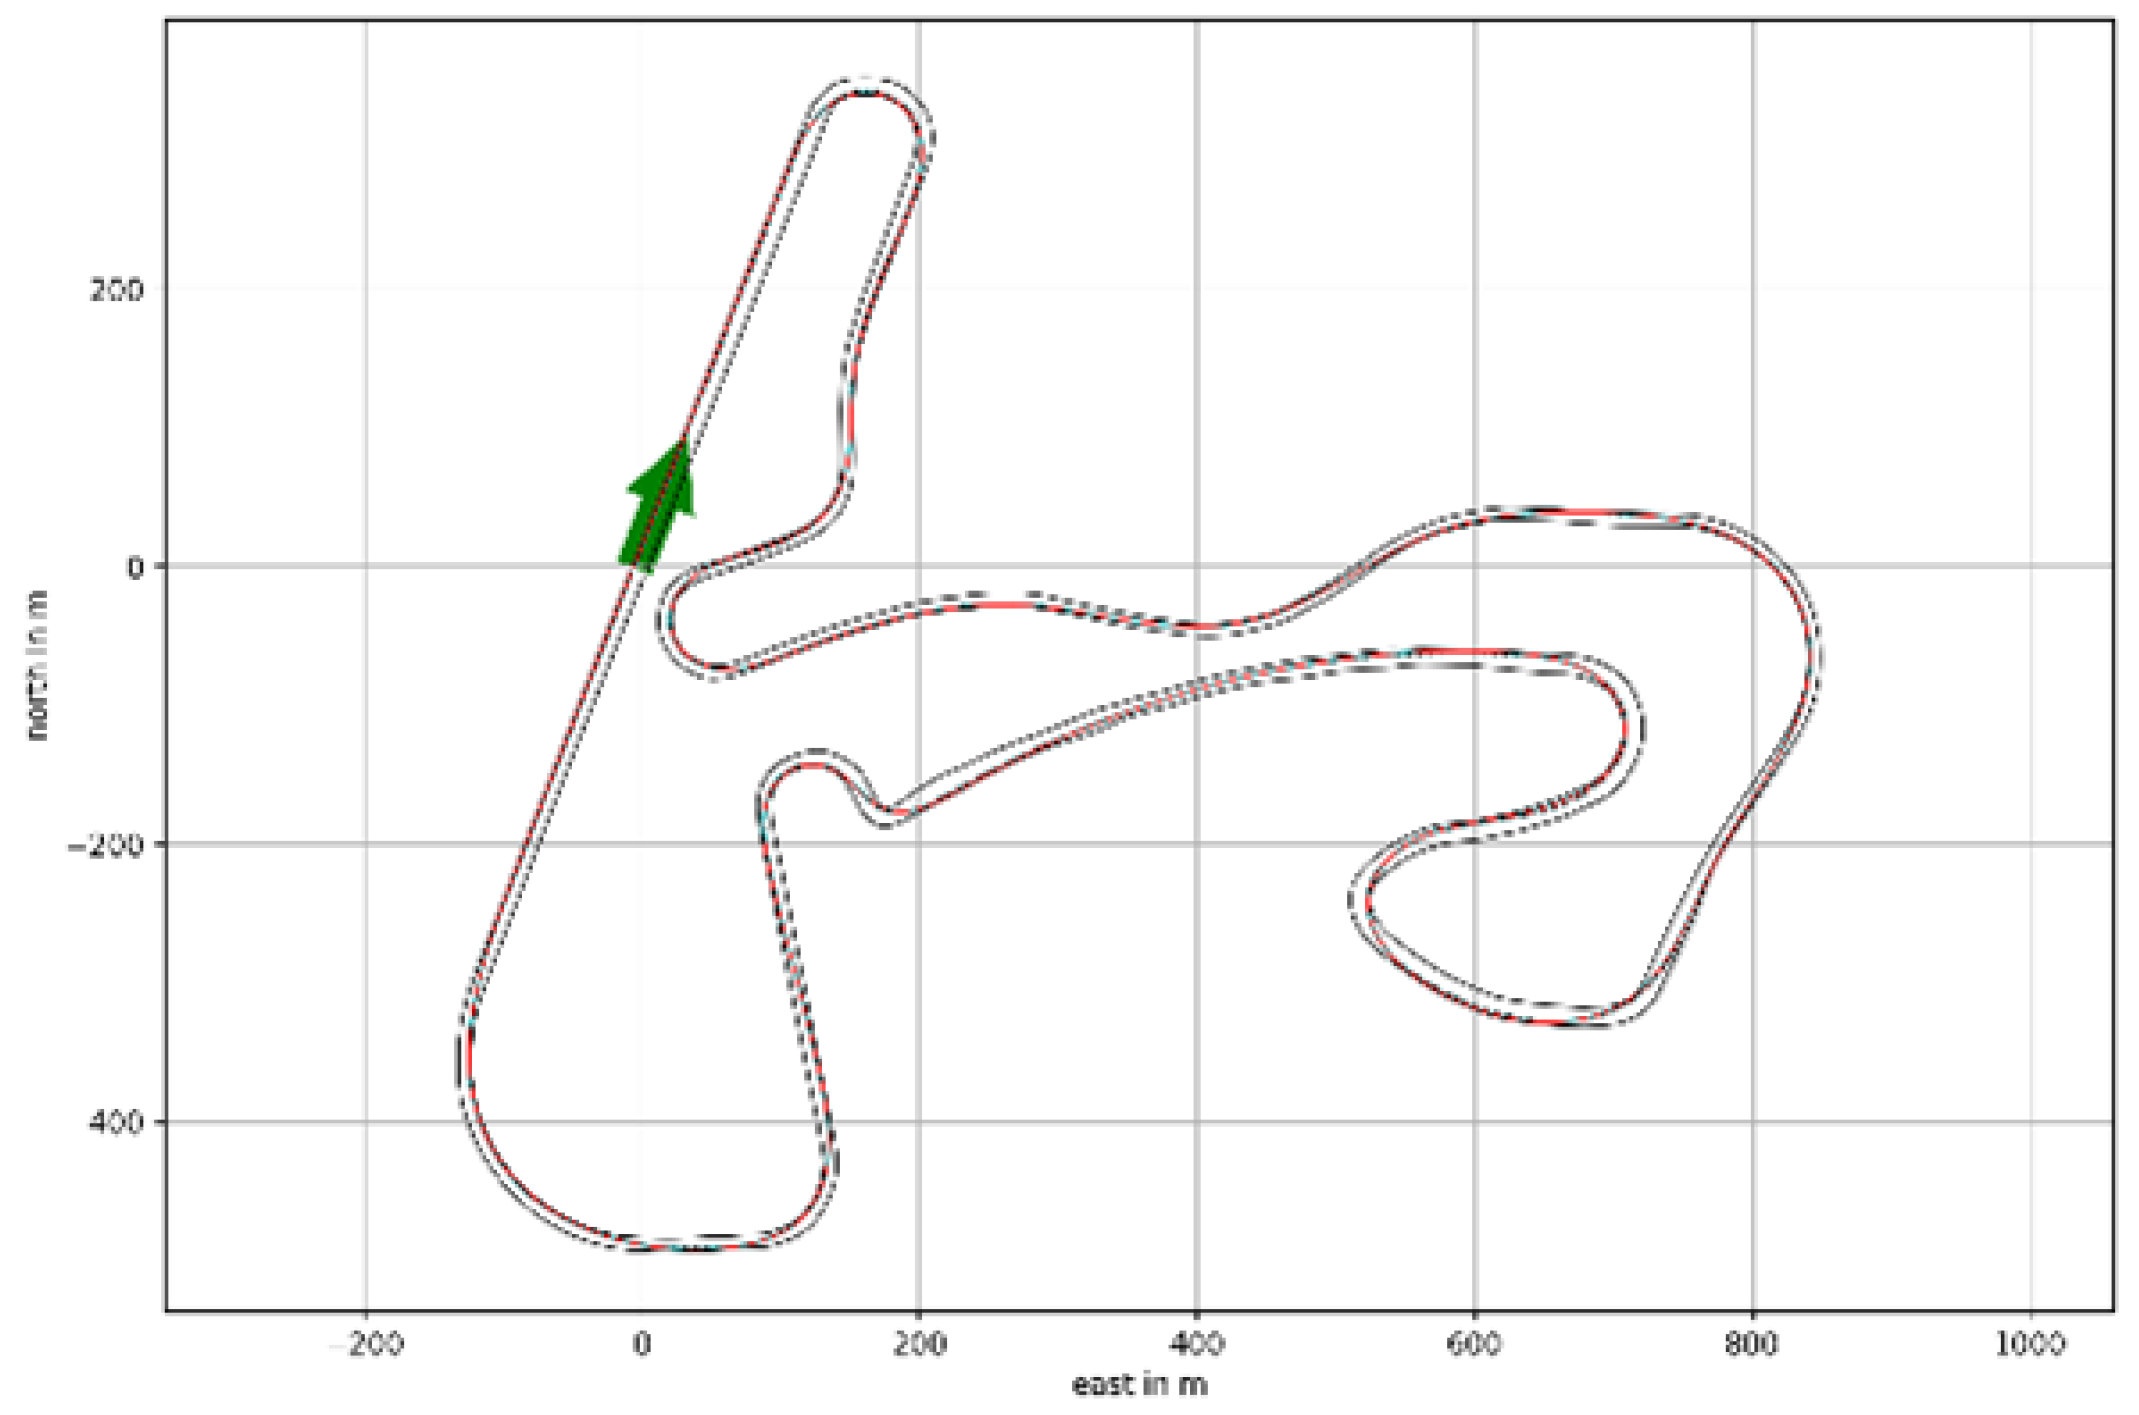
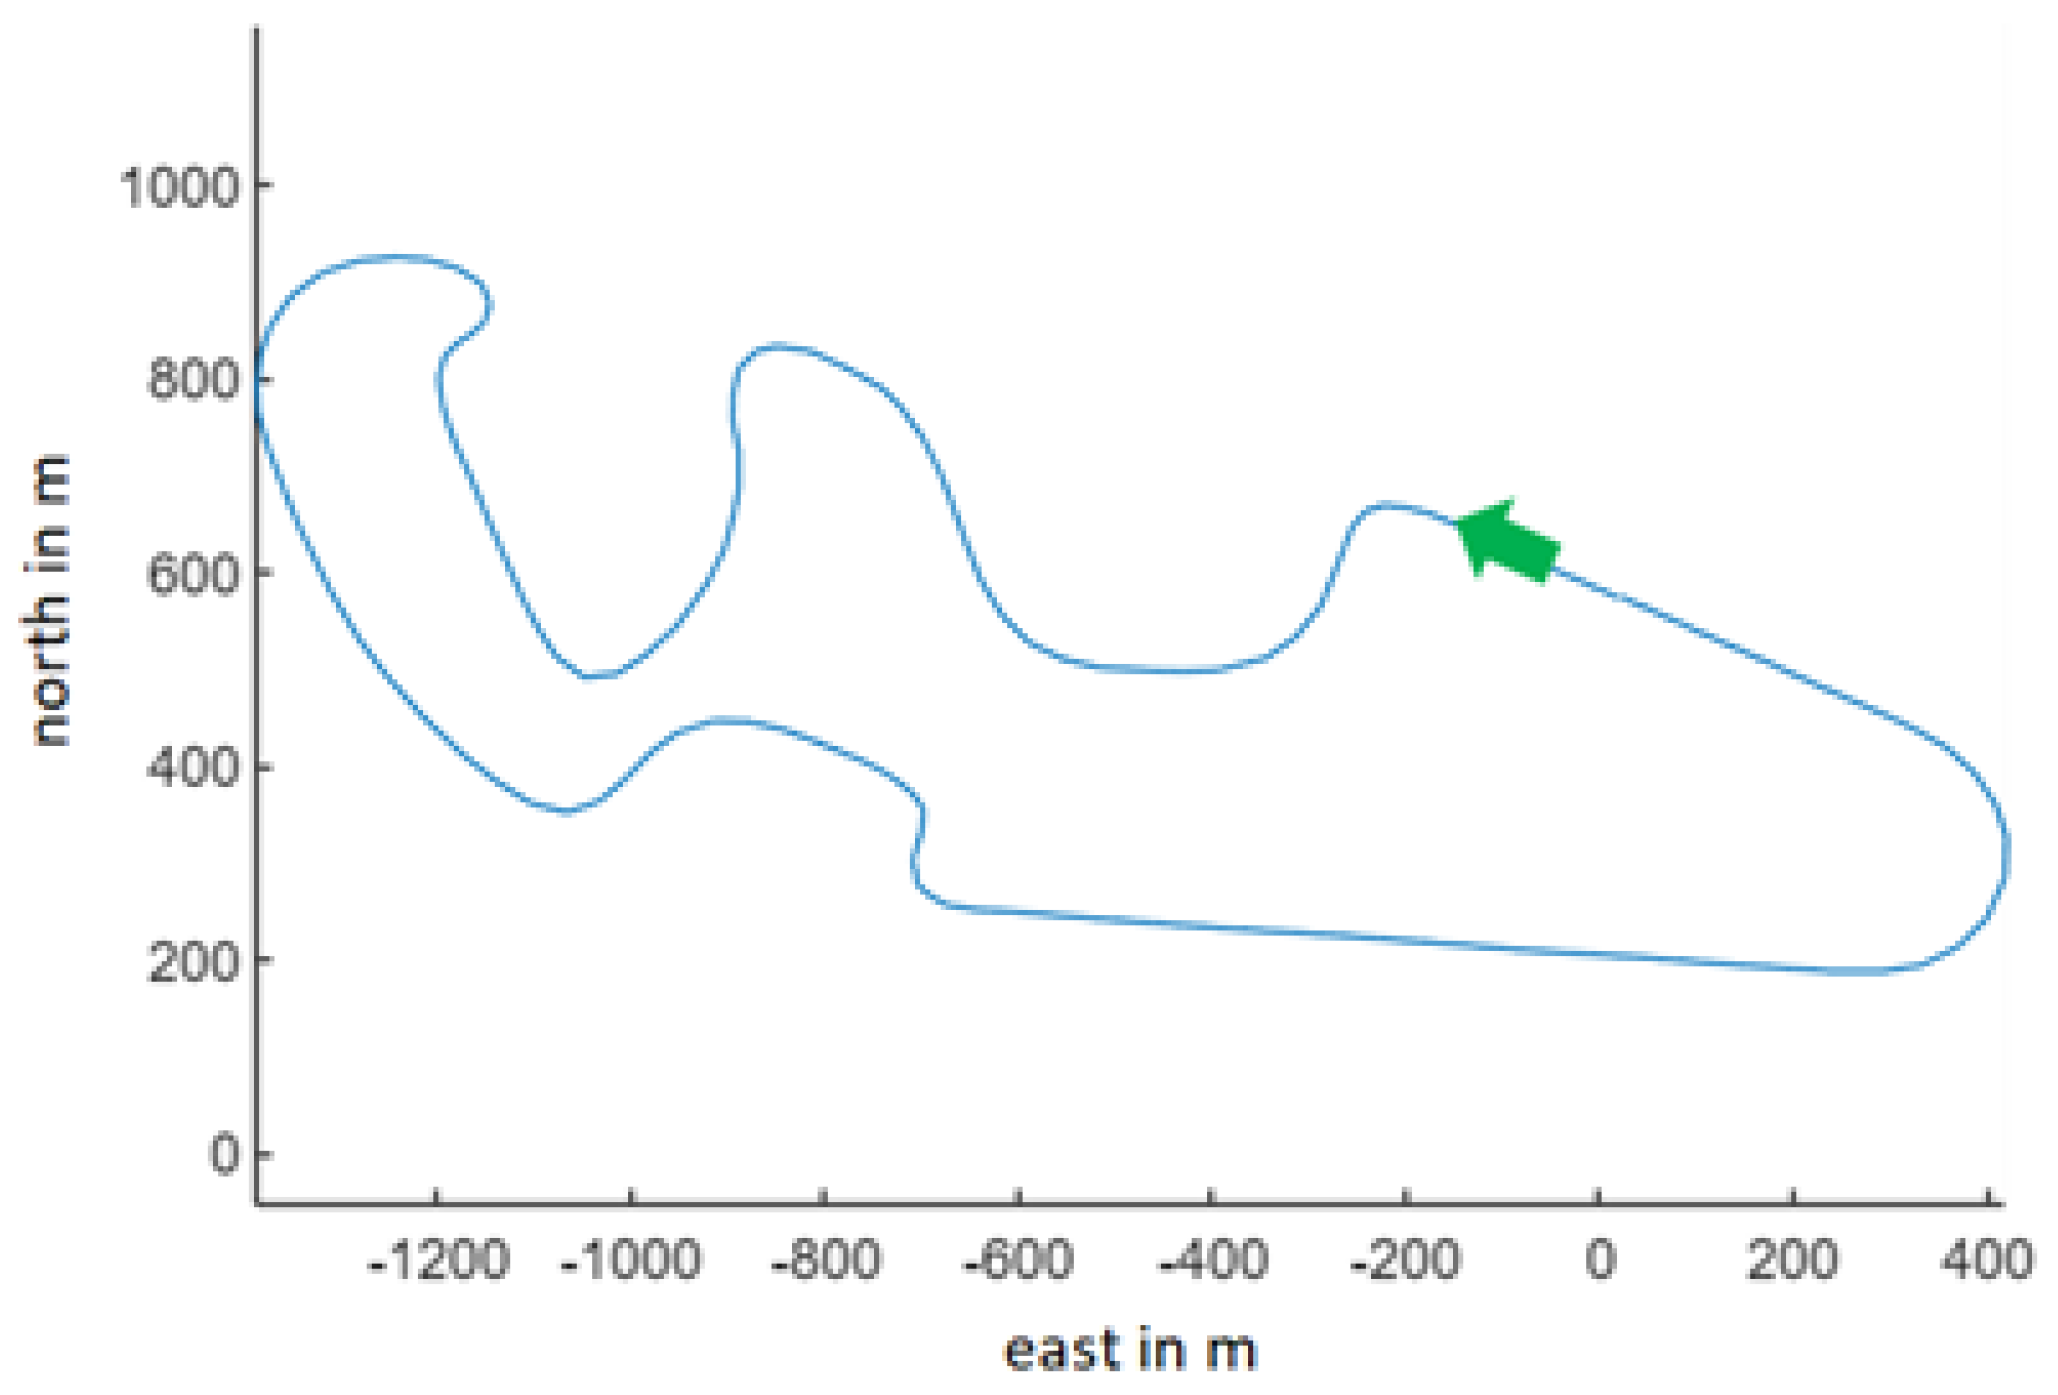
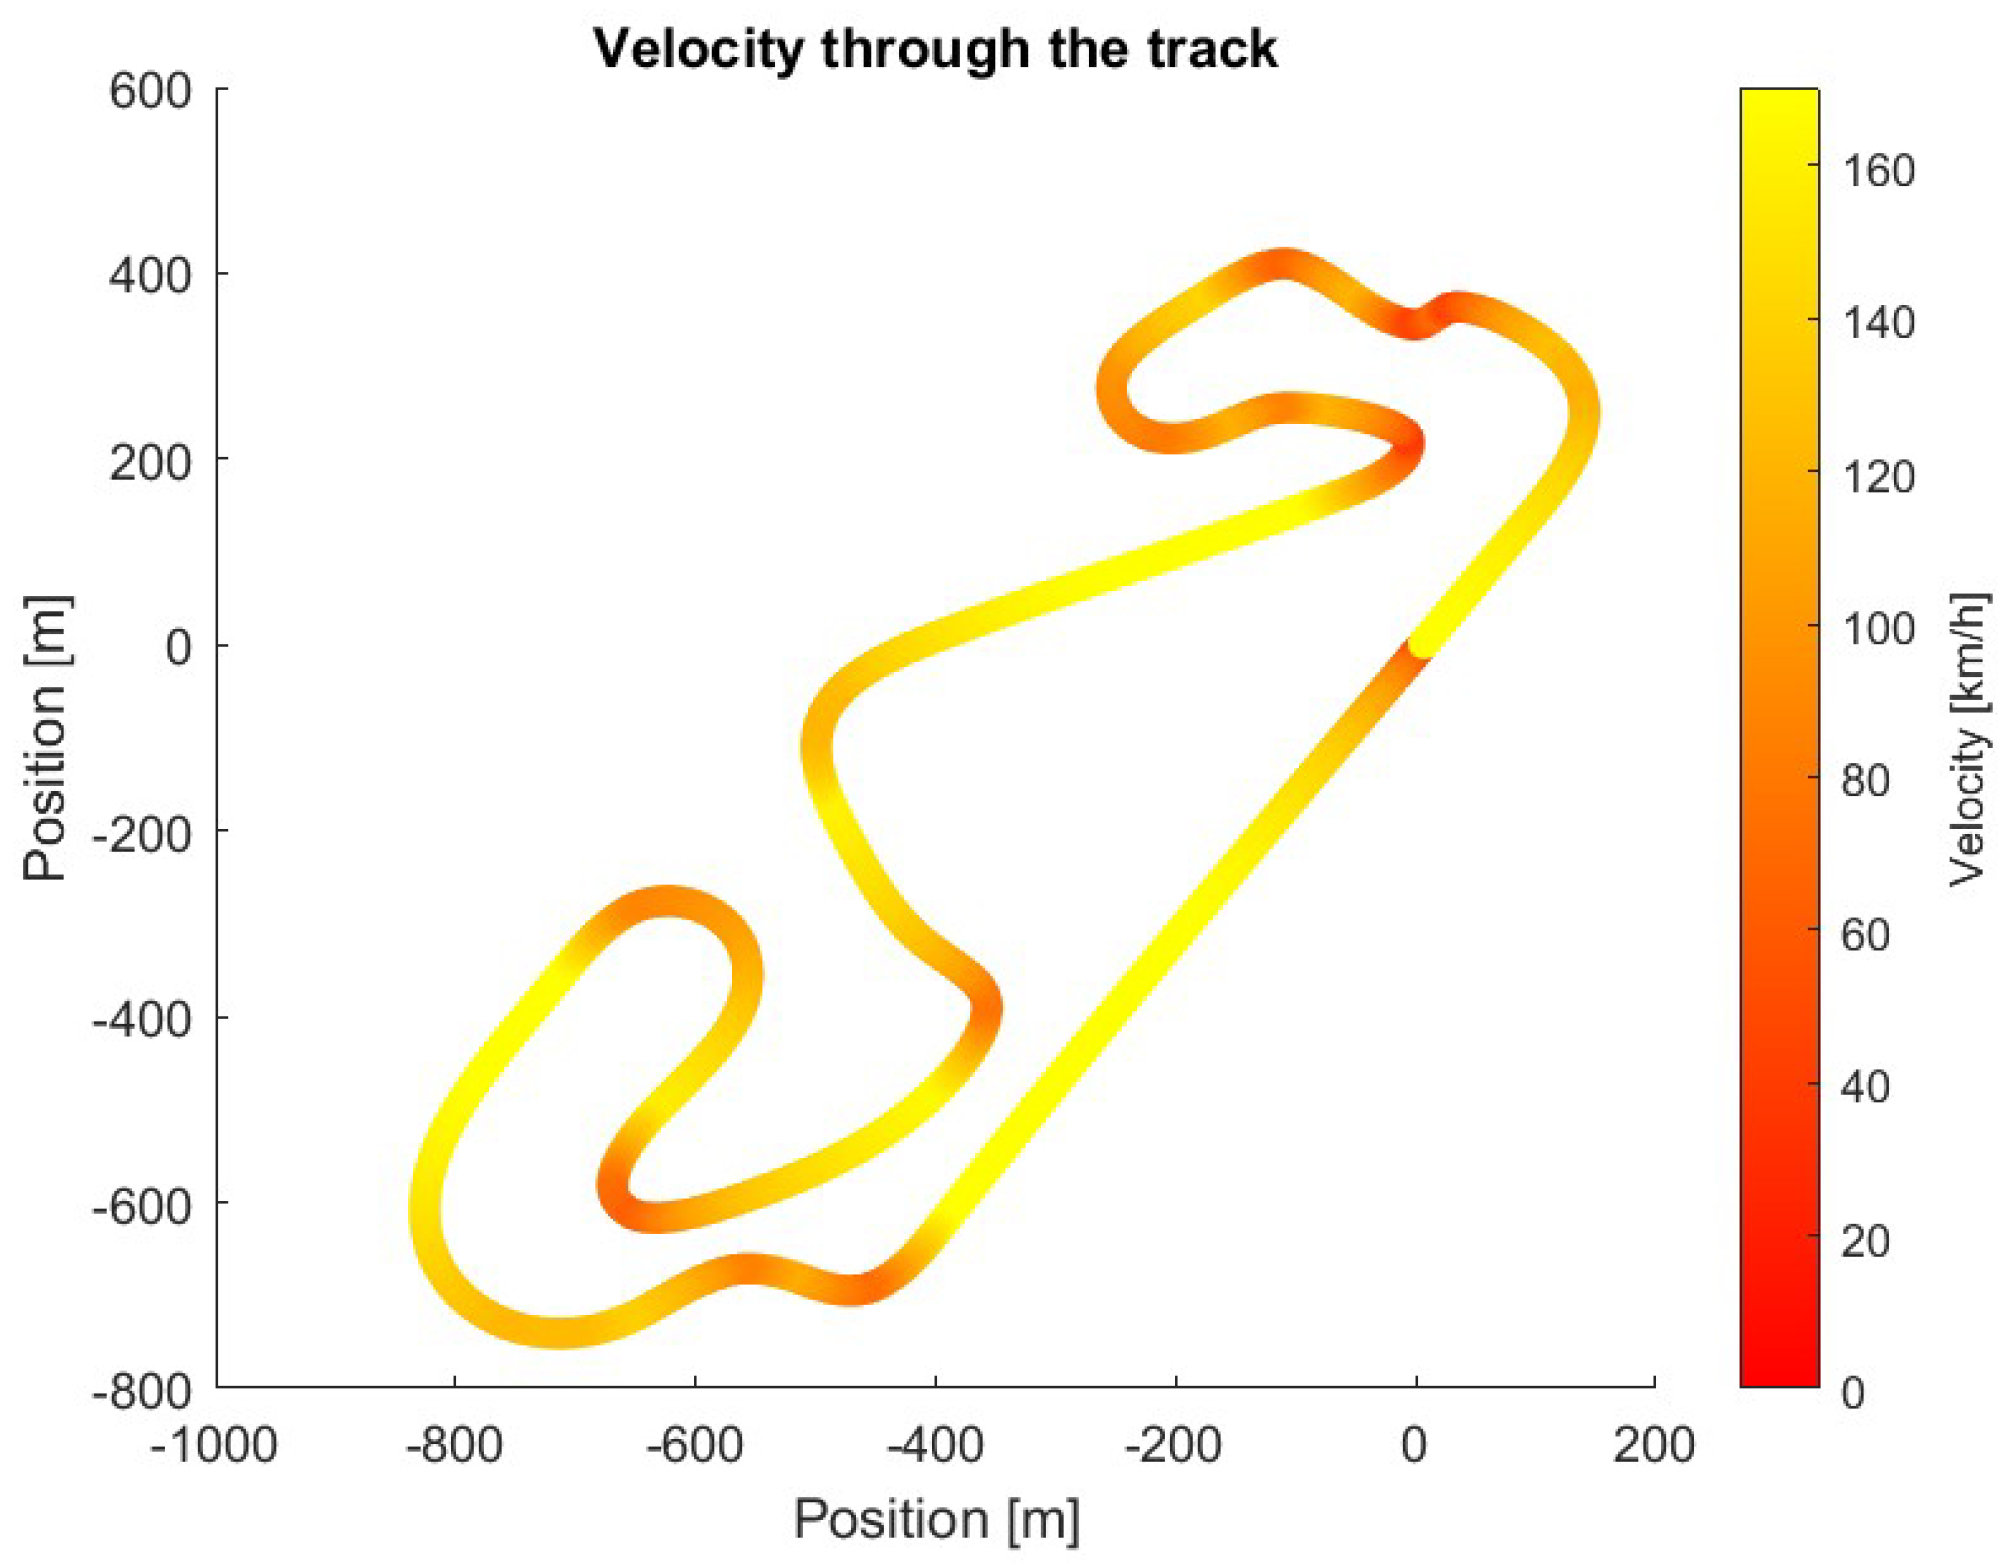
In order to simulate the energy gains with the proposed regenerative braking method, twenty-five racetracks were simulated in MATLAB software (Matlab R2022a version). The racetracks are simplifications of the real-life scenario since these are made up of a string of continuous points. These points represent a fixed theoretical optimal trajectory between the racing lines for each track, which can be seen in red in
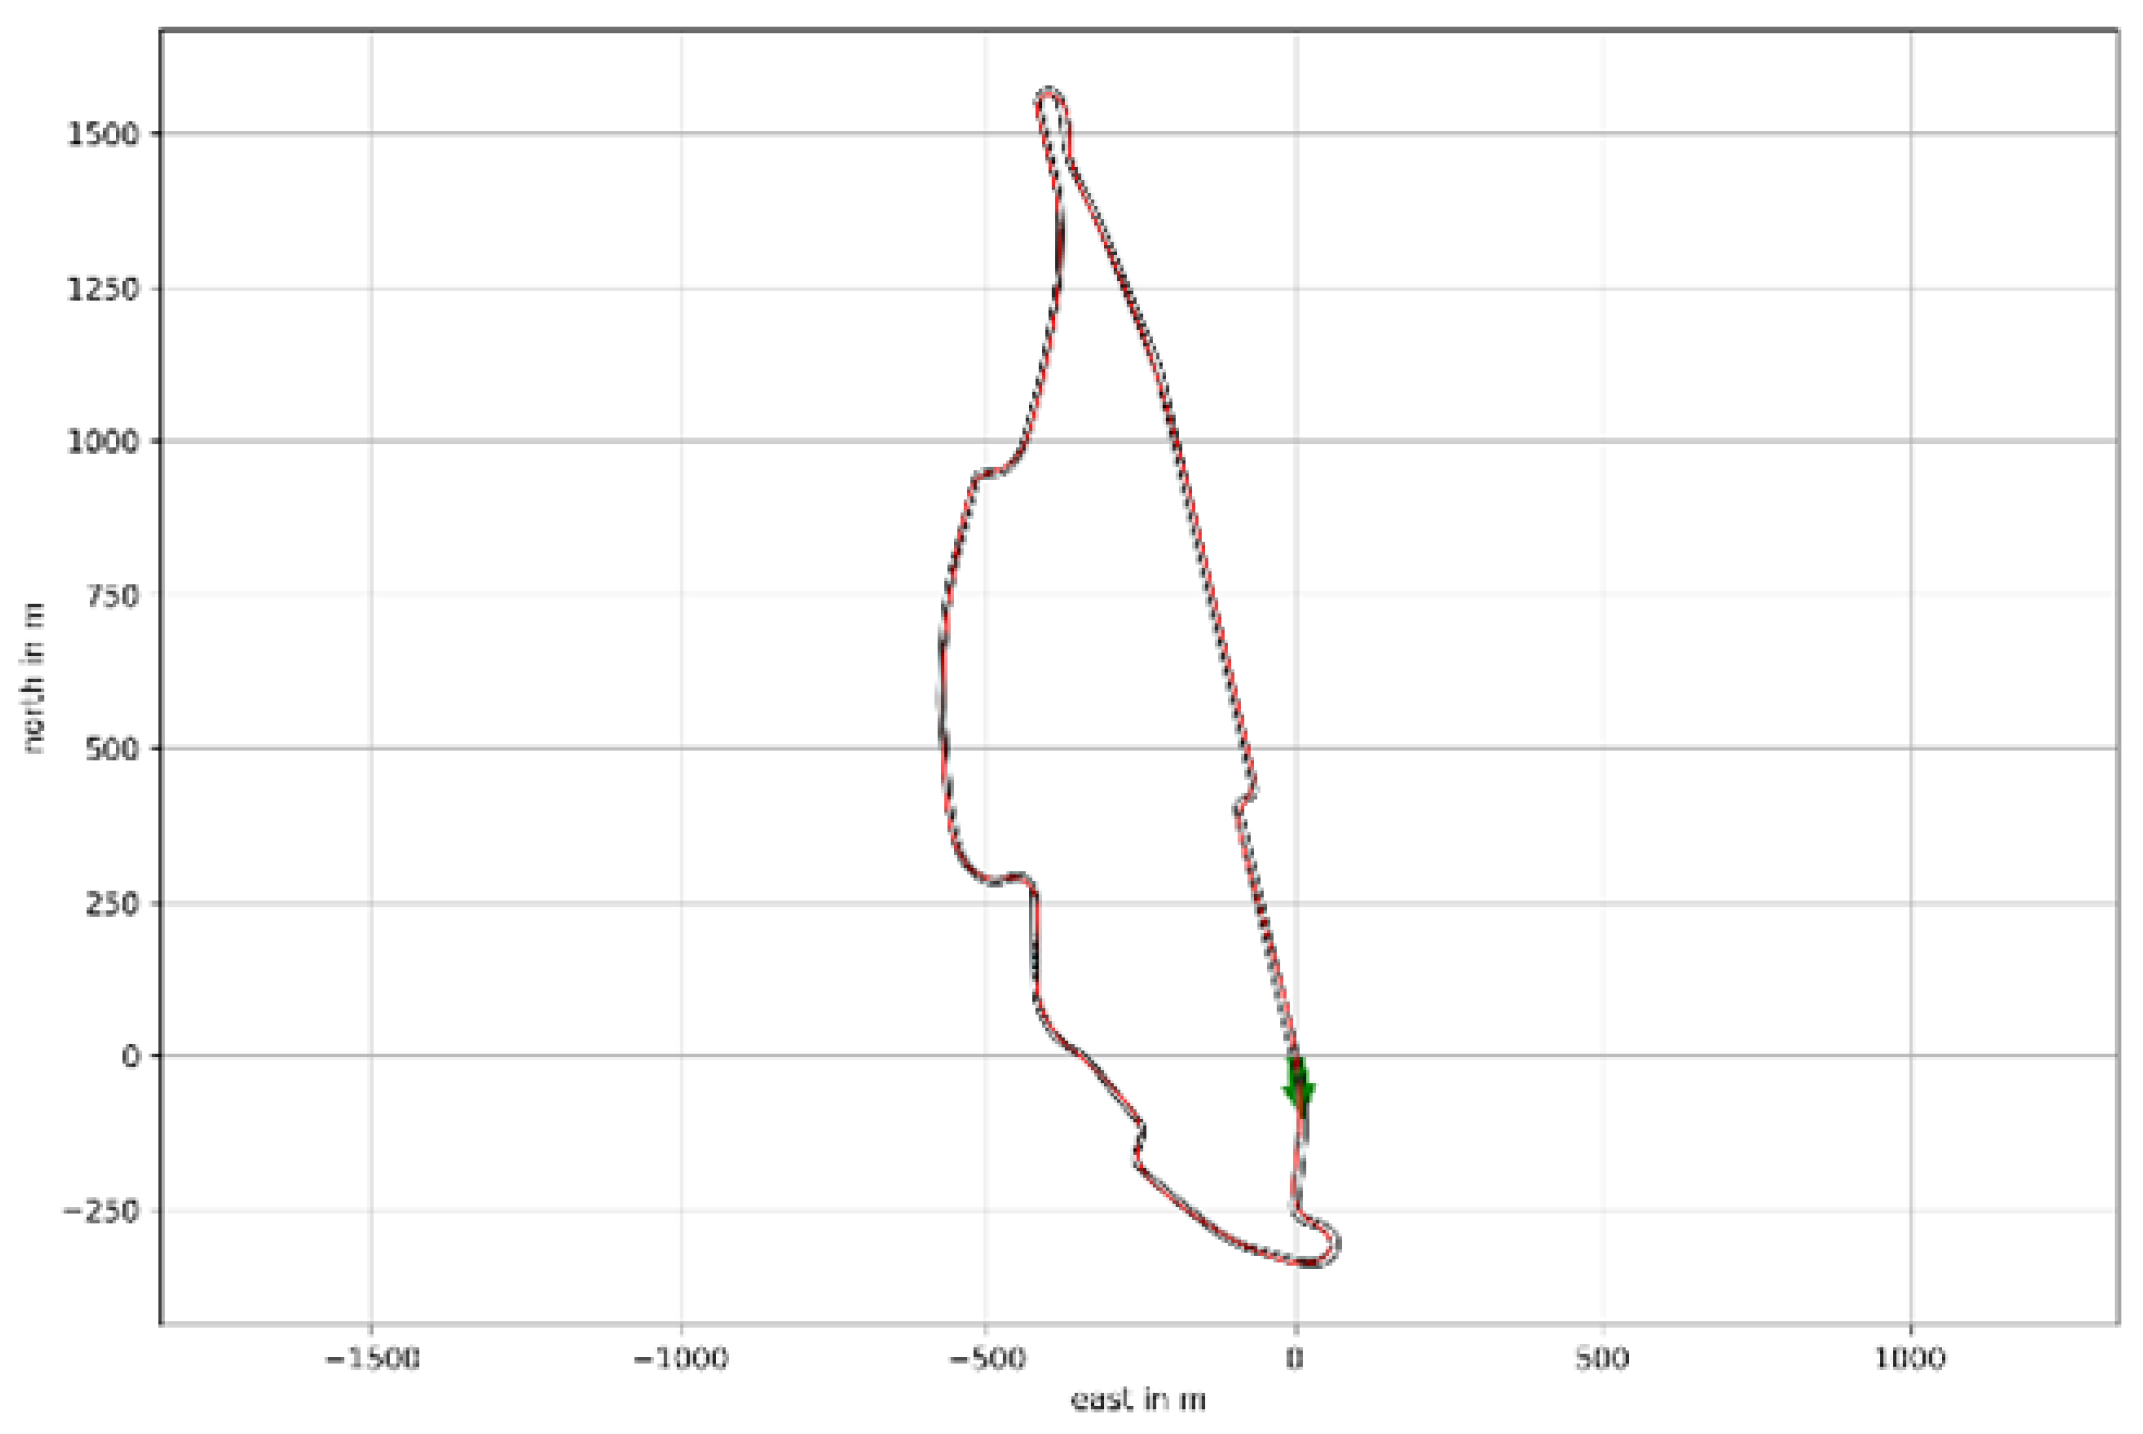
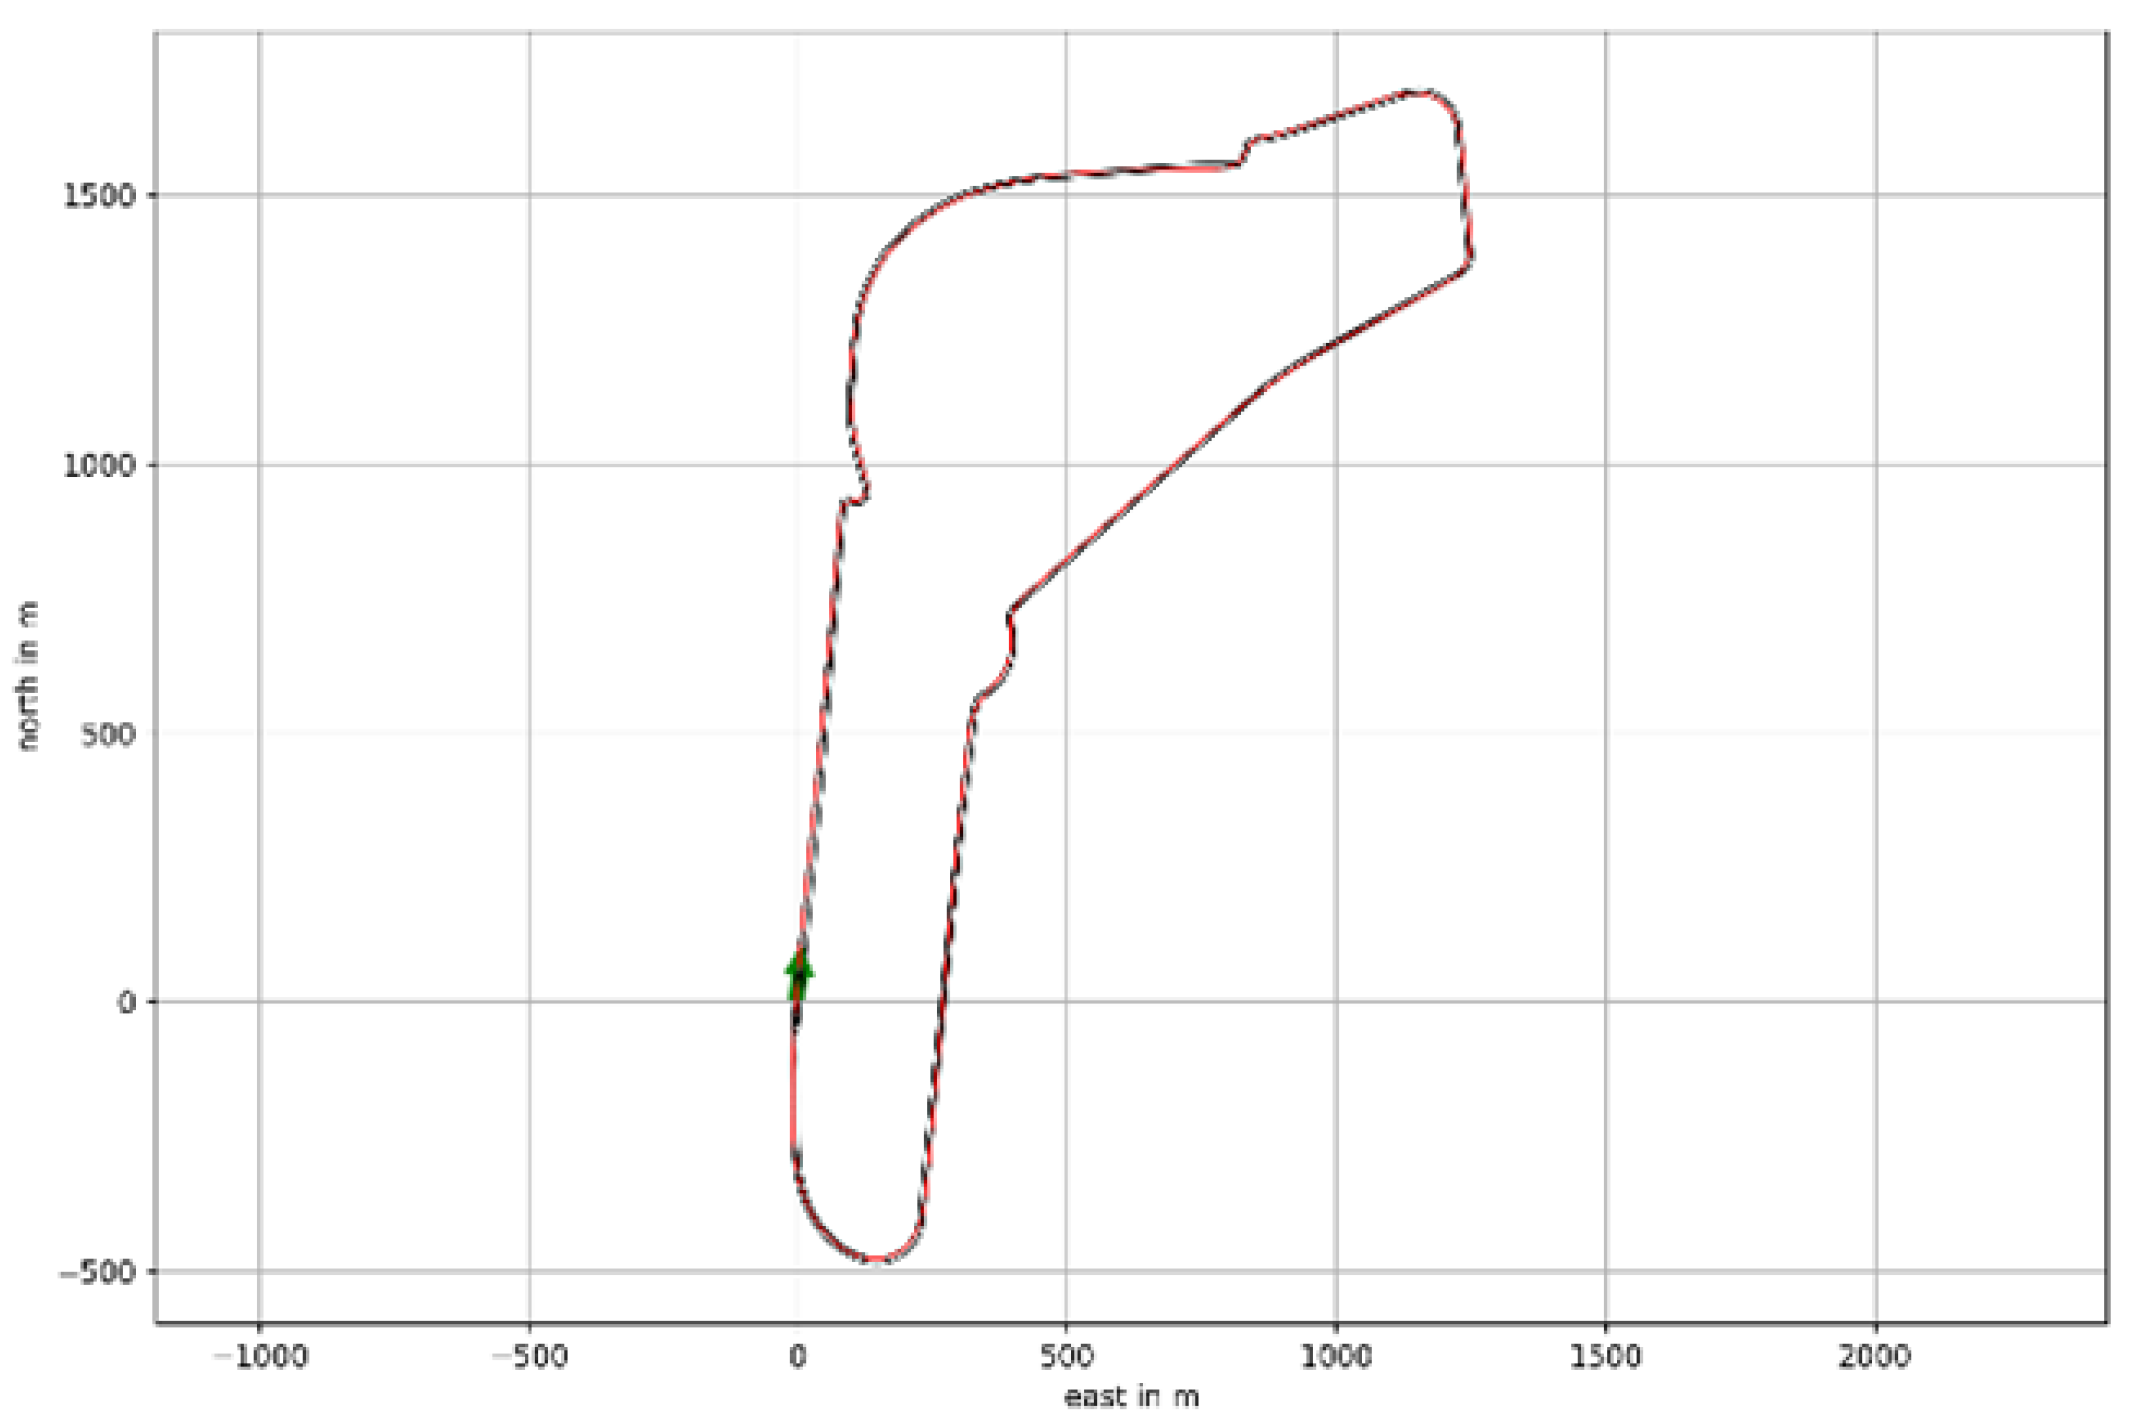
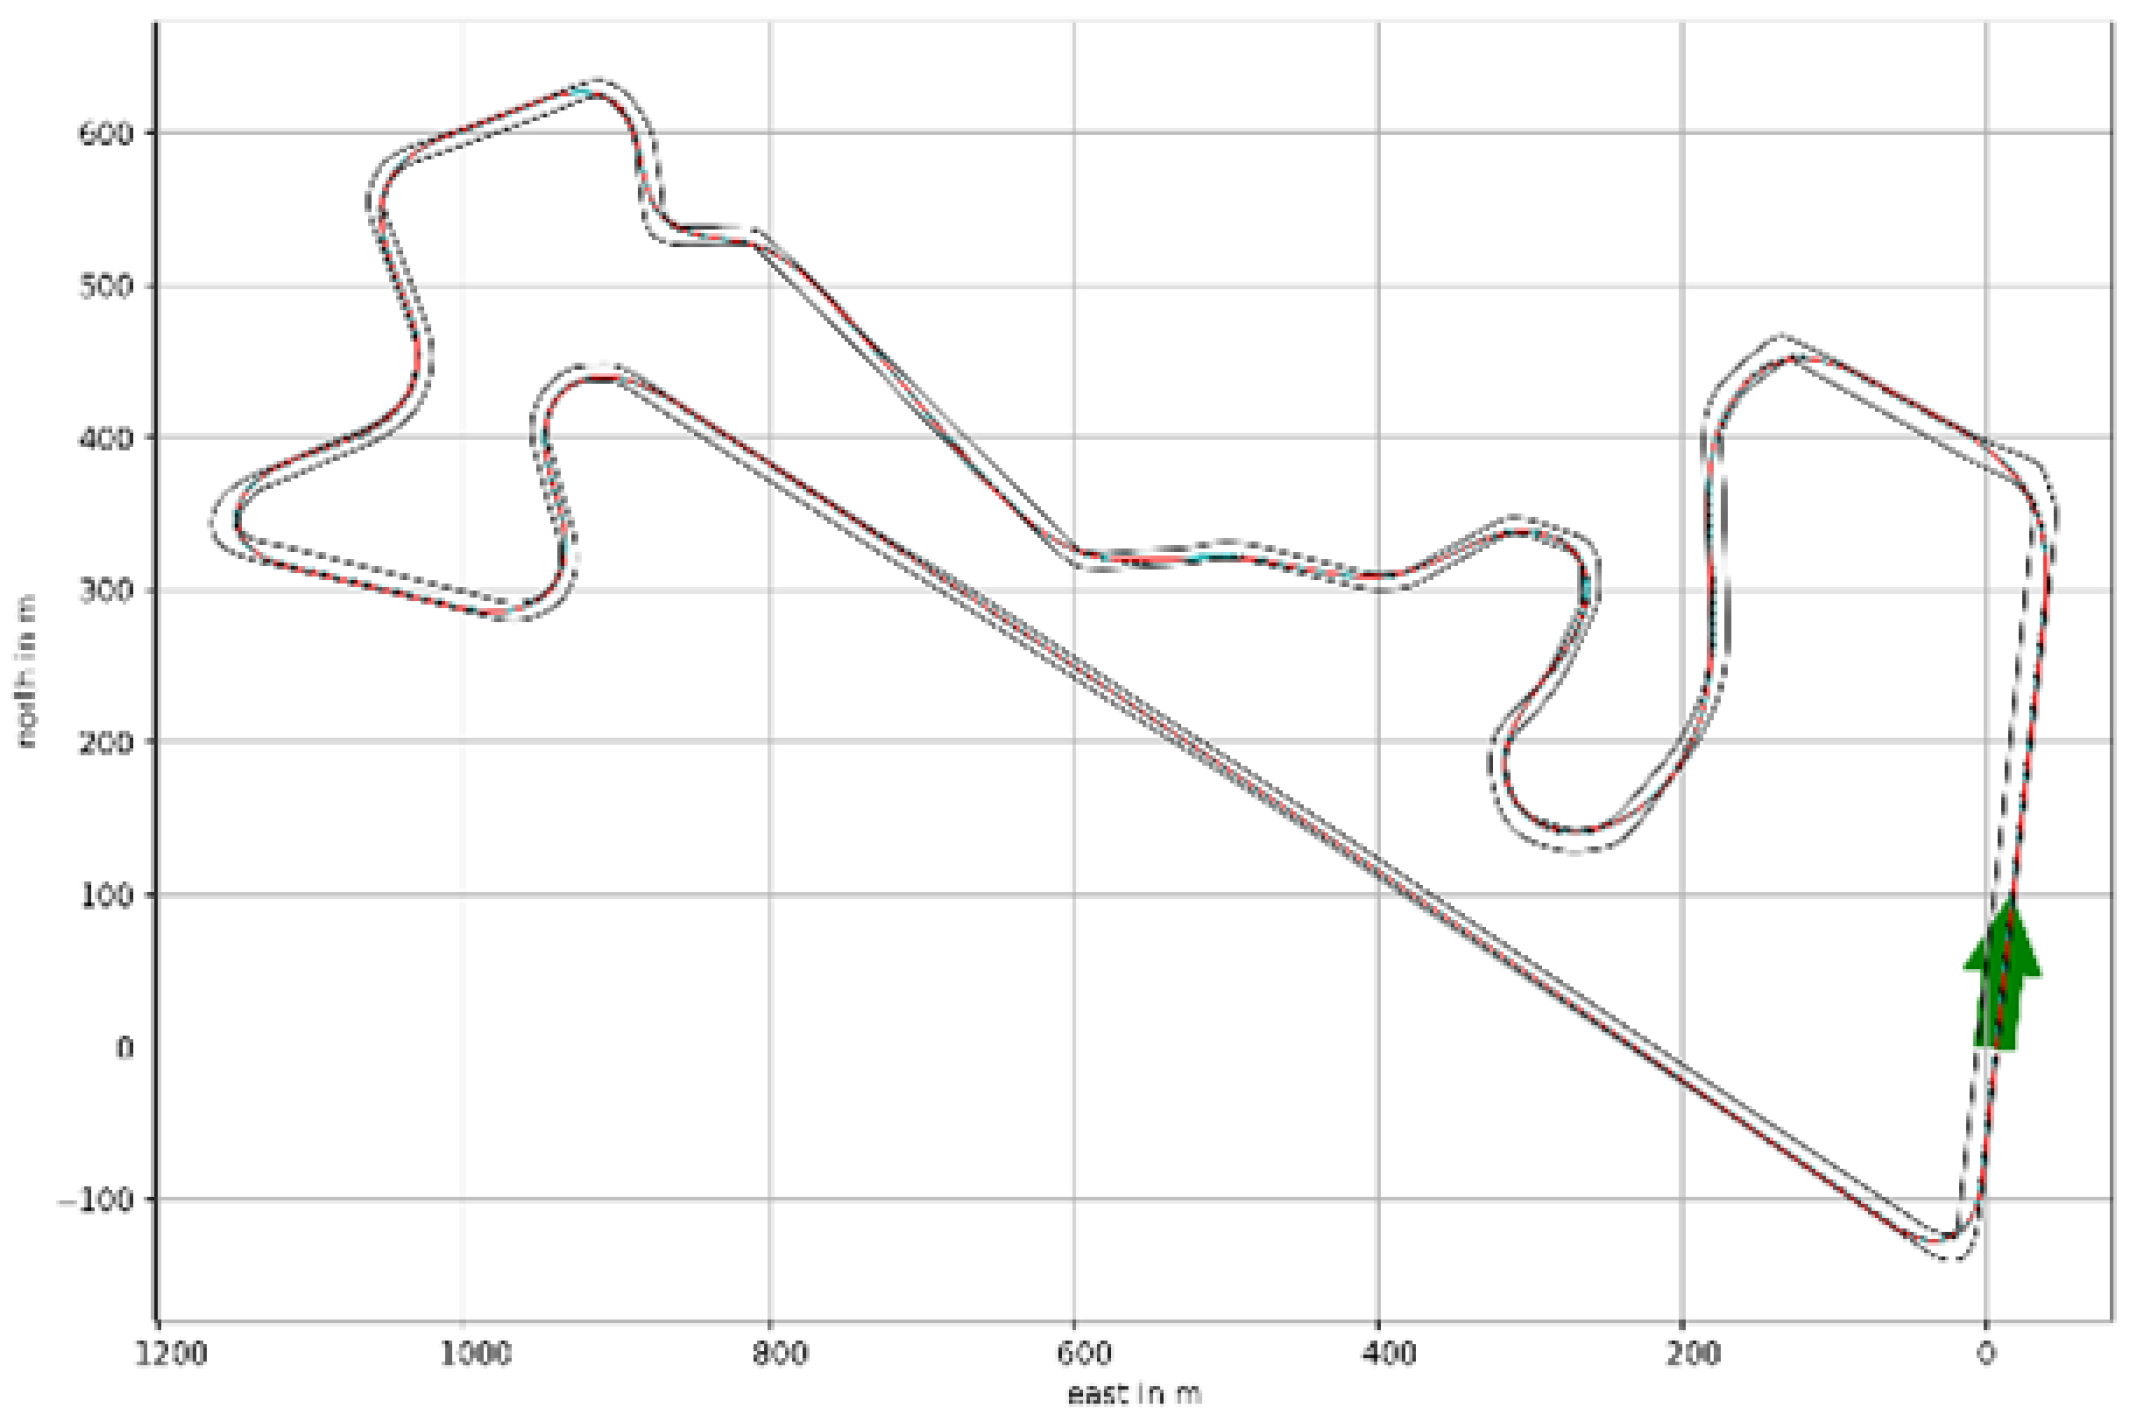
Figure 7. Each pilot can opt for different approaches to the same track. However, the LapTime software works with a predefined trajectory and calculates the fastest way to travel it. All the remaining trajectories are presented in
Appendix A in
Figure A1,
Figure A2,
Figure A3,
Figure A4,
Figure A5,
Figure A6,
Figure A7,
Figure A8,
Figure A9,
Figure A10,
Figure A11,
Figure A12,
Figure A13,
Figure A14,
Figure A15,
Figure A16,
Figure A17,
Figure A18,
Figure A19,
Figure A20,
Figure A21,
Figure A22,
Figure A23 and
Figure A24, in which the track limits are seen in black and the trajectory is seen in red. The green arrow indicates the direction of travel in the starting point of each track.
The motorcycle’s state of energy can be defined with the definition of mechanical energy without friction losses, as a simplification, represented in Equation (
3). This equation states that mechanical energy variations (
) in an isolated system are null. Hence, kinetic energy (
) and potential energy (
) can only be transformed from one to another or transferred to another system to form
and
. The body’s mass is
m = 220 kg, and the gravitational acceleration is
g = 9.81 m/s
2. To create the most realistic scenario, altitude (
h) has to be considered in the created tracks, as ignoring it will affect velocity
v in Equation (
4). This paper does not feature height values since the simulated tracks use two coordinates to create their plan view, as in
Figure 7. This simplification leads to errors in the speed profile, braking values and consequently recovered energy results:
3.3. Developed MATLAB/Simulink
After obtaining a velocity time series from the LapTime algorithm, the developed MATLAB and Simulink software (Matlab R2022a version) calculated all the remaining values utilized in this work.
The obtained velocity over time was derived to obtain the acceleration values with which it was possible to calculate the traction force (
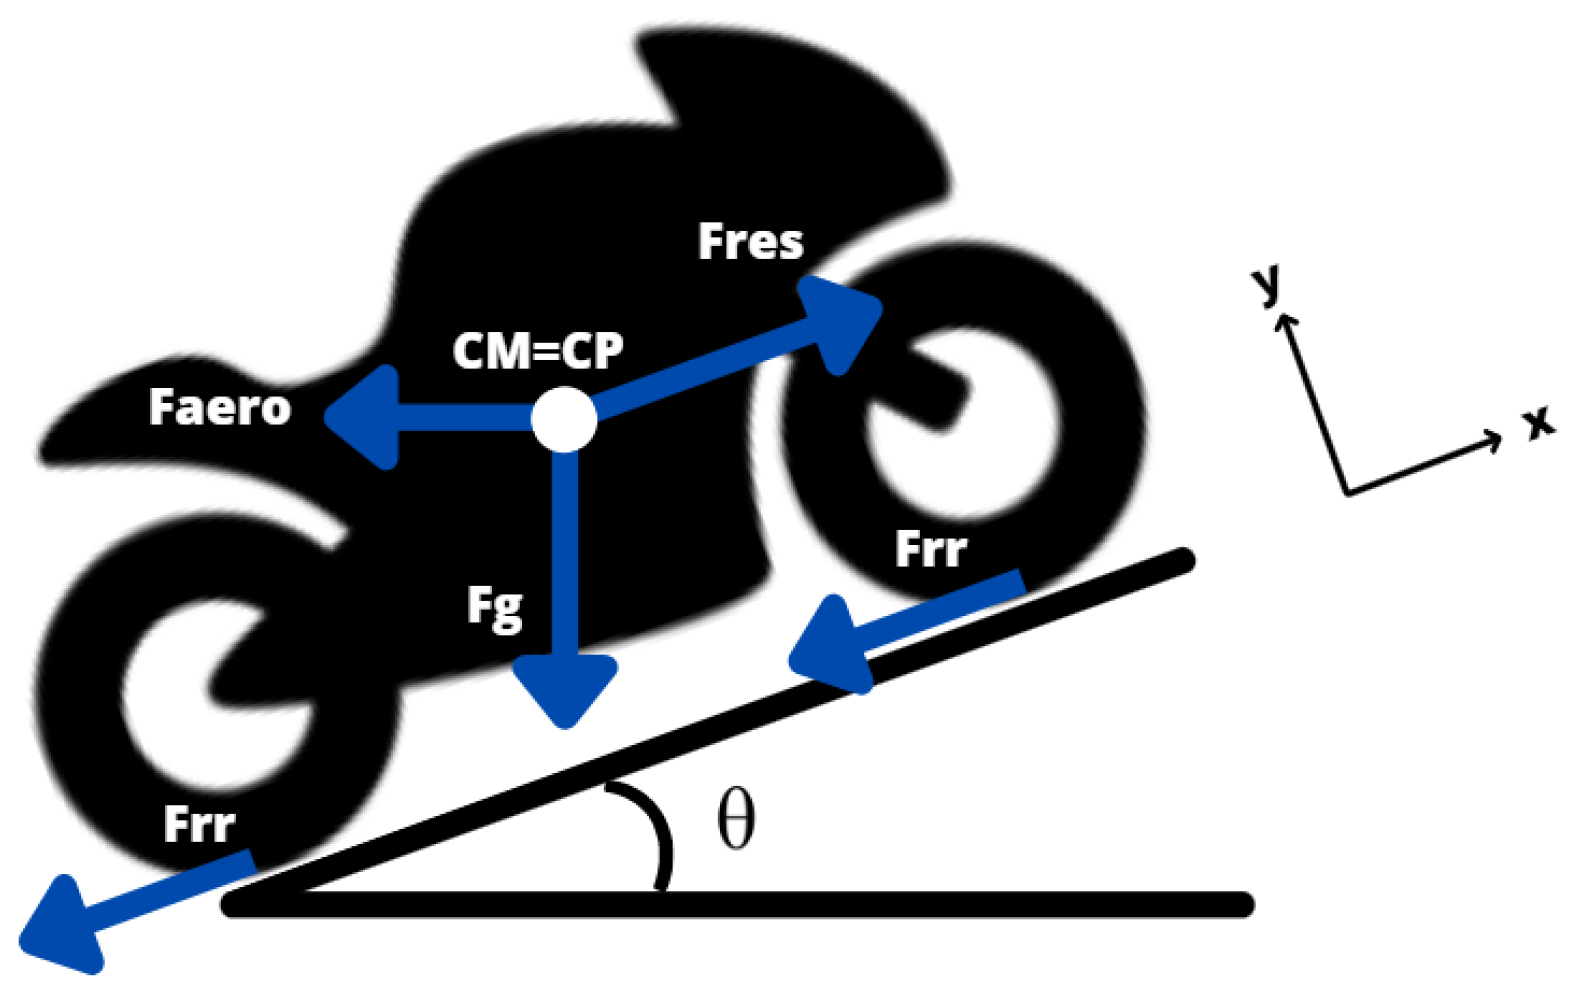
) exerted by the motorcycle on the tarmac. This force is the vector sum of the four main forces acting on any moving body that are seen in
Figure 8: resultant force (
), aerodynamic force (
), gravity force (
) and the rolling resistance force (
). The calculations for each of the previous forces relative to the
x axis are illustrated in Equation (
5), where
m = 220 kg is the mass of the motorcycle and rider (altogether),
a is the acceleration of the moving system,
= 1.225 kg/m
3 is the density of the air,
= 0.51 m
2 is the frontal area of the system (rider and motorcycle together, this value is fixed throughout the laps as a simplification) that causes aerodynamic drag,
is the drag coefficient,
v is the velocity,
g = 9.81 m/s
2 is the gravity acceleration,
is the slope of the terrain, and
is the coefficient of rolling resistance. All forces, except the rolling resistance, act on the bodies center of mass (CM), which is equal to the center of pressure (CP).
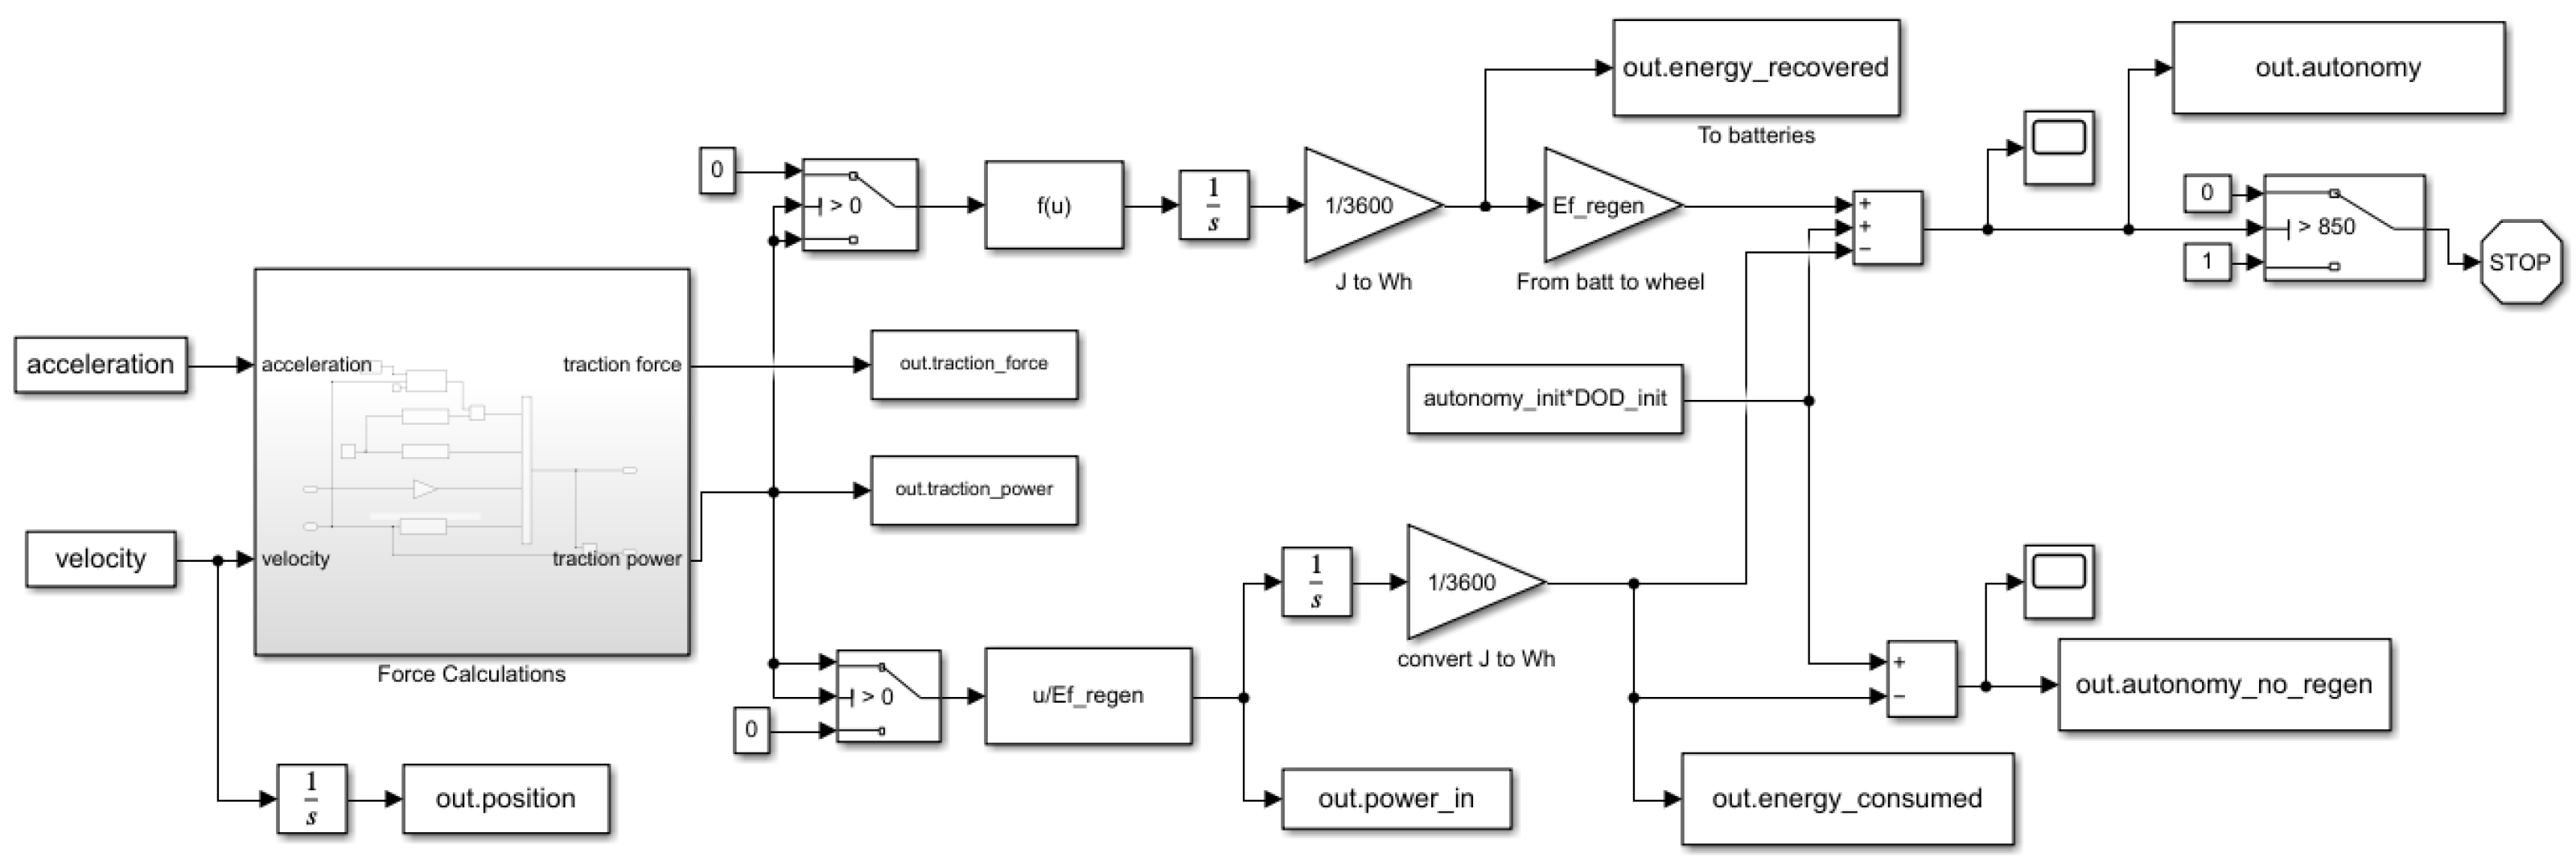
The energy regeneration system was created using the Simulink model seen in
Figure 9. This model receives the velocity of the motorcycle as an input and calculates the traction force in Equation (
5) as well as the traction power by multiplying velocity and traction force.
Traction power is divided by the efficiency of the system, referenced in
Table 5, thus creating the power that needs to be exerted for the motorcycle to achieve the input velocity. By integrating the aforementioned power, one obtains the consumed energy over time. The consumed energy is subtracted from the initial available energy value of 90% state of charge (SOC = 7650 Wh), which will create the available energy over time until 10% SOC (=850 Wh) is reached, with no regeneration.
Traction power is also multiplied by the efficiency of the system and the percentage of rear braking, thus obtaining the energy that is recovered to the battery pack over time. This recovered energy is multiplied by the efficiency of the system once again, simulating its path back to the wheels. To the initial available energy value of 90% SOC (=7650 Wh), the system now subtracts the consumed energy. However, it also adds the values of recovered energy times the efficiency of the vehicle, thus obtaining the available energy over time until 10% SOC (=850 Wh) is reached, with regeneration.
The biggest “loss” factor in this work is related to how much braking is, in fact, regenerative. Different riders use different approaches on-track. Hence, there is a variability in the percentage of usage of the rear brake, when compared to the front caliper. This is called the
brake bias. MotoGP riders use the rear brake for about 70% of their laps to balance the vehicle and take on a less aggressive approach than when only using the front braking system. However, the rear braking mechanism is responsible for only about 30% of the braking power, a 70/30 braking bias. In
Section 5, a careful analysis of several values of rear braking is applied, and the results are compared.
4. Results
4.1. Recovered Energy
The obtained recuperated energy results for each of the 25 simulated tracks are represented in
Table 6.
Recuperated or recovered energy is understood in this paper as the percentage of energy that is added to the accumulator compared to its original available energy value of 80% of the stored energy (=6800 Wh). Hence, when energy recuperation is 10%, this means that 10% of 6800 Wh (=680 Wh) are regenerated. It is worth mentioning that, in order to be used again, the recuperated energy will travel all the components until at the wheel once again, which will reduce the amount of energy that actually reaches the tarmac.
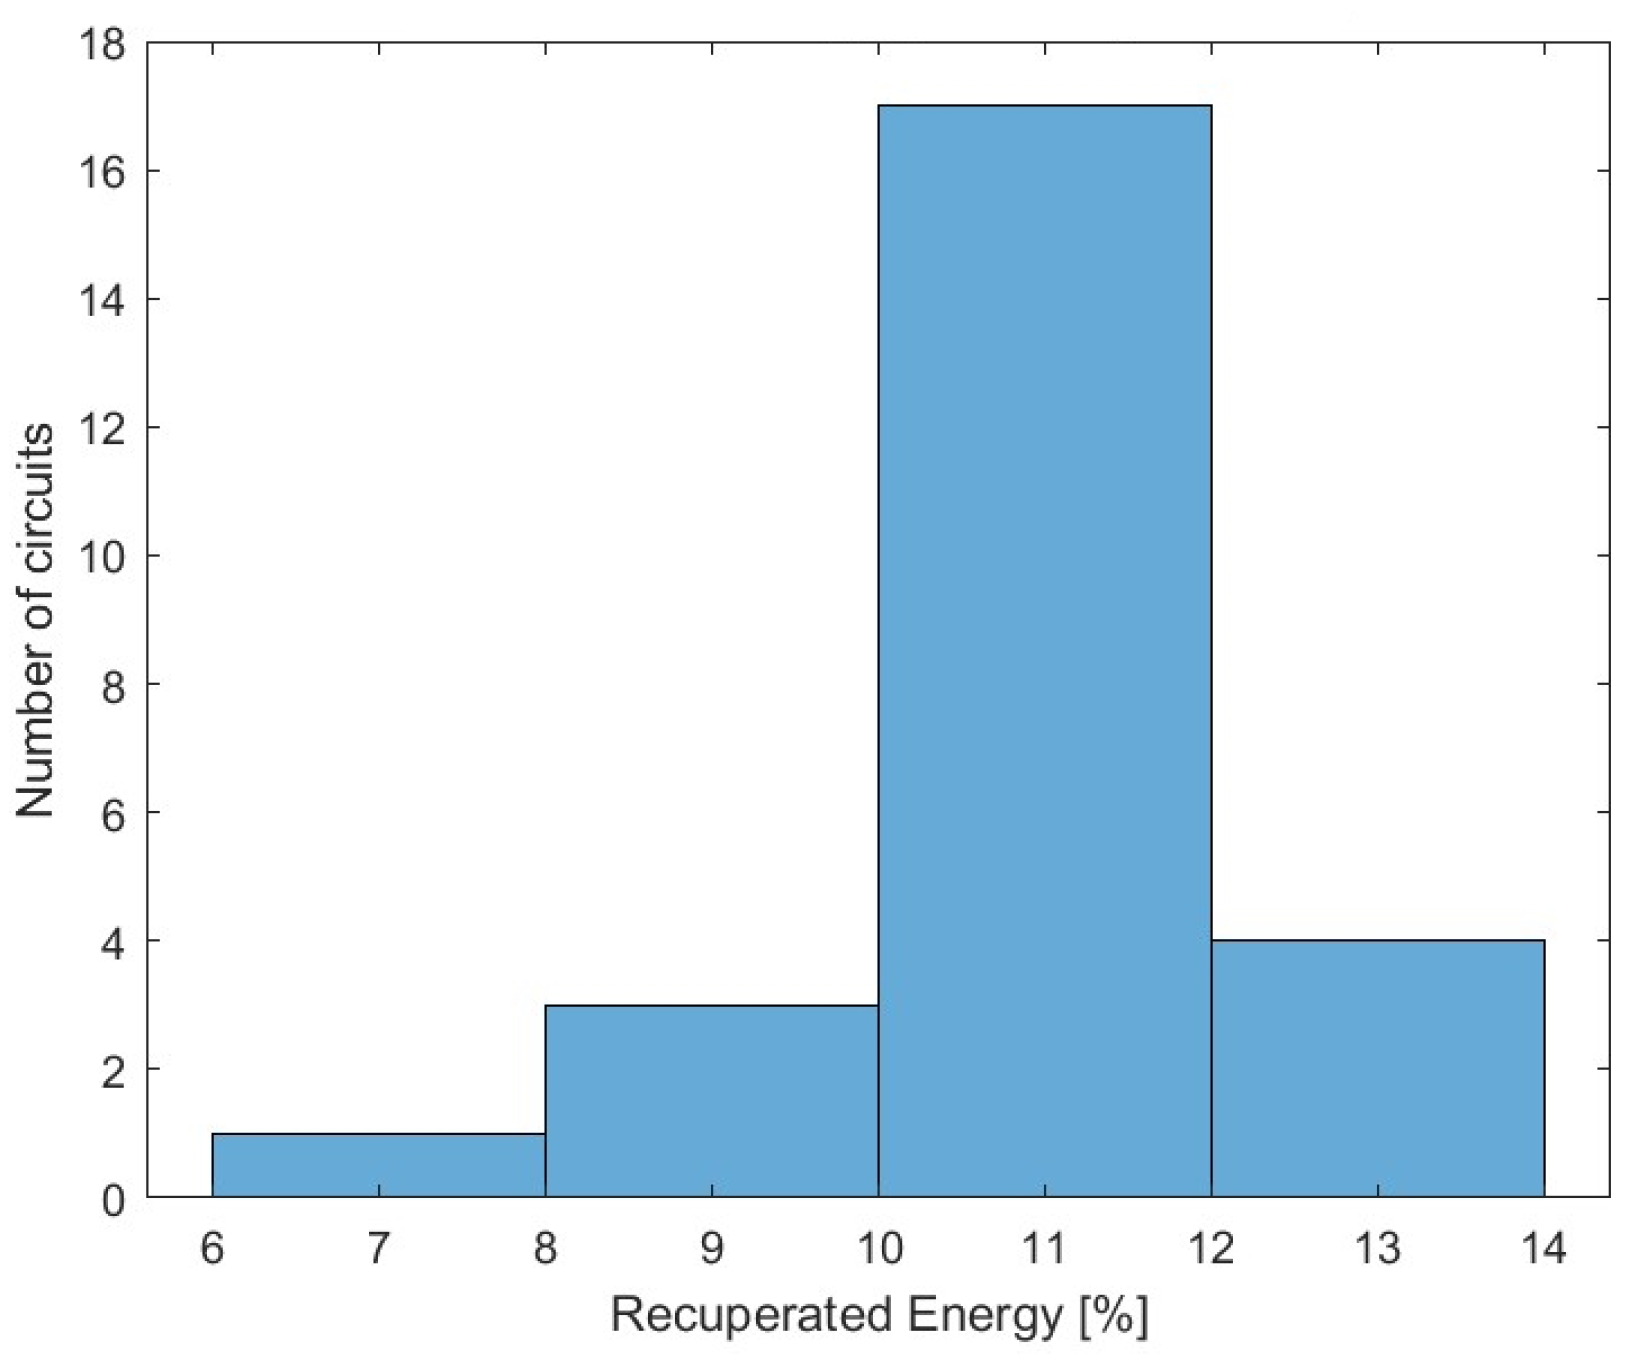
Figure 10 shows a histogram with the results of recuperated energy for all 25 studied racetracks. An average value of 11.11% of energy was found to have been recuperated per track, with 17 of the results within the 10% and 12% recuperated energy range.
4.2. Variation of Recovered Energy per Circuit
The obtained results vary with the racetracks’ three main characteristics: the number of turns, lap distance and the average speed.
In
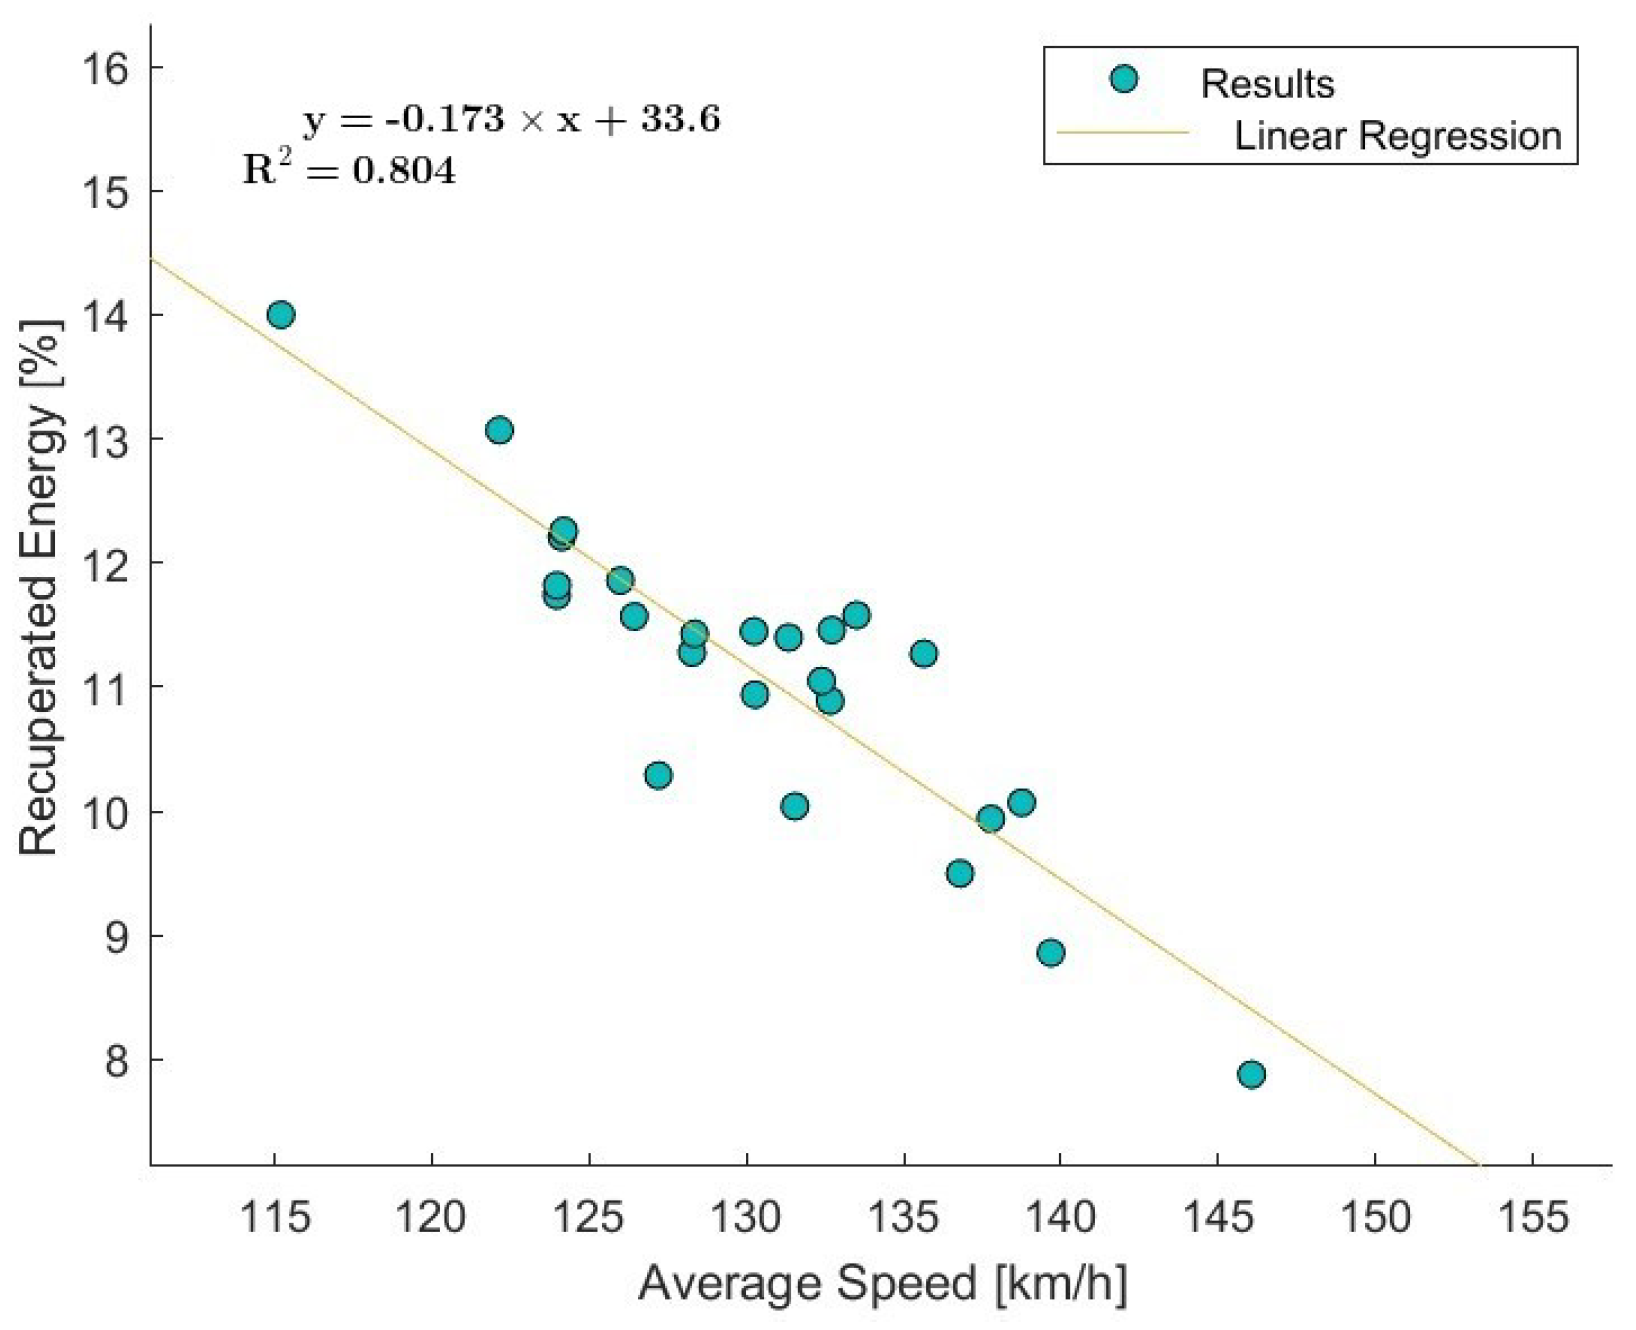
Figure 11, a linear regression of the recuperated energy results over average track speed was drawn for all the circuits. The obtained linear model explains about 80% (
) of the variability in results. Hence, there is a direct correlation between the amount of energy that can be recuperated in a circuit and the average speed it takes a vehicle to run said circuit.
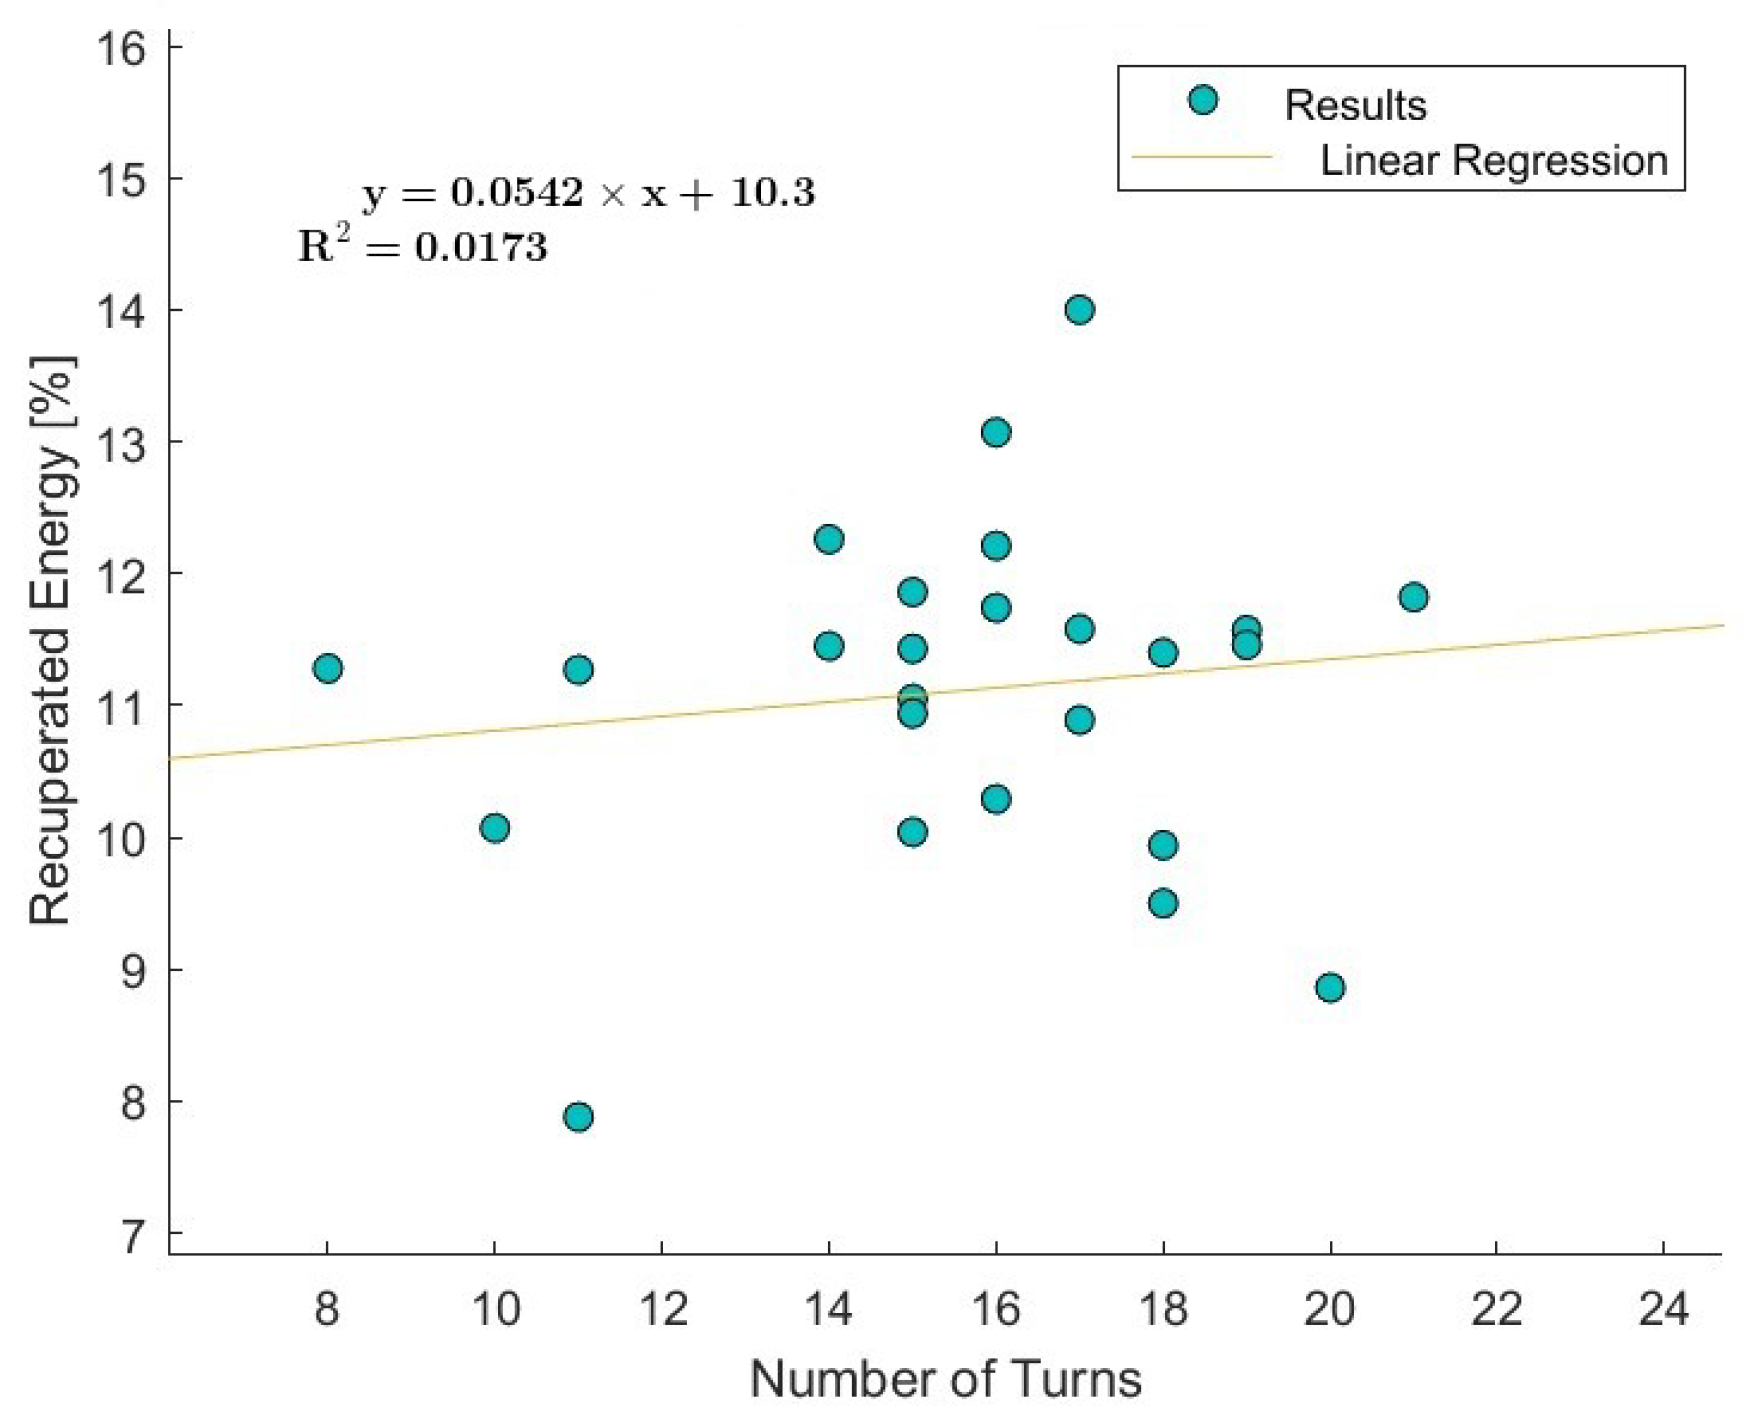
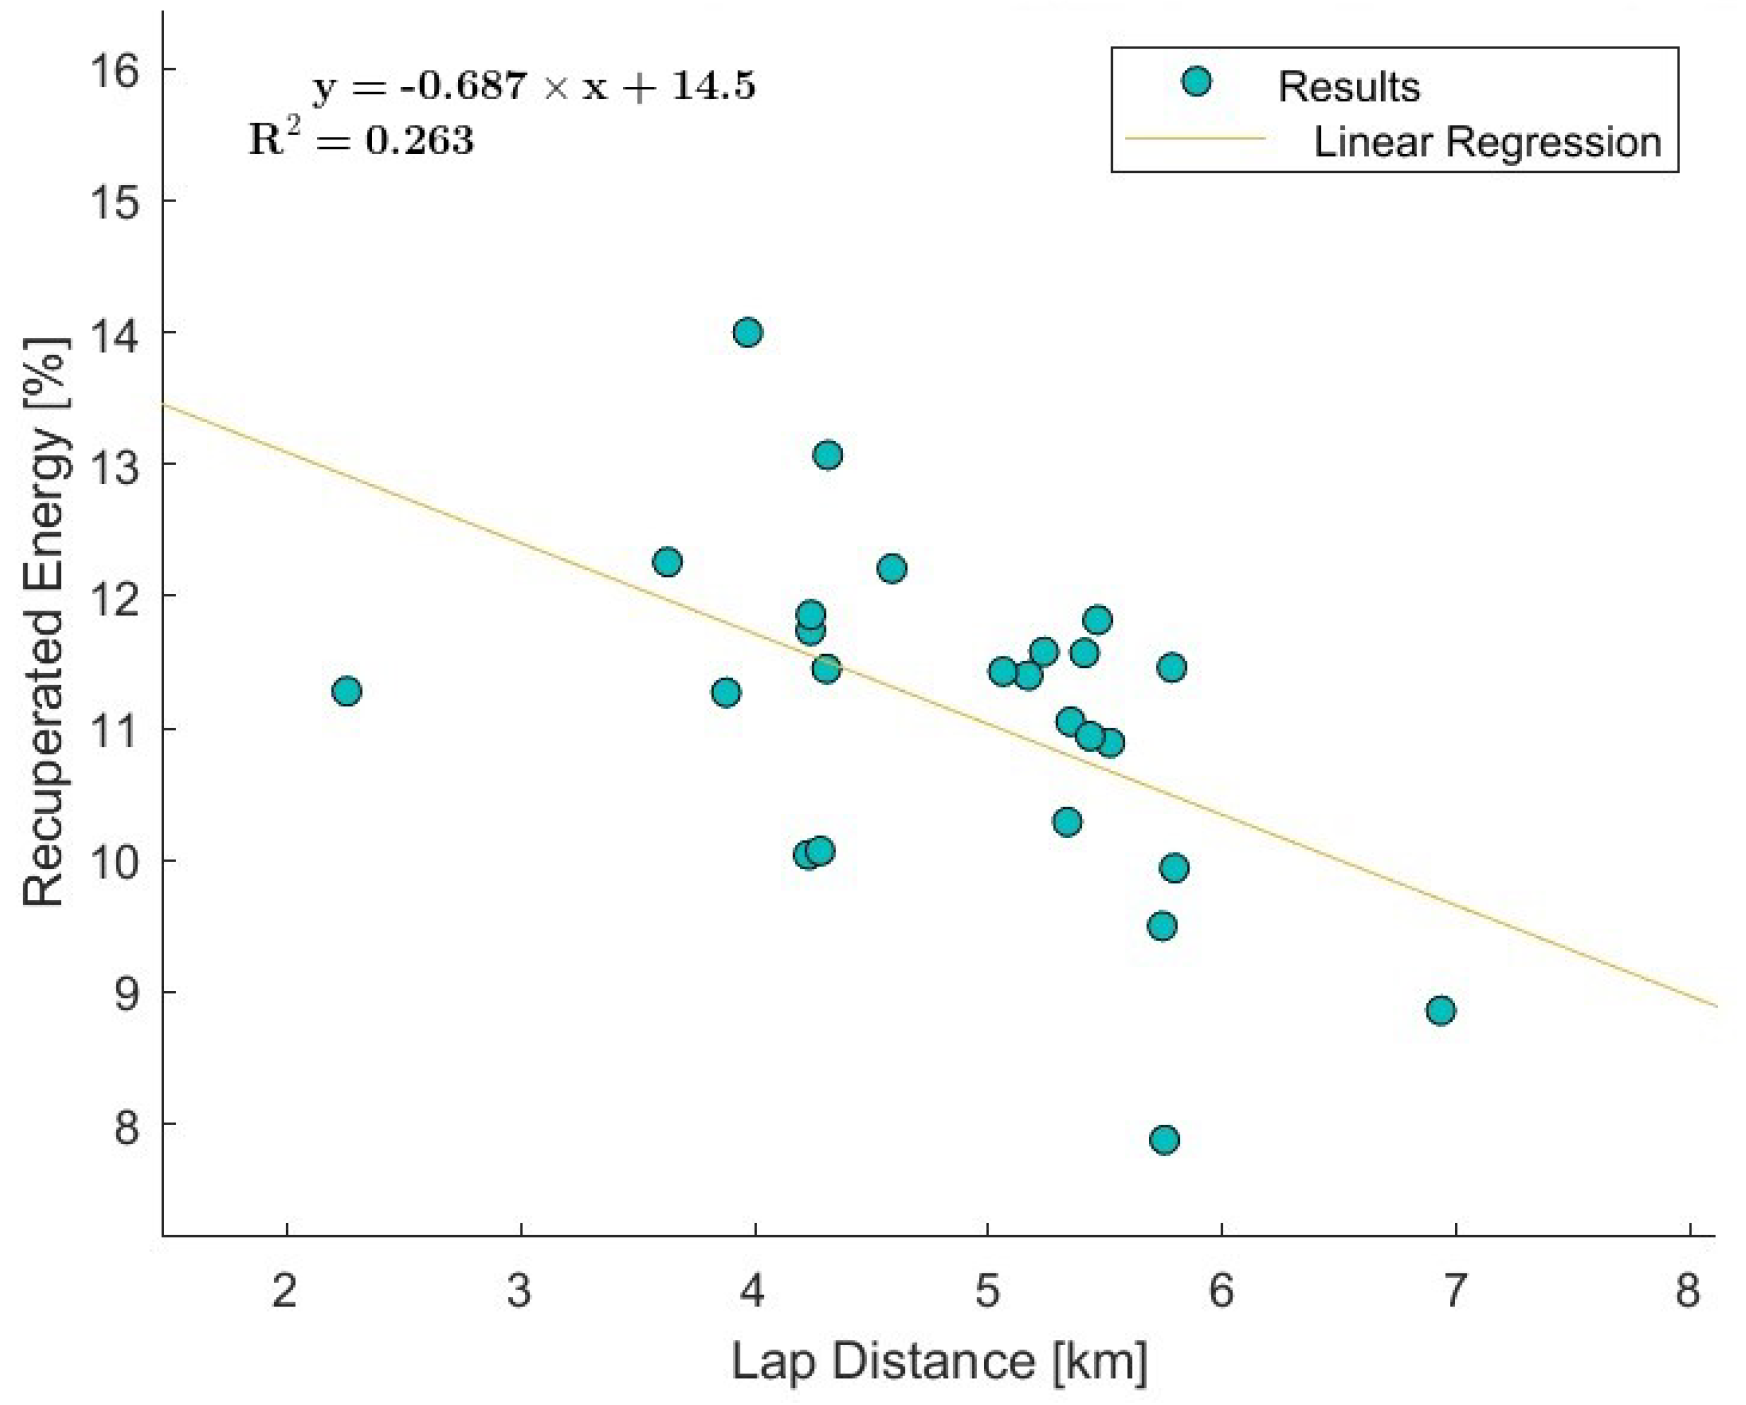
Linear regressions of the obtained recuperated energy results over the tracks’ number of turns and lap distances were also obtained in
Figure 12 and
Figure 13, respectively.
The lap distance’s linear regression with the results has a value of
, which is much lower than the value obtained for the average speed. This variable does not clearly explain the variation in recuperated energy, although they are related to a certain extent, as seen in
Figure 13.
The variable which is the least connected with energy recuperation is the number of turns, with a linear regression value of
. The lack of relation is best seen in
Figure 12.
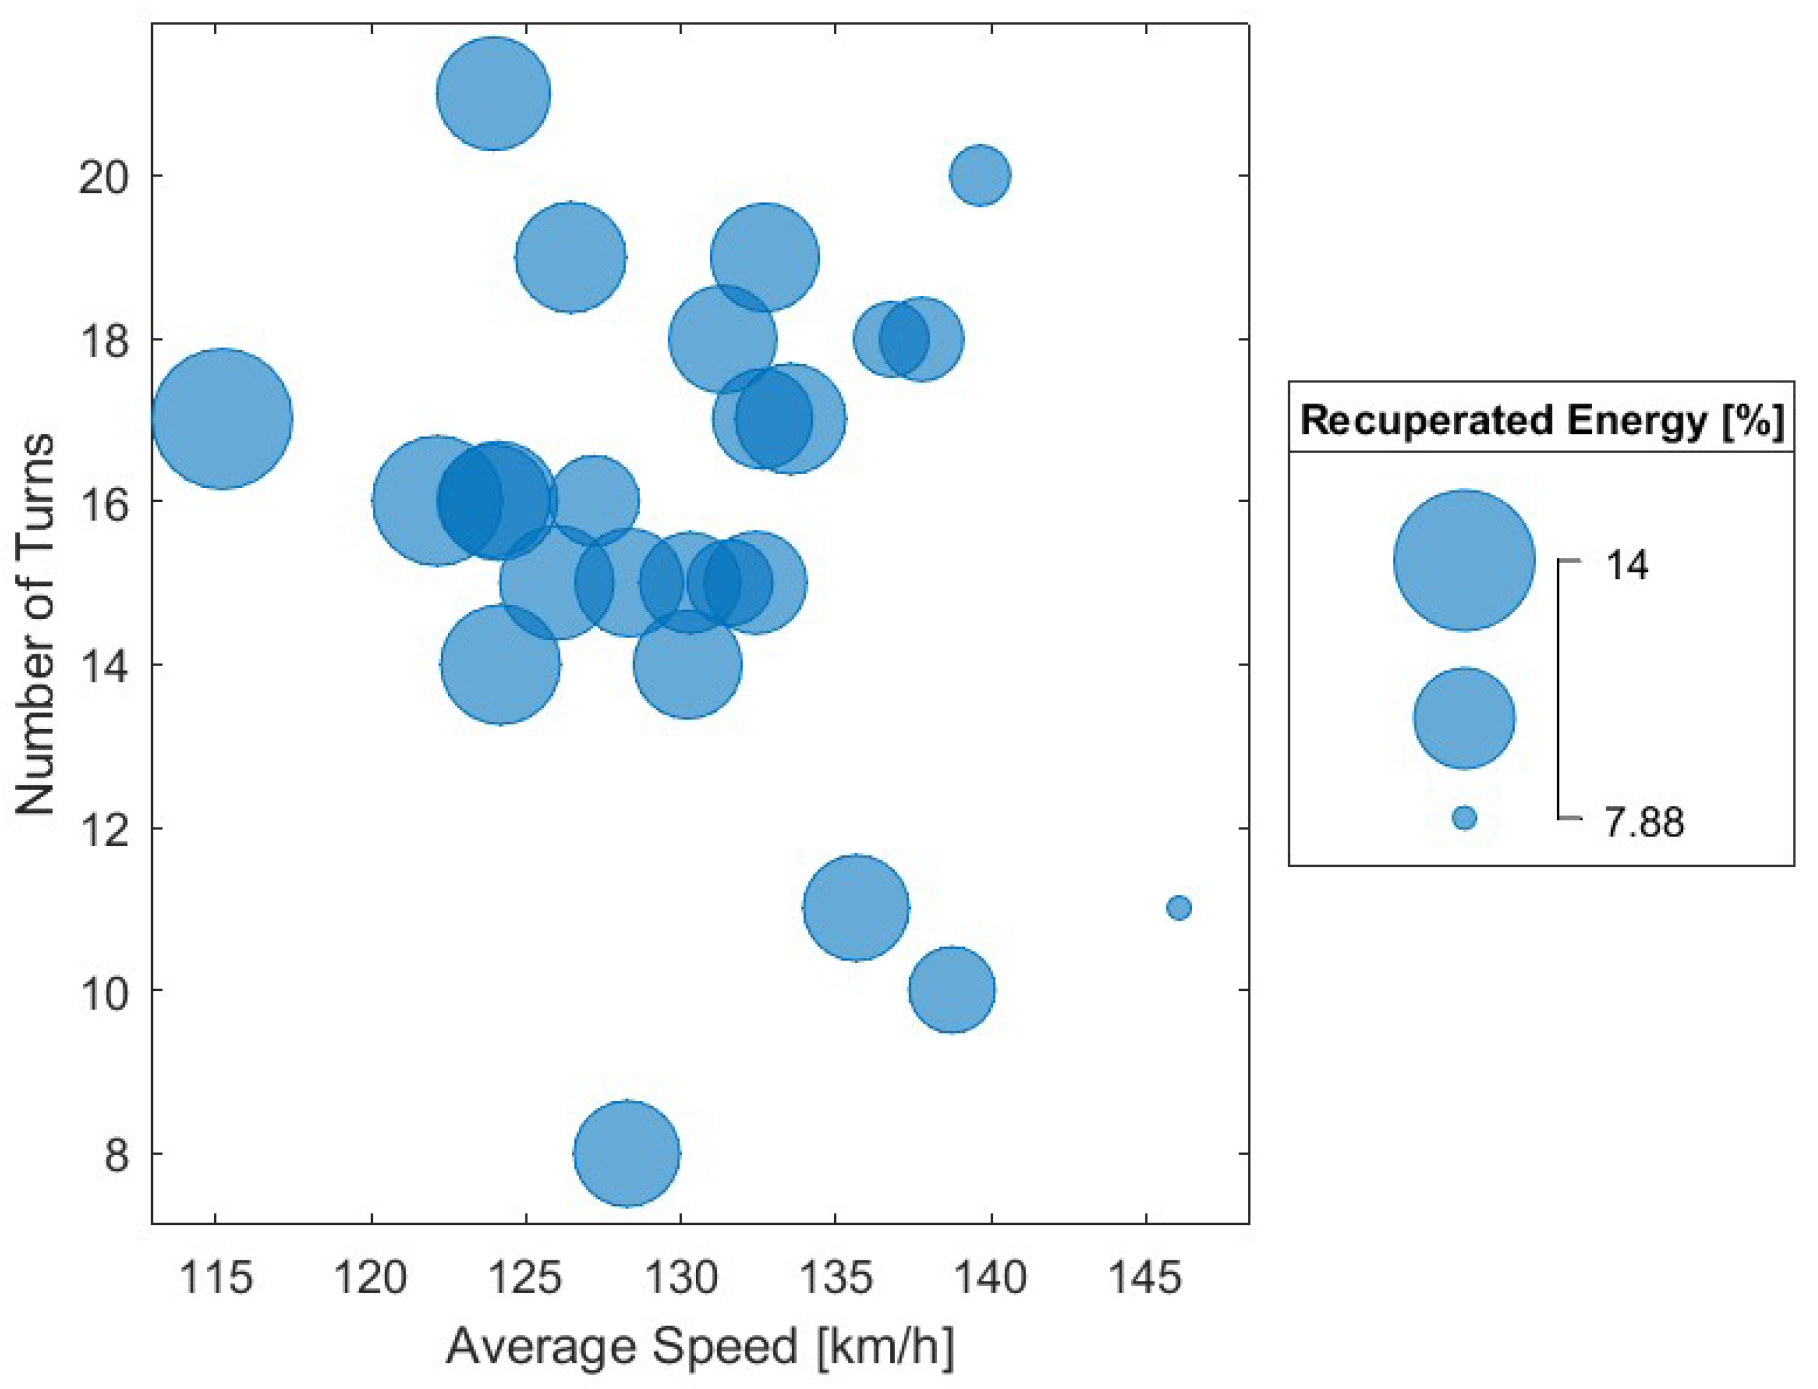
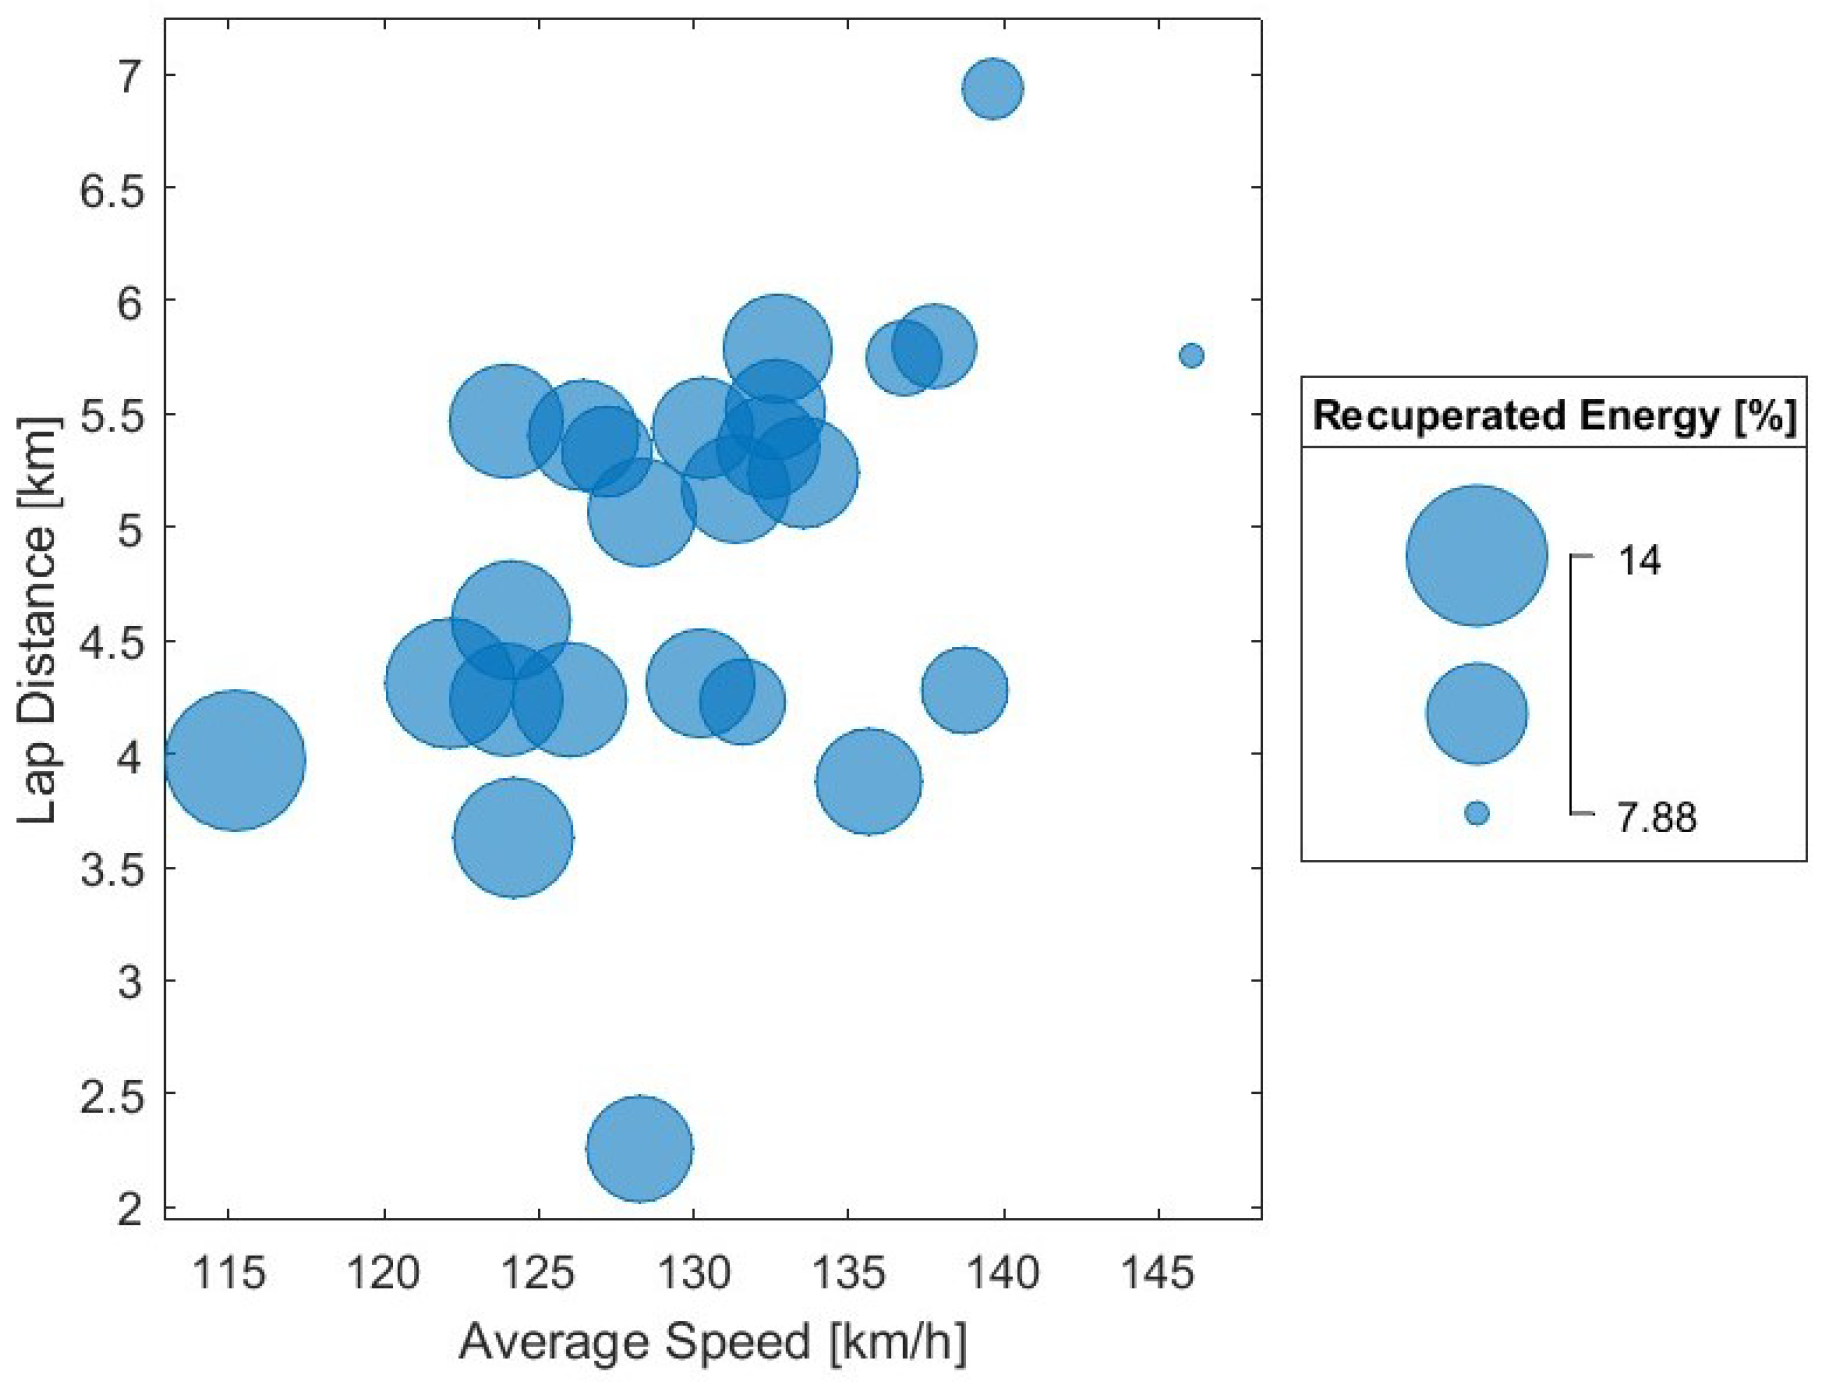
Figure 14 and
Figure 15 visually represent how the recuperated energy and average speed vary with the other two track variables.
As per
Figure 14, there is no clear dependence of recuperated energy and average speed with the track’s number of turns. Recuperated energy (bubble size) increases for lower average speeds, on the
x axis, from 7.88% to a maximum of 14%. The number of turns (
y axis) does not have a connection with average speed since recuperated energy values for tracks with the least number of turns are almost equal to those obtained for tracks with the highest number of turns.
Figure 15 shows a slight connection between recuperated energy, average speed and lap distance. The
y axis is now represented by the lap distance, and the recuperated energy values (bubble size) seem to increase not only with decreasing average speeds but also with decreasing lap distances.
4.3. Variation of Recovered Energy Circuit de Barcelona–Catalunya
The results obtained for the Barcelona–Catalunya circuit are examined here, in further detail.
The LapTime performance of the TLM03e in its first lap of this circuit is visualized in
Figure 7, where the gradient of velocity is represented as a colorbar. This color scheme facilitates the detection of regeneration zones, seen in red, with lower velocities due to braking. These are the zones where the vehicle is able to recuperate energy.
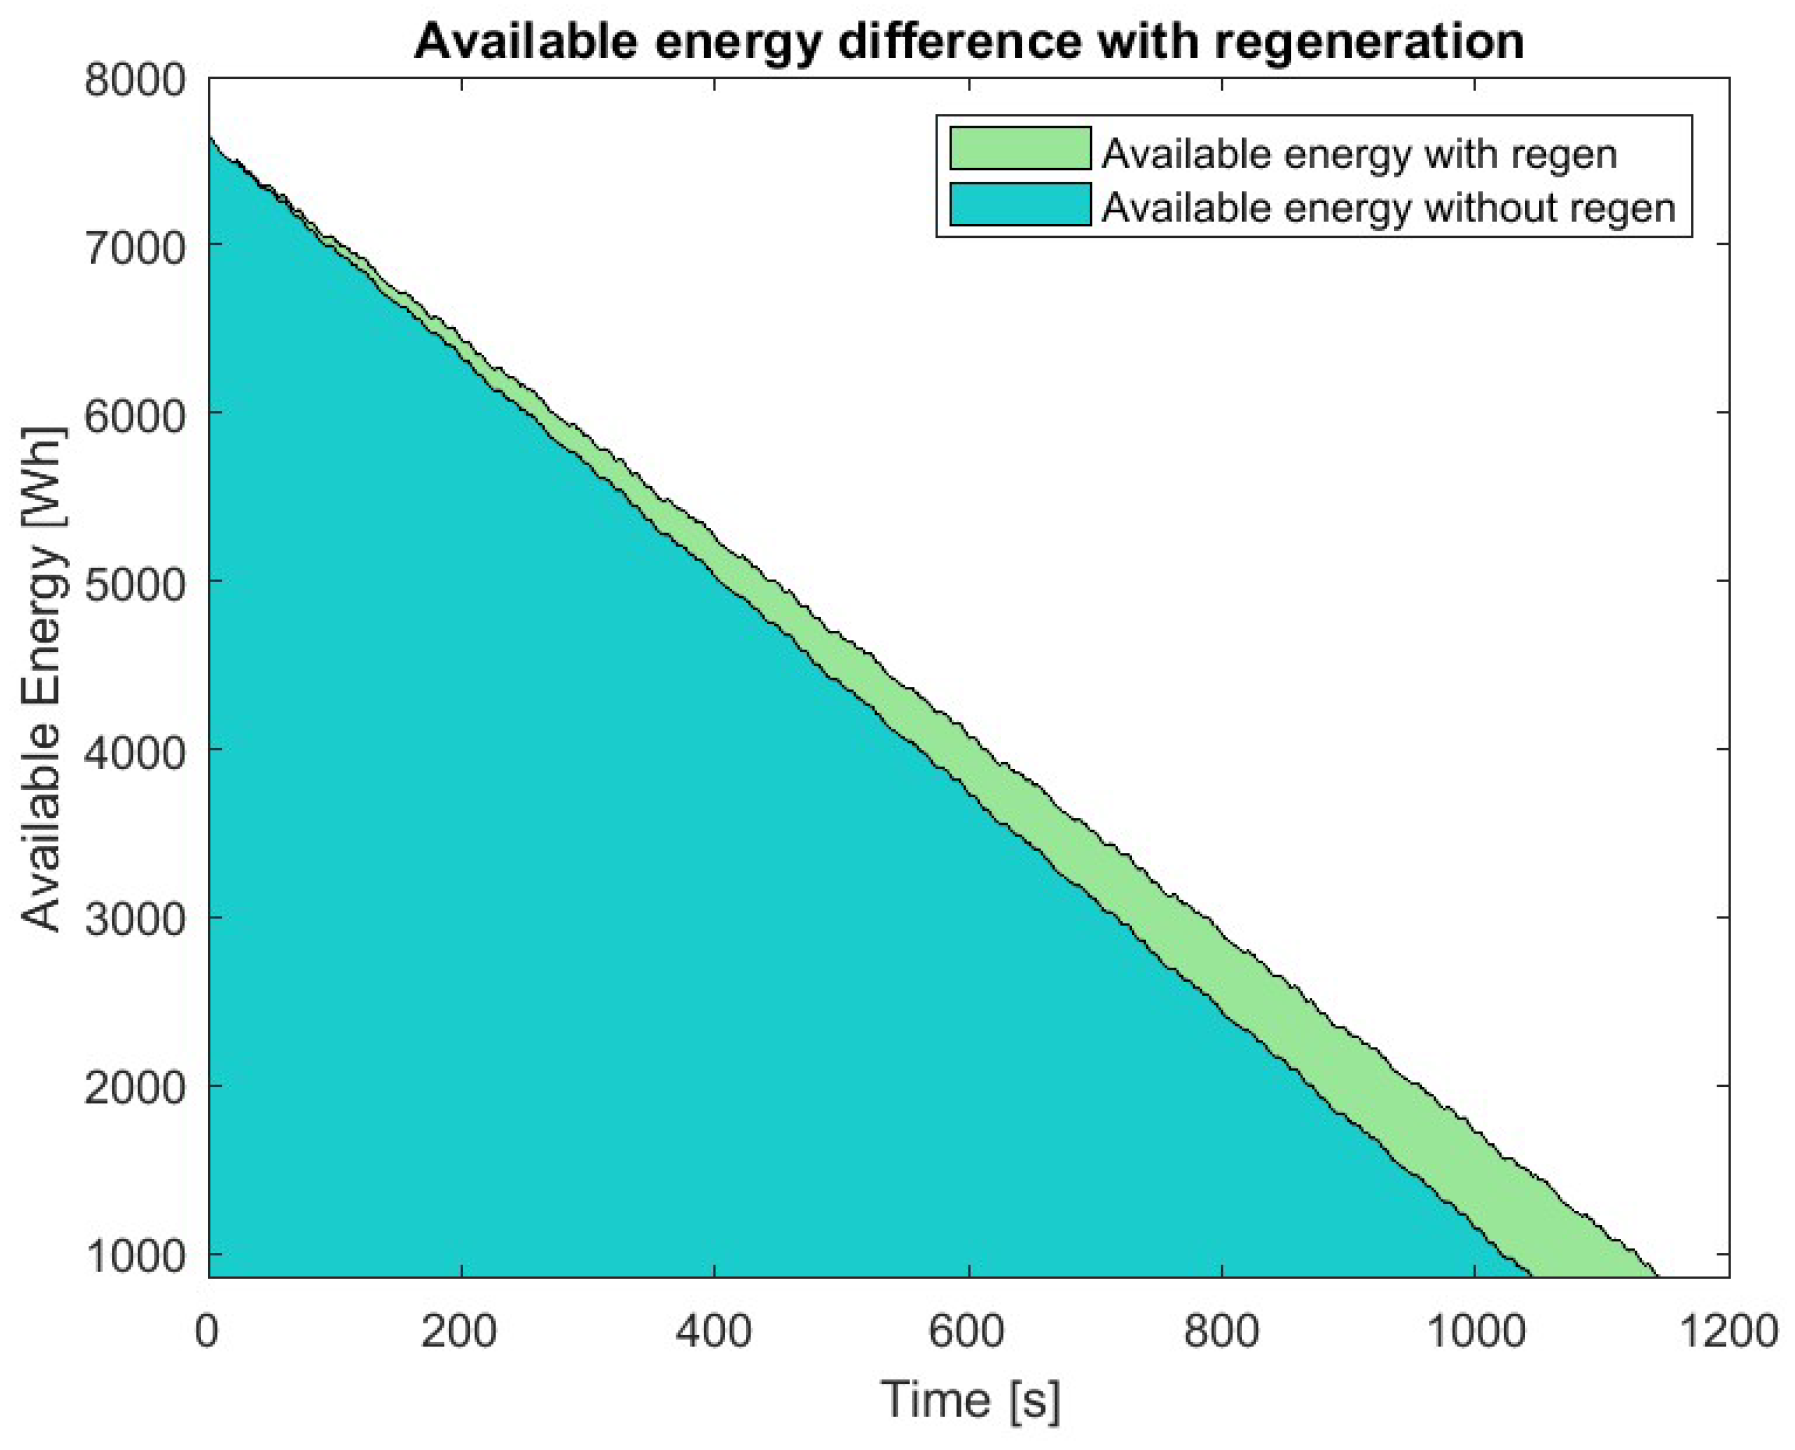
Figure 16 is a graphical representation of the available energy with and without regenerative braking (in green and blue, respectively), for a specific time period. Whenever the motorcycle brakes, seen as a decrease in velocity in
Figure 17, the available energy of the system without regeneration is constant since no acceleration is required from the motor. However, in the regenerative braking situation, there is an increase in available energy.
The cumulative recuperation of energy until 10% SOC is reached is seen in
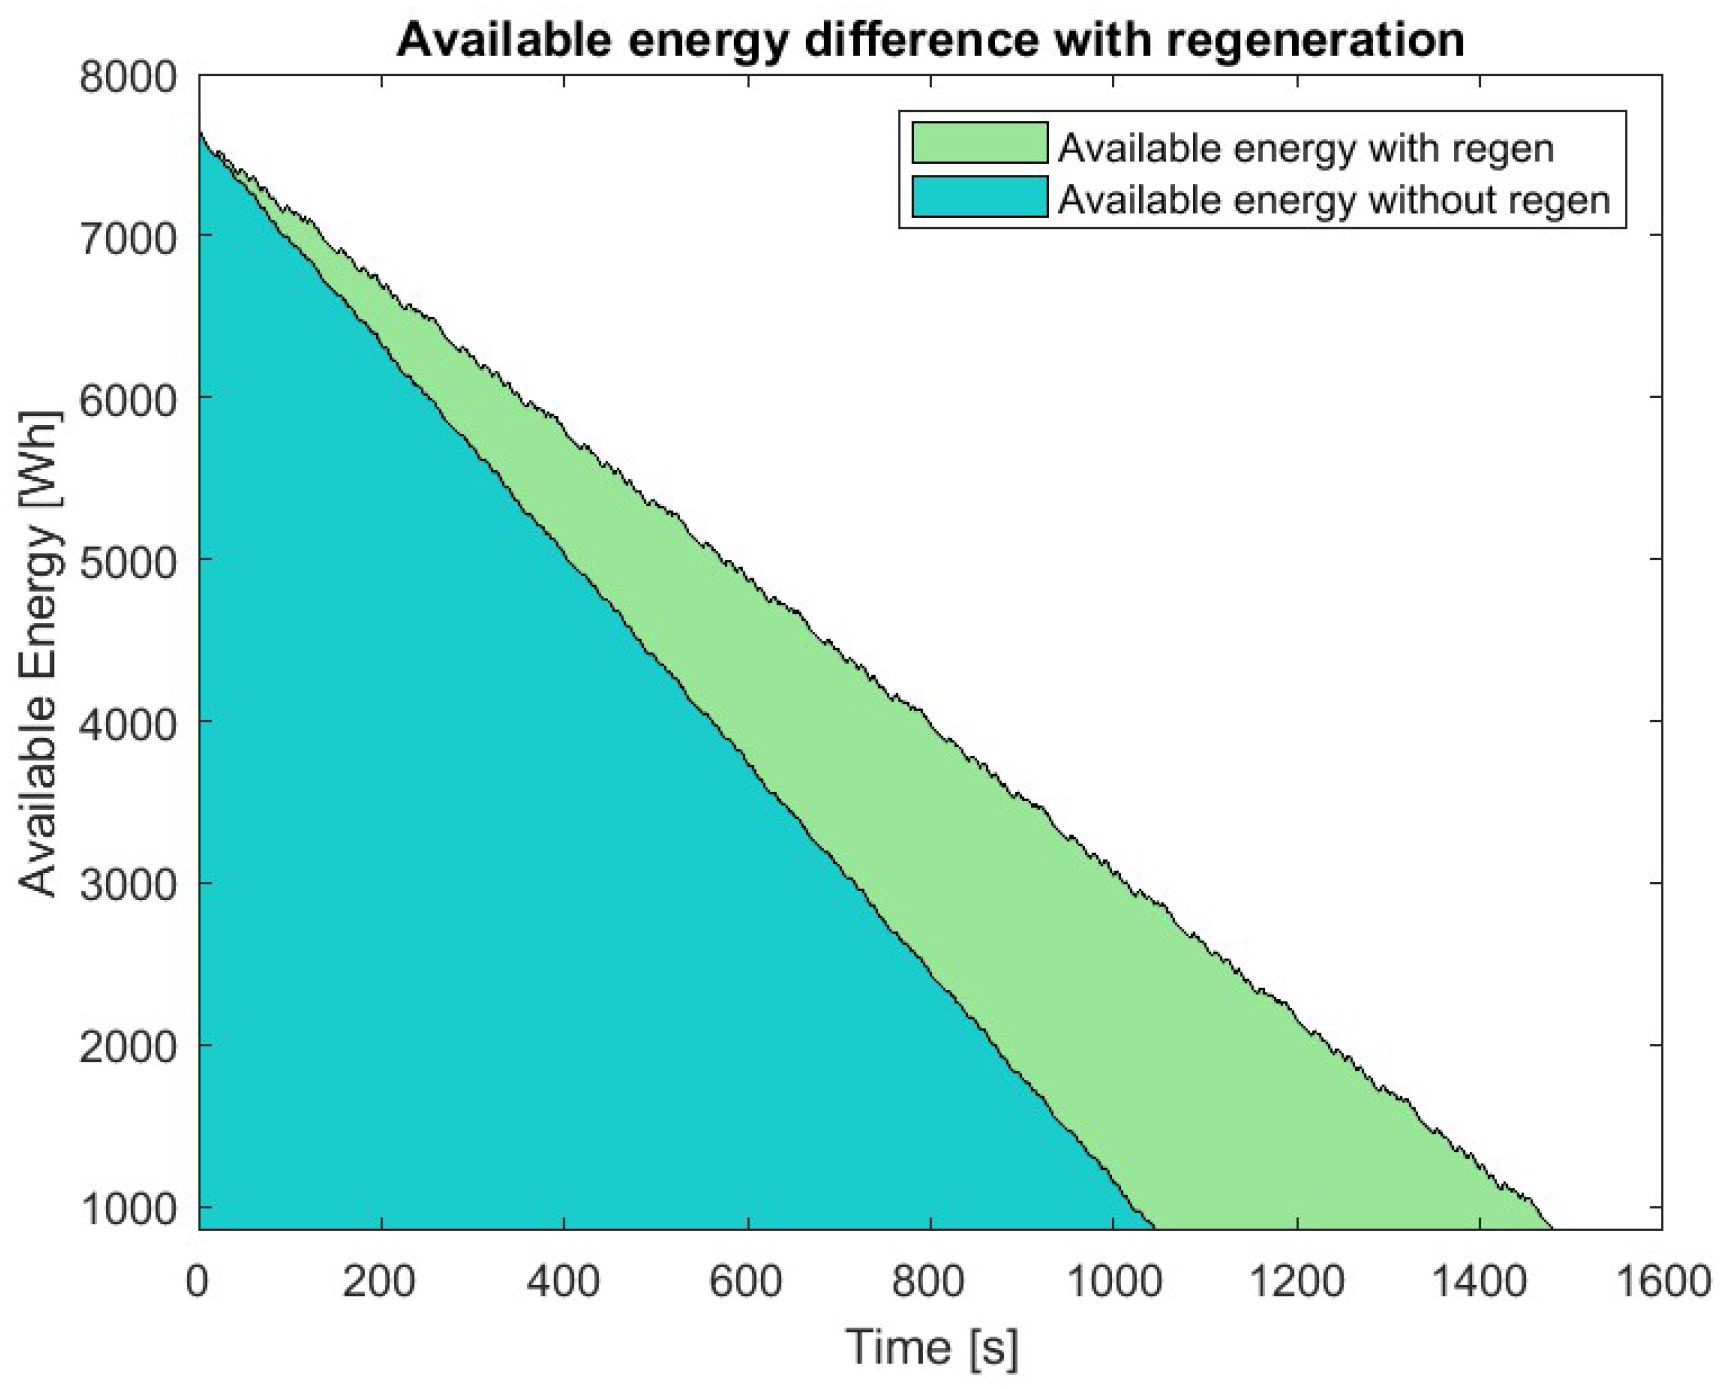
Figure 18. The regen system gathered 812.10 Wh, an increase in energy capacity of 12.21%, which allowed the vehicle to extend its track time in 99.7 s for an additional distance of 3.538 km (9.80% distance increase). This increase in distance is enough for the motorcycle to complete 8 full laps instead of 7.
5. Sensitivity Analysis
The circuit analyzed in
Section 4.3, Circuit de Barcelona–Catalunya, was selected for a sensitivity analysis in this section. First, an analysis was carried out on the percentage of rear braking and further on the mass of the system (motorcycle plus rider).
The results are compared in
Table 7 for several percentages of rear braking (R. Braking), meaning, for different percentages of braking, which is regenerative.
The realistic values of 25 to 35% of regenerative braking show energy recovery values of 9.93% and 14.63%, respectively. When the rear braking is responsible for 25% of the total braking force, a distance of 39.001 km is driven by the vehicle. If, however, 35% of the total braking force is regenerative, a distance of 40.301 km can be driven, an increase of 0.666 km from the 39.635 km driven with 30% regenerative braking.
When the braking bias is 0%, all of the braking force is applied on the rear wheel. This situation, represented in
Figure 19, would be ideal for regenerative braking since all braking would be regenerative. This would lead to an increase in distance from 36.097 km traveled without regeneration to 51.169 km with regeneration.
A
variation of the total mass (rider + motorcycle = 220 kg) was also performed. For this, new lap times were calculated using the developed software and the recuperated energy values in
Table 8 were obtained.
If the total mass of the system were to decrease by 5% (=11 kg) to 209 kg, the percentage of recuperated energy would decrease to a value of 12.03%. However, the traveled distance would increase from 39.635 km to 40.527 km.
If the total mass of the system increases to 231 kg, the energy recuperation results increase to a value of 12.45%, although the traveled distance decreases to 38.886 km.
To achieve the same velocity as the motorcycle with 220 kg, more energy is required in the 231 kg scenario as kinetic energy in Equation (
4) needs to increase. Hence, even though more energy is also recuperated in the 231 kg situation, the traveled distance actually decreases. The exact opposite occurs for the 209 kg scenario, where the energy required to attain the same velocity decreases and although less energy is recuperated, the traveled distance is improved.
6. Conclusions
This paper applied the methodology for determining the amount of energy recuperated via regenerative braking in several racetracks for a student-built electric racing motorcycle prototype (TLM03e) for the MotoStudent competition. A developed software MATLAB (Matlab R2022a version) simulated lap times around all of the tracks, including initial and flying laps. With the obtained velocity time series and, using a percentage of 30% of rear regenerative braking, a developed MATLAB/Simulink software (Matlab R2022a version) determined the results of recuperated energy per circuit. Sensitivity analyses of the percentage of rear braking and the mass of the prototype plus the rider were performed to help draw more conclusions.
Results show the following:
Recuperated energy values range from 7.88% to a maximum of 14% with an average of 11.11% recovered per circuit, which translates into an average traveled distance increase of 8.8%.
Recuperated energy depends strongly on the average speed of the circuit, slightly on the lap distance and not at all on the number of turns. If average track speeds are lower, more braking scenarios occur and, therefore, higher regenerated energy values are expected.
A sensitivity analysis leads to a conclusion that increasing 5% of the percentage of regenerative braking results in increases of 666 m in traveled distance for the Catalunya circuit. If the percentage of rear braking were to suffer a decrease of the same magnitude, the traveled distance would decrease by 634 m.
A sensitivity analysis on the weight of the system revealed that diminishing the weight from 220 kg to 209 kg (5%) leads to a 0.18% decrease in recuperated energy results. If the mass were to increase by the same amount, recuperated energy results would increase by 0.24%.
Regenerative systems can provide the vehicle with significant recuperated energy values, according to the cases studied in this paper. These allow the TLM03e prototype to run one more lap in almost every circuit, using 100% of its power and 30% regenerative braking. If endurance is the sole purpose of a race, values higher than 30% regenerative braking can be used, which, combined with a lower power usage, will result in a very good distance increase.
In a racetrack, elevation differs several meters from the starting value during a lap. When not accounting for this variation, the velocity and, consequently, kinetic energy are overestimated. Hence, future work can include the height (and inclination) values of the racetracks.
Since almost 70% of the braking force is applied on the front wheel, it would be of scientific interest to study solutions that redirect some of that energy to the regenerative braking system as well in future work.
The validation of the theoretical results with experimental data is very interesting and of the utmost importance. However, the utilization of regenerative braking systems in motorcycles is quite new, and experimental results in racing scenarios are not publicly accessible. Due to this issue’s relevance, it is certainly one that will be addressed in future work.

