Article

Flow Analysis of a Novel, Three-Way Cartridge Flow Control Valve

1
Faculty of Mechanical Engineering, Cracow University of Technology, 31-864 Cracow, Poland
2
PONAR Wadowice, Wojska Polskiego 29, 34-100 Wadowice, Poland
*
Author to whom correspondence should be addressed.
Appl. Sci. 2023, 13(6), 3719; https://doi.org/10.3390/app13063719
Submission received: 9 February 2023 / Revised: 6 March 2023 / Accepted: 13 March 2023 / Published: 14 March 2023
(This article belongs to the Special Issue Industrial Applications of Computational Fluid Dynamics)

Abstract

:
Flow control valves are designed to maintain a constant flow rate regardless of pressure changes. However, standard, two-way design may cause significant energy losses due to the need to maintain high pressure in the supply line. In contrast, the proposed three-way valve allows the required flow rate to be obtained at a supply pressure slightly above the loading pressure. This work included building mathematical and simulation models, conducting numerical simulations in Ansys/Fluent and Matlab/Simulink environments, and verifying the results by initial test bench experiments on a valve prototype. The main contribution provided by the work concerns the proposal of a new valve solution and the estimation of its operational characteristics.

1. Introduction

Numerous solutions used in hydraulic drives to control the volumetric flow rate are based on throttle valves. Elements of this type are characterised by simple construction and reliability. However, they also have significant disadvantages, which include high susceptibility to pressure changes and energy losses. The heat released at the throttling gap is mainly discharged with the hydraulic oil to the tank, which leads to a rapid increase in temperature and requires the use of coolers with adequate power. These disadvantages can be primarily reduced by using flow control using a throttling element and a differential valve. Many solutions of this type are developed in the industry and combined with other hydraulic control components, such as proportional valves, load sensing valves, servo-valves or electronically controlled valves. The issue of reducing heat generation and thus reducing energy losses in hydraulic systems is often taken up in studies conducted by leading research centres.
Flow control valves are used to obtain a fixed flow rate independently from the pressure. There are two main methods to increase the accuracy and reduce the energy losses of these valves: geometric modifications or the development of new control systems. An advanced digital flow compensator combined with a flow control valve was designed by Huang et al. [1]. Compared to the basic version, the use of the developed compensator allowed for a significant reduction of the dead zone and an improvement of the static flow characteristics. A novel design of a rotary hydraulic flow control valve for high flow rate fluid power systems was presented by Okhotnikov et al. [2]. Due to high flow rates, and thus a significant part of flow forces in the balance of forces acting on the throttling elements, a sophisticated multi-staged servo valve system was used for flow regulation. In turn, Lisowski and Filo analysed the characteristics of flow control valves, including geometric modifications to the spool geometry to extend its operating range [3] and modelling a single-pump multiple-receiver system with the usage of several parallel connected two-way flow control valves [4]. Moreover, Liu [5] worked on flow force compensation in a cartridge valve, and Jiang [6] investigated dynamic performance of a two-position four-way directional cartridge valve. Numerous further studies have addressed the usage of flow control valves in special applications such as an electro-hydraulic hitch control valve of an agricultural tractor [7], a metering valve for adjusting the flow rate at the inlet and outlet ports of the boom cylinder of an excavator [8], a fuel flow rate control system for aeroengines [9] or a flow control valve for stroke speed adjustment of a robotic lifting device [10]. Furthermore, similar solutions related to flow rate control are also used in hydraulic drives of vehicles, including tracked ones [11] and articulated ones [12]. In the field of research on the use of advanced flow control valve regulation techniques, one can find articles related to neural networks and genetic algorithms. Artificial neural networks are used as adaptive components of hydraulic control systems, e.g., to regulate flow rate without the flowmeter [13,14], or approximate and compensate flow rate changes due to load disturbances [15]. Genetic algorithms are utilised mainly for optimisation, e.g., to adjust parameters of a stepless flow control system [16] or a dual-mode wheel loader hydraulic steering system [17]. Numerical analyses of hydraulic components and systems are often conducted using CFD methods. Among the latest publications in this field, one can mention the work on the study of flow through tandem square cylinders [18], improvement of a ball control valve performance [19], a study on a spool valve flow force compensation [20] and the transient flow analysis of a proportional two-solenoid valve [21] as well as a check valve [22].
This article concerns numerical and experimental studies of a cartridge-type three-way flow regulator for installation in a valve block. The studies are aimed at estimating the flow forces acting on the valve spool and determining its operational characteristics. The proposed valve is advantageous compared with the standard, two-way constructions because it ensures maintaining the set flow rate in the working line without the need to maintain high supply pressure. Moreover, it is a reliable valve with a relatively simple design and manual adjustment by the operator and does not contain electronic measurement and regulation equipment. It can be a crucial flow control component of a hydraulic drive, especially in the case of operational or environmental conditions that preclude the use of electronic systems and electrical power.

2. Case Study: Working Principle of a Cartridge Flow Control Valve

In the design of flow regulators, there is a series or parallel connection of a throttling valve and a differential valve. These two elements connected in series form a two-way flow regulator (Figure 1a). In the case when the differential valve is attached to the throttling valve in parallel (Figure 1b), a three-way regulator is obtained. In practice, the designation for flow regulators is simplified, as shown in Figure 1c. The flow regulator can be placed in various places in the hydraulic system. However, most often it is the supply line where the valve controls the flow rate, and thus, the speed of movement of the receiver, such as an actuator or hydraulic motor.
The geometric model of the studied flow regulator is shown in Figure 2a and the cross-section in Figure 2b. Working fluid flows from supply port P to the output port A. The relief port B is used to discharge excess fluid. A pressure difference on both sides of the spool (4), moving inside the sleeve (3) is created by the throttling nozzle (5), depending on the flow velocity.
The spool position is determined by adjusting the spring (6) tension and the pressure difference on both sides. In this case, the port B opening area is crucial. The cross-sectional area of the port B gap also depends on the position of the spool (4); however, with the spool displacement, it enlarges much faster than the area of port A decreases. By imposing the appropriate initial spring tension value and fixing the proper throttling nozzle diameter, the desired flow rate can be obtained, assuming the sufficient delivery of the supply unit.
Figure 3 shows a 3D model of the working fluid flowing through the valve, built by performing Boolean operations on a geometric model.
The incoming fluid from the P port is divided into two streams: main A and relief B. The A stream narrows in the area of the throttle nozzle and then bends at an angle of 90 degrees to flow out through the radial holes in the spool and the sleeve to the A port. The flow area of the radial holes decreases when the spool moves along the sleeve. This fluid jet contraction, together with the main throttling nozzle, forms a cascade flow throttling system.

3. Methodology

The research methodology includes formulating a mathematical model, defining a discrete CFD model and its parameters, such as boundary conditions and turbulence model and assessing mesh quality.

3.1. Mathematical Model

The formulated mathematical model includes a variable speed pump, a studied flow control valve and two relief valves (Figure 4).
A vane pump with eleven vanes was used as the supply unit. The theoretical flow rate against the rotational angle α depends on the eccentricity e p . It can be calculated from the following equation:
Q 0 ( α ) = [ r e p 2 · ( 1 + c o s ( α ) ) ] · ω 0 · b · e p · ( 1 c o s ( α ) ) ,
where the pump design parameters are r = 43 mm and b = 20 mm. The required flow rate of Q 0 = 30 dm3 · min1 is obtained for the eccentricity value e p = 2.5 mm. The resulting non-uniformity of the flow is 2.13 %. Nominal value of rotational speed ω n o m = 1440 rot · min1 is reached after the starting time t s t a r t , when it increases linearly from zero:
ω 0 ( t ) = ω n o m · t / t s t a r t for t < t s t a r t ω n o m otherwise .
Having determined pump flow rate Q 0 as the input, a mass conservation equation can be formulated for the supply line of volume V 0 :
d p 0 ( t ) d t = B f V 0 · ( Q 0 ( t ) Q r ( t ) Q 1 ( t ) Q B ( t ) ) .
The safety relief valve (2), for which a detailed model one can find, e.g., in [23] is used to protect the system against excessive pressure build-up. The load-generating relief valve (4) has an analogous structure. The model uses the safety valve characteristics described by the equation for the range of its nominal operation:
Q r ( t ) = p 0 p r Δ p v 2 · Q v 2 , n o m ,
Q 2 ( t ) = p 2 p r Δ p v 4 · Q v 4 , n o m .
The flow rates through the inlet throttle nozzle n 1 , as well as the g A and g B gaps of the flow control valve (3), can be determined from Equations (6)–(8), respectively:
Q 1 ( t ) = A n 1 · μ n 1 · 2 / ρ   ·   | p 0 ( t ) p 1 ( t ) | ,
Q A ( t ) = A g A ( x 1 ) · μ g A ( x 1 ) · 2 / ρ   ·   | p 1 ( t ) p 2 ( t ) | .
Q B ( t ) = A g B ( x 1 ) · μ g B ( x 1 ) · 2 / ρ   ·   | p 1 ( t ) p r ( t ) | .
The input nozzle is changeable. The following diameters were established for studies: d 1 = 2.5 , 3.5 , 4.5 , 5.5 mm. However, for the given diameter, the nozzle area is constant. Therefore, the discharge coefficient was also assumed to be constant, μ n 1 = 0.7 . The areas of g A and g B gaps depend on the x 1 spool position, according to Figure 5. Discharge coefficients of these gaps were assumed as μ g A = μ g B = 0.6 . The main outlet gap of the valve A g A is created by exposing four radial holes in the spool and the sleeve. Its cross-section is a non-linear function of the spool displacement. Similarly, the A g B discharge slot area of the annular shape also depends on the spool position, shown in Figure 5.
The flow control valve spool of the m s mass is subjected to the hydrostatic force F h s resulting from the difference between p 0 and p 1 pressures acting on the spool area A s , the spring F s p r , viscous friction F ϕ and hydrodynamic reactions caused by the change of flow direction in the g A and g B gaps, F h d A and F h d B , respectively. The hydrostatic force F h s ( t ) = ( p 0 ( t ) p 1 ( t ) ) · A s . The spring force includes the initial tension x s p r , 0 and the deflection from spool position: F s p r ( x 1 ) = ( x s p r , 0 + x 1 ( t ) ) · k s p r . Viscous friction depends on the fluid viscosity η , damping factor ϕ and spool velocity: F ϕ ( t ) = η · ϕ · d x 1 d t . Hydrodynamic forces arise as a result of the impact of the Q A and Q B fluid streams on the spool, for which equations of axial components [24] can be written as follows:
F h d A = ρ · Q A · ( v g A , o u t   ·   c o s ( θ A , o u t ) v g A , i n · c o s ( θ A , i n ) F h d B = ρ · Q B · ( v g B , o u t · c o s ( θ B , o u t ) v g B , i n · c o s ( θ B , i n ) ) .
The v g A , i n , v g A , o u t , v g B , i n , v g B , o u t are the average velocities determined at inlets and outlets of the gaps, while θ A , i n , θ A , o u t , θ B , i n , θ B , o u t are the corresponding fluid jet angles.
m 1 d 2 x 1 ( t ) d t 2 = F h s ( t ) F ϕ d x 1 ( t ) d t F s p r ( x 1 ) + F h d A + F h d B .
The pressure difference Δ p = p 0 p 1 arises due to the flow through the inlet nozzle. There is a p 2 pressure resulting from the system’s load at the valve outlet. The mass conservation equation defined for the load line is used to calculate p 2 pressures:
d p 2 ( t ) d t = B f V 2 · ( Q A ( t ) Q 2 ( t ) ) .
The system of equations is closed by the pressure equation p 1 inside the flow control valve. Its value can be determined assuming that the nozzle n 1 and the slot n A form a cascade. In this case, the following relation holds:
p 1 ( t ) = A n 1 · μ n 1 · p 0 ( t ) + A g A · μ g A · p 2 ( t ) A n 1 · μ n 1 + A g A · μ g A .

3.2. Discrete Model and Mesh Quality Assessment

The discrete fluid model is presented in Figure 6. The model has one inlet surface P and two outlet surfaces, A and B. The mesh comprises irregular elements, including tetrahedrons in the bulk flow and prisms at the boundaries. Tetrahedral elements are more convenient for modelling complex geometry, including throttling gaps and flow channels, than others, such as hexahedral or polyhedral. Pressure–velocity coupling was achieved using the pressure-based solver with the convergence condition 10 4 for both mass and momentum residuals.
The initial mesh was created in accordance with the general recommendations. Due to the complex geometry of the flow channels, forcing sudden shifts in flow direction and step changes in the cross-sectional areas, it was necessary to use the local grid refinement technique and conduct a mesh quality assessment process. Starting from the default mesh version, calculations were made, and the mesh was gradually refined in the vicinity of the flow gaps. The obtained flow rate against the number of mesh nodes and elements is presented in Table 1. The values of parameters and settings were assumed as for a real valve for nominal flow Q 1 = 10.0 dm3 min1 and the load line pressure p 2 = 10.0 MPa. The results show that as the mesh was refined, the obtained calculation result approached the laboratory results. However, increasing the number of elements above 1.2 · 10 6 does not affect the flow rate’s obtained value. Hence, the m 3 grid of 2.15 · 10 5 nodes and 1.19 · 10 6 elements was adopted for further simulations. The difference from laboratory results was less than 4%, while the computation time was about 210 min.

3.3. Physical Parameters and Boundary Conditions

Parameters of typical hydraulic oil were assigned to both Ansys and Simulink models. The pump flow rate, the load line pressure range and the Re range for the flow through the flow control valve were also determined. The values are summarised in Table 2.
The following boundary conditions have been defined for the Ansys simulations:
  • Inlet: average fluid velocity calculated based on the flow rate; velocity specification method: Magnitude, Normal to Boundary; inlet flow rate Q 1 = 30 dm3 min1;
  • Outlet A: static pressure; outlet condition: Gauge Pressure; pressure value: various values in subsequent simulations in the range p A = 1 30 MPa;
  • Outlet B: static pressure; outlet condition: Gauge Pressure; pressure value: various values in subsequent simulations in the range p B = 0.1–10MPa.

3.4. Turbulence Model

The calculated R e values indicate transitional or turbulent flow depending on the flow rate. At first, a turbulence model had to be selected. Based on the publications related to CFD research on hydraulic components such as pumps [25] and valves [26,27,28,29,30] the k- ε turbulence model was chosen. Since there are several variants of the k- ε model, including Standard, Realisable and RNG, some initial simulations were carried out to compare the results. The obtained results were virtually identical; hence the Standard k- ε model was selected as the least time-consuming one.
The Standard k- ε model comprises two transport equations, which can be found, e.g., in [31,32,33]. It is based on two major factors: kinetic energy of the turbulence k, and kinetic energy dissipation ε . The calculation process also requires determination of a number of parameters, such as turbulent viscosity μ t , turbulence intensity I, length scale and the constants s k , s ε , C 1 ε , C 2 ε and C μ . The values adopted based on the general recommendations of Ansys [34] and previous research by the authors [4,35] are presented in Table 3.

4. Results of Numerical Simulations

The results include velocity and pressure distributions obtained through C F D simulations and flow rate as a function of time for various load line pressures and initial tensions of the valve spring.

4.1. Results of CFD Simulations in Ansys

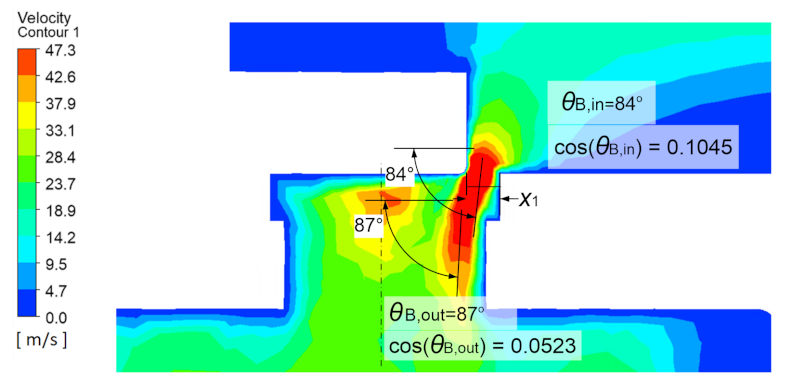
In the first step, maps of pressure and velocity distribution were determined, assuming the typical value of the supply pressure p 0 = 11 MPa and the same load on both outputs A and B with the pressure p g A = p g B = 10 MPa. A default nozzle diameter d n 1 = 3.5 mm and a spool displacement x 1 = 0.5 mm were used. As a result, the average value of the fluid velocity in the supply port v P , a v g = 19 m s1 was obtained. Figure 7a,b shows the pressure and velocity distributions in an isometric view on three mutually perpendicular planes drawn through the axes of the main valve channels. In turn, Figure 8a,b presents the same parameters in the cross-section relative to the longitudinal symmetry plane of the valve. Figure 9 shows an enlargement of the area around the flow slot of the B channel with an estimate of the jet angle value.
As presented in Figure 7a and Figure 8a, the inlet pressure in the P port is slightly higher than the pressure resulting from the loading of the outlet ports. The valve divides the inlet fluid stream into two streams directed to A and B ports. Due to the differences in cross-sectional areas of the gaps and the occurrence of the n 1 throttling nozzle, the division is uneven. The stream directed to channel A has an average velocity of 6.5 m/s, whereas to channel B it is 12.5 m/s. The fluid velocity increases locally through the B channel, and the stream bends. It significantly impacts the forces associated with the working medium flow. As seen in Figure 9, the cross-sectional area of the slot is perpendicular to the longitudinal axis of the valve. Hence, the fluid stream inflows to the gap at an angle θ B , i n = 84 , while the outflow bends at an angle of 87 . Since the axial component of the flow forces is proportional to the cosine of the fluid stream jet angle, and the outflow angle is greater than the inflow one, the flow force in the B gap acts in the direction of the spring force. In the case of the A channel, the medium flows out through radially arranged holes (Figure 7b and Figure 8b). Hence, the input and output jet angles are close to 90 , and the impact of the flow forces on the spool in this gap is negligible.
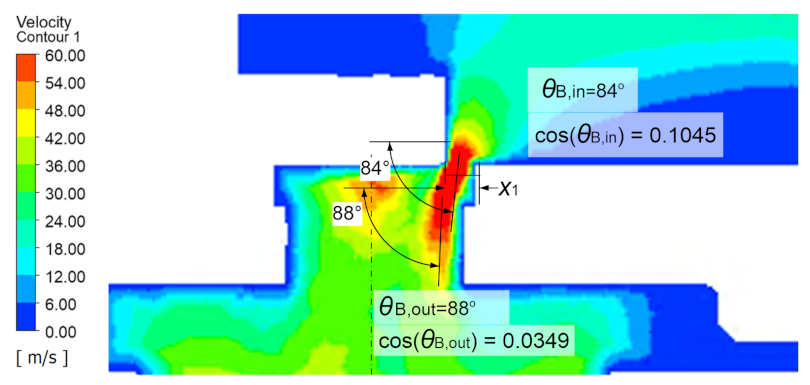
Flow through the flow control valve when ports A and B are loaded with different pressures are shown in Figure 10 and Figure 11.
In this case, the pressure p 0 = 5.5 MPa was assumed at the inlet to the valve, p 2 = p A = 5.0 MPa at port A, and p B = p r = 1.0 MPa at port B. With these data, the average value of liquid flow velocity at the valve input was 31.6 m s1, in the A regulated channel v = 5.2 m s1 and in the B relief channel v = 26.4 m s1. As shown in Figure 10, despite a significant surplus of the supply flow rate over the controlled value in B channel, the inlet pressure is only 0.5 MPa higher. The bending angles of the stream (Figure 11) in the B channel are similar to those obtained with the equal loading of both outputs θ B , i n = 84 and θ B , o u t = 88 .

4.2. Simulink Model and Results of Simulations

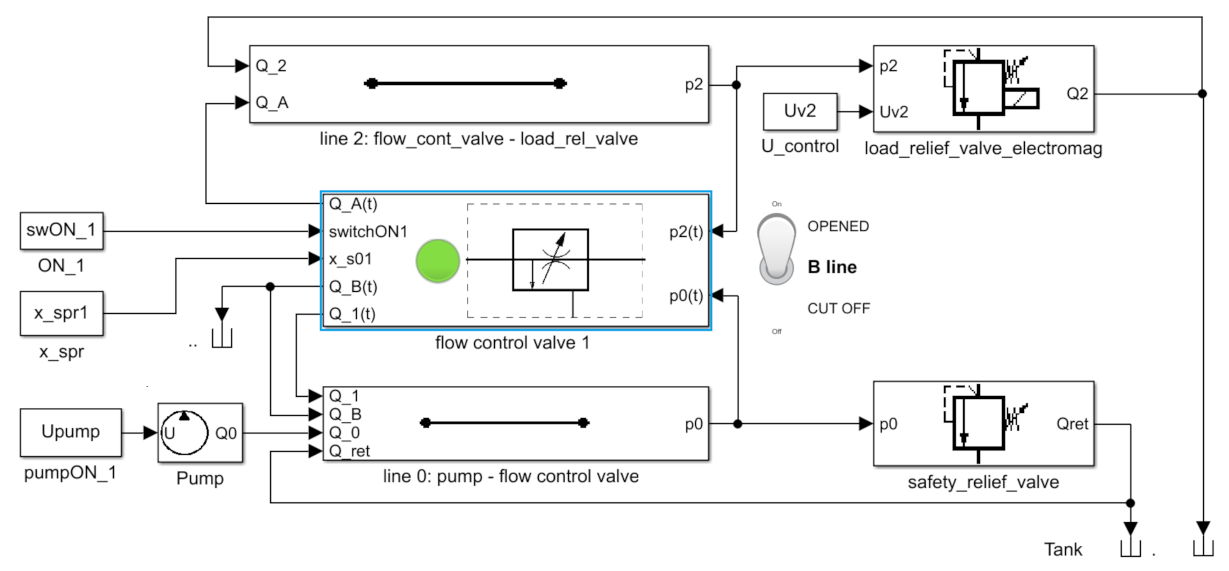
A general view of the hydraulic system model created in Simulink is shown in Figure 12.
As shown in the figure, the main hydraulic components are a pump, a flow control valve and two relief valves, including one that is electromagnetically controlled. The components are connected by two lines: a supply line and a load line. Additionally, there is a possibility to close the flow through port B of the flow control valve using the manual switch. The determined signals of pressure p and flow rate Q are transmitted between the components. The input parameters are initial spring tension x _ s p r 1 , the pump turn-on signal U p u m p 1 , the channel B opening signal s w O N _ 1 and the relief valve control signal U v 2 . Parameter values adopted for the simulations are presented in Table 4.
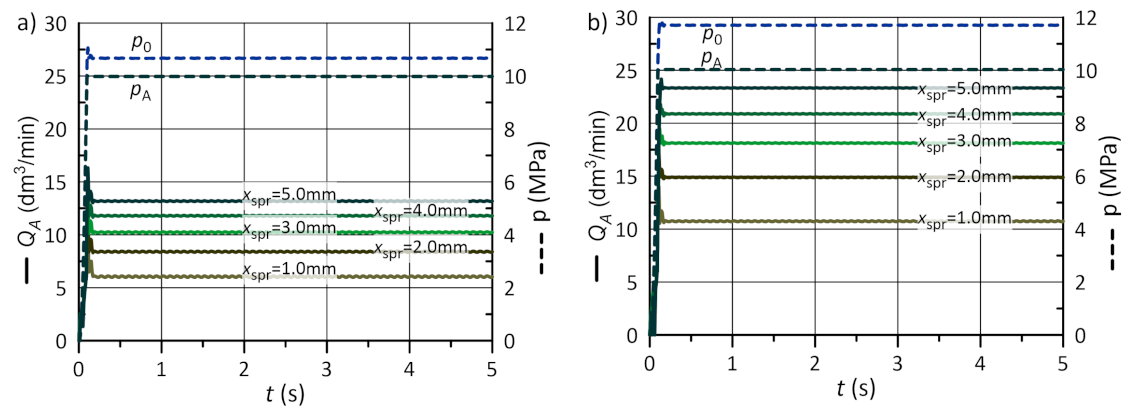
Figure 13 shows the flow rate values obtained by the flow control valve at constant pressure in the load line (valve port A) p 2 = p A = 10.0 MPa, assuming the fixed value of spring rate and variable initial spring tension. According to a typical valve operation, the relief channel B was assumed to be unloaded p B = p r = 0.1 MPa. Figure 13a shows the results obtained using a soft spring (spring rate k s p r = 10 N mm1), while Figure 13b shows the results after using a rigid spring ( k s p r = 40 N mm1). In the first case, the flow rate can be adjusted in the range of about Q A = 6 12 dm3 min1 with the maximum pressure drop Δ p = p 0 p A = 0.69 MPa. In the second case, the flow rate Q A = 12 24 dm3 min1 and the pressure drop Δ p = p 0 p A = 1.71 MPa.
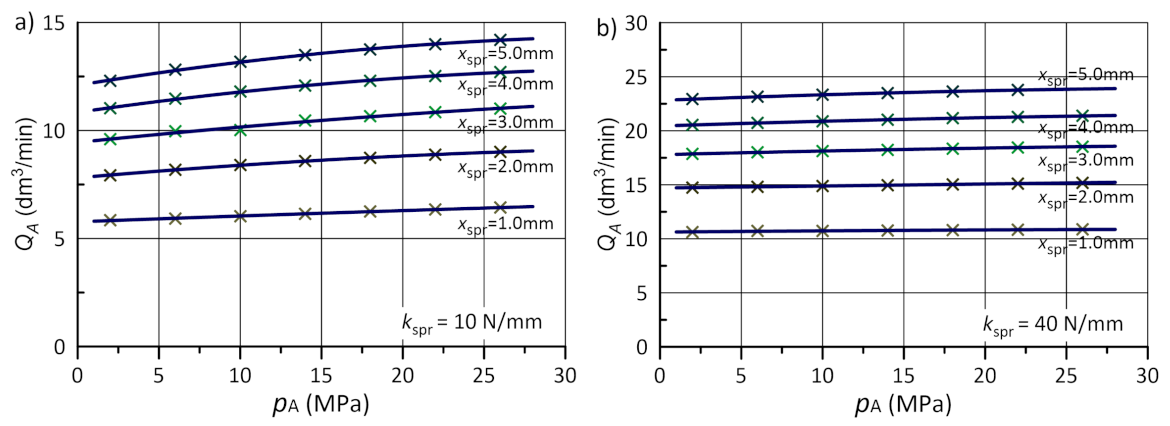
In turn, Figure 14 presents the course of the flow rate for constant spring parameters and changing pressure in the load line. Analogously to the previous simulation, Figure 14a shows the results obtained with soft spring and Figure 14b with a rigid one. To illustrate the accuracy of valve operation more clearly, the pressure–flow rate characteristic Q = f ( p ) was drawn from the results (Figure 15). The summarised results include both spring stiffness values and different initial tensions.
In the third stage, the ability of the flow control valve to compensate for the changing load was tested. For this purpose, simulations of the valve operation subjected to sinusoidally varying pressure in the load line with an average value of p 2 = p A = 10.0 MPa and an amplitude of 2.5 MPa were made. The results relating to different spring stiffness values are shown in Figure 16a and Figure 16b, respectively.
As seen from the charts, the supply pressure changes its value along with the load variation. Pressure in the supply line equals the load pressure increased by the drop across the valve. Nevertheless, despite fluctuations in the pressure, the regulated volumetric flow rate is maintained at a quasi-constant level with a deviation not exceeding 5%.

5. Laboratory Test Bench and Experimental Results

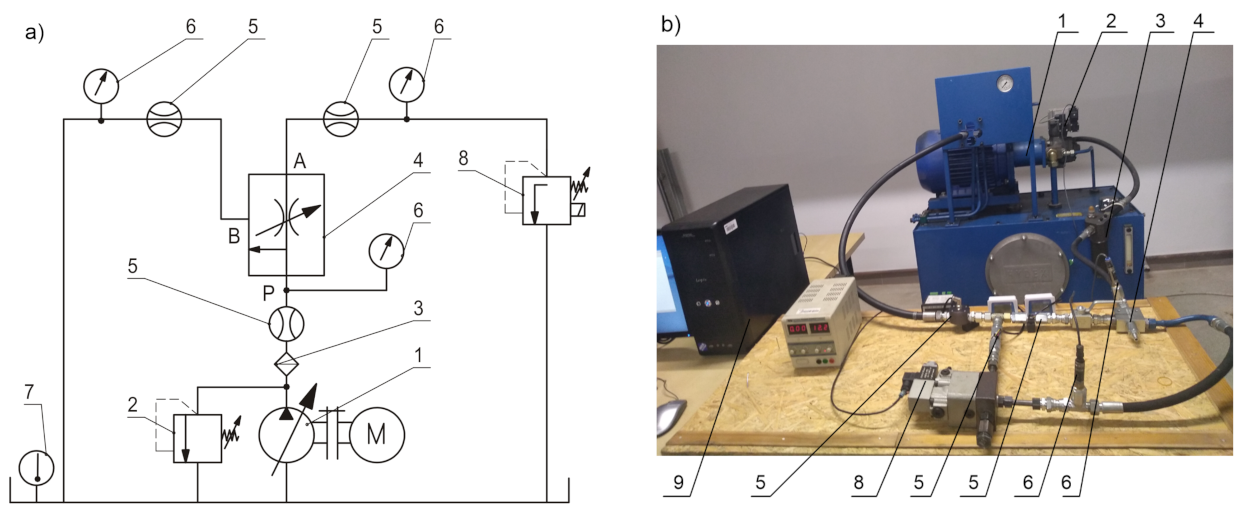
Figure 17 shows a diagram and an overall view of a test bench used for carrying out laboratory experiments. Through the supply system consisting of a variable displacement pump (1), a relief valve (2) and a filter (3), the input flow rate for the studied flow control valve (4) was generated. The pressure in the load line was set using the valve (8). Flow meters (5) and pressure transducers (6) were used to measure flow rates and pressures in all flow channels. The oil temperature in the tank was measured by a thermometer (7). Operational parameters of the measuring and data acquisition equipment, including the theoretical accuracies, are summarised in Table 5.
The experiments carried out on the test stand allowed the actual p-Q characteristics of the valve to be obtained. The procedure included the following steps: (a) installing a spring of appropriate stiffness, setting the initial tension to obtain a specific value of flow rate, (b) setting the minimum pressure in the load line, (c) switching on the power supply, (d) gradually increasing the load pressure to the maximum value by changing the relief valve setting and then (e) acquiring the measurement data with time step Δ t = 0.02 s.
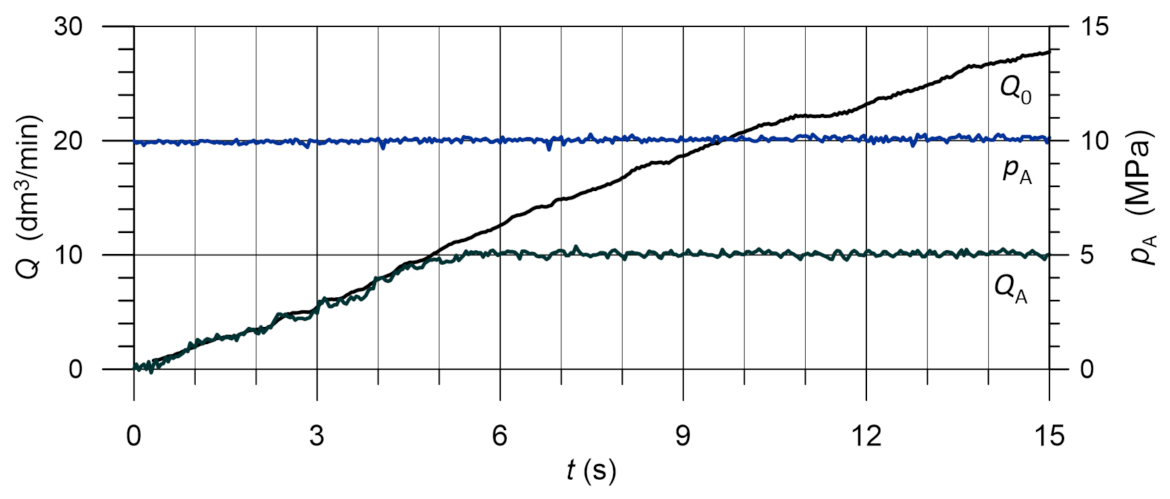
In the first step, the flow control valve settings were adjusted to the required flow rate Q A = 10 dm3 min1, while the load line pressure p A was changed in the range of 2–30 MPa. The pump flow rate was set to Q 0 = 30 dm3 min1, and the discharge channel B was not loaded. The obtained graphs of flow rate Q 0 ( t ) , Q A ( t ) and load pressure p A ( t ) are shown in Figure 18, while the uncertainties are summarised in Table 6.
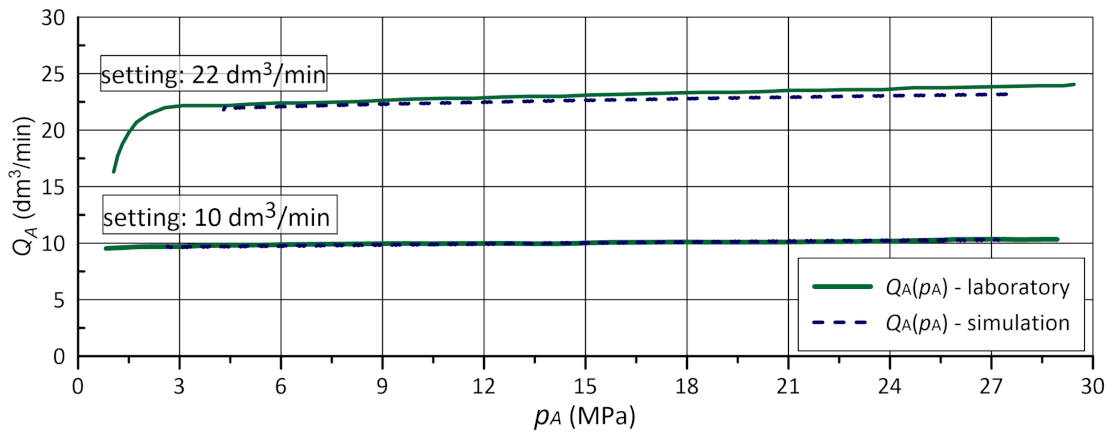
The approximated Q A ( p A ) characteristic with the corresponding result from the Simulink model is shown in Figure 19.
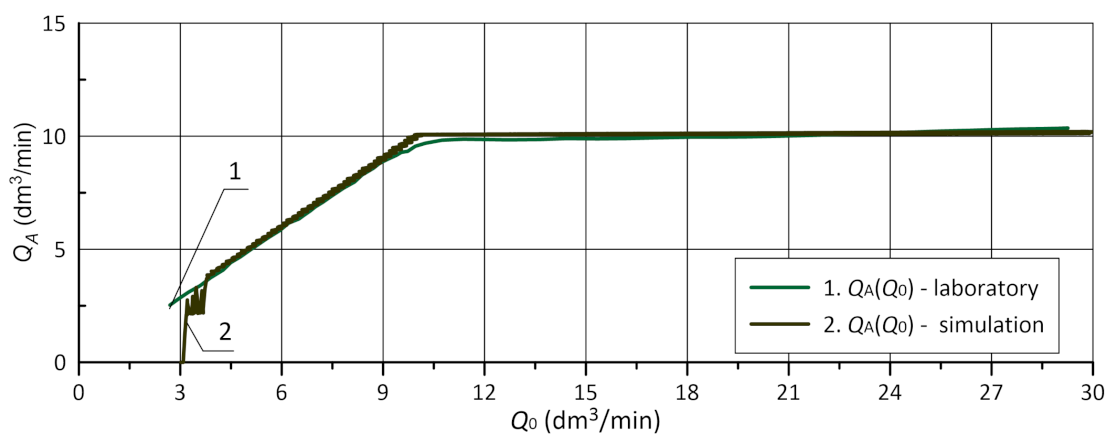
The valve response to a variable pump flow rate in the range Q 0 = 2 30 dm3 min 1 was tested in the second step. In this case, a constant load was also assumed in the load line Q A = 10 dm3 min 1. The obtained laboratory charts are shown in Figure 20, while a comparison of the approximated laboratory curve Q A = f ( Q 0 ) and simulation results is shown in Figure 21.

6. Discussion

The results show that the flow control valve is able to maintain the required flow rate regardless of the load pressure value. Figure 13 and Figure 14 show the possibility of adjusting the flow rate to a certain extent by changing the initial spring tension. If it is necessary to change the adjustment range more significantly, a spring with a different spring rate can be applied. The use of a stiffer spring allows a greater flow to be obtained; however, at the same time, energy losses rise due to the increase in pressure drop across the valve.
According to the obtained p-Q characteristic (Figure 15), the flow rate deviation in the entire considered load range does not exceed Δ Q A = 9 % for the low flow rate setting ( Q = 6.0 dm3 min 1) or Δ Q A = 4 % for a high flow rate ( Q = 22 dm3 min 1). In general, at a given setting, the flow through the valve rises as the pressure in the load line increases. This is due to the influence of the hydrodynamic force (Equation (9)), which was estimated with the help of velocity distributions obtained from CFD studies (Figure 9 and Figure 11).
In subsequent simulations, the ability of the flow control valve to compensate for the varying pressure in the load line was tested. For this purpose, the load line was assigned a sinusoidal p 2 pressure of average value 10MPa, amplitude 2.5 MPa and period 2s (Figure 16). The use of a flexible spring ( k s p r = 10 N mm1) resulted in a maximum flow rate deviation not exceeding 5%, with a maximum pressure drop across the valve Δ p 1 = 0.7 MPa. A stiffer spring that allows higher regulated flow rates to be obtained provides a more even flow where the maximum flow rate deviation does not exceed 3%. However, the pressure drop is significantly higher, reaching the value of about 1.9 MPa.
Laboratory tests were aimed at confirming the correctness of mathematical and simulation models and verifying the actual flow characteristics of the valve. In the first experiment, the flow rate through the A channel of the valve was measured at fixed valve settings, ensuring the nominal flow Q A = 10 dm3 min 1 and Q A = 22 dm3 min1. Fixed pump flow rate Q 0 = 30 dm3 min 1 and pressure in the load line varying in the range of p 2 = 2–30 MPa were assumed. The measurement uncertainties estimated by means of the standard deviation factor are equal to Δ Q 0 = ± 0.38 dm3 min1, Δ Q A = ± 0.60 dm3 min 1 and Δ p A = ± 0.37 MPa. The results shown in Figure 19 indicate a high level of agreement. The correlation coefficient for the low and high flow rate settings was 0.99 and 0.96 , respectively. As part of the second experiment, the value of the obtained flow rate Q A was tested at a constant load of the supply line p 2 = 10 MPa and a variable pump flow Q 0 = 3 30 dm3 min 1. As shown in Figure 21, also in this case, the results of simulations and laboratory experiments show a high degree of correlation, except for the lowest values of pump flow Q 0 < 4 dm3 min 1. The results also showed that the regulated flow rate, provided that the pump capacity is sufficiently high ( Q 0 > Q A ), is almost constant over the entire range, with a deviation not exceeding Δ Q A < 1 %.

7. Conclusions

The article deals with a proposal of a novel three-way flow control valve. Valve development requires numerous studies, including modelling, numerical simulation and laboratory experiments to determine operational range and flow characteristics. The proposed solution is particularly significant from an economic point of view because the valve has a relatively simple structure, does not require any advanced electronic control systems and can reduce power consumption compared to standard two-way flow control valves. First, CFD analyses were carried out, which made it possible to estimate the dynamic flow forces appearing in the B gap caused by a change in the direction of the working fluid stream. The results were used to build a model in the Matlab/Simulink system and conduct further simulations. Based on the simulation outcomes, the flow characteristics Q = f ( p ) and the valve’s ability to compensate for load changes were determined. The results of the simulation studies were confirmed on the test bench using the prototype of the proposed valve, achieving a high level of compliance with the correlation coefficient above 0.95 . Detailed conclusions are as follows:
  • The proposed valve can be used in practice in all power hydraulic systems where a specific fixed value of the minimum flow rate must be ensured regardless of the load.
  • There are operational limitations: under conditions of variable load, the possibility of increasing the flow by 10% compared to the required value should be taken into account, especially for low regulated flow (setting 6 dm3 min 1 results in accuracy up to 10%, while for 22 dm3 min 1 the maximum change does not exceed 4%.
  • Compared to a typical two-way flow control valve, the proposed solution is more advantageous in terms of energy demand, especially in systems of many valves connected in parallel, since the presence of a relief line prevents the need for higher pressure in the supply line.
  • The valve can be used in systems and environmental conditions that exclude direct access to the electrical power supply.
  • To obtain a wide range of adjustable flow rates, springs of different stiffness can be used, with a stiffer spring allowing for higher values. At the same time, the exact setting is achieved by manually adjusting the initial tension of the spring.

Author Contributions

Conceptualisation, E.L.; methodology, P.P.; software, E.L. and G.F.; validation, J.R.; formal analysis, E.L. and J.R.; investigation, P.P.; resources, J.R.; writing—original draft preparation, G.F.; writing—review and editing, E.L. and J.R.; visualisation, G.F.; supervision, E.L.; project administration, J.R.; funding acquisition, E.L. and G.F. All authors have read and agreed to the published version of the manuscript.

Funding

This research received no external funding.

Institutional Review Board Statement

Not applicable.

Informed Consent Statement

Not applicable.

Data Availability Statement

Not applicable.

Conflicts of Interest

The authors declare no conflict of interest.

Nomenclature

Indices
0supply line
1flow control valve
2load line
rreturn line
Parameters
A n 1 , A g A , A g B , A s flow control valve areas: n 1 nozzle, g A and g B gaps, s spool (m2)
B f fluid bulk modulus (MPa)
C 1 ε , C 2 ε , C μ turbulence model constants (-)
F h d A , F h d B hydrodynamic forces in A and B gaps acting on spool (N)
F h s , F s , F ϕ forces acting on spool: hydrostatic, spring, viscous friction (N)
I , turbulence model factors: intensity, length scale (-, m)
Q 0 , Q 2 , Q r flow rate: pump, load line, return line (dm3 min1)
Q 1 , Q A , Q B flow control valve flow rate: inlet, A port, B port (dm3 min1)
Q v 2 , n o m , Q v 4 , n o m nominal flow rate through v 2 , v 4 relief valve (dm3 min1)
V 0 , V 2 volume: supply line, load line (m3)
b , r pump design geometrical parameters (mm)
d 1 , d s flow diameter of n 1 nozzle, spool diameter (m2)
e p pump eccentricity (mm)
k s p r valve spring stiffness (N m1)
m s valve spool mass (kg)
p 0 , p 2 , p r pressure: supply line, load line, return line (MPa)
p 1 , p A , p B pressure: inside valve, at the A port, at the B port (MPa)
s k , s ε turbulence model constants (-)
t , t s t a r t time, start-up time (s)
v P , a v g , v A , a v g , v B , a v g average fluid velocity in the P, A, B port (m s1)
x 1 valve spool position (m)
x s p r , 0 initial tension of valve spring (m)
α pump rotational angle (rad)
Δ p v 2 , Δ p v 4 readjustment of v 2 , v 4 relief valve at nominal flow (MPa)
η fluid dynamic viscosity (Pa s)
θ fluid jet angle (rad)
ν fluid kinematic viscosity (m2 s1)
μ n 1 , μ g A , μ g B discharge coefficient of flow control valve nozzle and gaps (-)
μ t turbulent viscosity (m2 s1)
ρ fluid density (kg m3)
ϕ s valve spool damping coefficient (N s m1)
ω 0 , ω n o m pump rotational speed, pump nominal speed (rev s1)

References

  1. Huang, J.; Wang, X.; Wang, H.; Hao, H. Development of a flow control valve with digital flow compensator. Flow Meas. Instrum. 2019, 66, 157–169. [Google Scholar] [CrossRef]
  2. Okhotnikov, I.; Noroozi, S.; Sewell, P.; Godfrey, P. Evaluation of steady flow torques and pressure losses in a rotary flow control valve by means of computational fluid dynamics. Int. J. Heat Fluid Flow 2017, 64, 89–102. [Google Scholar] [CrossRef]
  3. Lisowski, E.; Filo, G. CFD analysis of the characteristics of a proportional flow control valve with an innovative opening shape. Energy Convers. Manag. 2016, 123, 15–28. [Google Scholar] [CrossRef]
  4. Filo, G.; Lisowski, E. Numerical Analysis of Fluid Stream Division to Supply Multiple Hydraulic Receivers. Appl. Sci. 2022, 12, 10327. [Google Scholar] [CrossRef]
  5. Liu, J.; Li, R.; Ding, X.; Liu, Q. Flow force research and structure improvement of cartridge valve core based on CFD method. Heliyon 2022, 8, e11700. [Google Scholar] [CrossRef]
  6. Jiang, Y.; Xu, J. Simulation research on dynamic performance of cartridge two position four way directional valve. Mach. Tool Hydraul. 2021, 49, 135–190. [Google Scholar]
  7. Kumar, S.; Tewari, V.K.; Bharti, C.K.; Ranjan, A. Modeling, simulation and experimental validation of flow rate of electro-hydraulic hitch control valve of agricultural tractor. Flow Meas. Instrum. 2021, 82, 102070. [Google Scholar] [CrossRef]
  8. Nguyen, T.H.; Do, T.C.; Ahn, K.K. A Study on a New Independent Metering Valve for Hydraulic Boom Excavator. Appl. Sci. 2022, 12, 605. [Google Scholar] [CrossRef]
  9. Li, D.; Hang, J.; Li, Y.; Dong, S. Fuel Flowrate Control for Aeroengine and Fuel Thermal Management for Airborne System of Aircraft; An Overview. Appl. Sci. 2022, 12, 279. [Google Scholar] [CrossRef]
  10. Adeoye, A.; Aderoba, A.; Oladapo, B. Simulated Design of a Flow Control Valve for Stroke Speed Adjustment of Hydraulic Power of Robotic Lifting Device. Procedia Eng. 2017, 173, 1499–1506. [Google Scholar] [CrossRef]
  11. Han, J.; Wang, F.; Wang, Y. A Control Method for the Differential Steering of Tracked Vehicles Driven Independently by a Dual Hydraulic Motor. Appl. Sci. 2022, 12, 6355. [Google Scholar] [CrossRef]
  12. Lei, T.; Wang, J.; Yao, Z. Modelling and Stability Analysis of Articulated Vehicles. Appl. Sci. 2021, 11, 3663. [Google Scholar] [CrossRef]
  13. Leephakpreeda, T. Flow-sensorless control valve: Neural computing approach. Flow Meas. Instrum. 2003, 14, 261–266. [Google Scholar] [CrossRef]
  14. Zhang, J.; Wang, D.; Xu, B.; Su, Q.; Lu, Z.; Wang, W. Flow control of a proportional directional valve without the flow meter. Flow Meas. Instrum. 2019, 67, 131–141. [Google Scholar] [CrossRef]
  15. Feng, H.; Song, Q.; Ma, S.; Ma, W.; Yin, C.; Cao, D.; Yu, H. A new adaptive sliding mode controller based on the RBF neural network for an electro-hydraulic servo system. ISA Trans. 2022, 129, 472–484. [Google Scholar] [CrossRef]
  16. Sun, X.; Wang, Y.; Zhang, J.; Lei, F.; Zhao, D.; Hong, H. Multi-Objective Optimization Design of Key Parameters of a Stepless Flow Control System with Multi-System Coupling Characteristics. Appl. Sci. 2022, 12, 1301. [Google Scholar] [CrossRef]
  17. Wang, Y.; Liu, X.; Chen, J.; Chen, W.; Li, C.; Huo, D. Design and control performance optimization of dual-mode hydraulic steering system for wheel loader. Autom. Constr. 2022, 143, 104539. [Google Scholar] [CrossRef]
  18. Zhang, H.; Zhou, L.; Liu, T.; Guo, Z.; Golnary, F. Dynamic mode decomposition analysis of the two-dimensional flow past two transversely in-phase oscillating cylinders in a tandem arrangement. Phys. Fluids 2022, 34, 033602. [Google Scholar] [CrossRef]
  19. Bao, M.; Xie, Y.; Zhang, X.; Ju, J.; Wang, Y. Performance improvement of a control valve with energy harvesting. Energy 2023, 263, 125862. [Google Scholar] [CrossRef]
  20. Ding, X.; Li, R.; Xu, J.; Liu, Q.; Cheng, Y.; Liu, J. Study on flow force compensation characteristics and optimization design of jet guiding groove. Flow Meas. Instrum. 2022, 86, 102194. [Google Scholar] [CrossRef]
  21. Liu, F.; Cao, S.; Zhou, W.; Zhao, D.; Zheng, L.; Shao, M. Transient flow analysis on opening process of pneumatic gas proportional valve with two-solenoid valve. Flow Meas. Instrum. 2023, 89, 102291. [Google Scholar] [CrossRef]
  22. Ye, J.; Zhao, Z.; Cui, J.; Hua, Z.; Peng, W.; Jiang, P. Transient flow behaviors of the check valve with different spool-head angle in high-pressure hydrogen storage systems. J. Energy Storage 2022, 46, 103761. [Google Scholar] [CrossRef]
  23. Filo, G.; Lisowski, E.; Kwiatkowski, D.; Rajda, J. Numerical and Experimental Study of a Novel Valve Using the Return Stream Energy to Adjust the Speed of a Hydraulic Actuator. Stroj. Vestn.-J. Mech. Eng. 2019, 65, 103–112. [Google Scholar] [CrossRef]
  24. Valdés, J.R.; Miana, M.J.; Núñez, J.L.; Pütz, T. Reduced order model for estimation of fluid flow and flow forces in hydraulic proportional valves. Energy Convers. Manag. 2008, 49, 1517–1529. [Google Scholar] [CrossRef]
  25. Anh, P.N.; Bae, J.S.; Hwang, J.H. Computational Fluid Dynamic Analysis of Flow Rate Performance of a Small Piezoelectric-Hydraulic Pump. Appl. Sci. 2021, 11, 4888. [Google Scholar] [CrossRef]
  26. Yang, L.J.; Waikhom, R.; Wang, W.C.; Jabaraj Joseph, V.; Esakki, B.; Kumar Unnam, N.; Li, X.H.; Lee, C.Y. Check-Valve Design in Enhancing Aerodynamic Performance of Flapping Wings. Appl. Sci. 2021, 11, 3416. [Google Scholar] [CrossRef]
  27. Jin-yuan, Q.; Lin, W.; Zhi-jiang, J.; Jian-kai, W.; Han, Z.; An-le, L. CFD analysis on the dynamic flow characteristics of the pilot-control globe valve. Energy Convers. Manag. 2014, 87, 220–226. [Google Scholar] [CrossRef]
  28. Nishad, K.; Ries, F.; Li, Y.; Sadiki, A. Numerical Investigation of Flow through a Valve during Charge Intake in a DISI -Engine Using Large Eddy Simulation. Energies 2019, 12, 2620. [Google Scholar] [CrossRef]
  29. Wen, Q.; Liu, Y.; Chen, Z.; Wang, W. Numerical simulation and experimental validation of flow characteristics for a butterfly check valve in small modular reactor. Nucl. Eng. Des. 2022, 391, 111732. [Google Scholar] [CrossRef]
  30. Domagała, M.; Momeni, H.; Fabiś-Domagała, J. The Influence of Oil Contamination on Flow Control Valve Operation. Mater. Res. Proc. 2022, 24, 001008. [Google Scholar] [CrossRef]
  31. Chen, F.; Qian, J.; Chen, M.; Zhang, M.; Chen, L.; Jin, Z. Turbulent compressible flow analysis on multi-stage high pressure reducing valve. Flow Meas. Instrum. 2018, 61, 26–37. [Google Scholar] [CrossRef]
  32. Scuro, N.; Angelo, E.; Angelo, G.; Andrade, D. A CFD analysis of the flow dynamics of a directly-operated safety relief valve. Nucl. Eng. Des. 2018, 328, 321–332. [Google Scholar] [CrossRef]
  33. Filo, G.; Lisowski, E.; Rajda, J. Design and Flow Analysis of an Adjustable Check Valve by Means of CFD Method. Energies 2021, 14, 2237. [Google Scholar] [CrossRef]
  34. ANSYS Fluent in ANSYS Workbench User’s Guide, 2020th ed.; ANSYS Inc.: Canonsburg, PA, USA. 2020. Available online: http://www.ansys.com (accessed on 4 February 2023).
  35. Lisowski, E.; Filo, G.; Rajda, J. Pressure compensation using flow forces in a multi-section proportional directional control valve. Energy Convers. Manag. 2015, 103, 1052–1064. [Google Scholar] [CrossRef]
Figure 1. Drawing symbol of a flow regulator; (a) valves connected in series, (b) valves parallel connected, (c) simplified; P, A, B—connection ports.
Applsci 13 03719 g001
Figure 2. Cartridge flow regulator: (a) view, (b) section; 1—body, 2—adjuster, 3—sleeve, 4—spool, 5—nozzle, 6—spring, 7—sealing; P—supply port, A—output port, B—relief port.
Applsci 13 03719 g002
Figure 3. Model of the working fluid; P, A, B—connection ports.
Applsci 13 03719 g003
Figure 4. Hydraulic system diagram with denotations for mathematical model formulation: 1—pump, 2—safety relief valve, 3—flow control valve, 4—load line relief valve; P, A, B—connection ports.
Applsci 13 03719 g004
Figure 5. Flow control valve g A and g B gap areas against spool position x 1 .
Applsci 13 03719 g005
Figure 6. Meshed model of the fluid; P, A, B—connection ports.
Applsci 13 03719 g006
Figure 7. CFD results for equal loads on both outputs in the isometric view: (a) pressure distribution, (b) velocity distribution; P, A, B—connection ports.
Applsci 13 03719 g007
Figure 8. CFD results for equal loads on both outputs in the longitudinal cross-section: (a) pressure distribution, (b) velocity distribution; P, A, B—connection ports.
Applsci 13 03719 g008
Figure 9. CFD results for equal loads on both outputs: jet angle in the B gap; θ B , i n , θ B , o u t —jet angle at inlet and outlet; P, A, B—connection ports.
Applsci 13 03719 g009
Figure 10. CFD results for different loads on both outputs in longitudinal cross-section: (a) pressure distribution, (b) velocity distribution; P, A, B—connection ports.
Applsci 13 03719 g010
Figure 11. CFD results for different loads on both outputs: jet angle in the B gap; θ B , i n , θ B , o u t —jet angle at inlet and outlet; P, A, B—connection ports.
Applsci 13 03719 g011
Figure 12. Model of hydraulic system in Simulink.
Applsci 13 03719 g012
Figure 13. Valve flow rate obtained with fixed load line pressure: (a) soft spring ( k s p r = 10 N mm1), (b) rigid spring ( k s p r = 40 N mm1).
Applsci 13 03719 g013
Figure 14. Valve flow rate obtained with stepwise changes in load line pressure: (a) soft spring ( k s p r = 10 N mm1), (b) rigid spring ( k s p r = 40 N mm1).
Applsci 13 03719 g014
Figure 15. Flow control valve p-Q characteristic: (a) soft spring ( k s p r = 10 N mm1), (b) rigid spring ( k s p r = 40 N mm1).
Applsci 13 03719 g015
Figure 16. Valve flow rate obtained with sinusoidally varying load line pressure: (a) soft spring ( k s p r = 10 N mm1), (b) rigid spring ( k s p r = 40 N mm1).
Applsci 13 03719 g016
Figure 17. Test bench: (a) scheme, (b) view; 1—pump; 2—safety relief valve; 3—filter; 4—flow control valve; 5—flow meter; 6—pressure transducer; 7—thermometer; 8—relief valve; 9—Data acquisition unit.
Applsci 13 03719 g017
Figure 18. The obtained graphs; (a) flow rates and load pressure against time, (b) flow characteristics: 1—measured, 2—approximated.
Applsci 13 03719 g018
Figure 19. Comparison of the p-Q characteristic: solid—experimental curves, dashed—simulation results.
Applsci 13 03719 g019
Figure 20. Experimental results of a variable flow rate test: Q 0 , Q A —flow rates, p A —supply line pressure.
Applsci 13 03719 g020
Figure 21. Controlled flow rate Q A against supply flow rate Q 0 : 1—approximated experimental curve, 2—simulation result.
Applsci 13 03719 g021
Table 1. Mesh quality assessment.
Case
(-)
Nodes
(-)
Elements
(-)
Time
(min)
Calculated Flow
(dm 3 min 1 )
Experimental Flow
(dm 3 min 1 )
m 1 131124681846111 9.37 9.94
m 2 165697881507160 9.49 9.94
m 3 2151241196093210 9.55 9.94
m 4 2358481311315240 9.55 9.94
Table 2. Physical parameters.
Oil Kinematic
Viscosity
Oil
Density
Oil
Temperature
Inlet
Flow Rate
Load Line
Pressure
Reynolds
Number
ν ρ T Q 1 p l o a d R e
m2 s1kg m3°Cdm3 min1MPa-
41 · 10 6 85050301–302000–28,000
Table 3. Parameters of the k- ε model.
Turbulence
Intensity
Turbulence
Length Scale
Turb. Viscosity
Constant
Kinetic Energy
Constant
Kinetic Energy
Dissipation Constants
I (%) (mm) C μ (-) s k (-) s ε (-) C 1 ε (-) C 2 ε (-)
4.3–6.30.12–0.510.091.01.31.441.92
Table 4. Crucial valve parameters.
Spool and Nozzle
Mass
Spool
Diameter
Spool Damping
Coefficient
Nozzle
Diameter
Spring
Rate
Spring Init.
Tension
m s d s ϕ s d n 1 k s p r x s p r , 0
kgmmNs mm1mmN mmmm
0.0176 12 9.5 3.5 10 , 20 , 30 1 , 2 , , 5
Table 5. Measuring and data acquisition equipment parameters.
PressureFlow RateTemperatureDAQ Card
NameTrafag NATKEM HMIntrol FH0Advantech 4704
Range
Unit
0–25
MPa
0.3–33
dm3 min1
0–100
C
12 bit
8   ×   AI, 2   ×   AO
Accuracy ± 0.2 % ± 0.3 % ± 0.5 Cn.a.
Table 6. Flow rate and pressure measurement uncertainty.
Mean ErrorMean % ErrorMax. ErrorStd. DeviationStd. Error
Q 0 0.17 dm3/min 1.58 % 0.58 dm3/min 0.38 dm3/min 0.23 dm3/min
Q A 0.26 dm3/min 2.59 % 0.78 dm3/min 0.60 dm3/min 0.35 dm3/min
p A 0.24 MPa 2.15 % 0.65 MPa 0.37 MPa 0.22 MPa
Disclaimer/Publisher’s Note: The statements, opinions and data contained in all publications are solely those of the individual author(s) and contributor(s) and not of MDPI and/or the editor(s). MDPI and/or the editor(s) disclaim responsibility for any injury to people or property resulting from any ideas, methods, instructions or products referred to in the content.