Article

Fiber Orientation Reconstruction from SEM Images of Fiber-Reinforced Composites

1
Guangdong Provincial Key Laboratory of Technique and Equipment for Macromolecular Advanced Manufacturing, South China University of Technology, Guangzhou 510640, China
2
National Engineering Research Center of Novel Equipment for Polymer Processing, South China University of Technology, Guangzhou 510640, China
3
Key Laboratory of Polymer Processing Engineering, South China University of Technology, Ministry of Education, Guangzhou 510640, China
*
Author to whom correspondence should be addressed.
Appl. Sci. 2023, 13(6), 3700; https://doi.org/10.3390/app13063700
Submission received: 14 February 2023 / Revised: 7 March 2023 / Accepted: 12 March 2023 / Published: 14 March 2023

Abstract

:
The orientation of fibers in composites reinforced with short fibers can provide insight into the microstructure of the material and considerably affect its macroscopic characteristics. However, the present standard techniques for detecting fiber orientation and length based on microscopic image processing have faults in practical applications, including high effort, low efficiency, and unreliable measurement results. In this study, a method for measuring fiber orientation based on 3D reconstructions of scanning electron microscope (SEM) images is provided. The geodesic active contour (GAC) model is applied to segment the fibers in the SEM images. Matching the fiber contours with the scale-invariant feature transformation (SIFT) algorithm successfully extracts 3D orientation information from the fiber contours. The unit vector of the fiber axis is fitted from the extracted point cloud using the ordinary least squares (OLS) method. With a maximum deviation of 3.83° and an average deviation of 1.50°, the measurement findings of this method are substantially comparable to those of the image-measuring instrument. This paper offers a quantitative approach to studying the microstructure of short fiber-reinforced composites, thereby furnishing objective evidence to support the development and research of such materials.

1. Introduction

In recent decades, the rapid advancement of science and technology has made it challenging for single materials to satisfy the material performance indicators of new products. As a result, composite material technologies have been investigated. Since 1940, spearheaded by the aerospace and military industries, composite materials have been widely exploited in many facets of the national economy, bringing immense convenience to human life while supporting modern science and social economics [1]. Fiber-reinforced composites are the most popular and flexible composite materials because of their high specific strength and modulus, fatigue resistance, and versatility [2,3]. During the molding process of short fiber reinforced composites, the short fibers present different orientations under the action of external force fields [4]. When loads are applied to fiber-reinforced composites, the mechanical characteristics of the material in each direction are directly proportional to the fiber volume fraction in that direction [5].
It is vital to evaluate fiber orientation to comprehend the macroscopic mechanical properties of short-fiber-reinforced composites. Fu et al. [6] studied the tensile strength and modulus of short glass fibers (SGF)/polypropylene (PP) and short carbon fibers(SCF)/PP composites taking into account the combined effect of fiber volume fraction and mean fiber length. Yoo et al. [7] employed the Morie–Tanaka theory to relate the tensile modulus of the composites to fiber morphology determined by TEM and SEM. For visually examining the correlation between composite fiber morphology and mechanical performance, obtaining the orientation distribution of fibers in fiber-reinforced composites and products is particularly relevant. Due to its low cost, simple principle, high spatial resolution, and simple computer processing and analysis, two-dimensional cross-sectional microscopic image processing is the conventional direct fiber orientation measurement method, which relies primarily on X-ray diffraction and microscopic measurement [8].
The microscopic fiber orientation measuring technique is based on the hypothesis that the horizontal plane intercepts a cylinder in any orientation as an ellipse, and the cylinder axis may be inferred from the elliptical shape parameter of the cross-section. Typical methods involve fitting an ellipse to the fiber on a microscopic image of a smooth piece of material and deriving fiber orientation information from the fitted cylinder parameters [9,10]. Several efficient approaches exist for fitting cylindrical parameters to point clouds of cylindrical surface measurements [11,12]. Watanabe et al. [13] applied microscopic measurements to measure fiber orientation in glass fiber/polypropylene composites. Takai et al. [14] measured glass fiber orientation in glass fiber/polyamide composites based on microscopic measurements and verified the correctness of the fiber orientation results from computer simulations. Mazahir et al. [15] used the modified method of ellipses (MoE) to determine the fiber orientation in a center-gated disk mold filled with a short glass fiber suspension. With an optical microscope, researchers may obtain images of fibers’ elliptical footprints. The MoE is used to estimate the orientation angles for each individual fiber and to calculate the volumetric average of orientation represented through a second-order tensor [16]. Nevertheless, the microscope measuring technique requires preliminary preparation of a smooth specimen cross-section. The quality of the captured material cross-section pictures is readily impacted by processing markings, which reduces the fiber cross-section cylinder fitting accuracy.
To reflect the real 3D structure inside the material, 3D reconstruction techniques based on 2D image processing of the material to obtain the internal structure of the material have become a hot research topic in recent years [17]. Shen et al. [18] successfully applied a C.T. 3D reconstruction technique to determine the fiber orientation and length distribution in short glass fiber–reinforced phenolic foam composites. Thi et al. [19] applied the C.T. 3D reconstruction technique to determine the fiber orientation distribution in short glass fiber–reinforced PA6 composites. Nondestructive measurement techniques can expose three-dimensional information in a variety of materials without causing damage to the sample, but they are restricted, low-resolution, or costly. Despite their promise, their current applications are restricted [20]. Paluch et al. [21] used a continuous sectioning method to trace the fiber curvature and orientation in a single-oriented carbon-fiber-reinforced thermoplastic composite. Pinter et al. [22] compared different methods for analyzing the orientation of fibers in composite materials using computed tomography image data. They found that the structure tensor-based method is the most effective, even for low contrast images. Nonetheless, the continuous sectioning method necessitates continual removal or polishing of the specimen after grinding to obtain a sequence of continuous cross-sectional photographs of the material’s interior, making the entire procedure laborious, time-consuming, and labor-intensive.
Due to the fracture surface’s nonplanar character, numerous fields require assessing and analyzing items’ three-dimensional structures. SEM 3D reconstruction technology based on binocular stereo vision has made a 3D reconstruction of material surface microstructure possible. The key advantage of the SEM-based technique is its ability to provide high-resolution images of the microstructure of composite materials. Many researchers have recovered the 3D geometry of material fracture surfaces using this technology [23,24]. However, these research works are primarily focused on the field of metal and ceramic materials. The application of this technique to the analysis of fiber-reinforced composites has not been published. Informed by the aforementioned literature, this study aims to apply the SEM 3D reconstruction method to evaluate fiber orientation in short fiber-reinforced composites. The analysis of SEM images can benefit from the application of image processing techniques, which allows for more accurate measurement of the fiber orientation distribution in the composite. This method permits the examination of a massive number of data, resulting in a statistically significant sample size that permits more precise conclusions to be reached. As a result, the design, optimization, and performance of composite materials across a wide variety of industries can be greatly improved.

2. Materials and Methods

2.1. Experimental Material and Equipment

In this study, composites of carbon fibers and polylactic acid (PLA) were made using a Brabender 350Mixer with a 15% carbon fiber mass fraction. The compression molding process was used to manufacture a sample plate of carbon-fiber-reinforced PLA composites. Carbon fibers with a monofilament diameter of 7 μm and an average length of 2 mm from Tenax® Toho® (Tokyo, Japan), grade HTA40, were used without any further treatment before incorporation into the composite. PLA from Ingeo® Nature Works® (Plymouth, MN, USA) grade 4032D was used. The scanning electron microscope used in this study is an FEI Quanta 250 FEG. The sample stage on it is a five-axis motor-driven system that moves in the x, y, and z directions and rotates around the x and z axes, allowing for the capture of images from various tilt angles (shown in Figure 1). The image measuring instrument used in this paper is a 3DFAMILY VMC250S.

2.2. Image Processing Methods

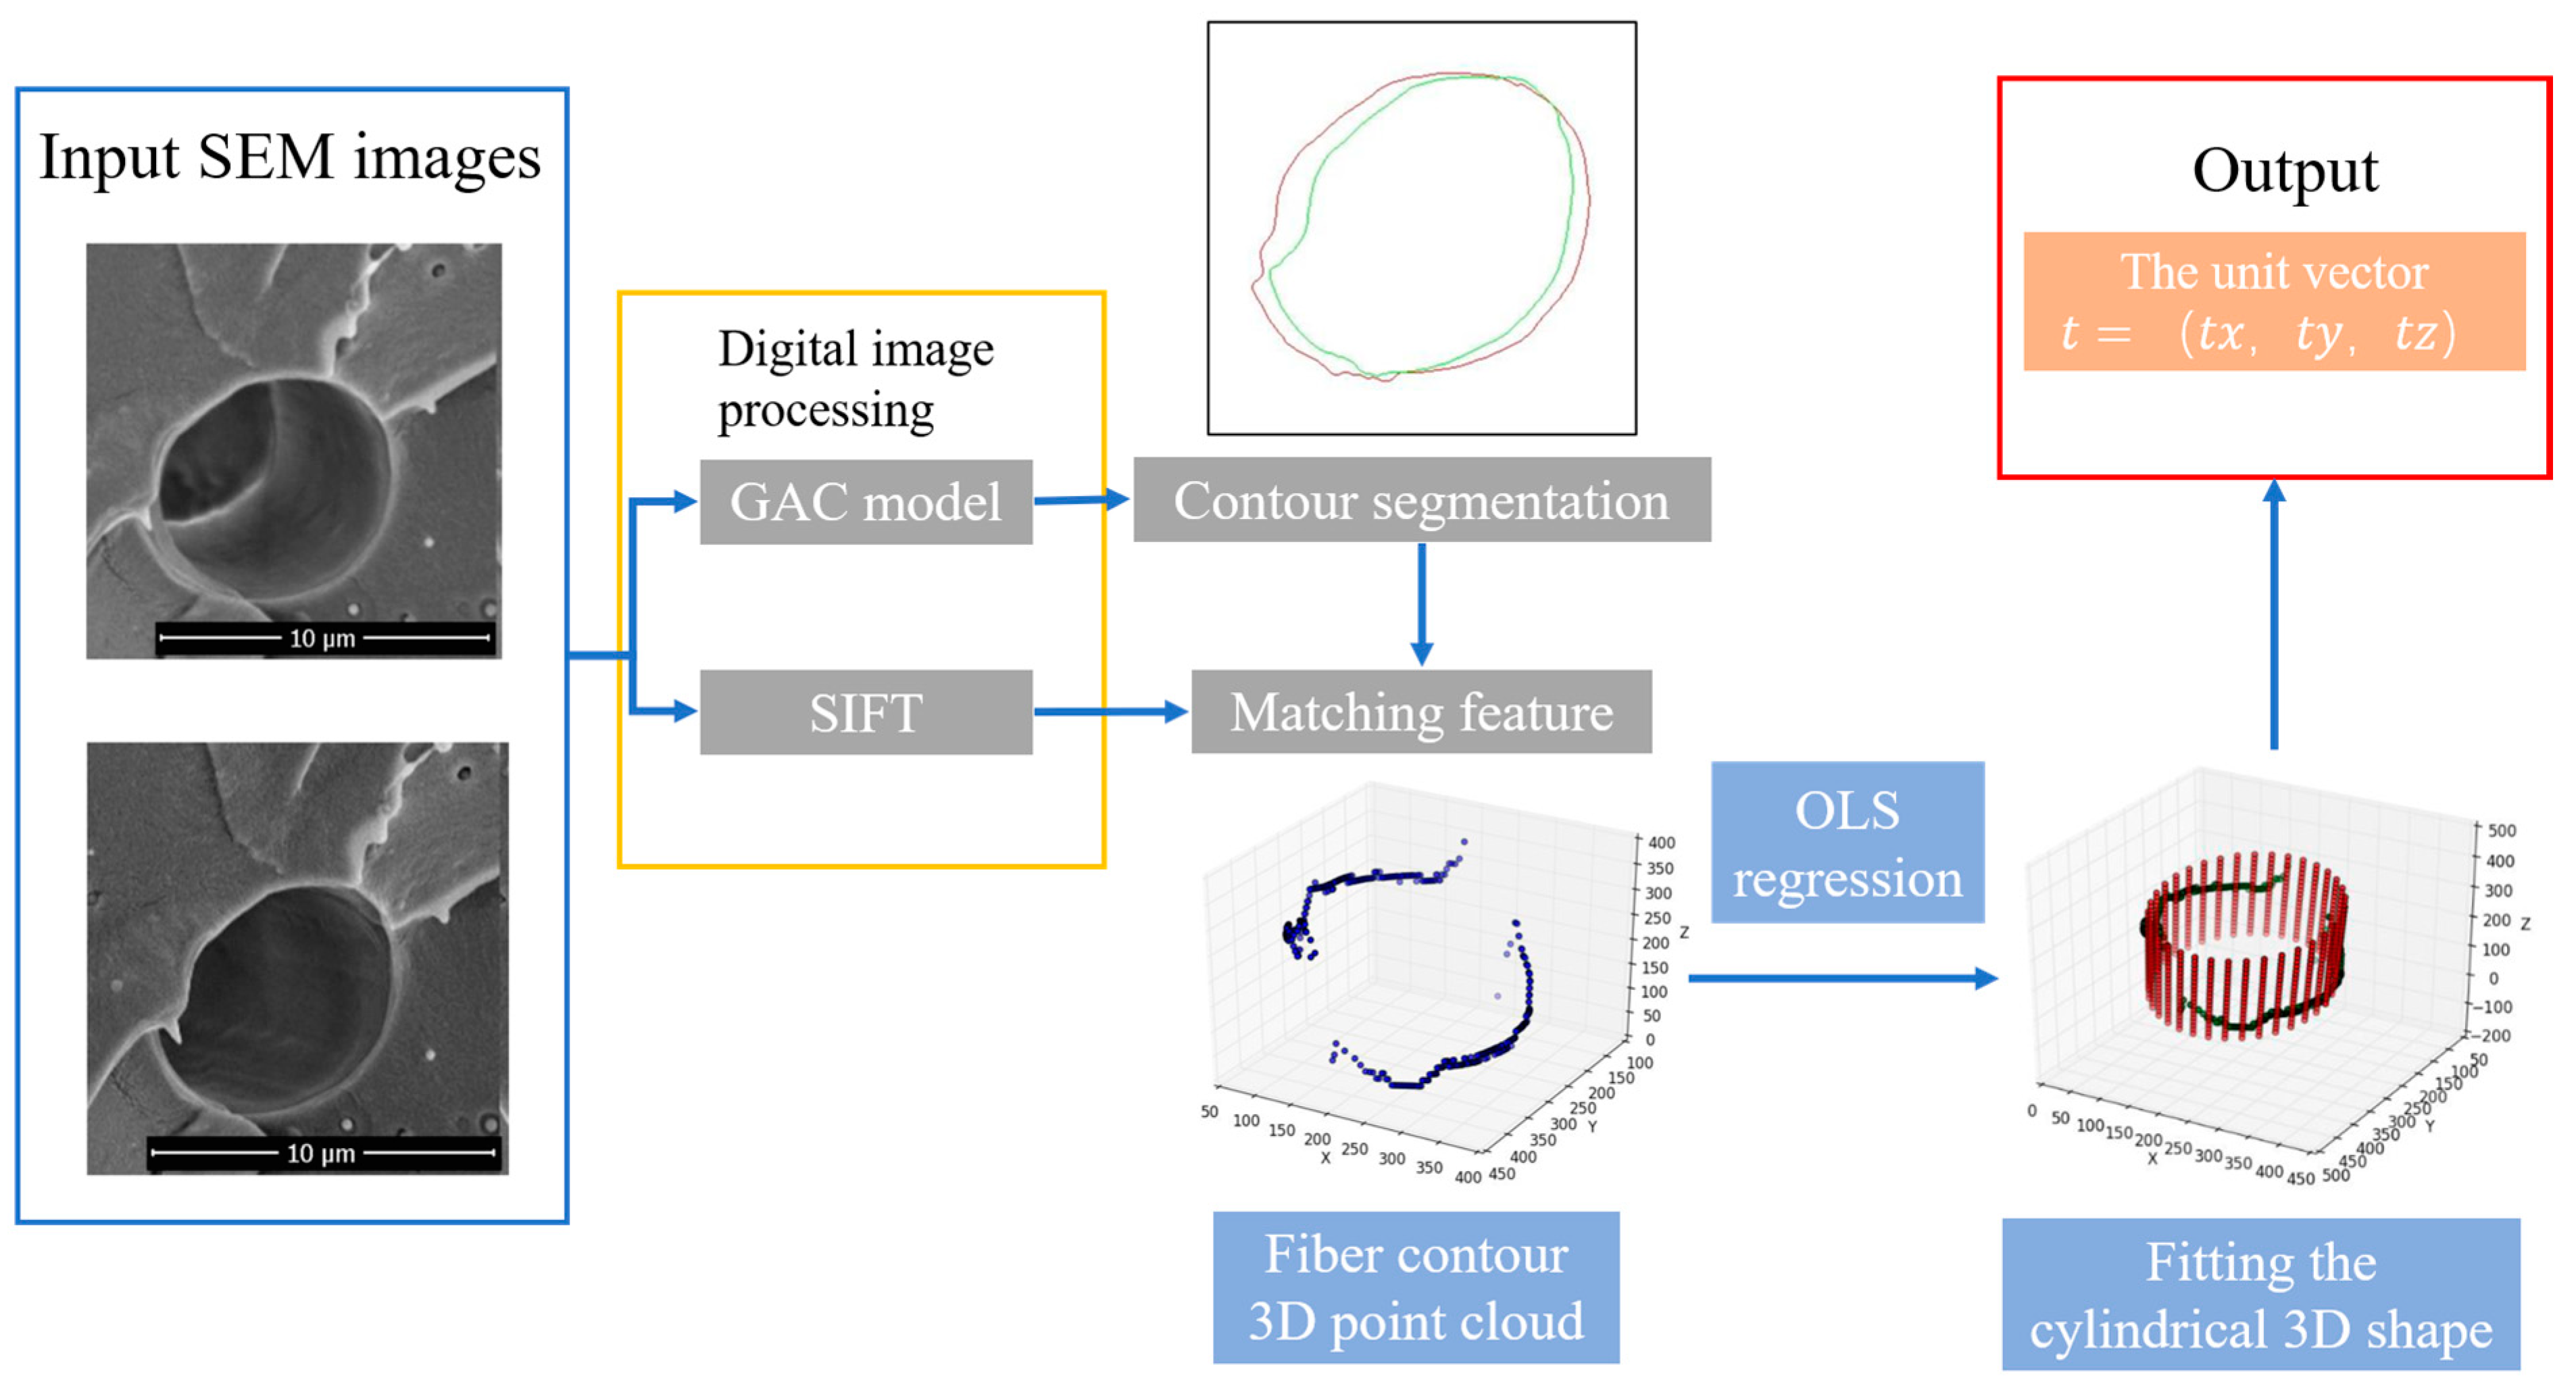
Figure 2 depicts the detailed procedure of the 3D reconstruction approach from SEM images for measuring fiber orientation. The fundamental steps of the process include segmenting the SEM images and extracting the 2D contour of the fiber. Then, the SIFT features in the input image pair are identified and matched. The difference in the polar line heights of two SEM images acquired from different observation angles in the same observation region is computed. The contour points of image pairs is matched in accordance with the identified polar lines. Next, they are utilized to calculate the 3D coordinates of the fiber contour points. When the 3D coordinates of the fiber contour point cloud are determined, they are used to reconstruct the 3D structure of the fiber column surface or axis. Finally, the unit vector of the fiber axis, or fiber orientation, is computed.

2.2.1. Image Capture

The composite sample sections were sprayed with gold after brittle fracture in liquid nitrogen, and the sample stage was tilted 5° and −5° along the x-axis to inspect the sections and take images. The orientation of single fibers on the cross-section of fiber-reinforced composites was assessed using this method and compared with the measurement results of an image-measuring instrument to further validate the effectiveness of the method described in this study.

2.2.2. Image Segmentation

The fiber and matrix surfaces are rough in the SEM images of fiber-reinforced composite cross-sections. The interior gray values are irregularly distributed. There are no distinctive texture features, making threshold-based and region-based segmentation approaches difficult to satisfy. The segmentation algorithm based on image edge information is more appropriate for segmenting fiber-reinforced composite SEM images due to the clear demarcation between the fibers and matrix and the obvious edge of the fiber pull-out cavity. The GAC model [25,26] is a level-set active contour model that transforms the challenge of image segmentation into an optimization problem of energy generalization and has the benefit of having very simple starting contour setup constraints.

2.2.3. Scale Invariant Feature Transform

In 1999, Lowe [27] presented the SIFT (scale-invariant feature transform). It is an algorithm used to detect local features in images. A local feature of the image pair has illumination invariance, scale space invariance, rotation, and even affine transformation invariance. The polar lines in the SEM stereo image pair are approximately parallel. By establishing sparse matching of SIFT feature descriptors between images, the height deviation of image points in two images may be determined.

2.3. Methods for Describing Fiber Orientation

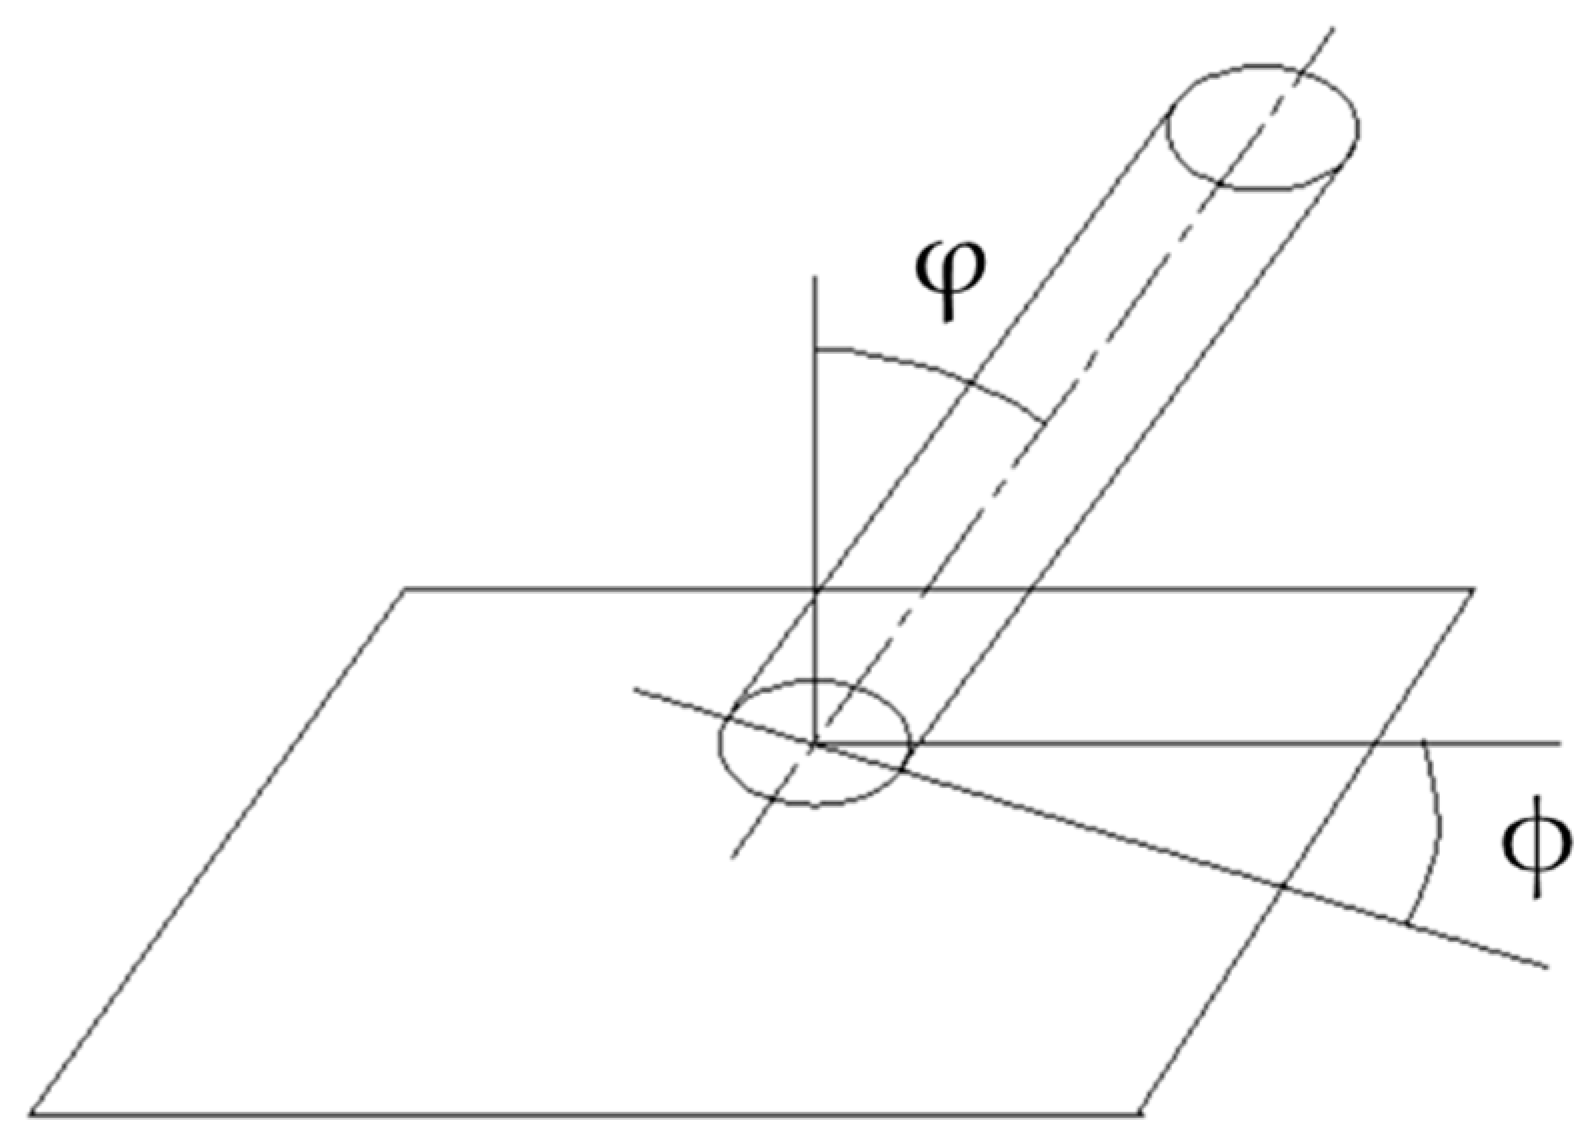
As shown in Figure 3, the fiber orientation information comprises two angles [28]: the fiber deflection angle ϕ and the azimuth angle φ, where the deflection angle is the angle between the fiber axis and the reference plane vertical line in the range of 0° ≤ ϕ ≤ 90°. The azimuth angle is the angle between the projection of the fiber axis on the reference plane and the horizontal direction in the range of −90° ≤ φ ≤ 90° (counterclockwise is positive).
As observed in Figure 3, the abovementioned fiber deflection angle ϕ and azimuth angle φ represent the fiber orientation information in general. In a Cartesian coordinate system, fiber orientation information may alternatively be given by the unit vector t = (tx, ty, tz) in the fiber’s axial direction, where
t x = sin φ cos ϕ t y = sin φ sin ϕ t z = cos φ

2.4. Cylindrical Fitting Method

The fiber column surface equations are matched to the extracted fiber contour 3D point cloud to obtain the axial information of the fiber. The equations of the fiber column surface are fitted in this article using a coordinate transformation-based cylinder fitting approach from the literature [12]. Rotating and translating a cylinder with an axis parallel to the z-axis may produce any orientation in space. The axis preceding the cylinder’s movement is set as the z-axis in the local coordinate system. The conversion from the local coordinate system to Cartesian coordinates may therefore be stated as:
X = X 0 + R Y
where X = (x, y, z)T is the coordinate of the 3D point in the local coordinate system, and Y(x′, y′, z′)T is the coordinate of the 3D point in the Cartesian coordinate system. X0 = (x0, y0, z0)T is the translation vector, and the rotation matrix is R = R1(α)R2(β)R3(γ), where R1(α), R2(β), and R3(γ) denote the rotation matrices with α, β, and γ angles of rotation about the x, y, and z axes, respectively, as:
R 1 ( α ) = 1 0 0 0 cos α sin α 0 sin α cos α R 2 ( β ) = cos β 0 sin β 0 1 0 0 sin β cos β R 3 ( γ ) = cos γ sin γ 0 sin γ cos γ 0 0 0 1
For a cylinder in the Cartesian coordinate system, Y can be defined as a graph whose distance to the z′ axis is equal to the radius r and whose equation is:
x 2 + y 2 = r 2
The basic cylindrical equation is independent of the vertical coordinate. Hence z0 can be freely selected throughout the translation. Moreover, the angles α, β, and γ are related. Assuming γ = 0°, the cylinder in the Cartesian coordinate system may be turned into a cylinder of any orientation by simply rotating around the x and y axes. In this method, the five parameters x0, y0, α, β, and r may uniquely define a cylinder of any orientation in space.
Using the distance between the measurement point and the surface of the column in the Cartesian coordinate system as the residual, the error equation may be described as follows:
v i = x i 2 + y i 2 r
The above equation is expressed in matrix form:
v i = Y i T 1 0 0 0 1 0 0 0 1 Y i r
R is an orthogonal matrix, which is known from Equation (2):
Y i = R 1 X i X 0 = R T X i X 0
Substituting Equation (7) into Equation (6) yields:
v i = X i X 0 T R 1 0 0 0 1 0 0 0 1 R T X i X 0 r
The final problem of fitting to the cylindrical surface is then converted into an optimization problem of determining the sum of squares of the errors of the k measurement sites in the column:
m i n i = 1 k v i 2 x 0 , y 0 , α , β , r
Given the 3D coordinates of at least 5 points on the surface of the cylinder, the 5 parameters x0, y0, α, β, and r of the cylinder can be solved using the ordinary least squares (OLS) method.

2.5. Sample Preparation

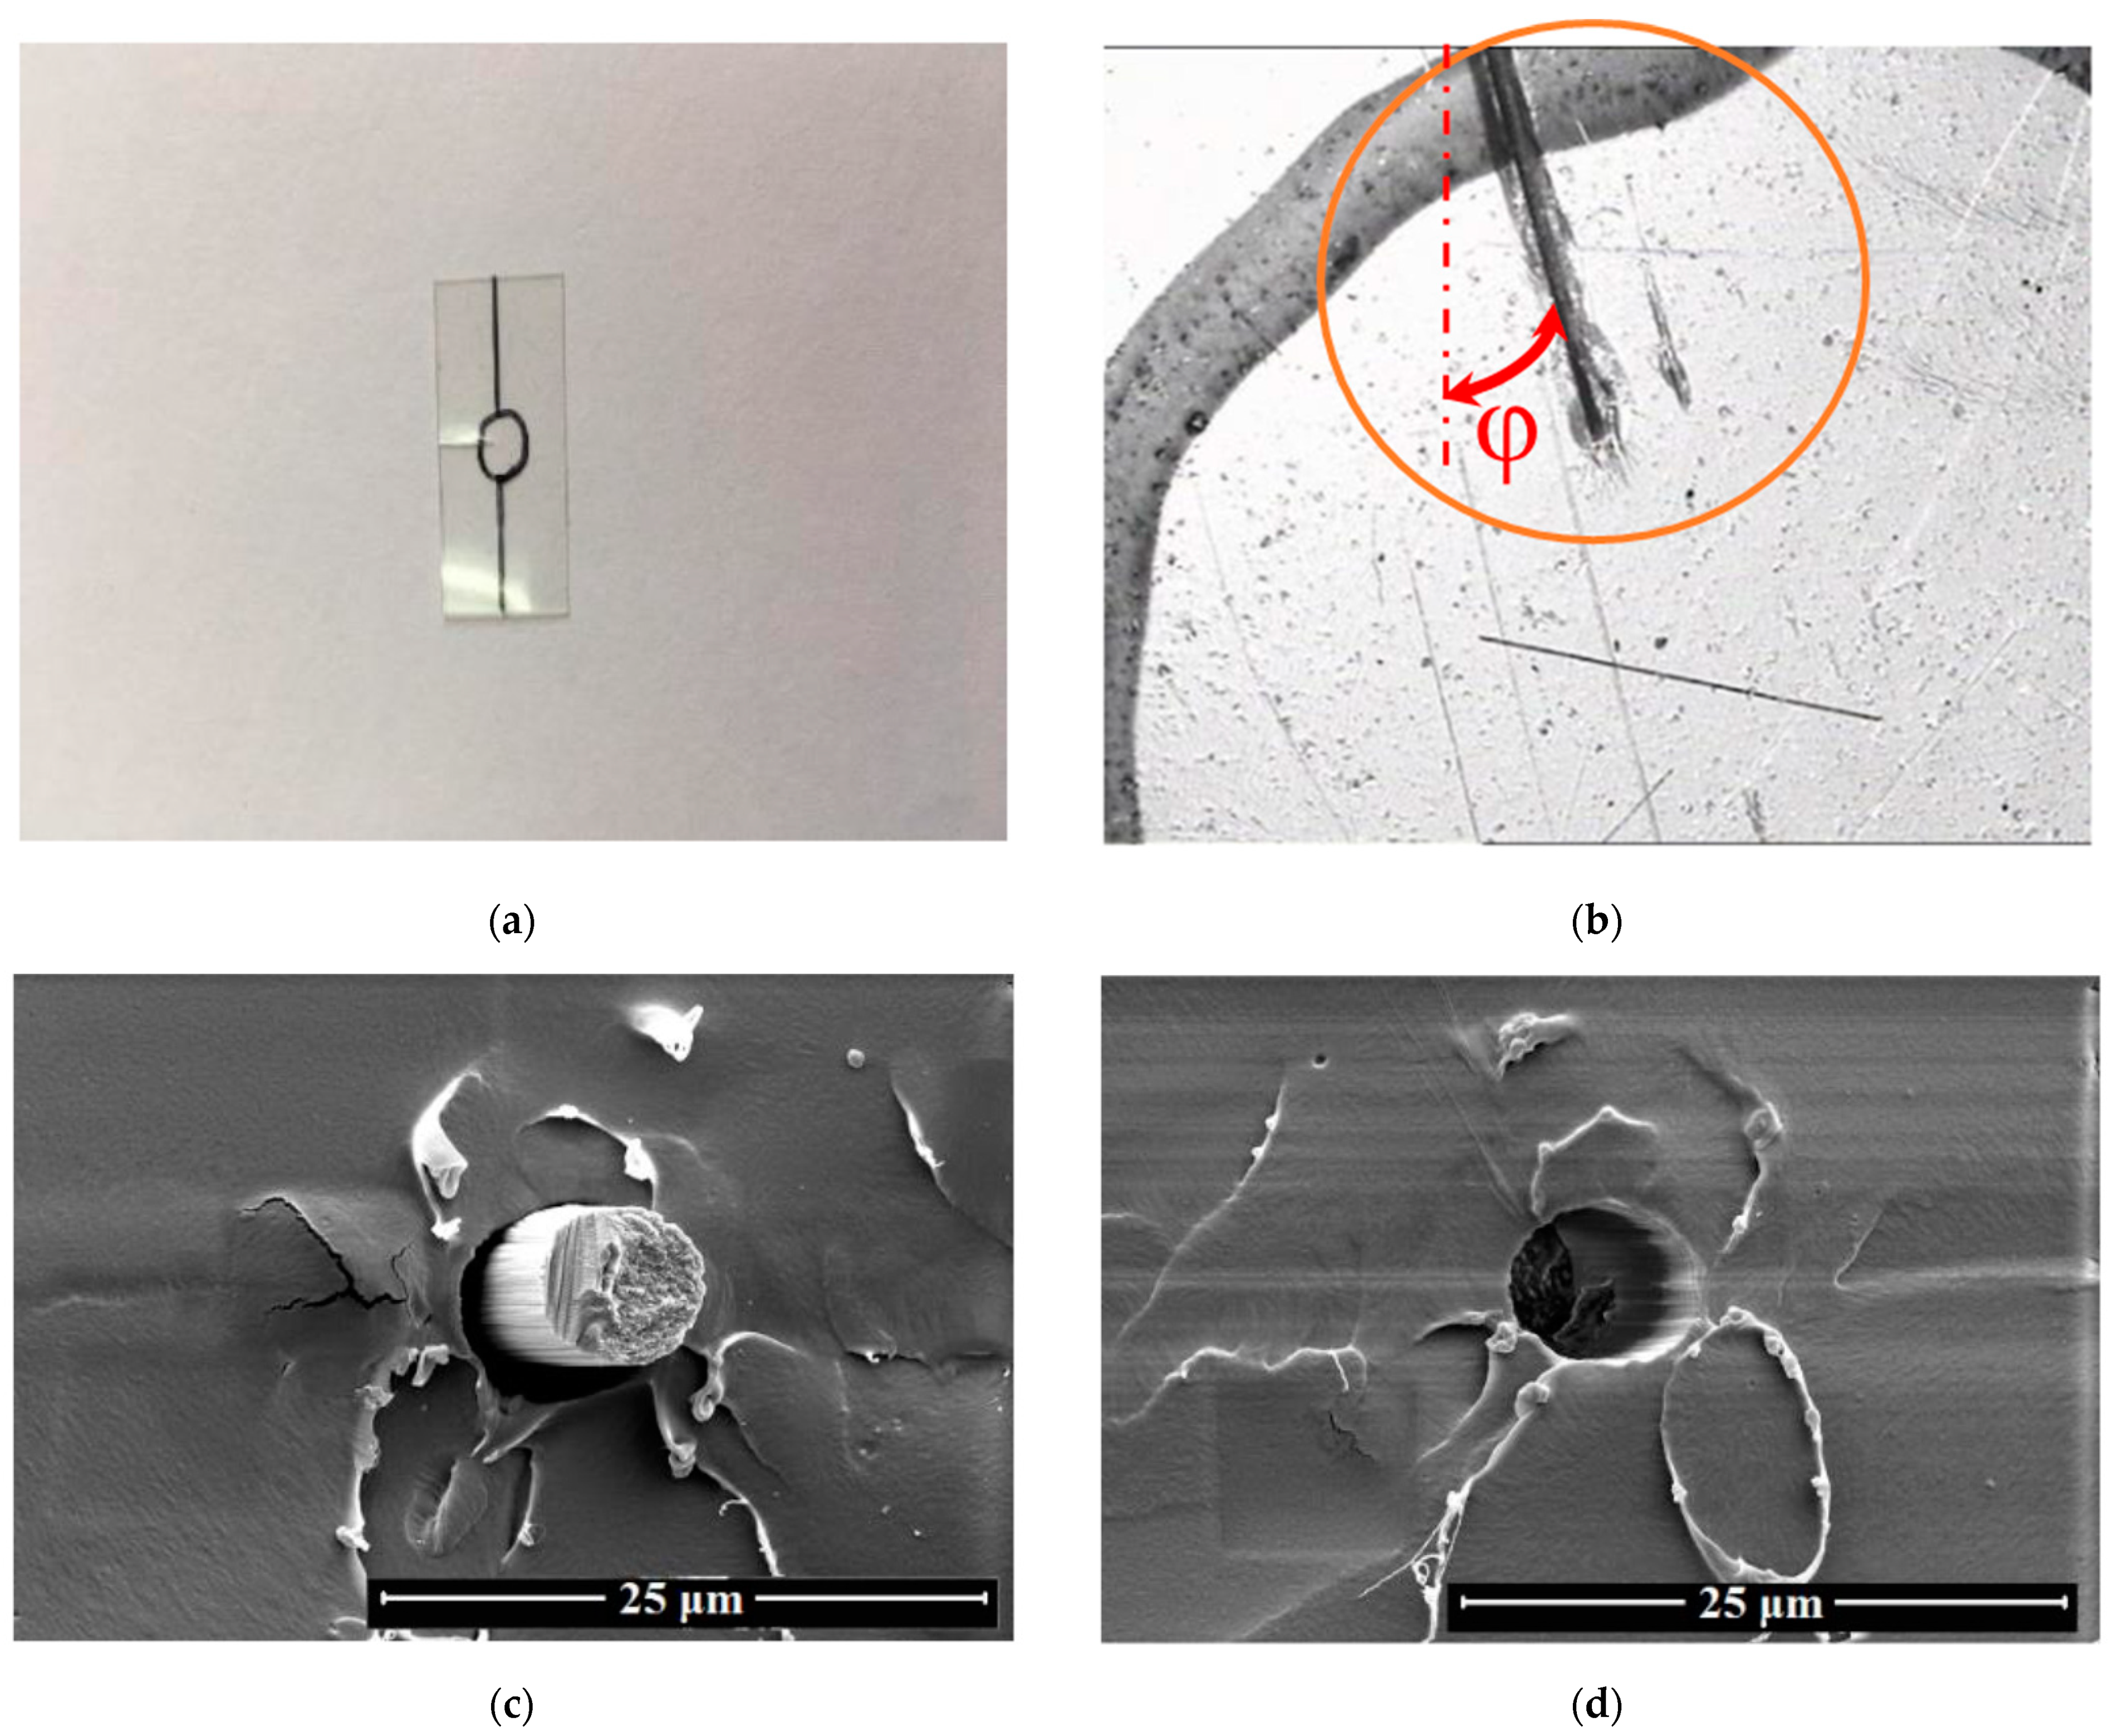
The carbon-fiber-reinforced composite plates were prepared by compression molding and then cut to a thickness of about 0.2 mm. The carbon fibers in the plates were approximately oriented in two dimensions. Consequently, the azimuth angle of the fibers may be determined with an image-measuring instrument. Figure 4a depicts a square-shaped plate with a single-fiber ring on it. The plate was flattened by inserting it between the upper and lower slides. The angle φ between the fiber and the opening was measured using an image-measuring instrument (shown in Figure 4b). SEM images of the fibers and fiber pull-out cavities were acquired in Figure 4c,d.

3. Results and Discussion

3.1. Single-Fiber Deflection Angle Measurement Results

The SEM images (Figure 4) of the specimen fracture reveal two forms of fiber orientation information: pull-out cavity and protruding fiber. During the destruction of the composite material, these fibers are extracted from the matrix, leaving only the pull-out cavity on the matrix. The orientation direction of the cavity is identical to the orientation direction of the fiber. The protruding fibers are exposed in whole or partly outside the matrix, and the ends and sides of the fibers have varying degrees of brightness due to the sensitivity of secondary electrons to the tilt angle of the sample surface.

3.1.1. Prominent Fiber Orientation

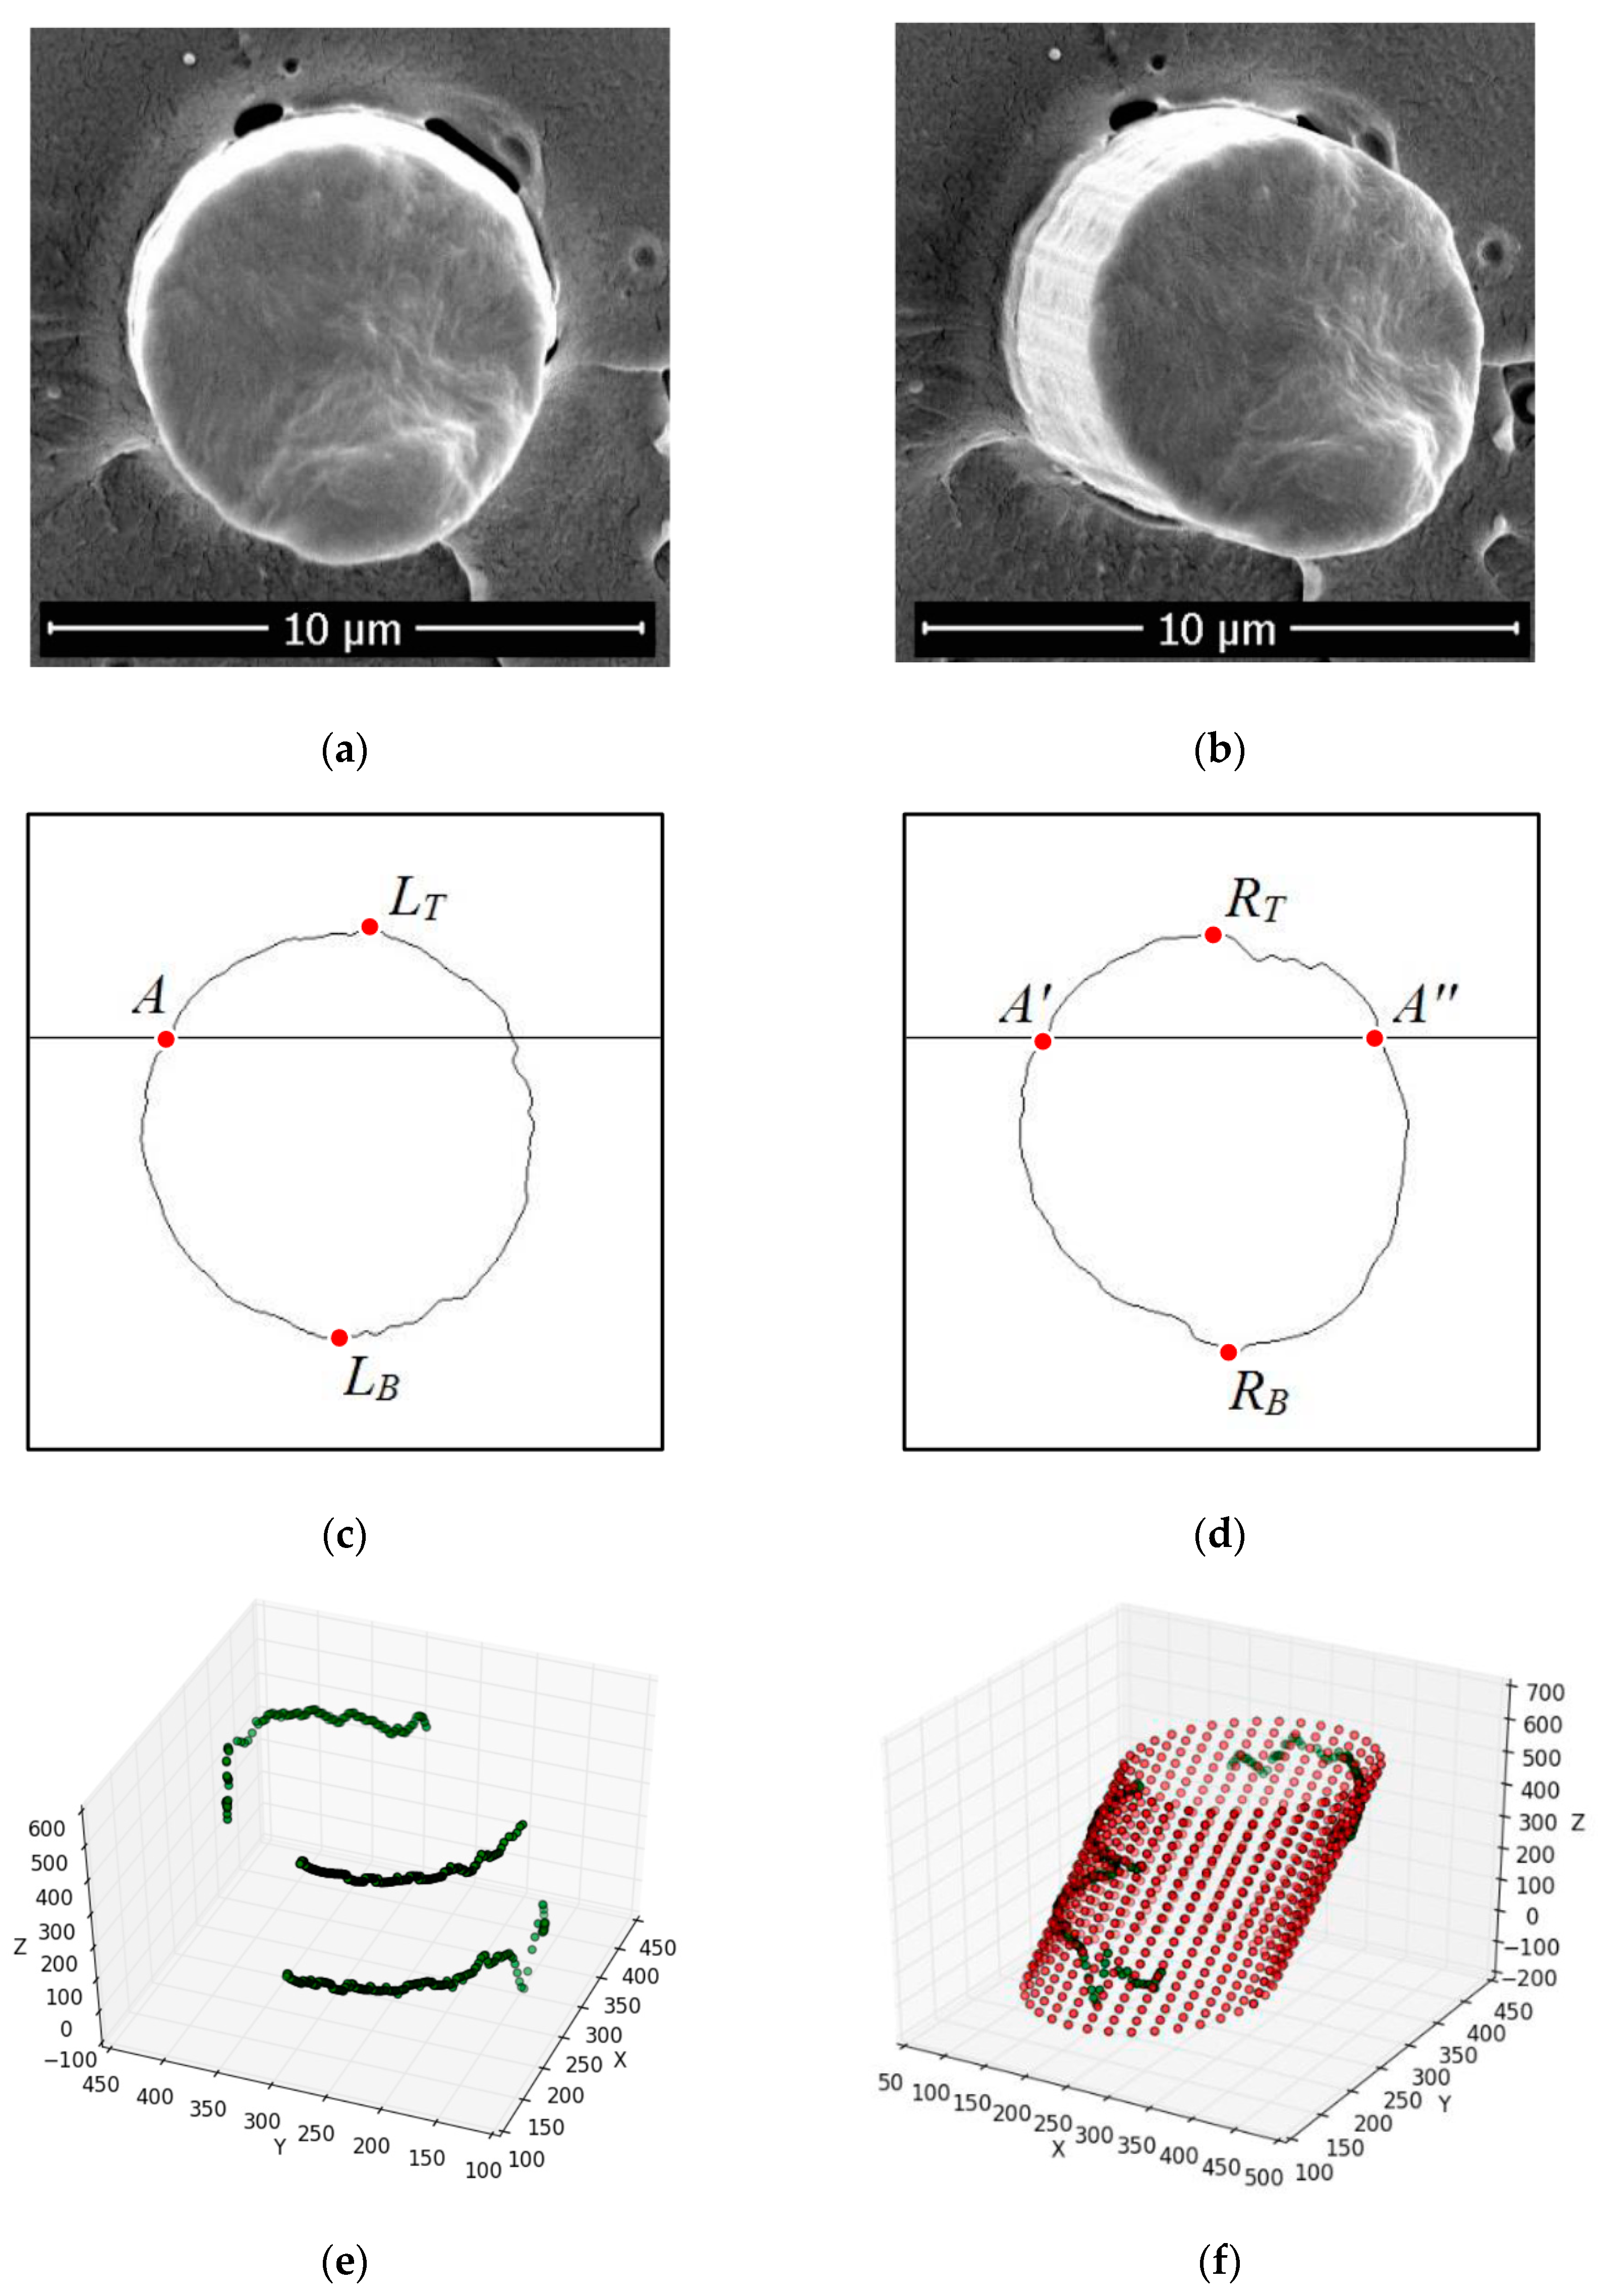
Figure 5 presents the prominent fiber orientation measurement process. Figure 5a,b illustrate the prominent fiber images captured from different tilt angles. Figure 5c,d show the GAC model results of Figure 5a,b. The highest and lowest contour points (LT-RT, LB-RB) divide the boundary to be matched into two sections. The contour points (A-A′) in the boundary to be matched were searched only on the same side of the search boundary. The fiber contour point cloud shown in Figure 5e was fitted using the coordinate transformation-based cylindrical fitting method described in Section 2.4. The original points, shown in green, are the contour points that were collected to create the shape. The fitting surface was represented by a scatter of red points. The results of this fitting produced (x0, y0) = (295.257, 278.773), α = 4.740°, β = 7.188°, and r = 125.387. This demonstrate that the fiber contour reconstruction results were relatively satisfactory and that the 3D point cloud of the reconstructed contours accurately reflected the height difference between the fiber end boundary and the fiber-matrix bond line. Figure 5f depicts the column surface drawn according to the calculation results.
The unit vector of the fiber axial direction was determined from the unit vector t′ = (0, 0, 1)T in the Cartesian coordinate system with R, i.e., t = Rt′ = (−0.125, −0.082,0.989)T. According to Equation (1), the deflection angle and azimuth angle of the fiber were 8.605° and −56.774°, respectively.

3.1.2. Fiber Pull-Out Cavity Orientation

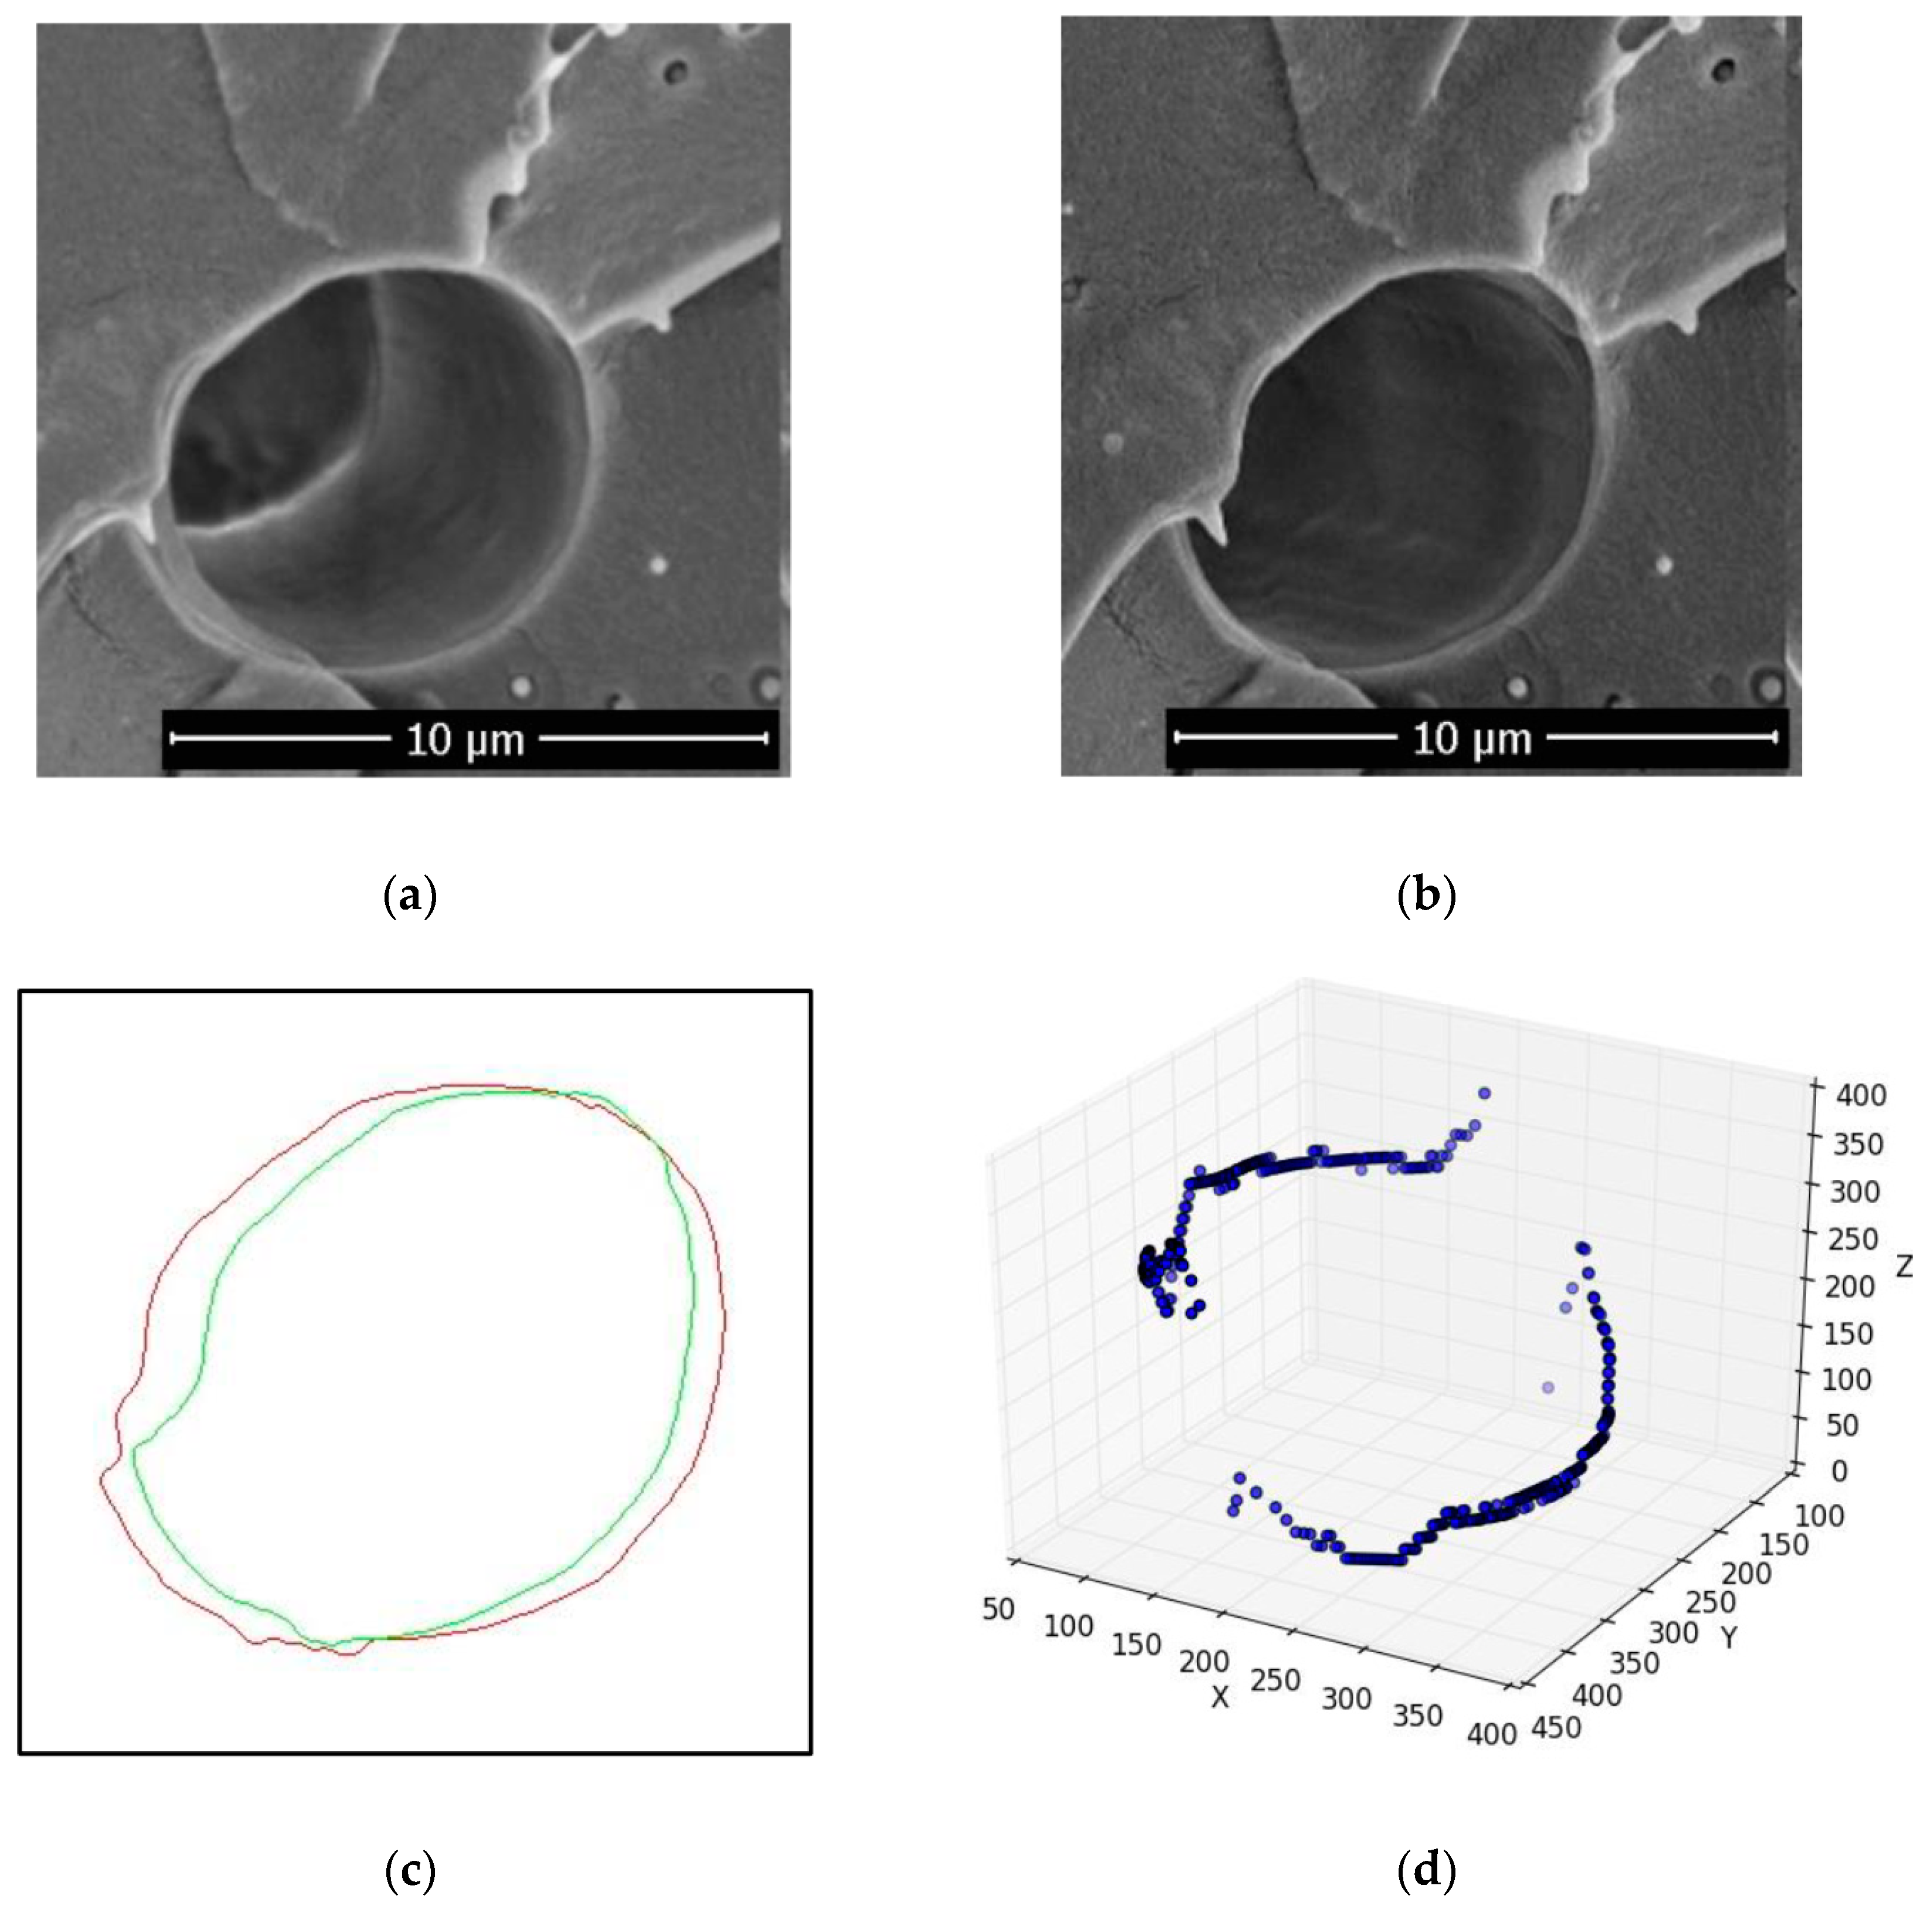
Figure 6 presents the fiber pull-out cavity orientation measurement process. Figure 6a,b illustrate the fiber pull-out cavity images captured from different tilt angles. Figure 6c depicts the contour segmentation of the cavity using GAC model, with the contour of the same cavity in Figure 6a,b shown in red circle and in green circle, respectively. While Figure 6d shows the results of the three-dimensional reconstruction of the cavity, and Figure 6e,f depict the fiber column surface derived from the fitting results. (x0, y0) = (205.101, 274.158), α = 16.346°, β = 10.407° and r = 144.247 are the results of fitting the data. The axial unit vector of the fiber was obtained by transforming the unit vector parallel to the z’ axis by R as t = (−0.181, −0.277, 0.944)T. Equation (1) yields the deflection angle and the azimuth angle of the fiber. The azimuth angle and azimuth angle of the fiber were 19.301° and −33.129°, respectively.

3.1.3. Comparison with the Microscopic Measurement Method

The orientation of single fibers in the cross-section of the carbon-fiber-reinforced composite plates was measured using the method in this paper and compared with the image measuring instrument measurement results for analysis. Figure 4 demonstrates how the azimuth angle φ between the fiber and the side of the plate was measured. The azimuth angles of the single fibers in the five prepared composite plates were measured using both methods. The measured results are shown in Table 1.
As seen from Table 1, the measurement results of this method are consistent with the measurement results of the image measuring instrument, with a maximum error of 3.83° and an average error of 1.54°. There are several potential sources of error that could affect the accuracy of the results. The quality of the SEM images could vary depending on sample preparation, imaging conditions, and microscope settings. The image processing techniques used to extract fiber orientation information could also introduce misalignment, noise, or bias. According to Table 1, the measured azimuth angle of protruding fibers is closer to that of the image-measuring instrument than the result of the fiber pull-out cavity. The reason for this is that the fiber retains their cylindrical shape, which is important for determining their axial direction vectors. Because of poor fiber-matrix bonding, the extracted cavity is near-elliptical cylindrical. The data set has more noise or outlier points. The accuracy of the fiber azimuth angle obtained by detecting cavities is typically not as precise as that obtained by detecting prominent fibers azimuth angle. Measuring the fiber orientation distribution of the fiber yields more accuracy results than counting the fiber pull-out cavities on a single section.

3.2. Multifiber Deflection Angle Measurement Results

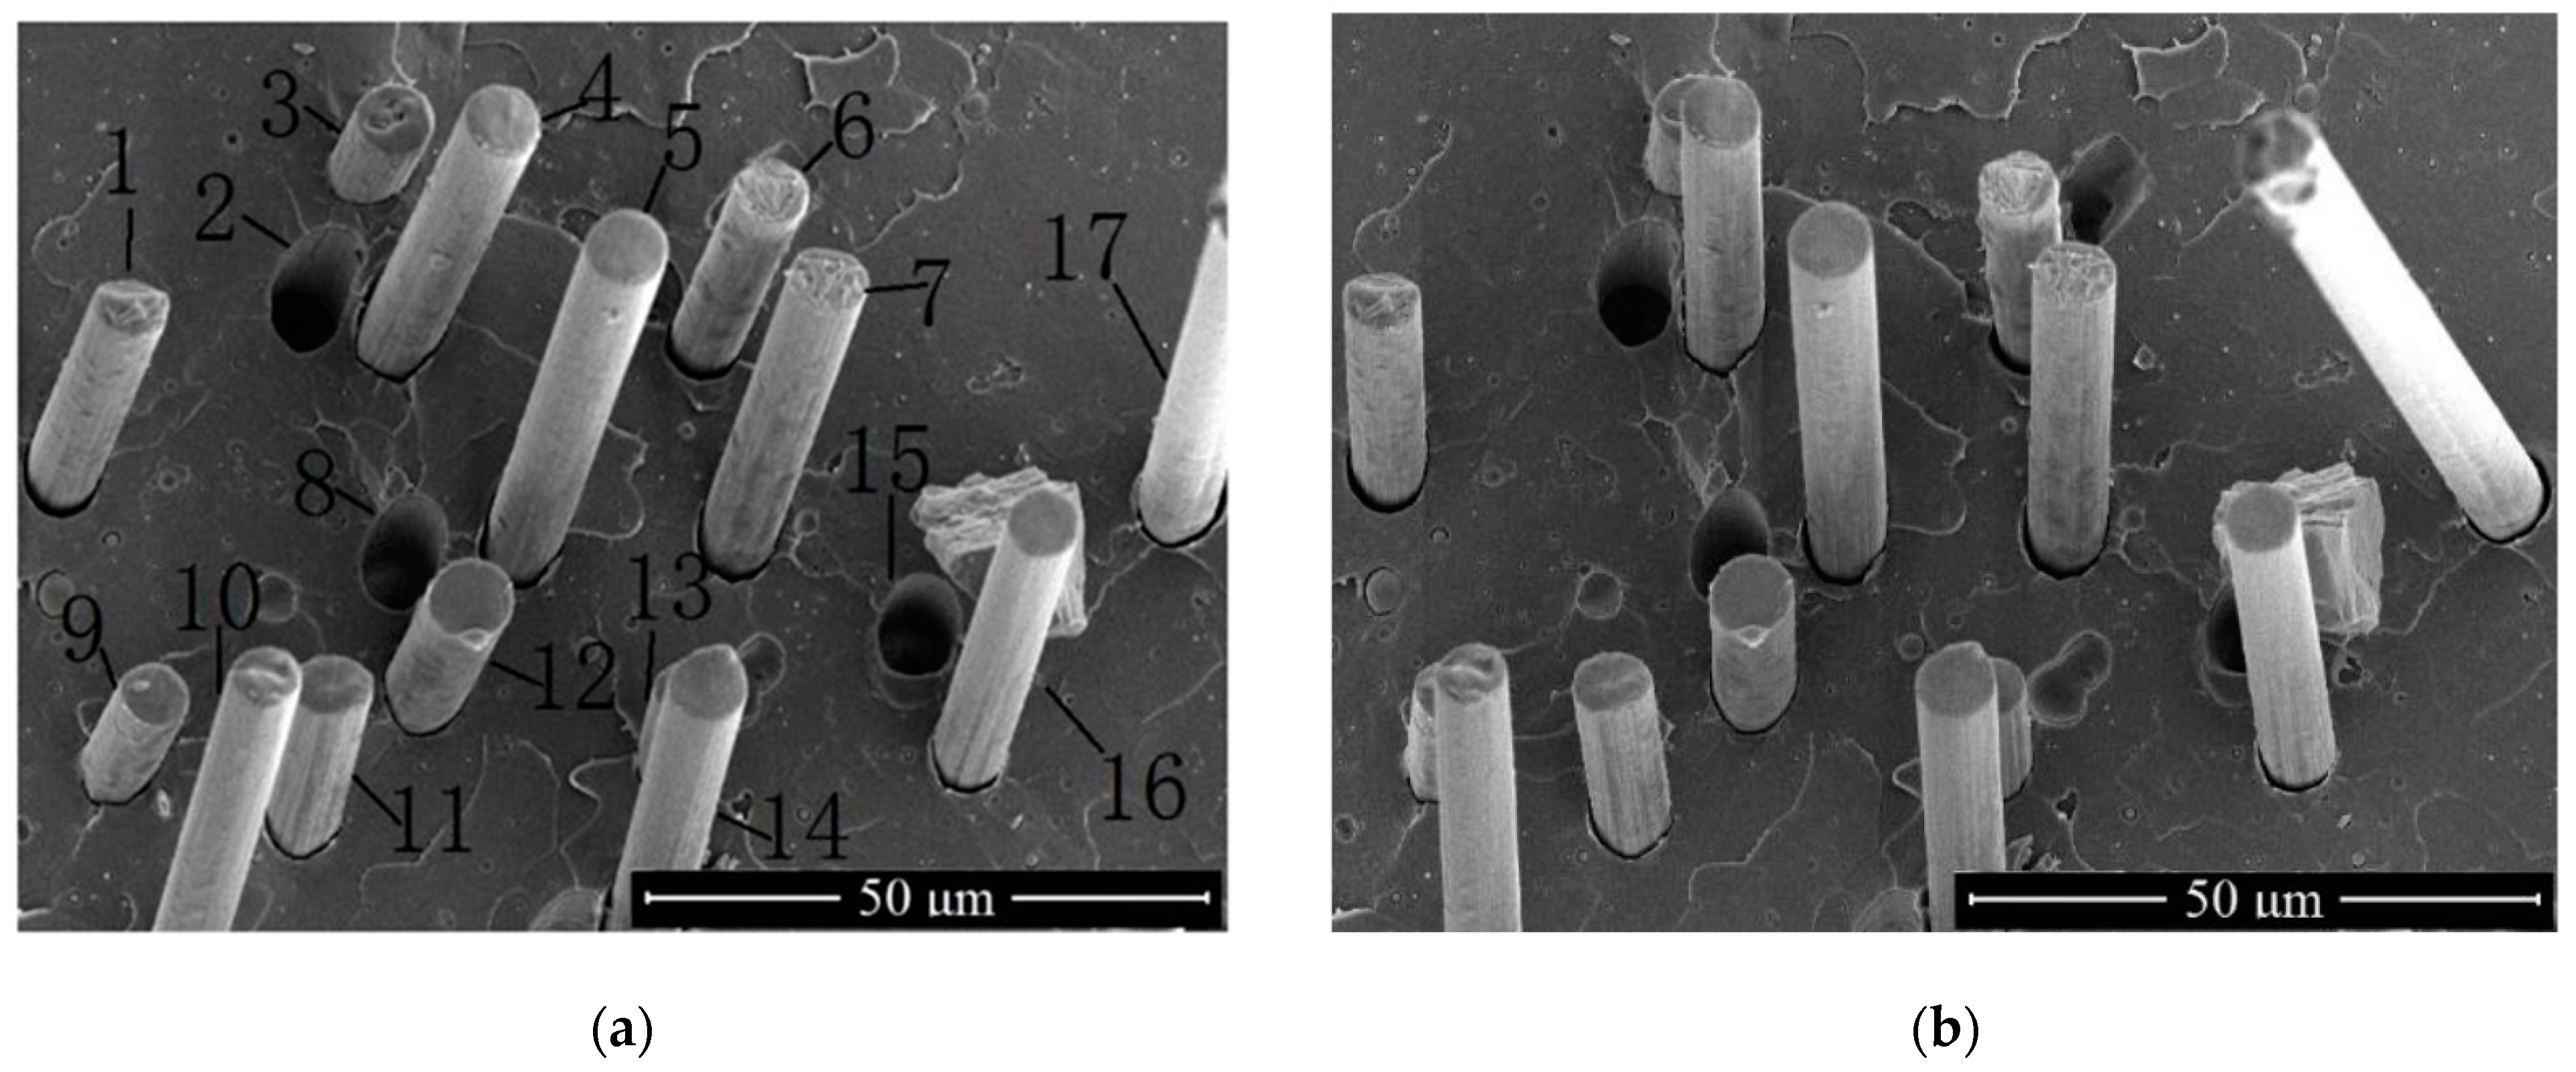
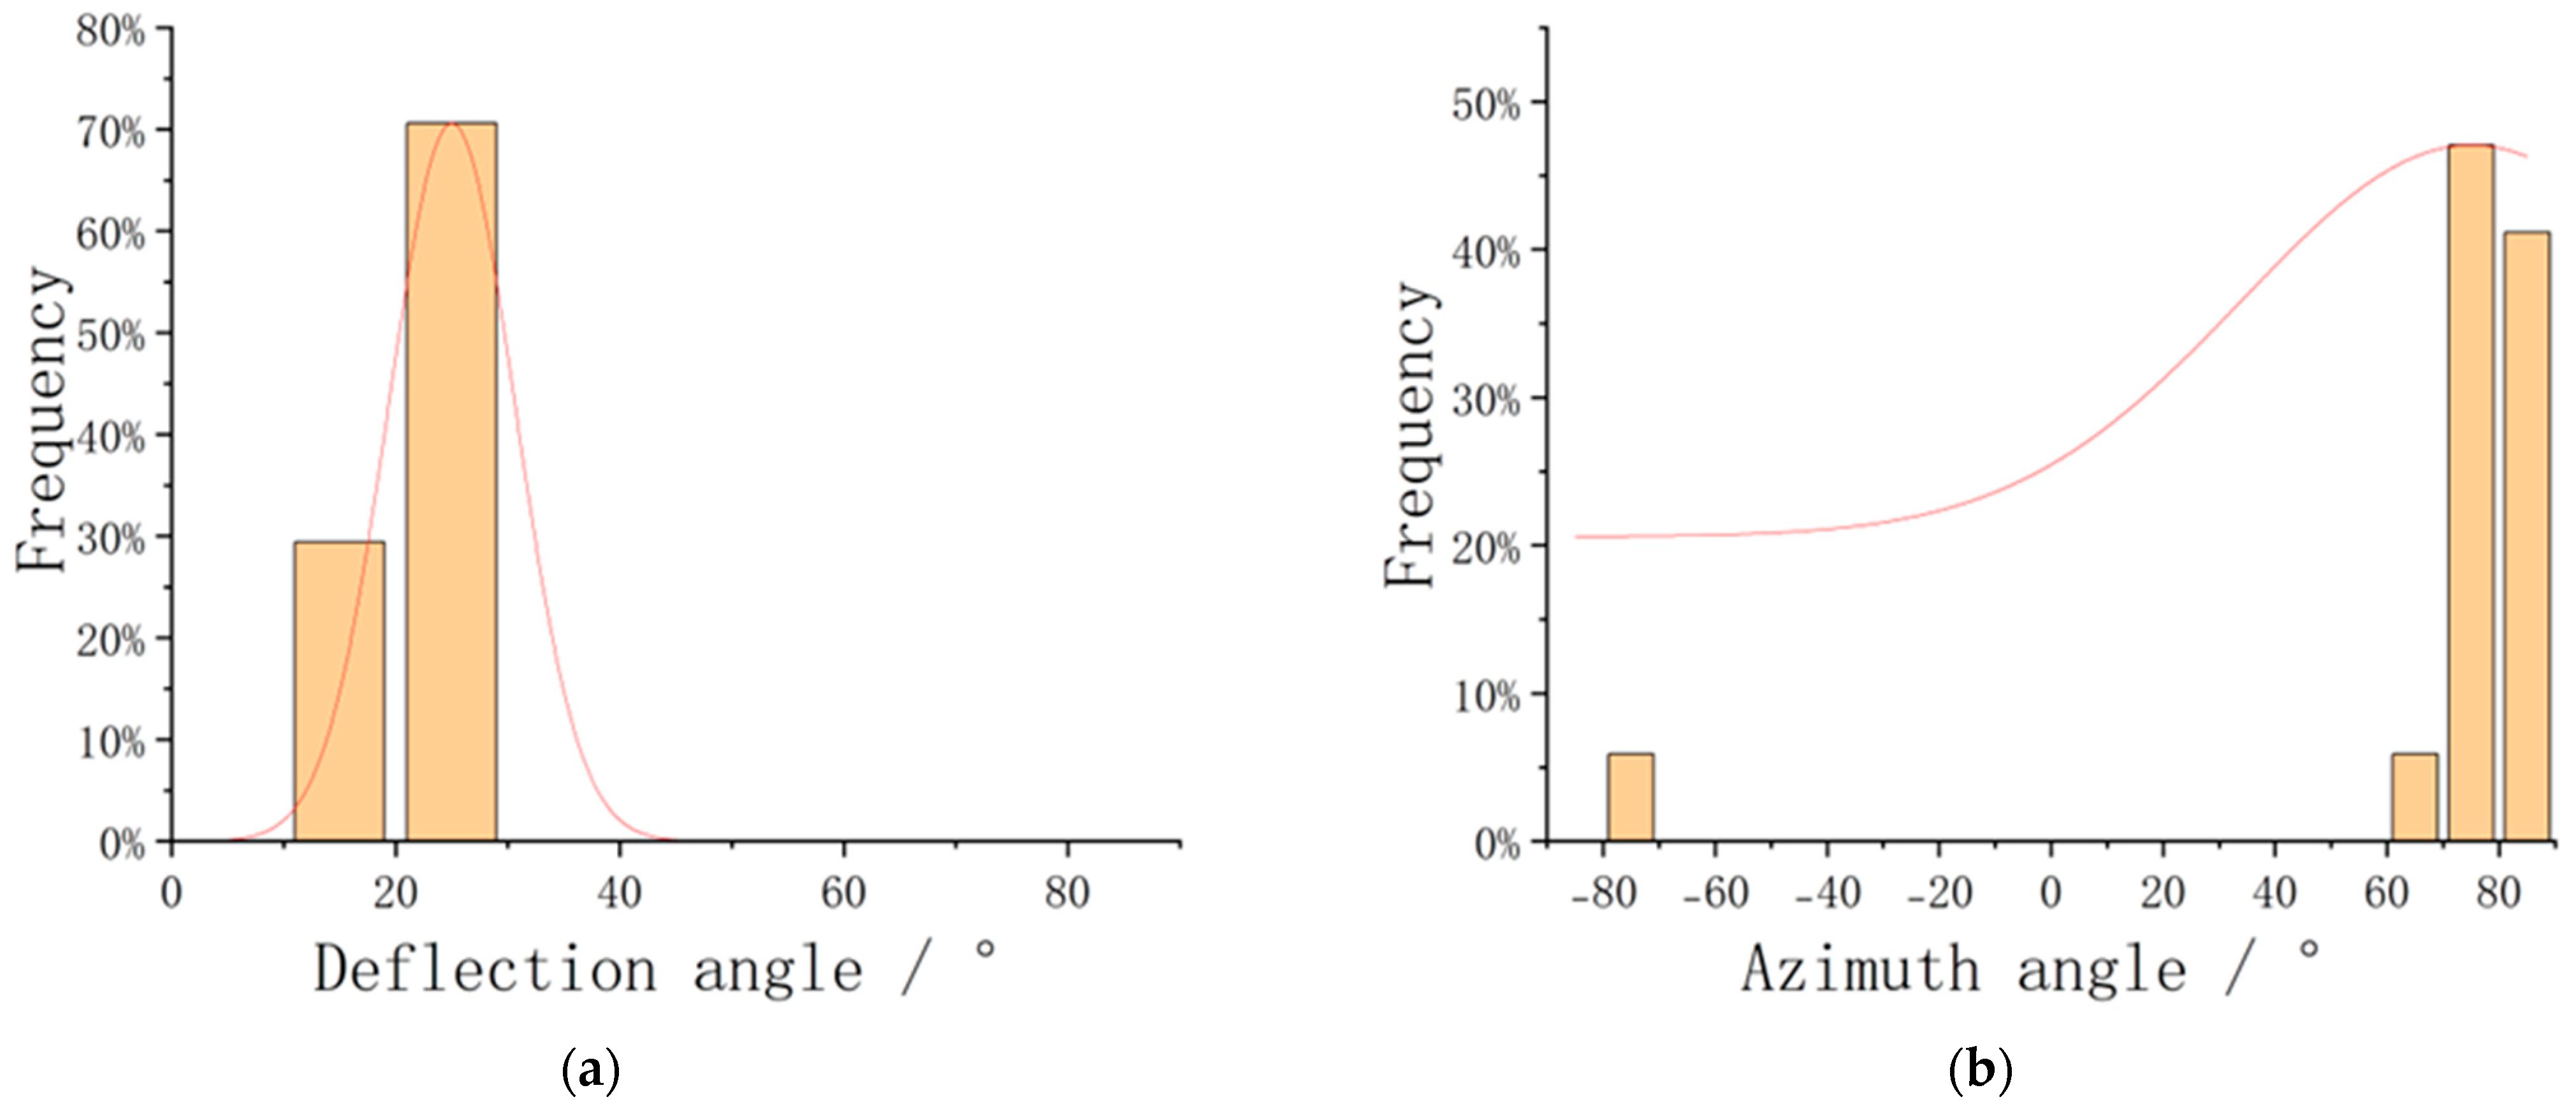
Figure 7 shows the SEM images of a portion of the composite section captured at a sample stage tilt of 5°. In the figure, pull-out cavities were labeled with numbers 2, 8, and 15, representing fiber pull-out cavities. The remaining were fibers. The orientation of the fibers is readily apparent. However, the exact values of the fiber deflection and azimuth angles cannot be determined visually. The fiber orientation may be determined by applying the method in this paper. Table 2 shows the results of the measurements of the deflection and azimuth angles of the fibers and fiber extraction cavities in Figure 7 by this method, and Figure 8 shows the distribution of the measurement results. The orange bar inside the Figure 8 representing the frequency of the fibers within that set, and the red line included in the chart represent a Gaussian distribution fitting curve. The fibers are highly oriented in the region depicted in Figure 8 based on the distribution fitting curve result, which is consistent with the visual observation.
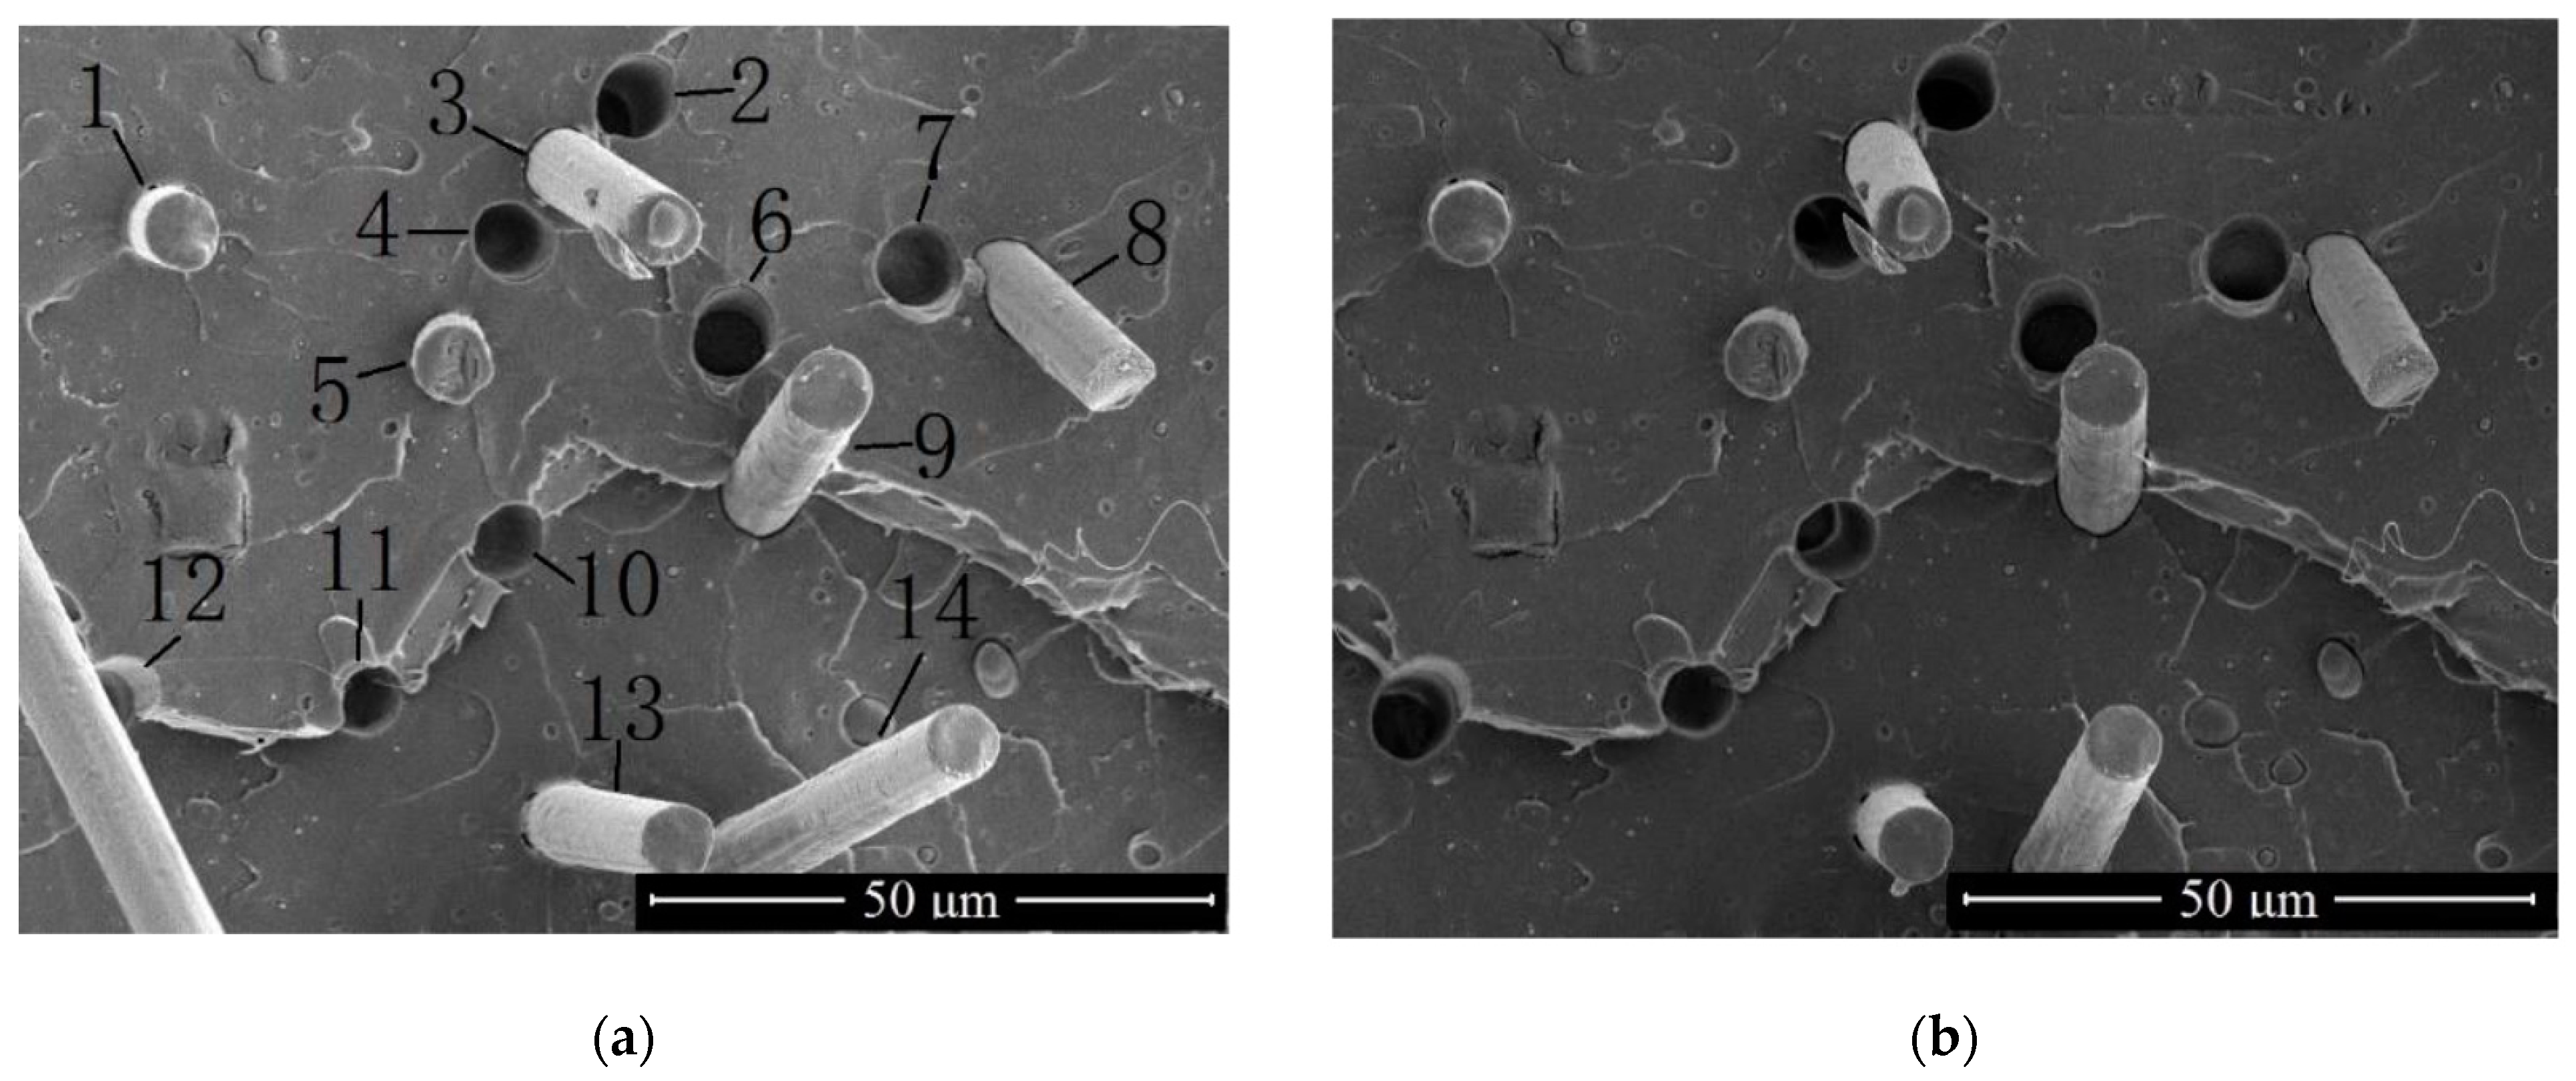
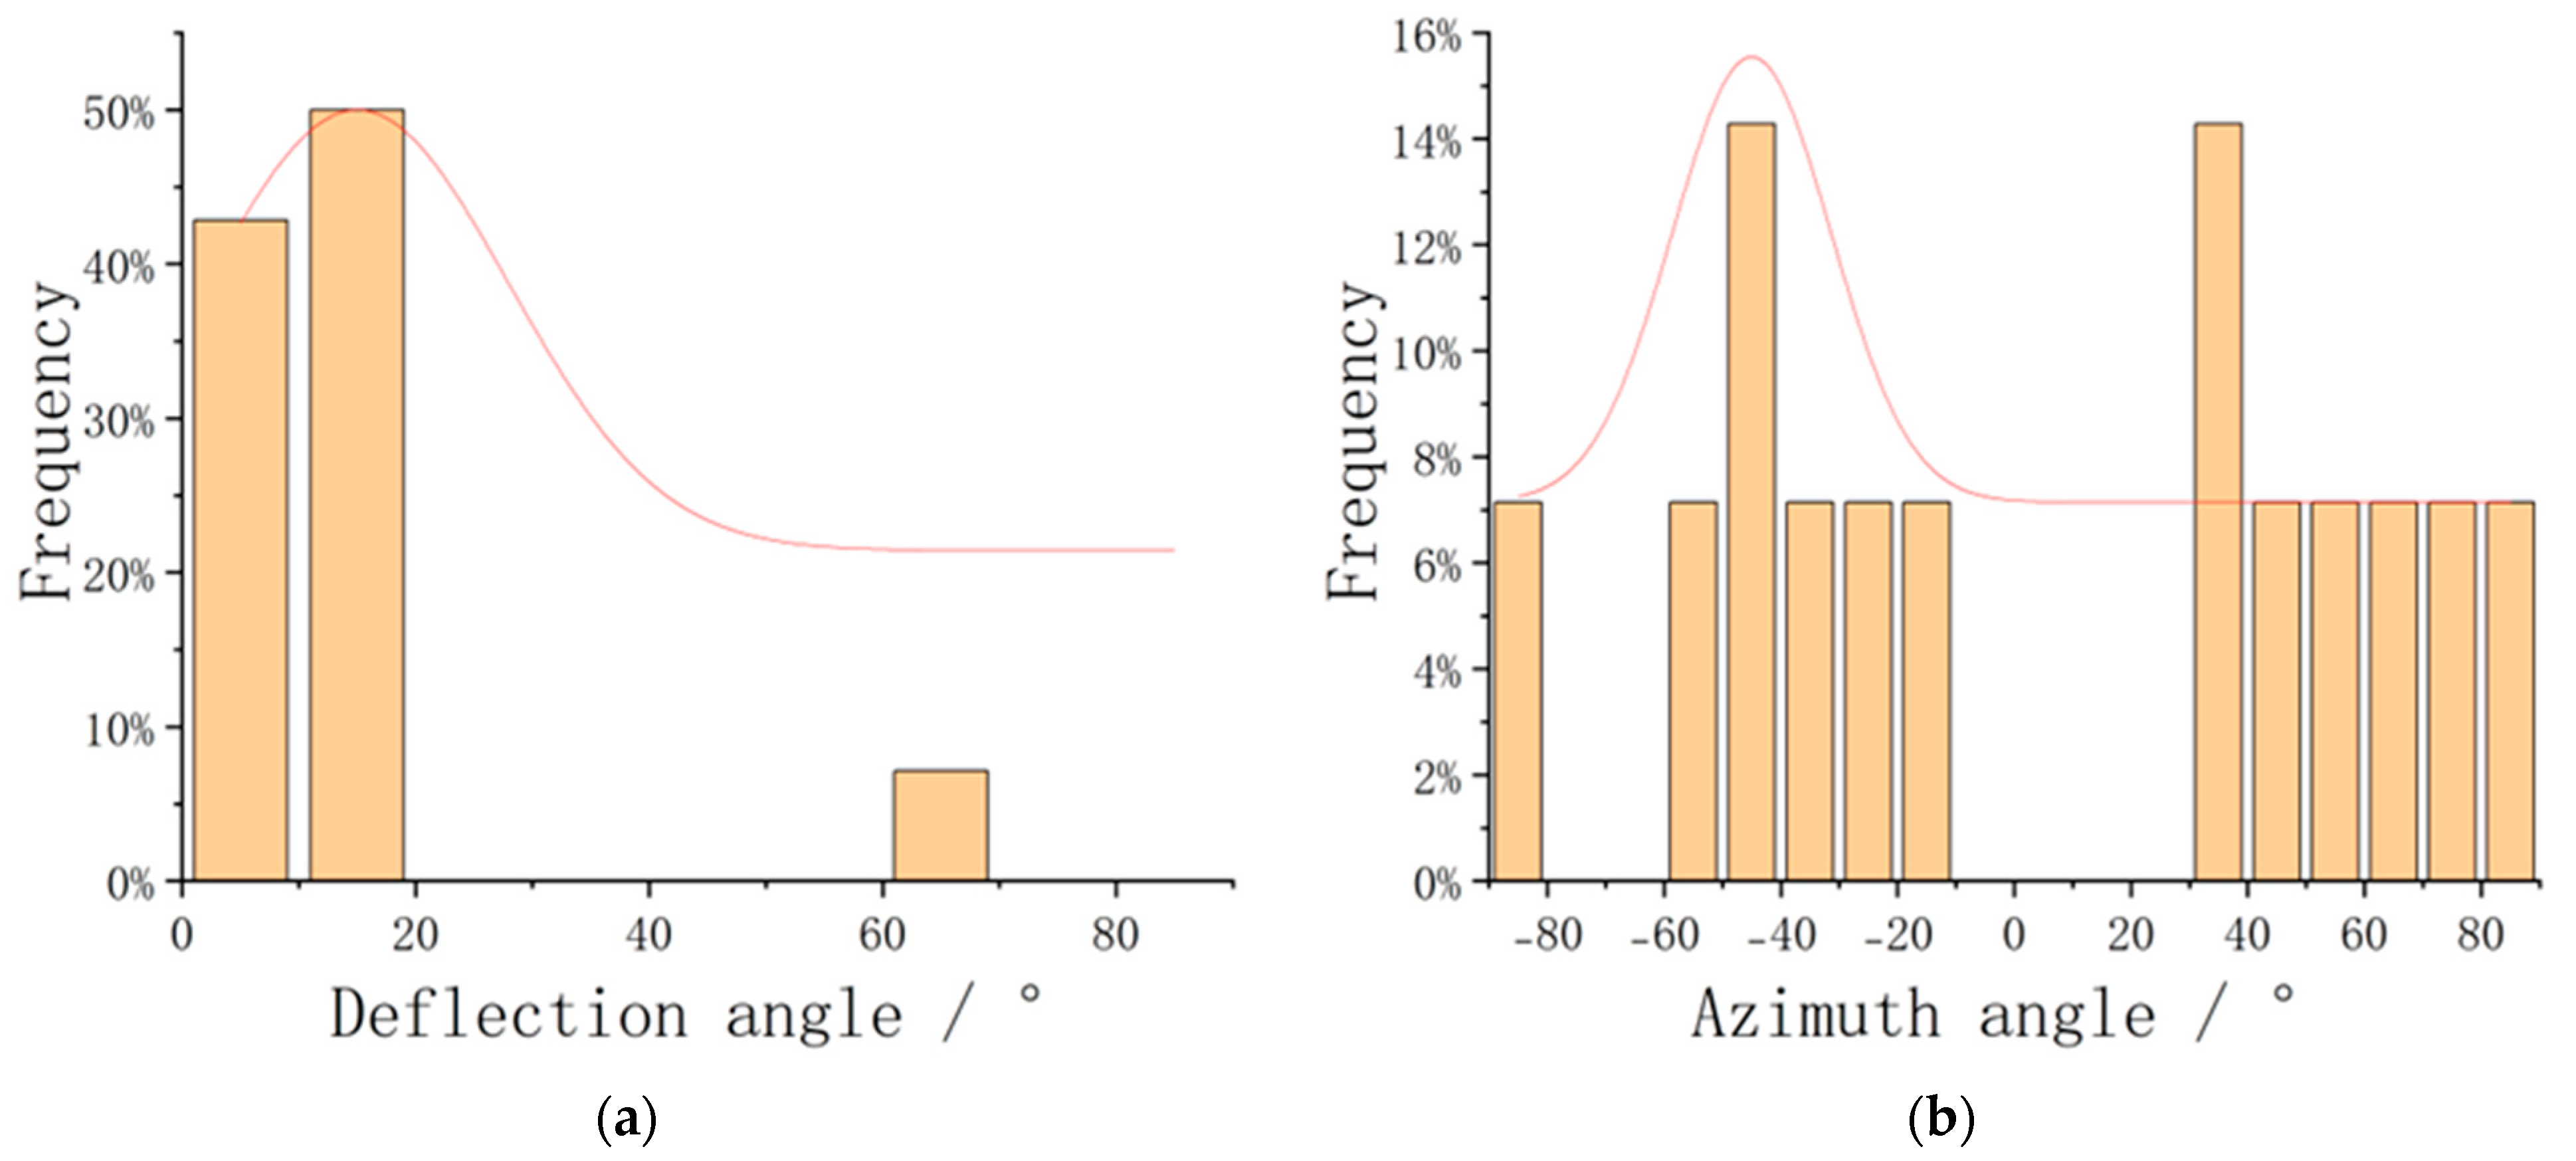
The composite section’s microscopic morphology is exceedingly complex, and the actual fiber orientation distribution inside the material is likewise quite complicated. In certain areas of the material, the orientation of the fibers may look quite random. Furthermore, the degree of fiber orientation cannot be assessed with visual inspection alone. Figure 9 shows a cross-sectional view of the composite material, which contains both long and short fibers. In Figure 9, the numbers 1, 3, 5, 8, 9, 13, and 14 represent fibers, while the remaining numbers represent fiber pull-out cavities. Figure 10 indicates that image points and polar lines are at the same height between reduced stereo image pairings. The results of the deflection and azimuth angles of each fiber and fiber extraction cavity in Figure 9 are shown in Table 3, and the fiber orientation distribution is depicted in Figure 11. The results show that the fiber orientation distribution in Figure 11 is significantly wider than the results in Figure 8.

4. Conclusions

The calculation technique for determining the axial unit vectors of various types of fibers on the material section was explored. The fitting results of the fiber column surface revealed that the approach could accurately reconstruct the information of the fiber column and be applied to actual SEM images. According to the experimental results of fiber orientation measurement on thin plates and sample sections of carbon-fiber-reinforced composite material, the SEM 3D reconstruction technique used for the fiber orientation measurement is reliable. The results show a maximum deviation of 3.83° and an average deviation of 1.50°, confirming the accuracy of the approach. The method is appropriate for determining fiber orientation and distribution. The approach presented in this work may directly identify the direction and distribution of fibers by rotating the sample stage and obtaining SEM images of the observation zone. It is simple to use, easy to prepare specimens for, and may significantly increase the efficiency of fiber orientation measuring operations.

Author Contributions

Conceptualization, H.W. and M.Z.; methodology, M.Z.; validation, H.W.; formal analysis, Z.Z.; investigation, Z.Z. and M.Z.; resources, H.W.; data curation, S.F. and K.Z.; writing—original draft preparation, Z.Z.; writing—review and editing, H.W.; visualization, Z.Z.; supervision, H.W. All authors have read and agreed to the published version of the manuscript.

Funding

This research received no external funding.

Institutional Review Board Statement

Not applicable.

Informed Consent Statement

Not applicable.

Data Availability Statement

All datasets are publicly available.

Conflicts of Interest

The authors declare no conflict of interest.

References

  1. Clyne, T.W.; Hull, D. An Introduction to Composite Materials; Cambridge University Press: Cambridge, MA, USA, 2019. [Google Scholar]
  2. Tsai, S.W.; Hahn, H.T. Introduction to Composite Materials; Routledge: Oxfordshire, UK, 2018. [Google Scholar]
  3. Chawla, K.K. Composite Materials: Science and Engineering; Springer Science & Business Media: Berlin/Heidelberg, Germany, 2012. [Google Scholar]
  4. Van Hattum, F.W.J.; Bernardo, C.A. A Model to Predict the Strength of Short Fiber Composites. Polym. Compos. 1999, 20, 524–533. [Google Scholar] [CrossRef]
  5. Gupta, M.; Wang, K.K. Fiber Orientation and Mechanical Properties of Short-Fiber-Reinforced Injection-Molded Composites: Simulated and Experimental Results. Polym. Compos. 1993, 14, 367–382. [Google Scholar] [CrossRef]
  6. Fu, S.-Y.; Lauke, B.; Mäder, E.; Yue, C.-Y.; Hu, X. Tensile Properties of Short-Glass-Fiber- and Short-Carbon-Fiber-Reinforced Polypropylene Composites. Compos. Part Appl. Sci. Manuf. 2000, 31, 1117–1125. [Google Scholar] [CrossRef]
  7. Yoo, Y.; Spencer, M.W.; Paul, D.R. Morphology and Mechanical Properties of Glass Fiber Reinforced Nylon 6 Nanocomposites. Polymer 2011, 52, 180–190. [Google Scholar] [CrossRef]
  8. Denton, D.L.; Munson-McGee, S.H. Use of X-Radiographic Tracers to Measure Fiber Orientation in Short Fiber Composites; ASTM International: West Conshohocken, PA, USA, 1985. [Google Scholar]
  9. Bernasconi, A.; Cosmi, F.; Hine, P.J. Analysis of Fibre Orientation Distribution in Short Fibre Reinforced Polymers: A Comparison between Optical and Tomographic Methods. Compos. Sci. Technol. 2012, 72, 2002–2008. [Google Scholar] [CrossRef]
  10. Lee, K.S.; Lee, S.W.; Youn, J.R.; Kang, T.J.; Chung, K. Confocal Microscopy Measurement of the Fiber Orientation in Short Fiber Reinforced Plastics. Fibers Polym. 2001, 2, 41–50. [Google Scholar] [CrossRef]
  11. Kwon, S.-W.; Bosche, F.; Kim, C.; Haas, C.T.; Liapi, K.A. Fitting Range Data to Primitives for Rapid Local 3D Modeling Using Sparse Range Point Clouds. Autom. Constr. 2004, 13, 67–81. [Google Scholar] [CrossRef] [Green Version]
  12. Nurunnabi, A.; Sadahiro, Y.; Lindenbergh, R. Robust Cylinder Fitting in Three-Dimensional Point Cloud Data. Int. Arch. Photogramm. Remote Sens. Spat. Inf. Sci. 2017, 42, 63–70. [Google Scholar] [CrossRef] [Green Version]
  13. Watanabe, R.; Sugahara, A.; Hagihara, H.; Mizukado, J.; Shinzawa, H. Insight into Interfacial Compatibilization of Glass-Fiber-Reinforced Polypropylene (PP) Using Maleic-Anhydride Modified PP Employing Infrared Spectroscopic Imaging. Compos. Sci. Technol. 2020, 199, 108379. [Google Scholar] [CrossRef]
  14. Feliciani, C.; Takai, Y. Measurement and Numerical Prediction of Fiber-Reinforced Thermoplastics’ Thermal Conductivity in Injection Molded Parts. J. Appl. Polym. Sci. 2014, 131, 39811. [Google Scholar] [CrossRef]
  15. Mazahir, S.M.; Vélez-García, G.M.; Wapperom, P.; Baird, D. Fiber Orientation in the Frontal Region of a Center-Gated Disk: Experiments and Simulation. J. Non-Newton. Fluid Mech. 2015, 216, 31–44. [Google Scholar] [CrossRef] [Green Version]
  16. Vélez-García, G.M.; Wapperom, P.; Baird, D.G.; Aning, A.O.; Kunc, V. Unambiguous Orientation in Short Fiber Composites over Small Sampling Area in a Center-Gated Disk. Compos. Part Appl. Sci. Manuf. 2012, 43, 104–113. [Google Scholar] [CrossRef]
  17. Koutsoudis, A.; Vidmar, B.; Ioannakis, G.; Arnaoutoglou, F.; Pavlidis, G.; Chamzas, C. Multi-Image 3D Reconstruction Data Evaluation. J. Cult. Herit. 2014, 15, 73–79. [Google Scholar] [CrossRef]
  18. Shen, H.; Nutt, S.; Hull, D. Direct Observation and Measurement of Fiber Architecture in Short Fiber-Polymer Composite Foam through Micro-CT Imaging. Compos. Sci. Technol. 2004, 64, 2113–2120. [Google Scholar] [CrossRef]
  19. Thi, T.B.N.; Morioka, M.; Yokoyama, A.; Hamanaka, S.; Yamashita, K.; Nonomura, C. Measurement of Fiber Orientation Distribution in Injection-Molded Short-Glass-Fiber Composites Using X-Ray Computed Tomography. J. Mater. Process. Technol. 2015, 219, 1–9. [Google Scholar] [CrossRef]
  20. Fang, H.; Lafarge, F. Connect-and-Slice: An Hybrid Approach for Reconstructing 3D Objects. In Proceedings of the IEEE/CVF Conference on Computer Vision and Pattern Recognition, Seattle, WA, USA, 13–19 June 2020; pp. 13490–13498. [Google Scholar]
  21. Paluch, B. Analysis of Geometric Imperfections in Unidirectionally Reinforced Composites. In Proceedings of the 6th European Conference on Composite Materials(ECCM 6), Bordeaux, France, 20–24 September 1993; pp. 305–310. [Google Scholar]
  22. Pinter, P.; Dietrich, S.; Bertram, B.; Kehrer, L.; Elsner, P.; Weidenmann, K.A. Comparison and Error Estimation of 3D Fibre Orientation Analysis of Computed Tomography Image Data for Fibre Reinforced Composites. NDT E Int. 2018, 95, 26–35. [Google Scholar] [CrossRef]
  23. Samak, D.; Fischer, A.; Rittel, D. 3D Reconstruction and Visualization of Microstructure Surfaces from 2D Images. CIRP Ann. 2007, 56, 149–152. [Google Scholar] [CrossRef]
  24. de Azevedo, C.R.F.; Marques, E.R. Three-Dimensional Analysis of Fracture, Corrosion and Wear Surfaces. Eng. Fail. Anal. 2010, 17, 286–300. [Google Scholar] [CrossRef]
  25. Caselles, V.; Kimmel, R.; Sapiro, G. Geodesic Active Contours. Int. J. Comput. Vis. 1997, 22, 61. [Google Scholar] [CrossRef]
  26. Osher, S.; Sethian, J.A. Fronts Propagating with Curvature-Dependent Speed: Algorithms Based on Hamilton-Jacobi Formulations. J. Comput. Phys. 1988, 79, 12–49. [Google Scholar] [CrossRef] [Green Version]
  27. Lowe, D.G. Distinctive Image Features from Scale-Invariant Keypoints. Int. J. Comput. Vis. 2004, 60, 91–110. [Google Scholar] [CrossRef]
  28. Clarke, A.R.; Archenhold, G.; Davidson, N.C. A Novel Technique for Determining the 3D Spatial Distribution of Glass Fibres in Polymer Composites. Compos. Sci. Technol. 1995, 55, 75–91. [Google Scholar] [CrossRef]
Figure 1. Schematic diagram of the SEM sample stage.
Applsci 13 03700 g001
Figure 2. SEM-based 3D reconstruction method for fiber orientation measurement.
Applsci 13 03700 g002
Figure 3. Fiber orientation diagram.
Applsci 13 03700 g003
Figure 4. Microscopic images of composite plate specimens: (a) carbon fiber reinforced PLA plate; (b) single-fiber image acquired by image measuring instrument (the fiber marked in the orange circle); (c) prominent carbon fiber SEM image; (d) carbon fiber pull-out cavity SEM image.
Applsci 13 03700 g004
Figure 5. Prominent fiber cylindrical fitting results: (a) SEM image when the sample stage tilted −5°; (b) SEM image when the sample stage tilted +5°; (c) contour segmentation tilted −5°; (d) contour segmentation tilted +5°; (e) fiber contour 3D point cloud; (f) cylindrical 3D shape.
Applsci 13 03700 g005
Figure 6. Fiber pull-out cavity cylindrical fitting results: (a) SEM image when sample the stage tilted −5°; (b) SEM image when the sample stage tilted +5°; (c) contour segmentation; (d) cavity contour 3D point cloud; (e) cylindrical 3D shape (the original points shown in green, the fitting surface is represented by the red points).
Applsci 13 03700 g006aApplsci 13 03700 g006b
Figure 7. SEM images at different inclination angles: (a) tilted −5°; (b) tilted +5°.
Applsci 13 03700 g007
Figure 8. Fiber orientation distribution in Figure 7: (a) deflection angle; (b) azimuth angle.
Applsci 13 03700 g008
Figure 9. SEM images at different inclination angles: (a) tilted −5°; (b) tilted +5°.
Applsci 13 03700 g009
Figure 10. Height-adjusted polar lines in Figure 9: (a) tilted −5°; (b) tilted +5°.
Applsci 13 03700 g010
Figure 11. Fiber orientation distribution in Figure 9: (a) deflection angle; (b) azimuth angle.
Applsci 13 03700 g011
Table 1. Single-fiber azimuth angle measurement (°).
No.The Method Used in This PaperImage Measurement Results
Prominent FiberPull-Out Cavity
116.50819.63817.027
233.49135.27532.519
319.74619.91719.642
49.4688.0139.735
524.95523.48121.128
Table 2. Deflection and azimuth angles of each fiber in Figure 7 (°).
No.Deflection Angle/°Azimuth Angle/°
121.38178.694
229.45774.249
329.09869.986
419.07576.891
522.35381.301
617.43181.63
727.58978.824
828.13977.121
923.20271.189
1028.30482.292
1123.03587.383
1217.29576.298
1328.4384.86
1427.16583.763
1520.68379.546
1619.69284.716
1710.936−78.599
Table 3. Deflection and azimuth angles of each fiber in Figure 9 (°).
No.Deflection Angle/°Azimuth Angle/°
18.61−56.77
29.3747.64
313.53−44.89
47.69−49.15
52.66−85.39
610.9576.42
78.8783.56
866.5350.54
915.4269.78
1019.3−33.13
1117.36−28.17
1210.7938.11
137.09−14.54
1411.4338.89
Disclaimer/Publisher’s Note: The statements, opinions and data contained in all publications are solely those of the individual author(s) and contributor(s) and not of MDPI and/or the editor(s). MDPI and/or the editor(s) disclaim responsibility for any injury to people or property resulting from any ideas, methods, instructions or products referred to in the content.