Article

Identifying Malignant Breast Ultrasound Images Using ViT-Patch

1
School of Automation Engineering, University of Electronic Science and Technology, Chengdu 610000, China
2
School of Data Science and Artificial Intelligence, Wenzhou University of Technology, Wenzhou 325000, China
3
Department of Geography and Anthropology, Louisiana State University, Baton Rouge, LA 70803, USA
4
College of Resource and Environment Engineering, Guizhou University, Guiyang 550025, China
5
LIRMM, UMR 5506, CNRS-UM, 34095 Montpellier, France
*
Authors to whom correspondence should be addressed.
Appl. Sci. 2023, 13(6), 3489; https://doi.org/10.3390/app13063489
Submission received: 7 February 2023 / Revised: 2 March 2023 / Accepted: 5 March 2023 / Published: 9 March 2023

Abstract

:
Recently, the Vision Transformer (ViT) model has been used for various computer vision tasks, due to its advantages to extracting long-range features. To better integrate the long-range features useful for classification, the standard ViT adds a class token, in addition to patch tokens. Despite state-of-the-art results on some traditional vision tasks, the ViT model typically requires large datasets for supervised training, and thus, it still face challenges in areas where it is difficult to build large datasets, such as medical image analysis. In the ViT model, only the output corresponding to the class token is fed to a Multi-Layer Perceptron (MLP) head for classification, and the outputs corresponding to the patch tokens are exposed. In this paper, we propose an improved ViT architecture (called ViT-Patch), which adds a shared MLP head to the output of each patch token to balance the feature learning on the class and patch tokens. In addition to the primary task, which uses the output of the class token to discriminate whether the image is malignant, a secondary task is introduced, which uses the output of each patch token to determine whether the patch overlaps with the tumor area. More interestingly, due to the correlation between the primary and secondary tasks, the supervisory information added to the patch tokens help with improving the performance of the primary task on the class token. The introduction of secondary supervision information also improves the attention interaction among the class and patch tokens. And by this way, ViT reduces the demand on dataset size. The proposed ViT-Patch is validated on a publicly available dataset, and the experimental results show its effectiveness for both malignant identification and tumor localization.

1. Introduction

As humans understand more about pathology, medical practitioners expect more accurate algorithms to assist doctors to obtain precise information from medical images. Zheng et al. [1] used sparse representation to separate the structural information of low-dose CT images from noise and artifact information. In [2], Nikolaev et al. proposed a novel automated cone-based breast ultrasound system which can facilitate the volumetric ultrasound acquisition of the breast in a prone position. Xu et al. [3] applied a sparse angle CBCT reconstruction algorithm based on Guided Image Filtering (GIF) to reduce the radiation dose without damaging the reconstruction quality.
In the last decade, deep learning has been widely applied in the field of computer vision, image processing, and Natural Language Processing (NLP). For some medical image analysis tasks, deep learning has also become a mainstream technique. Various deep-learning models have been designed for disease classification, lesion detection and segmentation, and multi-model medical image registration.
Deep belief networks have been used earlier to classify Alzheimer’s disease based on brain Magnetic Resonance Imaging (MRI) [4,5]. In [6], Cao et al. systematically evaluated the performances of several state-of-the-art target detection methods based on deep learning. Most of the deep-learning models used for medical image analysis are based on the convolutional neural networks (CNNs). However, as indicated in [7], the CNN-based models are not good at extracting long-range features, which are exactly what is needed for many medical image analysis tasks. Deep-learning models are required to make judgments based on global features of the entire image, just like a real doctor.
Recently, the transformer model [8], which is more adaptable at extracting long-range features, has been introduced from the field of NLP to computer vision. In 2020, Dosovitskiy et al. [9] proposed a Vision Transformer (ViT) model for image classification, based on the self-attention mechanism of the transformer, and has achieved SOTA results. Based on ViT, the Deit [10] model adds a distillation token as a teacher to improve classification performance. Wang et al. [11] built a PVT model by simulating the feature pyramid in convolutional networks to make ViT with multi-scale feature information. The ViT has also been introduced for medical image analysis because of its long-range feature extraction capability [12]. Wu et al. [13] used ViT to classify CT images for emphysema. Gao et al. [14] proposed ViT-based models to classify COVID-19 CT images in the MIA-COV19 challenge. ViT models were also used for medical image segmentation [15,16,17]. In 2021, Gheflati and Rivaz [18] first applied the ViT for classifying breast ultrasound images. In [19], Shamshad et al. provided a comprehensive review of the applications of transformers in medical imaging covering various aspects, ranging from recently proposed architectural designs to unsolved issues.
Although ViT models have achieved significant success in many medical images analysis tasks, they still face challenges. In [20], Tu et al. indicated that ViT is weak in extracting local information, and proposed the maxvit model, which can extract both local and global information. Yi et al. [21] proposed a local–global transformer (LGT) to preserve the intra-unit information and inter-unit correlation. Yuan et al. [22] proposed tokens-to-token to imitate the convolution by reshaping the tokens in the transformer, which is useful for the interaction of tokens. In [23], Liu et al. proposed Swin-Transformer, to assist cross-window connection by the Shifted windows. And, as indicated by [9], compared to the CNN-based models, the ViT-based models usually require larger datasets to support their training, due to a more number of learnable parameters. However, for many medical related tasks such as the ultrasound image analysis also focused on in this paper, it is often difficult to build a large dataset like the natural image dataset ImageNet, due to the difficulties in acquiring and labeling data, which has resulted in the ViT models performing less efficiently than expected on many medical image analysis tasks.
The standard ViT architecture for image classification adds a class token in addition to the patch tokens to better aggregate the features extracted from each image patch. At the end of the transformer encoder, only the output corresponding to the class token is fed to a Multi-Layer Perceptron (MLP) head for classification, while all of the outputs corresponding to the patch tokens are directly discarded. To improve the training of ViT models on small training datasets, this work proposes an improved ViT architecture, called ViT-Patch, by introducing a secondary task on the patch tokens, which is related to the classification task (i.e., the primary task) on the class token. An MLP head is added for each patch token in ViT-Patch to determine whether the patch overlaps with the tumor area (i.e., the secondary task). Since the primary and secondary tasks are closely related, the proposed ViT-Patch can obtain more supervised information from a single image sample to train model parameters, thus reducing the requirement for training datasets, compared with the standard ViT that relies only on the output of the class token.
The proposed ViT-Patch is validated based on a publicly available breast ultrasound dataset. The experimental results show that ViT-Patch can effectively improve the efficiency of feature learning on the class token and patch tokens. Compared with the standard ViT, the ViT-Patch not only improves the performance of the primary task (malignant identification) on the class token, but also enables patch-based tumor localization using the outputs of patch tokens, which will be useful for subsequent detection or segmentation tasks.

2. Methods

2.1. Standard ViT for Malignant Identification

The ViT replaces the traditional convolutional computation with a self-attentive mechanism in vision tasks. Figure 1 shows the standard ViT, which is composed of three modules: patch and position embedding, transformer encoder, and MLP head.
Patch and position embedding: Since the input to transformer is a sequence of vectors, the ViT first needs to divide the input image into different patches and encode them to form a sequence of embedded vectors, i.e., the initial patch tokens. Suppose that the input image is I R H × W × C , where C is the number of channels, and H and W represent the height and weight of the image, respectively. The size of each patch is S × S . There are N = H W / S 2 patches in total, and by patch and position embedding, N embedded vectors (patch tokens) are obtained. Similar to BERT [24], ViT adds a learnable token, i.e., the class token. All N + 1 tokens are fed to the transformer encoder for multi-headed self-attention computation.
The patch embedding can be implemented with a S × S × C × D convolutional layer of padding = ‘valid’, channel number = C and stride = S,
{ t 1 , t 2 t n } n = 1 N = C o n v ( I )
where t n R D denotes the n-th patch token, and the dimension D of each token vector is determined by the number of output channels of the convolutional layer. To embed the position information, a learnable D-dimensional position encoding vector s n is added to each patch token, i.e., t n t n + s n . An initial token matrix T R ( N + 1 ) × D is finally obtained by concatenating the class token and the N patch tokens.
t n = t n + s n R D
T = C o n c a t ( t c l a s s ; t 1 , t 2 t n ) R ( N + 1 ) × D
Transformer encoder: The transformer encoder is composed of multiple encoder blocks based on multi-headed attention. In each encoder block, there are two basic computational units, Multi-Headed Self-Attention (MHSA) and MLP, each preceded by a LayerNorm (LN) [25,26] and followed by a residual connection. Based on single attention function, MHSA use multi-head for multiple parallel attention calculations.
[ Q K V 1 , Q K V 2 Q K V h ] = F C ( T )
Q K V represents the query Q R ( N + 1 ) × d , keyword K R ( N + 1 ) × d , and value V R ( N + 1 ) × d . Finally, MHSA consider h attention “heads”, where h represents the number of heads, and D = h × d .
M H S A ( T ) = C o n c a t ( h e a d 1 , h e a d 2 h e a d h )
h e a d i = A t t e n t i o n ( Q i , K i , V i ) = s o f t m a x ( Q i K i T d V i )
Let T be the input token matrix of an encoder block, i.e., the output of the previous block. The data flow is shown in Figure 1b. The feedforward calculation of the encoder block is written as
T M H S A ( L N ( T ) ) + T
T M L P ( L N ( T ) ) + T
For more detail about the MHSA, please refer to [8].
MLP head on class token: For malignant identification, an MLP head is added on the top of the class token (see Figure 1), which contains a hidden layer with a GeLU activation, and an output layer of size 1 with a sigmoid activation. The desired output of the MLP head should be 1 if the input image contains a malignant tumor, and 0 if it is normal or benign. The Binary Cross Entropy (BCE) is used as a loss function to measure the difference between the desired output L c and the predicted output P c of the MLP head on the class token,
l c l a s s = B C E ( P c , L c )

2.2. Improved ViT-Patch Architecture

The standard ViT usually requires large training datasets due to the large number of parameters. This makes it difficult for ViT models to take advantage of long-range feature extraction on some medical image analysis tasks where data acquisition and labeling costs are high, resulting in performance that is often inferior to that of CNN-based models.
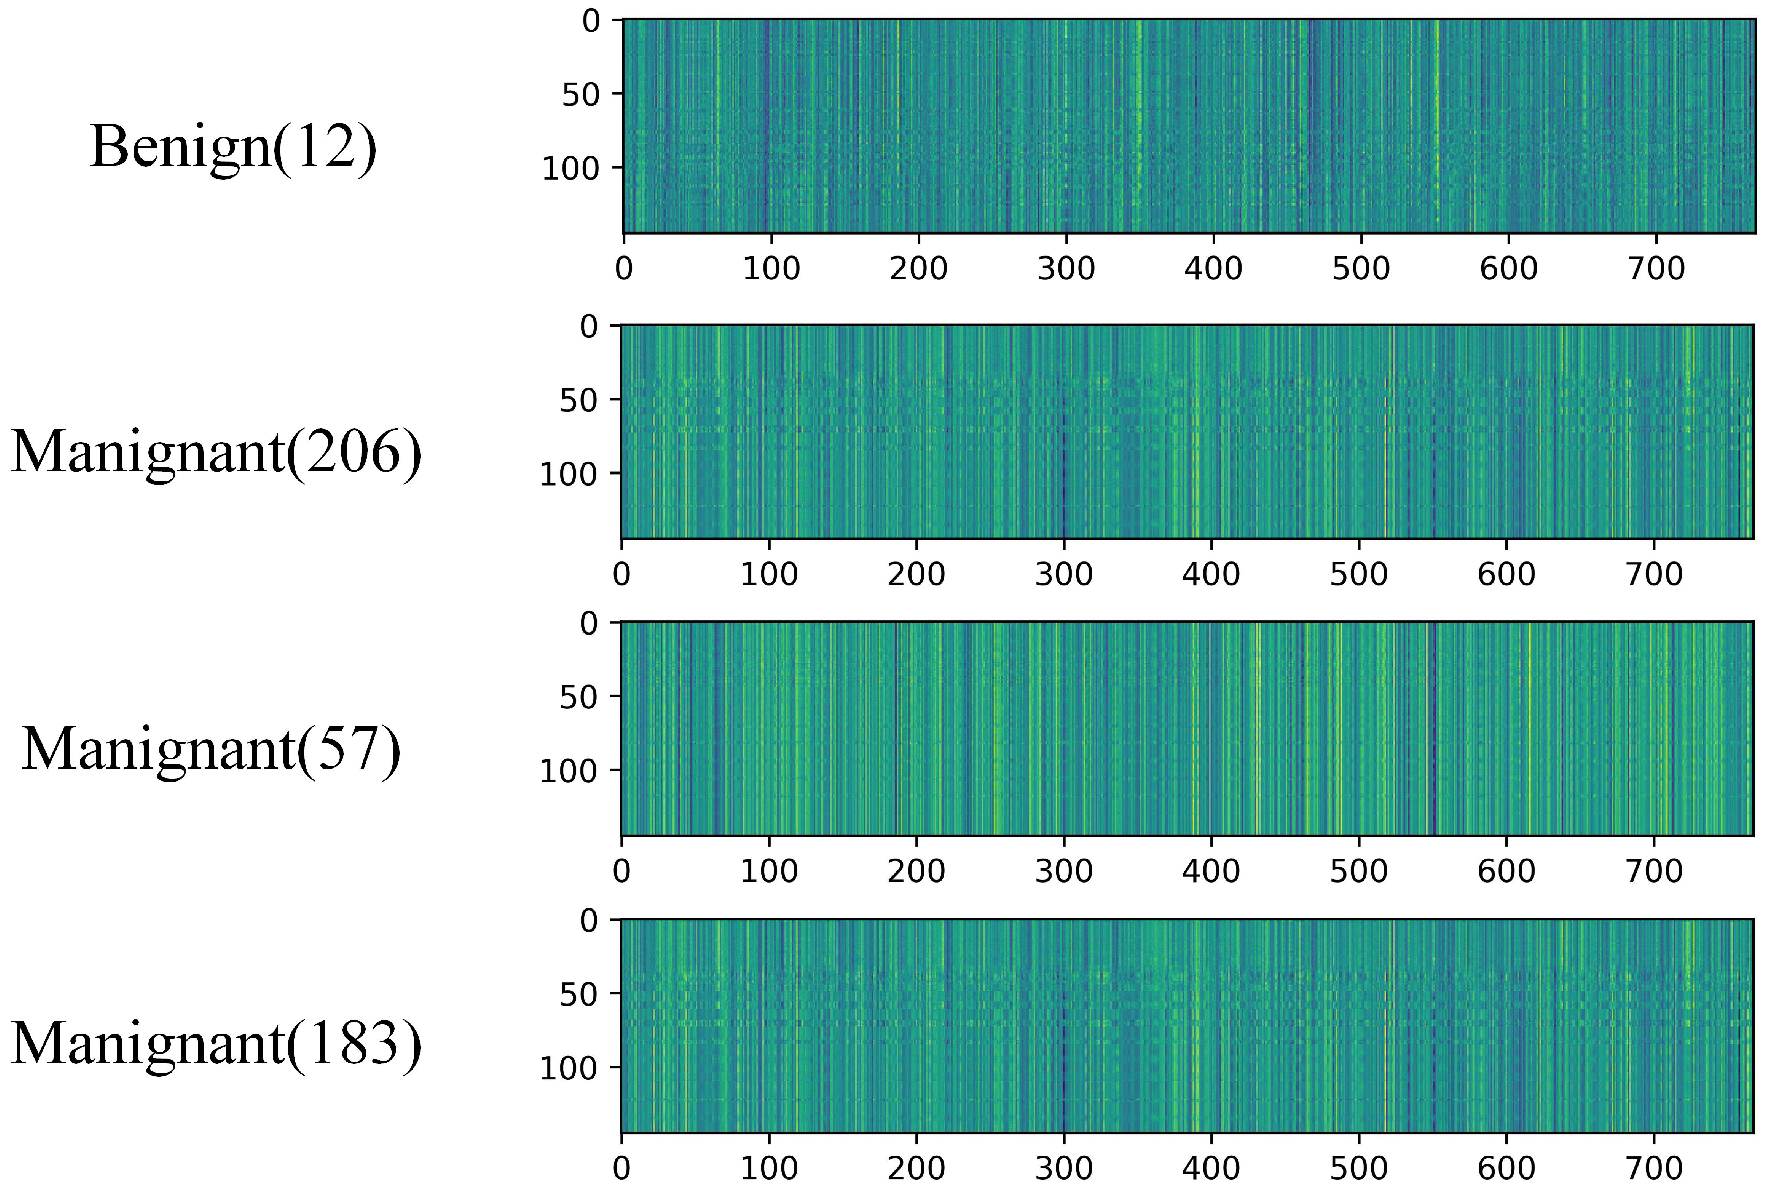
As can be seen from Figure 1, only the class token is covered by an MLP head, while all patch tokens are not roofed in the standard ViT. This single MLP-head architecture tends to lead to the unbalanced training of class token and patch tokens. During the training phase, the supervised information is only back-propagated from the class token to the transformer encoder, which may lead to weaker and weaker associations between the features learned by each patch token and its initial embedded features, as the number of encoding blocks increases, since the MHSA mechanism allows for the lateral flow and fusion of embedded features between tokens. As shown in Figure 2, each row of the last layer token of ViT is much similar with the others. At the deeper levels, the patch tokens and class tokens have similar functionalities, and their output features are prone to redundancy, which can cause the model to be prone to overfitting on small datasets.
We expect the model to processing image information like a real doctor, which can constantly interact with global and local information. And, we believe that the patch tokens contain valid information for category classification, so we hope to find a way to introduce the patch tokens into the training process.
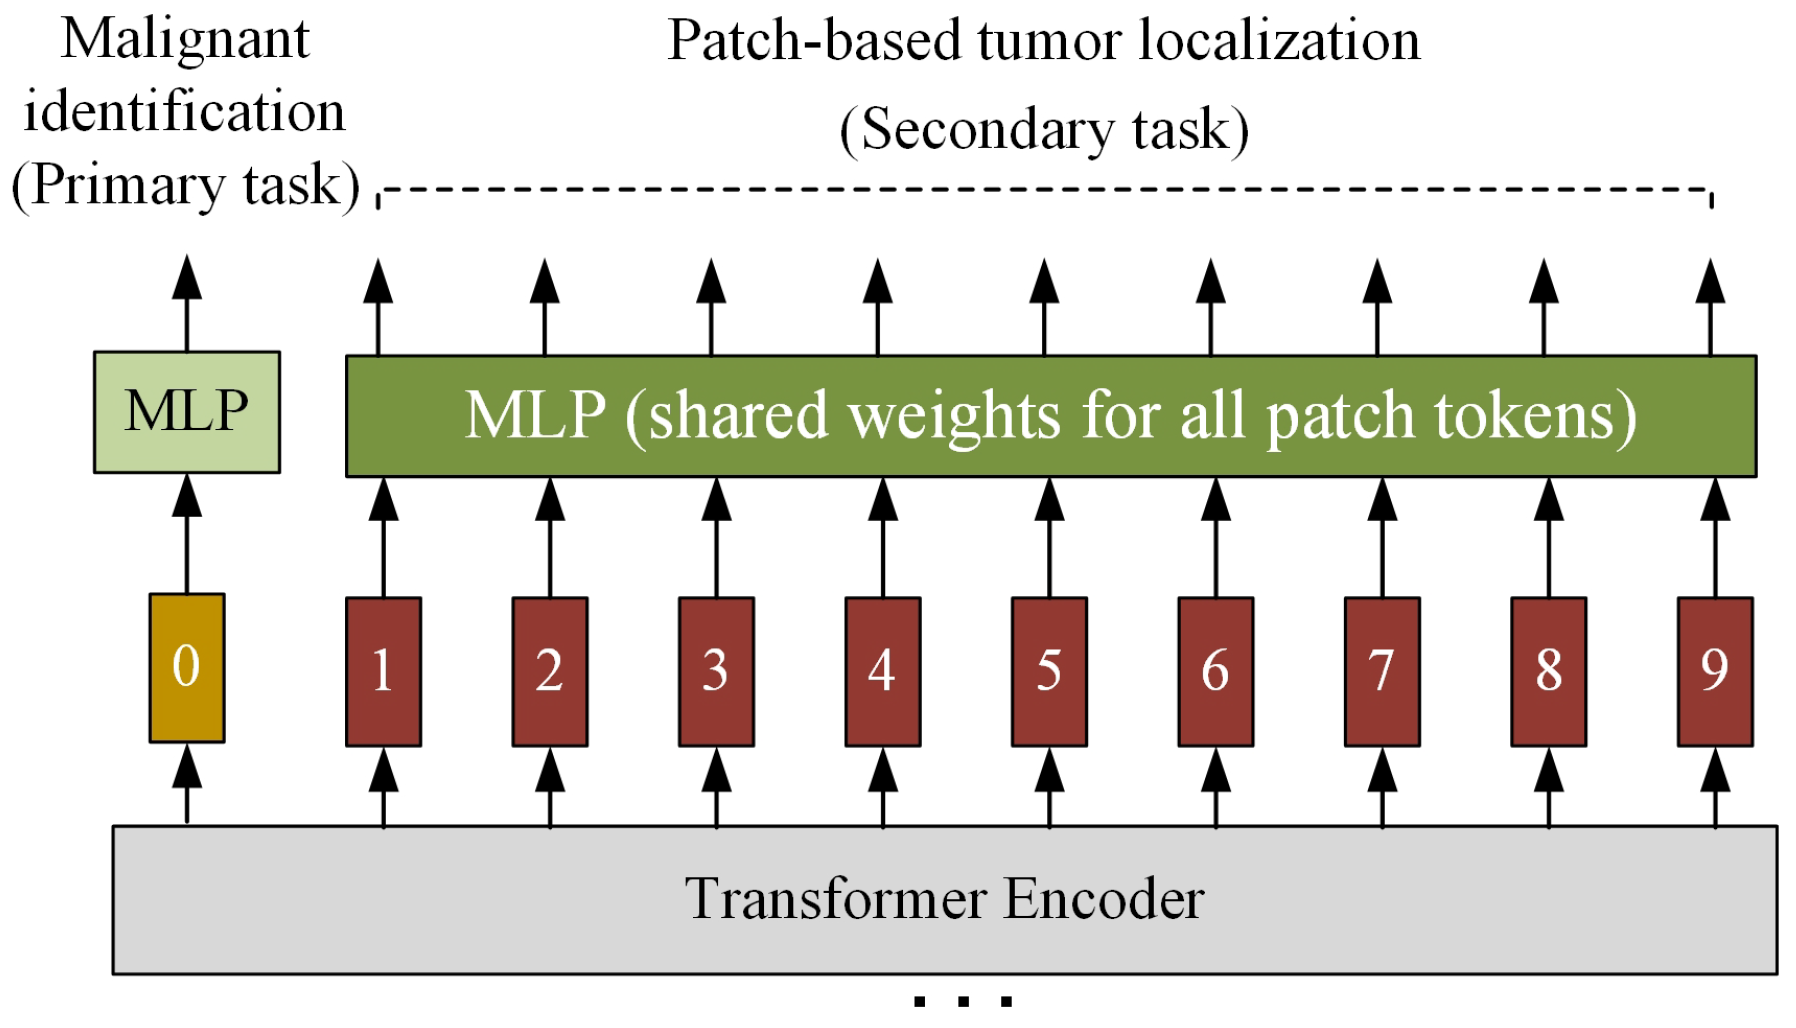
In this work, We try to let each token keep its own characteristic information, and so a secondary task is imposed on the patch tokens, which is related to the primary task (malignant identification) imposed on the class token. As shown in Figure 3, an MLP head is added to each patch token output by the transformer encoder to determine whether the patch overlaps with the tumor. Adding the secondary task can balance the training of the class and patch tokens, and make the flow and fusion of the image features between the tokens more reasonable. With the class token focusing on the long-range features used for the malignant identification of the whole image, and with each patch token focusing on the local features related to this patch, ViT-Patch reduces the feature redundancy between the tokens and avoids the overfitting problem.
The proposed ViT-Patch architecture not only adds a patched-based tumor localization function, but also improves on the classification performance of the primary task by introducing auxiliary supervision information on the patch tokens that is closely related to the primary task on the class token.
MLP head on patch tokens: All patch tokens share the same MLP head for the secondary task, which has the exact same structure as that on the class token, but does not share weights with the class token. If a patch has an overlap with a tumor area, the desired output of the MLP head corresponding to that patch should be 1, otherwise, it should be 0.
Joint loss function: Since the secondary task is also binary classified for each patch token, the BCE loss is adopted. The total loss function is defined as
l o s s = l c l a s s + n = 1 N B C E ( P n , L n )
where P n / L n denotes the predicted/desired output of the MLP head on the n-th patch token.

3. Experiments

3.1. Dataset

The breast ultrasound dataset is from Al-Dhabyani et al. [27], which is composed of 780 images from 600 women divided into three categories: 133 normal images, 437 benign images, and 210 malignant images. In this work, the normal and benign images are combined into one class, and the malignant images are another class, corresponding to the binary classification of the primary task. Both the benign and malignant images in the dataset are labeled with segmentation masks for the tumor areas that can be used to generate the patch-token labels for the secondary task.
Figure 4 shows some sample images and their masks in the original dataset. The morphological characteristics of the breast ultrasound images are shown in Table 1. In general, the malignant lesions are more irregular in shape than the benign lesions, and they are more likely to be confused with normal human tissue. The image sizes in the original dataset are not standardized. In order to be able to input the ViT models, we unified the image sizes to 384 × 384 by reshaping it. We randomly selected 118 (about 15% of the total samples) images as the test set, of which 33 images are malignant, 65 images are benign, and 20 images are normal. The remaining 664 images are used as training samples.

3.2. Experimental Setting

Our experimental platform is Torch 1.10 and Python 3.7.7 @ an RTX 3090Ti GPU. All models haved trained with the Adam [28] optimizer, with an initial learning rate of 1 × 10 4 and beta = ( 0.9 , 0.999 ) .
The transformer encoder in the standard ViT contains 12 encoder blocks, and the dimension of all tokens is set to D = 768 . For comparison, the ViT-Patch did not make any changes to the other modules of the standard ViT except for adding the MLP header to the patch tokens. All MLP heads used in the ViT and ViT-Patch have the same structure, containing a hidden layer of size 4 D with the GeLU activation. All ViT-based models in our experiments are trained for 50 epochs. To verify the effects of different patch divisions on the performances of ViT-based models, we divided the 384 × 384 ultrasound images into patches of 3 × 3 , 6 × 6 , 12 × 12 , and 24 × 24 , forming patches of sizes S = 128 , 64 , 32 , and   16 , respectively. In the following, ViT/ViT-Patch(S) is used to denote the standard ViT/the proposed ViT-Patch with patch size S × S , respectively.

3.3. Experimental Results

We validate the performance of the ViT-Patch for whole-image-based malignant identification and patch-based tumor localization, based on the breast ultrasound dataset. The experimental results for malignant identification are compared with the standard ViT, and some traditional models which have been widely used for comparison. The learning curves of the standard ViT and ViT-Patch models are compared, to validate the improvement of the proposed architecture for model training. In addition, the differences between the deep token features learned by the standard ViT and the ViT-Patch models are analyzed to show the optimization of the proposed architecture for self-attention-based feature learning.
Malignant identification: The primary task (malignant identification) is evaluated using Accuracy (ACC) and Sensitivity (SEN),
A C C = T P + T N T P + T N + F N + F P
S E N = T P T P + F N
where T P indicates the number of True Positive samples, F P indicates False Positive, F N indicates False Negative, and T N indicates True Negative.
Table 2 gives the ACC and SEN evaluation of the involved models for the primary task. The top two results (bolded in the table) are all from the ViT-Patch architecture. Compared to the standard ViT counterparts, the ViT-Patch models have advantages at all patch sizes, suggesting that adding a suitable secondary task to the patch tokens can improve the classification performance on the class token. The performance of the ViT-based models decrease significantly for larger patch sizes ( S = 64 , 128 ), which is lower than that of the CNN-based baselines. The reason for the drop may be that the patch embedding leads to significant feature loss when the patch size is large, and it is difficult for the self-attention mechanism to take advantage of long-range feature extraction, based on the barren embedded vectors. In terms of SEN alone, the ViT-based models have some advantages over the CNN-based models. In Table 2, the ACCs of the ViT-based models with large patch are lower than those of the CNN-based models, but their SEN still remains comparable.
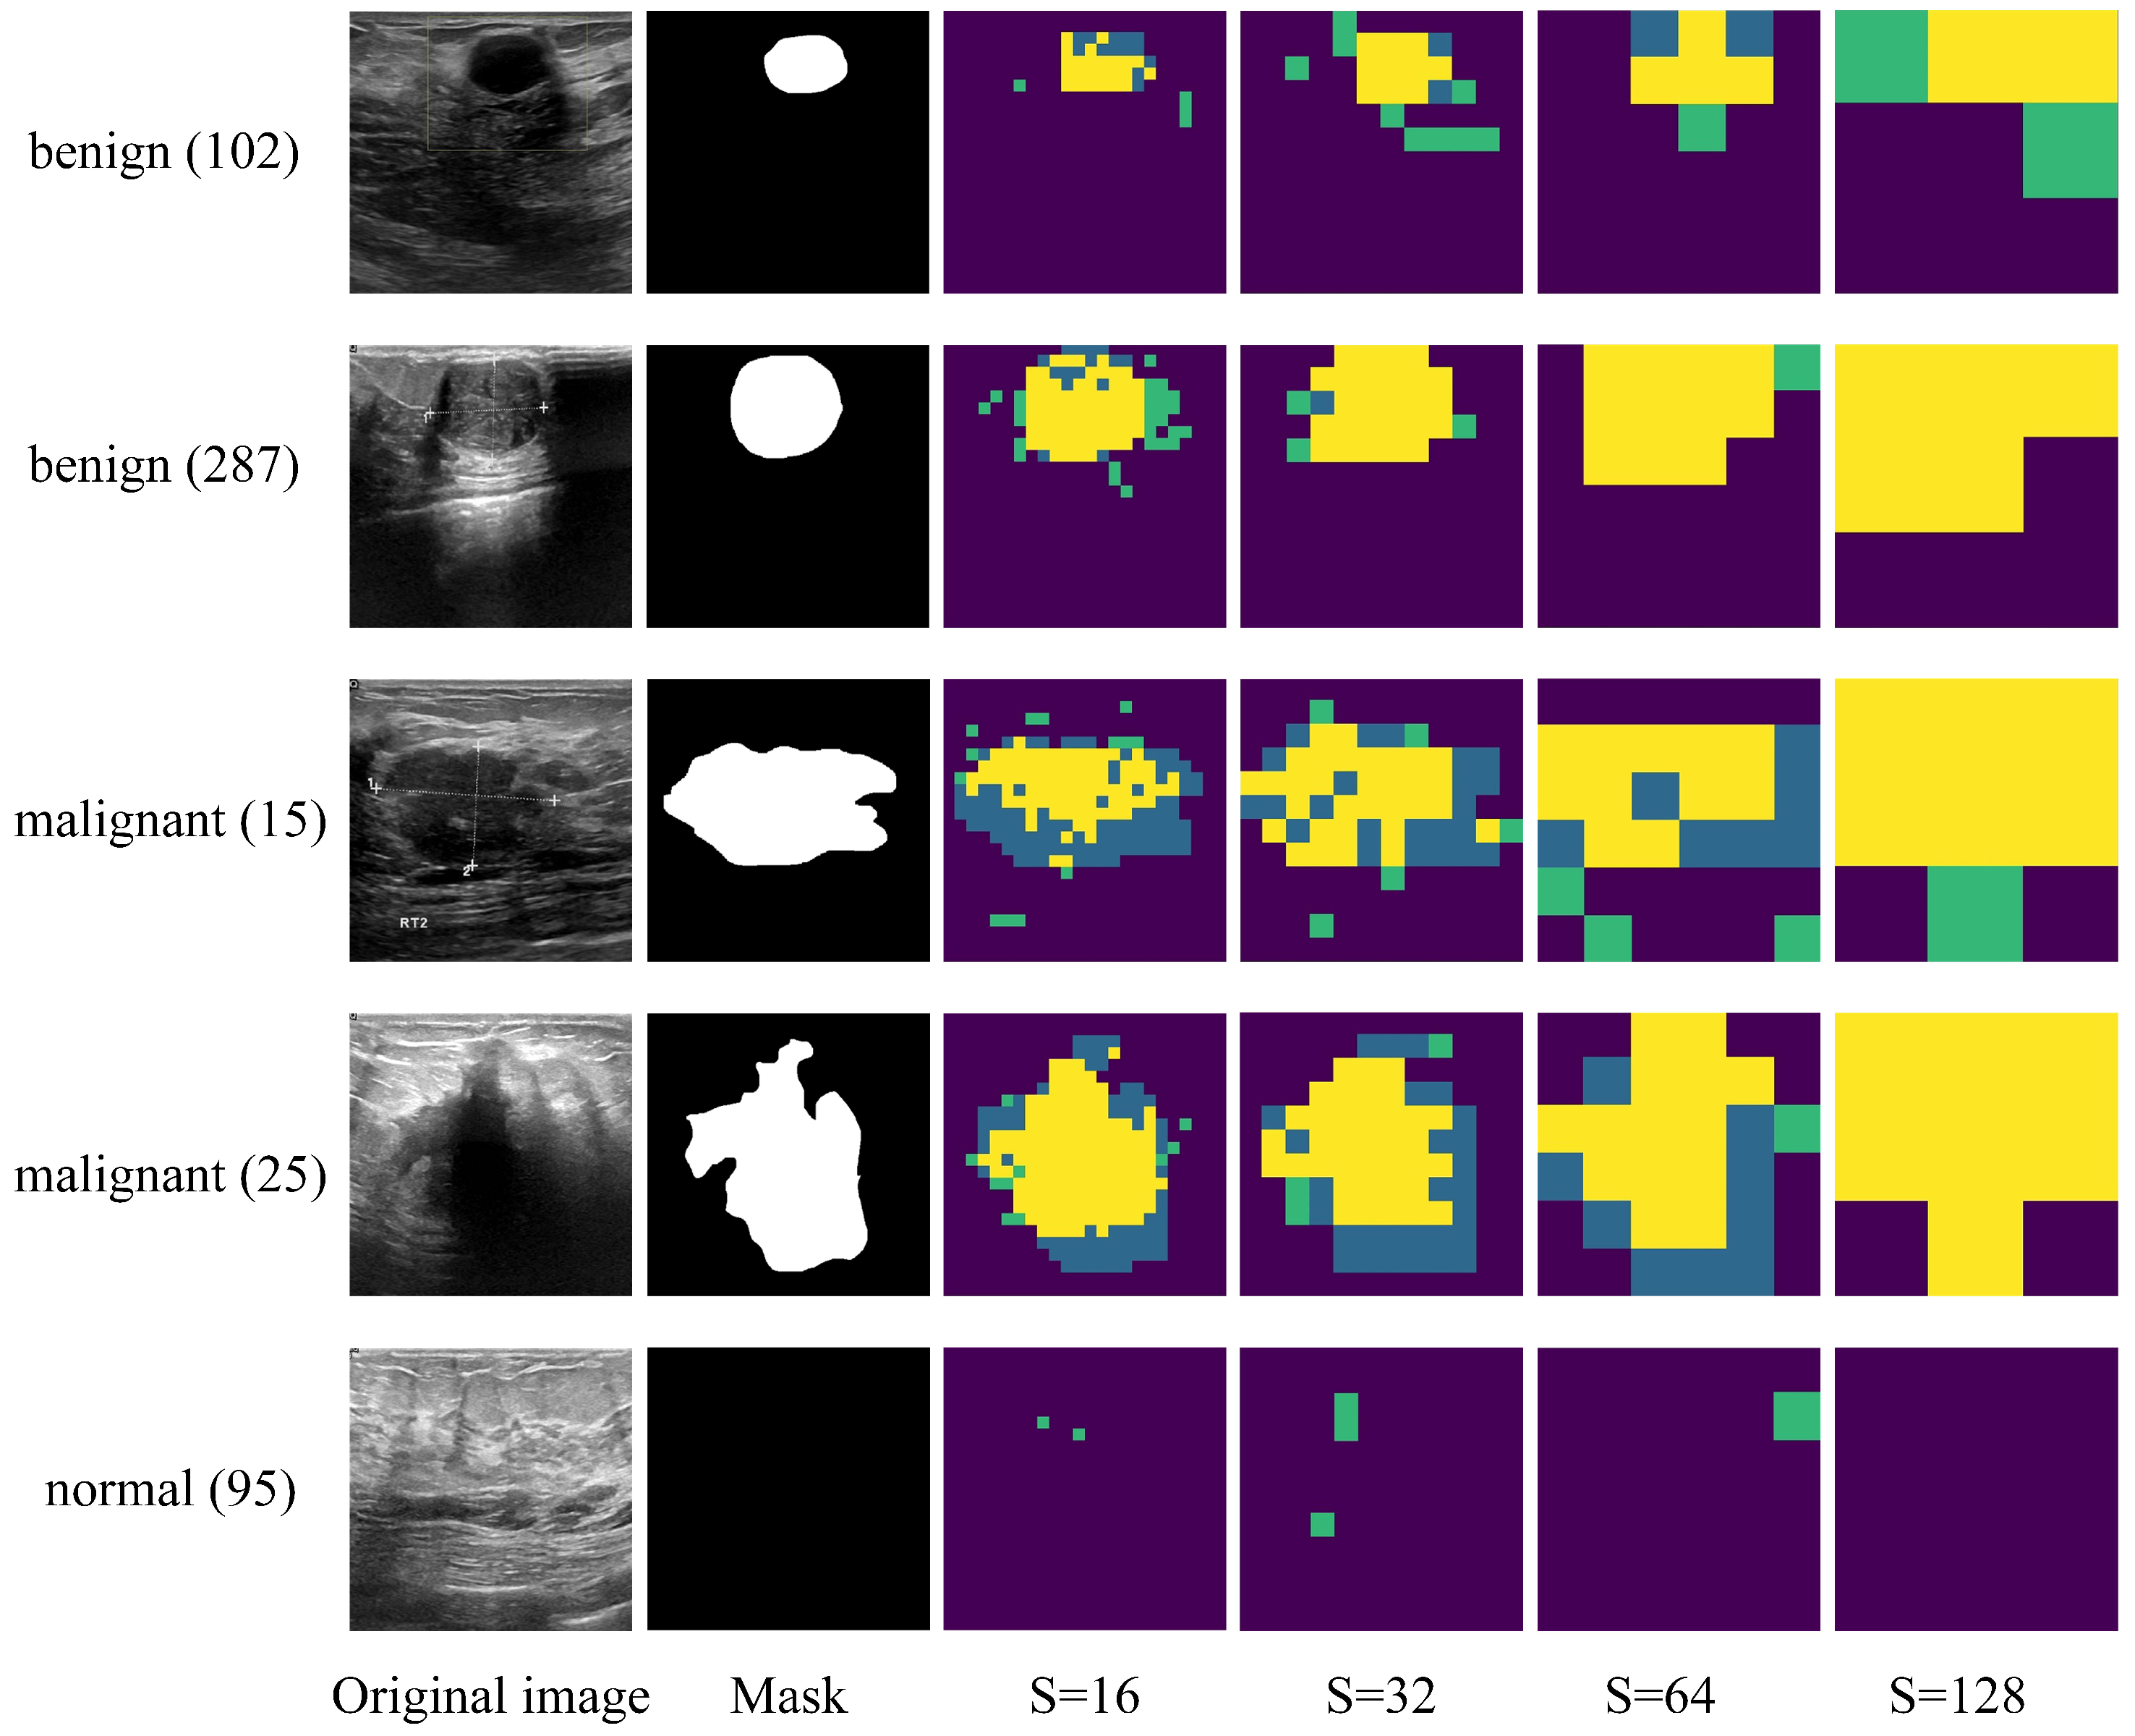
Lesion localization using ViT-Patch: We also evaluated the tumor localization ability of the ViT-Patch, i.e., the performance for the secondary task, which is a free gift provided by the proposed architecture. Figure 5 shows the localization results of several testing images predicted by the ViT-Patch models of various patch sizes. In the predicted mosaic maps (from the third to the last columns), the yellow blocks denote TP, the green blocks denote FP, the blue blocks denote FN, and the purple blocks denote TN. By comparing the predicated mosaics with the labeled segmentation masks (the second column in the figure), it can be seen that the ViT-Patches with different patch sizes can provide relatively reliable patch-based tumor localization, which can be used for subsequent segmentation tasks, e.g., optimizing the RPN or ROI modules of the Faster-RCNN model [33].
The DICE coefficient is used to quantitatively evaluate the secondary task,
D I C E = 2 T P F P + 2 T P + F N
Table 3 shows the DICE results for the ViT-Patch with different patch sizes. In contrast to the performance on the primary task, the ViT-Patch with the largest patch size ( S = 128 ) has the best DICE. The overall trend is that models with small patch sizes have a large deviation between the predicted mosaic maps and the ground truth. However, it must be noted that small patches imply higher spatial resolution. The difficulty of the second task itself increases dramatically as the patches size decreases.

3.4. Learned Features for ViT vs. ViT-Patch

We compare the ViT and ViT-Patch in terms of model training and feature learning. For both architectures, the patch size is set to S = 32 , the size that performs best on the primary task (see Table 1).
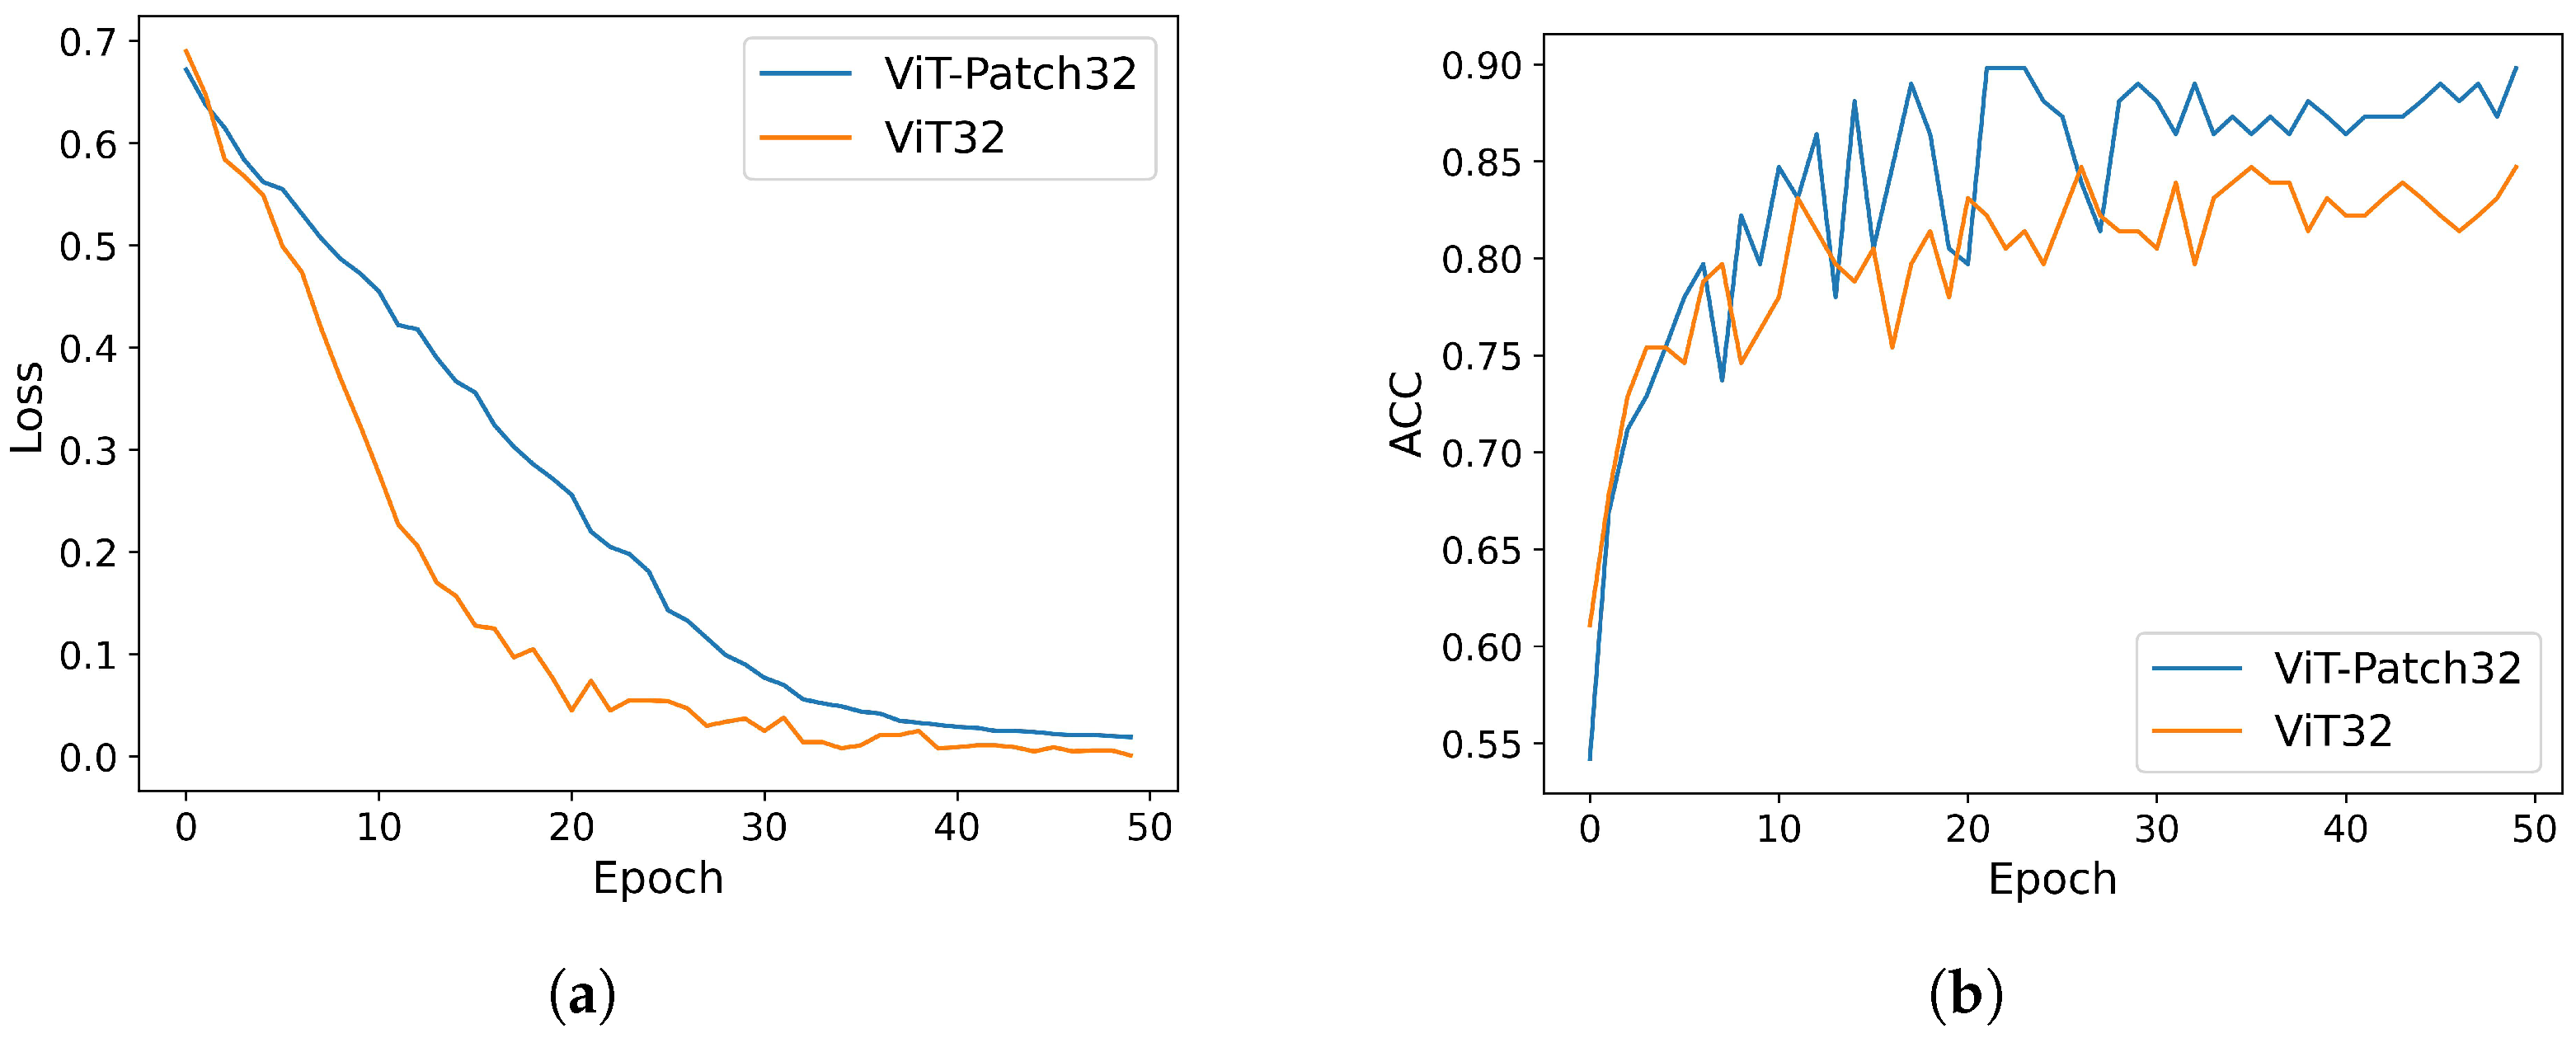
Figure 6 compares the loss-epoch learning curves and ACC (on the test set)-epoch curves of the standard ViT and ViT-Patch for the primary task. Although the Vit-Patch is trained with the joint loss in (4), for comparison, the learning curve is calculated only for l c l a s s , the primary-task loss component on the class token. As shown in Figure 6a, the loss curve of the standard ViT decreases faster than that of the ViT-Patch as the number of epochs increases, and its converged loss on the training set is lower than that of the ViT-Patch. However, the ViT-Patch outperforms the standard ViT on the test set at almost all training epochs (see Figure 6b). The contrast on the training and test sets suggests that the standard ViT is prone to overfitting on small training sets under a single class-token supervision, and the proposed ViT-Patch can improve on the generalization of the model by introducing additional patch-token supervision.
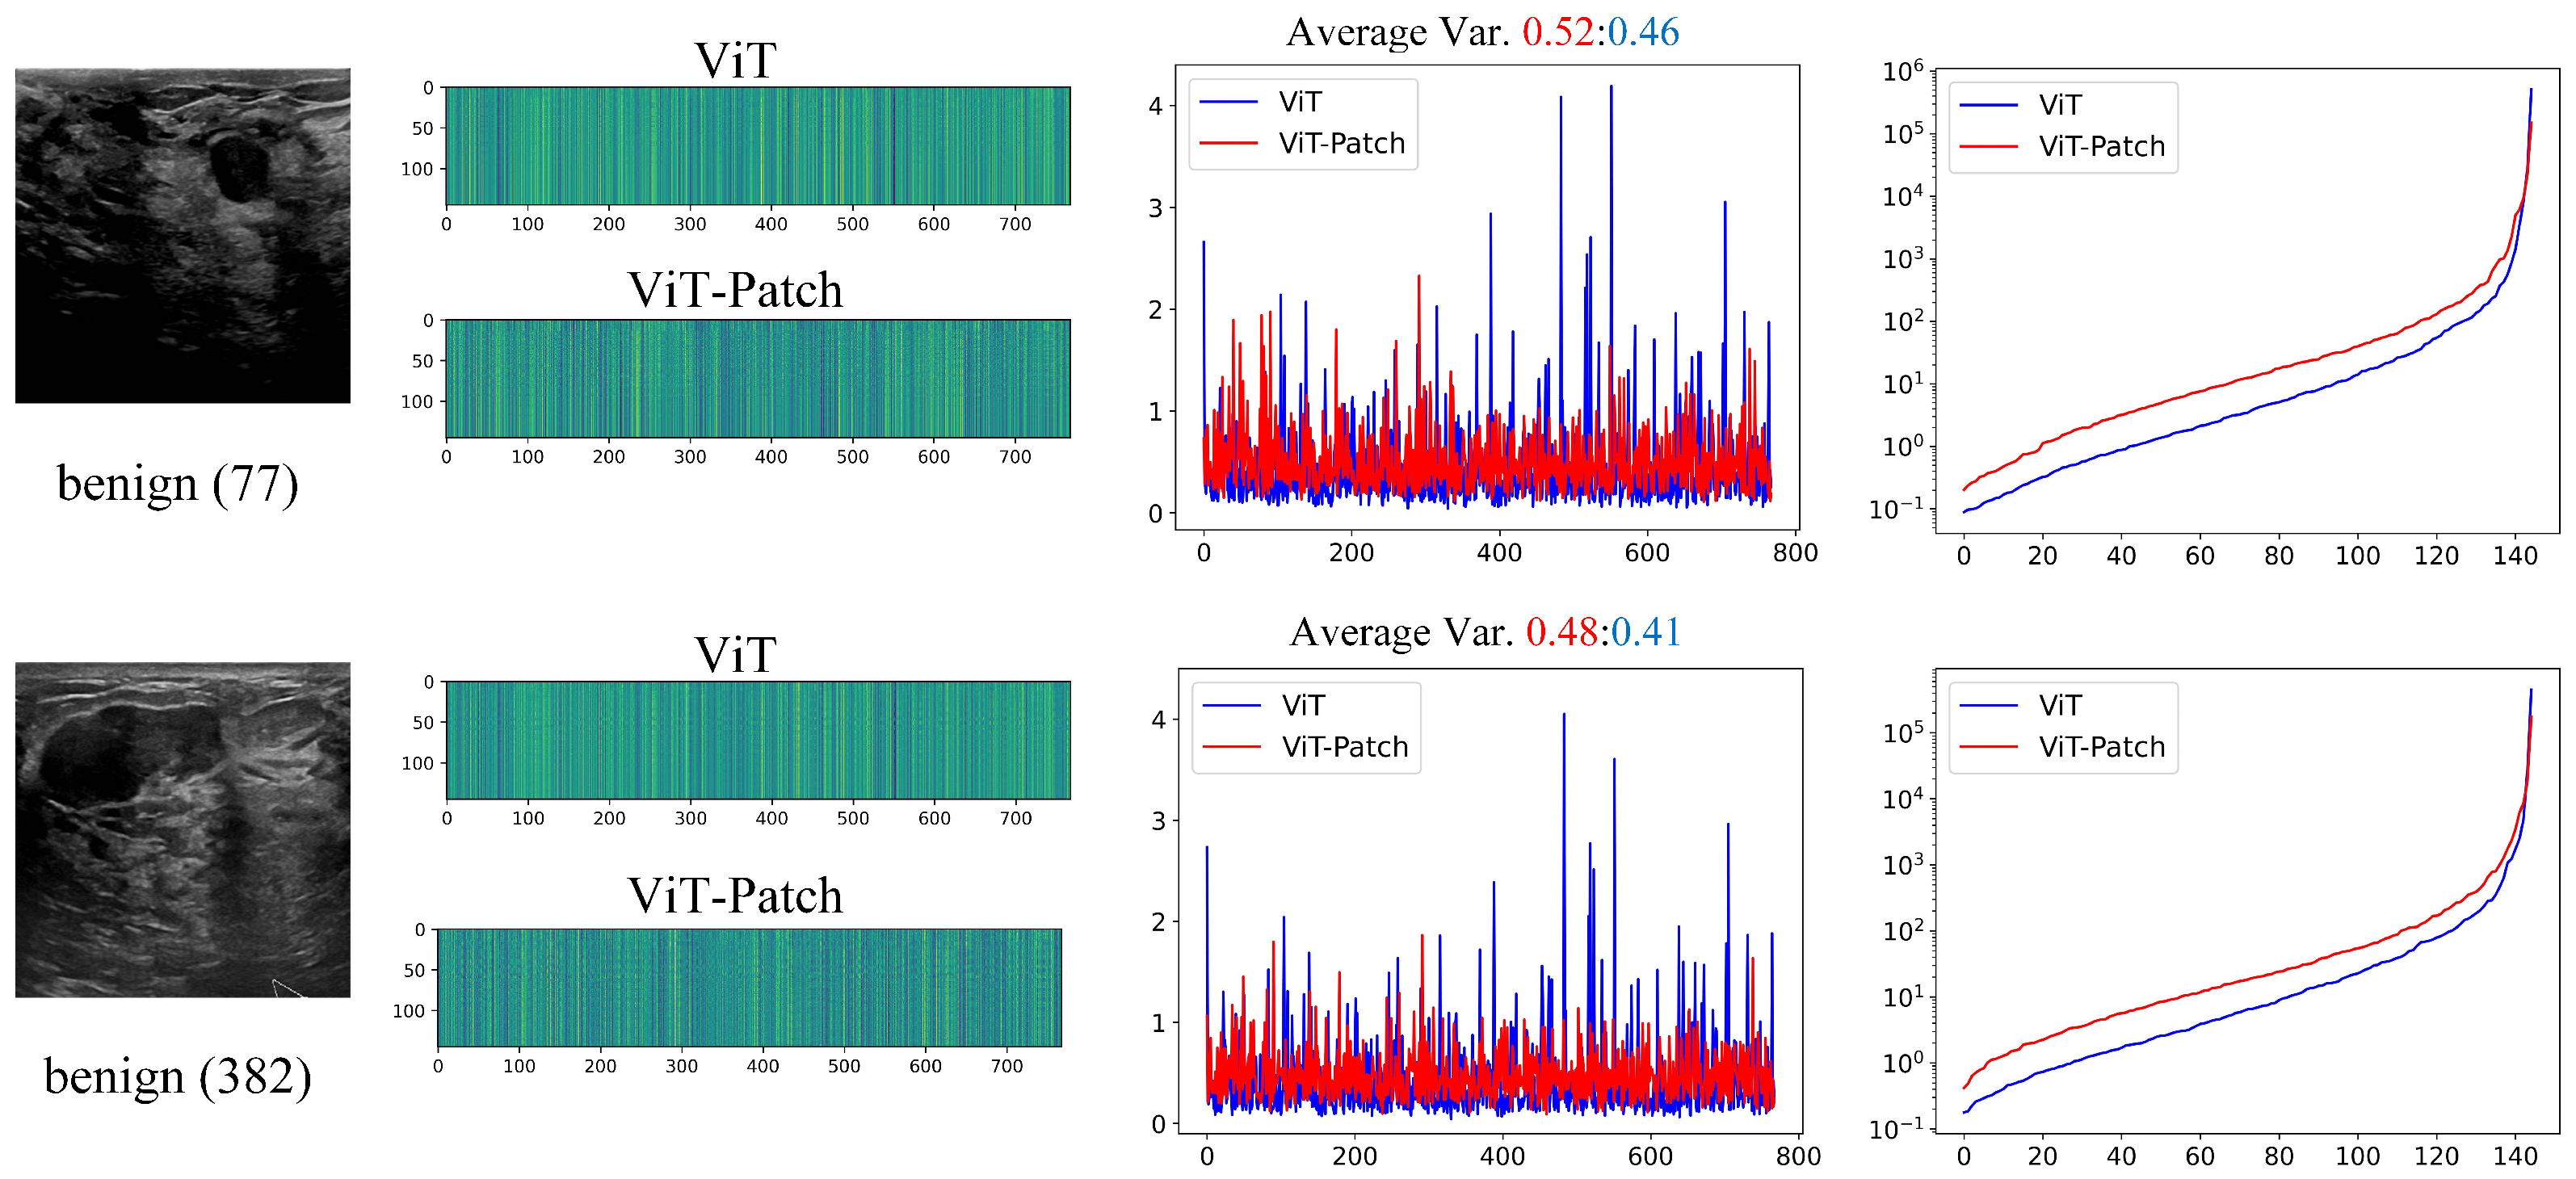
To further show the improvement of the ViT-Patch on feature learning, we visualized the token vectors learned by the standard ViT and ViT-Patch. The patch size is still set to be 32, which means that each level of transformer encoder has 145 token vectors (1 class token and 144 patch tokens) that can be visualized as a 145 × 768 token map. Column 2 of Figure 7 compares the token maps of the penultimate transformer block of the ViT and ViT-Patch, where the penultimate block is chosen because the patch tokens of the last block of the standard ViT are not included in the backpropagation loop. As shown in the figure, the row vectors in the ViT’s token map are very similar, indicating that the multi-headed attention mechanism in the single-task mode based on the class token leads to homogenization across patch tokens and significant redundancy in the learned deeper features. In contrast, by introducing a patch-based second task, the ViT-Patch can avoid the homogenization of patch tokens.
To quantitatively evaluate the similarity between tokens, the variances of 145 tokens on each feature channel is calculated (see the variances–channel curves with the average variances over 768 channels in the third column of Figure 7). Consistent with the visual evaluation of the token maps, the variances obtained by the ViT-Patch are significantly larger than those obtained by the ViT. Further, we computed the eigenvalues of the token maps (matrices), which are arranged from smallest to largest in the last column of Figure 7, and it can be seen that the eigenvalue distribution of the ViT-Patch is better than that of the ViT, which is very concentrated, indicating a clear linear correlation between its learned feature vectors.

4. Conclusions

This paper has proposed an improved ViT architecture, ViT-Patch, which introduces a secondary task on the patch tokens, in addition to the primary task on the class token. The standard ViT used for breast ultrasound image classification only constructs one MLP head on the class token for supervised training, while a larger number of patch tokens are in suspense. This unbalanced architecture tends to lead to an overfitting of the ViT models on small training datasets. The ViT-Patch constructs an MLP head for each patch token (with shared weights across patches), and introduces supervised information on whether each patch overlaps with the tumor areas as a secondary task. The improved architecture not only gives the model the ability to localize tumors based on patches, but also improves on the performance of the primary task (i.e., malignant identification) on the class token, because more task-related supervised information is provided. The ViT-Patch is validated on the public breast ultrasound image dataset. The experimental results show that in the malignant identification task, the ViT-Patch performs significantly better than the standard ViT at all patch sizes, and the ViT-Patch models of small patch sizes also outperform the CNN-based baseline models. Besides malignant identification, the ViT-Patch can provide patch-based mosaic maps for tumor localization. In the experimental part, we also compared and analyzed the learning curves and the learned token maps of the ViT and ViT-Patch, which demonstrate that the ViT-Patch architecture can improve the generalization of the ViT model and optimize the feature learning at deep levels.

Author Contributions

Conceptualization, H.F. and B.Y.; methodology, H.F. and B.Y.; software, W.Z. and B.Y.; validation, H.F., B.Y. and J.W.; resources, Z.Y.; data curation, C.L. and L.Y.; original draft preparation, J.W.; review and editing, B.Y., H.F. and W.Z.; visualization, B.Y. and M.L.; funding acquisition, B.Y. and W.Z. All authors have read and agreed to the published version of the manuscript.

Funding

This work was supported by the Sichuan Science and Technology Support Program (2021YFQ0003).

Institutional Review Board Statement

Not applicable.

Informed Consent Statement

Not applicable.

Data Availability Statement

The training Ultrasound Dataset, generated by Al-Dhabyani, can be downloaded from https://doi.org/10.1016/j.dib.2019.104863 (accessed on 1 July 2022). The code presented in this study are available on request from the corresponding author.

Conflicts of Interest

The authors declare no conflict of interest.

References

  1. Zheng, W.; Yang, B.; Xiao, Y.; Tian, J.; Liu, S.; Yin, L. Low-Dose CT Image Post-Processing Based on Learn-Type Sparse Transform. Sensors 2022, 22, 2883. [Google Scholar] [CrossRef] [PubMed]
  2. Nikolaev, A.V.; de Jong, L.; Weijers, G.; Groenhuis, V.; Mann, R.M.; Siepel, F.J.; Maris, B.M.; Stramigioli, S.; Hansen, H.H.G.; de Korte, C.L. Quantitative Evaluation of an Automated Cone-Based Breast Ultrasound Scanner for MRI–3D US Image Fusion. IEEE Trans. Med. Imaging 2021, 40, 1229–1239. [Google Scholar] [CrossRef] [PubMed]
  3. Xu, S.; Yang, B.; Xu, C.; Tian, J.; Liu, Y.; Yin, L.; Liu, S.; Zheng, W.; Liu, C. Sparse Angle CBCT Reconstruction Based on Guided Image Filtering. Front. Oncol. 2022, 12, 832037. [Google Scholar] [CrossRef]
  4. Brosch, T.; Tam, R. Manifold Learning of Brain MRIs by Deep Learning. In Proceedings of the Medical Image Computing and Computer-Assisted Intervention (MICCAI), Nagoya, Japan, 22–26 September 2013. [Google Scholar]
  5. Plis, S.M.; Hjelm, D.R.; Salakhutdinov, R.; Calhoun, V.D. Deep learning for neuroimaging: A validation study. arXiv 2013, arXiv:1312.5847. [Google Scholar] [CrossRef] [Green Version]
  6. Cao, Z.; Duan, L.; Yang, G.; Yue, T.; Chen, Q.; Fu, H.; Xu, Y. Breast Tumor Detection in Ultrasound Images Using Deep Learning. In Proceedings of the Patch-Based Techniques in Medical Imaging; Wu, G., Munsell, B.C., Zhan, Y., Bai, W., Sanroma, G., Coupé, P., Eds.; Springer International Publishing: Cham, Switzerland, 2017; pp. 121–128. [Google Scholar] [CrossRef]
  7. Hatamizadeh, A.; Tang, Y.; Nath, V.; Yang, D.; Myronenko, A.; Landman, B.; Roth, H.R.; Xu, D. UNETR: Transformers for 3D Medical Image Segmentation. In Proceedings of the 2022 IEEE/CVF Winter Conference on Applications of Computer Vision (WACV), Waikoloa, HI, USA, 4–8 January 2022; pp. 1748–1758. [Google Scholar] [CrossRef]
  8. Vaswani, A.; Shazeer, N.; Parmar, N.; Uszkoreit, J.; Jones, L.; Gomez, A.N.; Kaiser, L.; Polosukhin, I. Attention Is All You Need. arXiv 2017, arXiv:1706.03762. [Google Scholar]
  9. Dosovitskiy, A.; Beyer, L.; Kolesnikov, A.; Weissenborn, D.; Zhai, X.; Unterthiner, T.; Dehghani, M.; Minderer, M.; Heigold, G.; Gelly, S.; et al. An Image is Worth 16 × 16 Words: Transformers for Image Recognition at Scale. arXiv 2020, arXiv:2010.11929. [Google Scholar]
  10. Touvron, H.; Cord, M.; Douze, M.; Massa, F.; Sablayrolles, A.; J’egou, H. Training data-efficient image transformers & distillation through attention. In Proceedings of the International Conference on Machine Learning, Virtual, 13–18 July 2020. [Google Scholar]
  11. Wang, W.; Xie, E.; Li, X.; Fan, D.P.; Song, K.; Liang, D.; Lu, T.; Luo, P.; Shao, L. Pyramid Vision Transformer: A Versatile Backbone for Dense Prediction without Convolutions. arXiv 2021, arXiv:2102.12122. [Google Scholar]
  12. Song, L.; Liu, G.; Ma, M. TD-Net:unsupervised medical image registration network based on Transformer and CNN. Appl. Intell. 2022, 52, 18201–18209. [Google Scholar] [CrossRef]
  13. Wu, Y.; Qi, S.; Sun, Y.; Xia, S.; Yao, Y.; Qian, W. A vision transformer for emphysema classification using CT images. Phys. Med. Biol. 2021, 66, 245016. [Google Scholar] [CrossRef]
  14. Gao, X.; Qian, Y.; Gao, A. COVID-VIT: Classification of COVID-19 from CT chest images based on vision transformer models. arXiv 2021, arXiv:2107.01682. [Google Scholar]
  15. Gao, Y.; Zhou, M.; Metaxas, D. UTNet: A Hybrid Transformer Architecture for Medical Image Segmentation. arXiv 2021, arXiv:2107.00781. [Google Scholar]
  16. Peiris, H.; Hayat, M.; Chen, Z.; Egan, G.; Harandi, M. A Robust Volumetric Transformer for Accurate 3D Tumor Segmentation. arXiv 2021, arXiv:2111.13300. [Google Scholar]
  17. Yan, X.; Tang, H.; Sun, S.; Ma, H.; Kong, D.; Xie, X. AFTer-UNet: Axial Fusion Transformer UNet for Medical Image Segmentation. arXiv 2021, arXiv:2110.10403. [Google Scholar]
  18. Gheflati, B.; Rivaz, H. Vision Transformer for Classification of Breast Ultrasound Images. arXiv 2021, arXiv:2110.14731. [Google Scholar]
  19. Shamshad, F.; Khan, S.; Waqas Zamir, S.; Haris Khan, M.; Hayat, M.; Shahbaz Khan, F.; Fu, H. Transformers in Medical Imaging: A Survey. arXiv 2022, arXiv:2201.09873. [Google Scholar]
  20. Tu, Z.; Talebi, H.; Zhang, H.; Yang, F.; Milanfar, P.; Bovik, A.; Li, Y. MaxViT: Multi-Axis Vision Transformer. arXiv 2022, arXiv:2204.01697. [Google Scholar]
  21. Yi, Y.; Zhao, H.; Hu, Z.; Peng, J. A local–global transformer for distributed monitoring of multi-unit nonlinear processes. J. Process Control 2023, 122, 13–26. [Google Scholar] [CrossRef]
  22. Yuan, L.; Chen, Y.; Wang, T.; Yu, W.; Shi, Y.; Jiang, Z.; Tay, F.E.; Feng, J.; Yan, S. Tokens-to-Token ViT: Training Vision Transformers from Scratch on ImageNet. arXiv 2021, arXiv:2101.11986. [Google Scholar]
  23. Liu, Z.; Lin, Y.; Cao, Y.; Hu, H.; Wei, Y.; Zhang, Z.; Lin, S.; Guo, B. Swin Transformer: Hierarchical Vision Transformer using Shifted Windows. arXiv 2021, arXiv:2103.14030. [Google Scholar]
  24. Devlin, J.; Chang, M.W.; Lee, K.; Toutanova, K. BERT: Pre-training of Deep Bidirectional Transformers for Language Understanding. arXiv 2018, arXiv:1810.04805. [Google Scholar]
  25. Wang, Q.; Li, B.; Xiao, T.; Zhu, J.; Li, C.; Wong, D.F.; Chao, L.S. Learning Deep Transformer Models for Machine Translation. arXiv 2019, arXiv:1906.01787. [Google Scholar]
  26. Baevski, A.; Auli, M. Adaptive Input Representations for Neural Language Modeling. arXiv 2018, arXiv:1809.10853. [Google Scholar]
  27. Al-Dhabyani, W.; Gomaa, M.; Khaled, H.; Fahmy, A. Dataset of breast ultrasound images. Data Brief 2020, 28, 104863. [Google Scholar] [CrossRef] [PubMed]
  28. Kingma, D.P.; Ba, J. Adam: A Method for Stochastic Optimization. arXiv 2014, arXiv:1412.6980. [Google Scholar]
  29. He, K.; Zhang, X.; Ren, S.; Sun, J. Deep Residual Learning for Image Recognition. In Proceedings of the 2016 IEEE Conference on Computer Vision and Pattern Recognition (CVPR), Las Vegas, NV, USA, 27–30 June 2016; pp. 770–778. [Google Scholar] [CrossRef] [Green Version]
  30. Szegedy, C.; Vanhoucke, V.; Ioffe, S.; Shlens, J.; Wojna, Z. Rethinking the Inception Architecture for Computer Vision. arXiv 2015, arXiv:1512.00567. [Google Scholar]
  31. Liu, S.; Deng, W. Very deep convolutional neural network based image classification using small training sample size. In Proceedings of the 2015 3rd IAPR Asian Conference on Pattern Recognition (ACPR), Kuala Lumpur, Malaysia, 3–6 November 2015; pp. 730–734. [Google Scholar] [CrossRef]
  32. Han, K.; Xiao, A.; Wu, E.; Guo, J.; Xu, C.; Wang, Y. Transformer in Transformer. arXiv 2021, arXiv:2103.00112. [Google Scholar]
  33. Ren, S.; He, K.; Girshick, R.; Sun, J. Faster R-CNN: Towards Real-Time Object Detection with Region Proposal Networks. arXiv 2015, arXiv:1506.01497. [Google Scholar] [CrossRef] [PubMed] [Green Version]
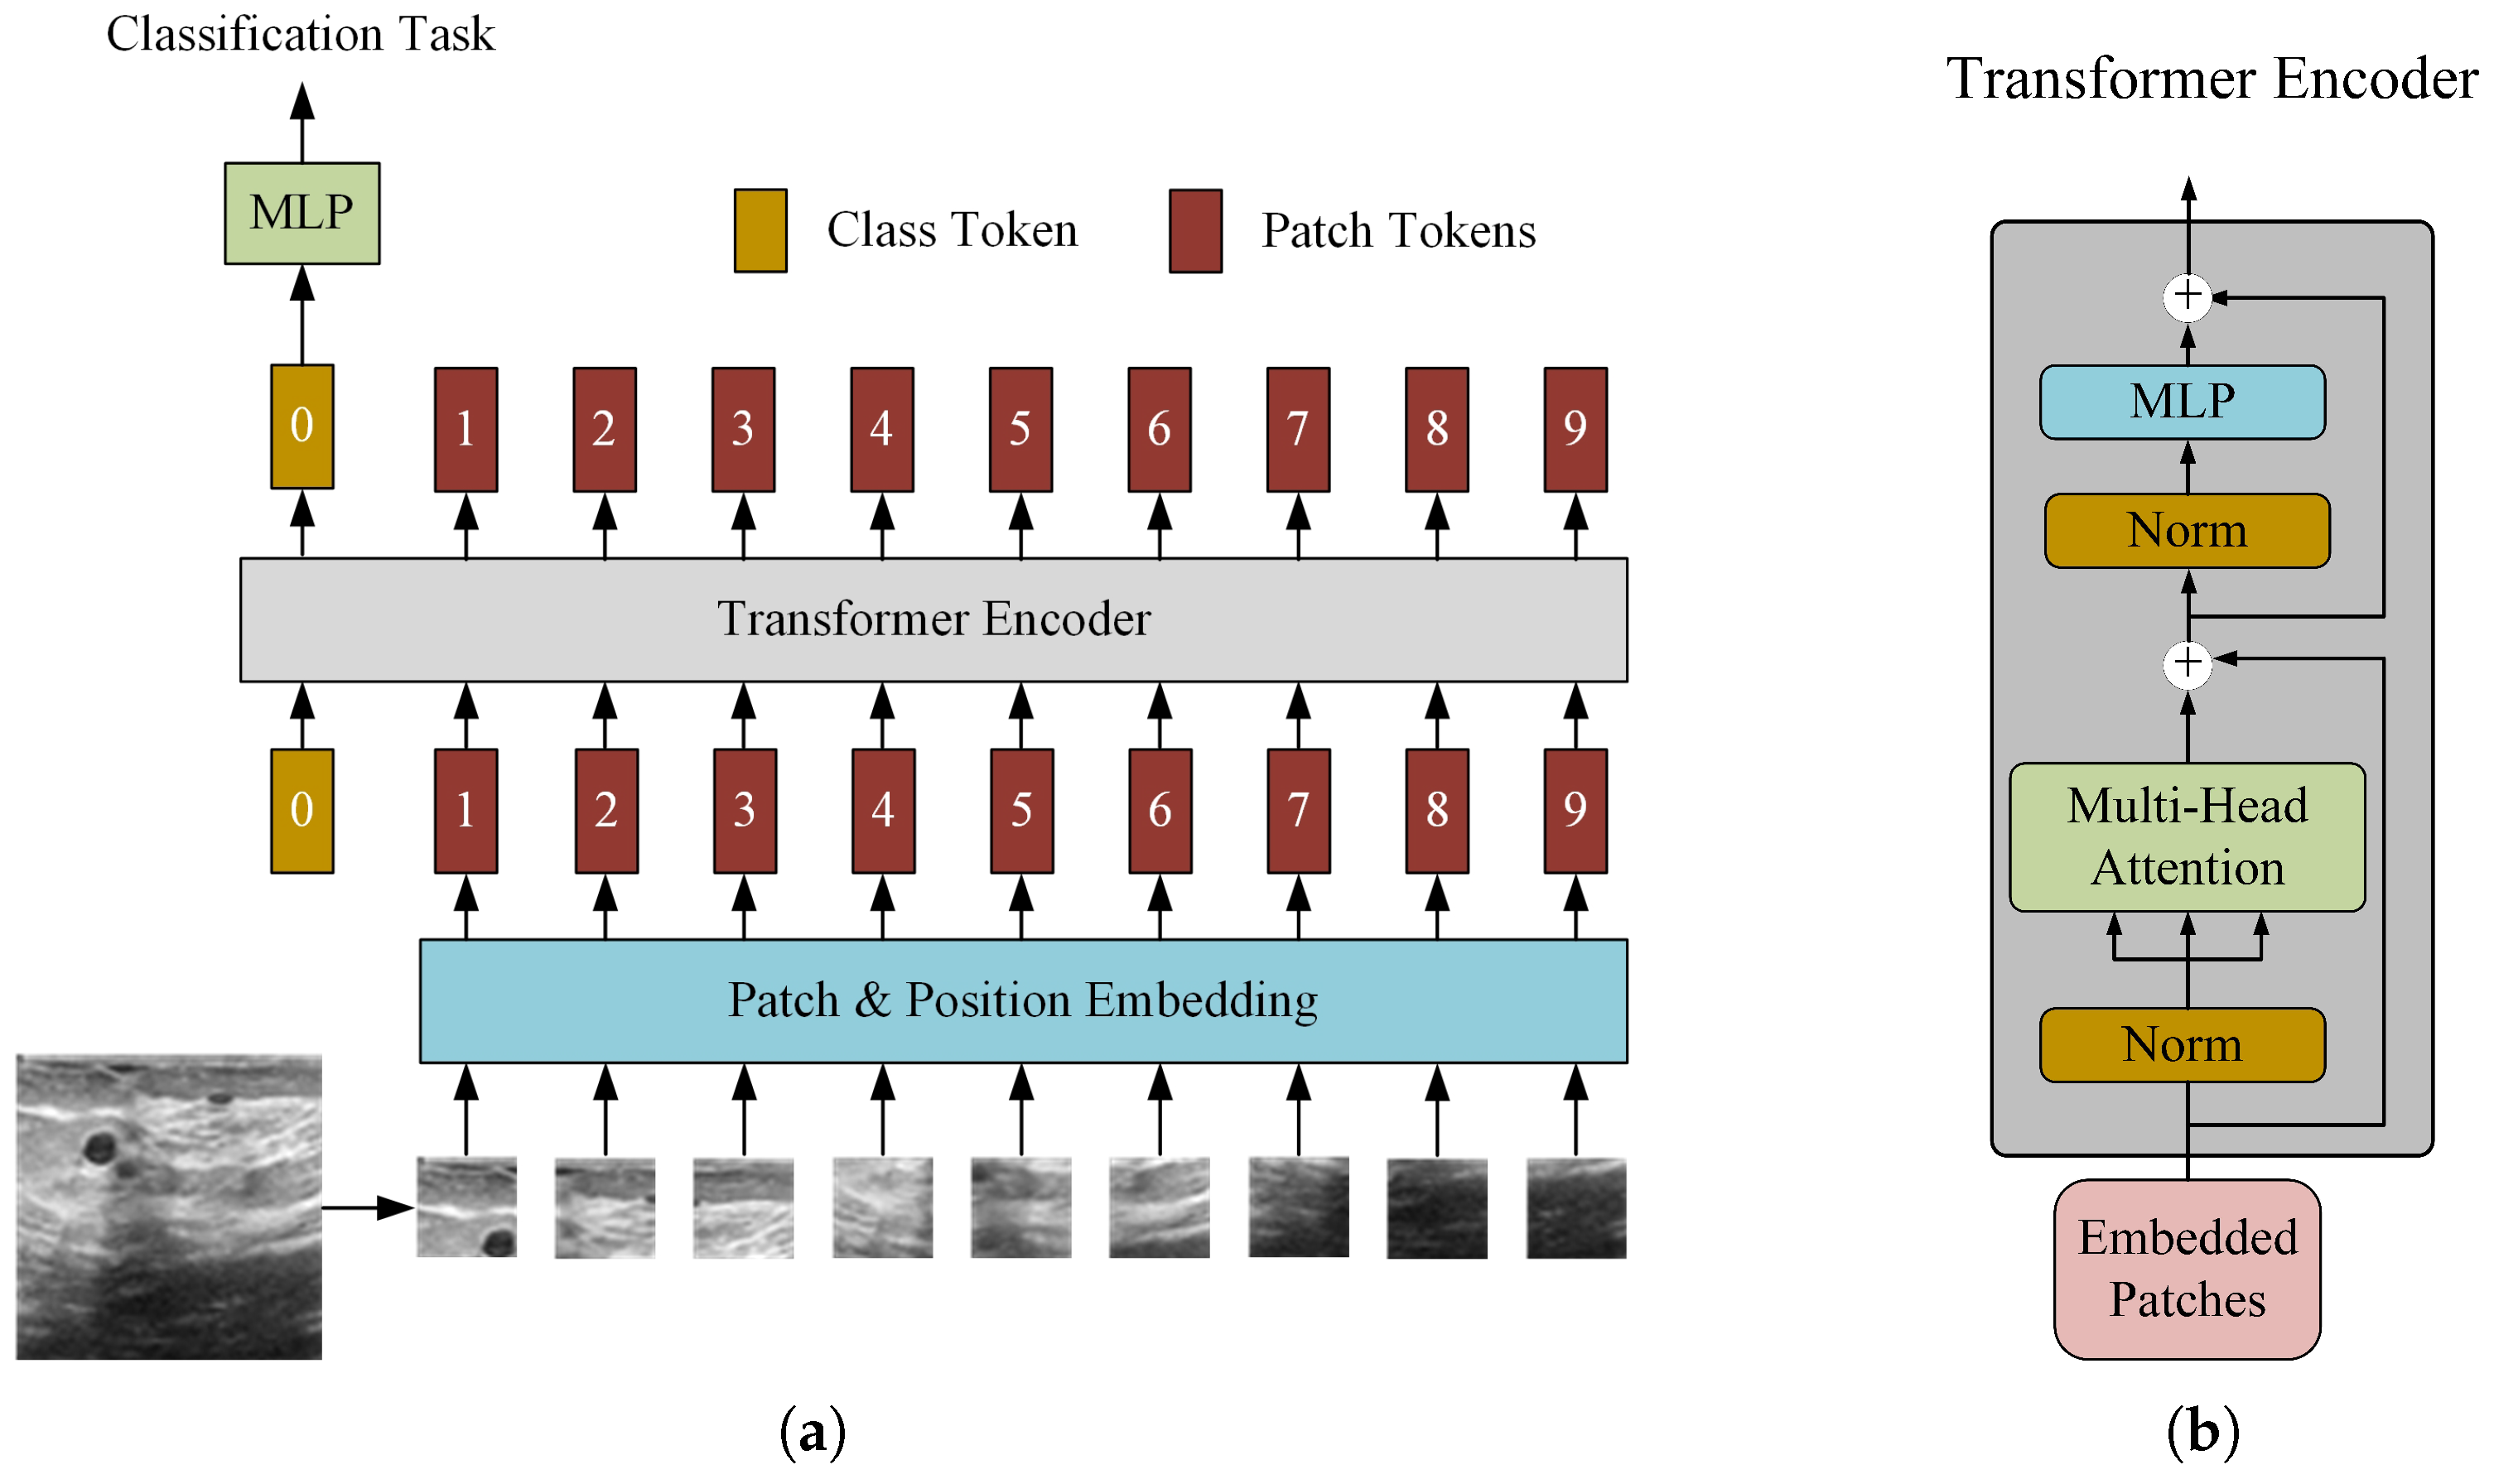
Figure 1. Standard ViT architecture (with N = 9 patches as an example). (a) Data Flow of ViT. (b) Transformer Encoder Block.
Applsci 13 03489 g001
Figure 2. Tokens of Last Attention layer.
Applsci 13 03489 g002
Figure 3. The proposed ViT-Patch architecture.
Applsci 13 03489 g003
Figure 4. Breast ultrasound image images and their masks.
Applsci 13 03489 g004
Figure 5. Lesion localization using ViT-Patch models. Each row corresponds to one sample, and the columns from left to right are: original images, labeled mask maps, and mosaic maps predicted by ViT-Patch with patch size S = 16, 32, 64, and 128, respectively.
Applsci 13 03489 g005
Figure 6. Learning curves and ACC curves for ViT vs. ViT-Patch (32). (a) Learning curves. (b) ACC (on test set) curves.
Applsci 13 03489 g006
Figure 7. Comparison of deep token features learned by ViT and ViT-Patch. Each row corresponds to one sample. The columns from left to right are: original image, token maps, variance–channel curves, and eigenvalue curves.
Applsci 13 03489 g007
Table 1. Morphological characteristics of breast ultrasound images.
CharacteristicsBenignMalignant
ShapeRegularIrregular
MarginsSmoothirregular
Table 2. Quantitative evaluation and comparison for the main task.
ModelACC (%)SEN (%)Params
ResNet50 [29]83.148.5-
InceptionV3 [30]86.454.5-
VGG16 [31]88.166.7-
Swin-B [23]86.460.688 M
TNT-B [32]83.163.665.6 M
T2T-ViT-24 [22]84.751.564.1 M
PVT-Large [11]85.660.661.4 M
ViT/ViT-Patch (16)85.6/89.066.7/69.788.46 M/90.82 M
ViT/ViT-Patch (32)84.7/89.860.6/72.789.89 M/92.26 M
ViT/ViT-Patch (64)80.5/85.657.6/54.596.89 M/99.25 M
ViT/ViT-Patch (128)79.7/78.854.5/54.5125.18 M/127.54 M
Table 3. Quantitative evaluation for the secondary task of ViT-Patch models.
ModelDICE (%)
ViT-Patch (16)62.0
ViT-Patch (32)61.5
ViT-Patch (64)63.1
ViT-Patch (128)68.7
Disclaimer/Publisher’s Note: The statements, opinions and data contained in all publications are solely those of the individual author(s) and contributor(s) and not of MDPI and/or the editor(s). MDPI and/or the editor(s) disclaim responsibility for any injury to people or property resulting from any ideas, methods, instructions or products referred to in the content.