Abstract
With the rapid development of shared cars, to reduce the phenomenon of drunk driving in shared cars, we have studied the onboard drunk driving rapid detection electronic nose system suitable for shared cars. To accurately judge whether the driver is drunk while driving in the presence of interfering gases such as passenger exhalation and the volatile smell containing alcohol, this paper proposes a two-step drunk driving detection frame for shared cars that first judges whether someone in the car is drunk and then judges whether the driver is drunk. To reduce the cost and volume of the electronic nose, the sensor array was optimized based on the random forest algorithm. To find the optimal sampling time, we processed the original data by time slicing. Finally, using the two-step framework proposed by us, the accuracy of the first step and the second step of driver drunk driving detection reached 99.44% and 100%, respectively, with a sampling time of 5 s. After algorithm optimization, only 9 of the 21 sensors were left. This paper presents a practical electronic nose system for the detection of drunk driving in shared cars.
1. Introduction
Drunk driving is a great hazard to road traffic safety. According to the World Health Organization, 40% of road traffic accidents are attributed to drivers under the influence of alcohol, which is the fifth leading cause of death on the road [1]. In the first half of 2019 alone, China investigated and dealt with 901,000 cases of driving under the influence (DUI), including 177,000 cases of drunk driving and 1525 traffic accidents caused by DUI, resulting in 1674 deaths [2]. At the same time, with the rising number of car drivers, the shared car industry also welcomes good development opportunities. The emergence and vigorous development of shared cars have brought more choices and convenience to people’s travel, but the regulatory norms have not been improved. In the case of the shared car accident, the imperfection of the identification system repeatedly makes the leasing company the subject of compensation liability for failing to fulfill the obligation of prudent supervision. Therefore, shared car companies have a strong desire to prevent drunk driving [3].
Due to the hazards of drunk driving, it has been listed as an illegal act in all countries. In recent years, countries have taken various forms of preventive measures against drunk driving. The most common is that police officers conduct traffic inspections through handheld breath alcohol detection devices, but this method seriously wastes police resources and will cause traffic congestion in the process of traffic law enforcement. In addition, according to the personal constitution and alcohol consumption, alcohol may still be found in the blood after drinking for 18 h [4], which has potential safety hazards in driving behavior, so drivers also need instruments with accurate judgment results to detect their own state. All in all, it is self-evident that the research and development of an onboard drunk driving detection system are necessary for shared car companies, traffic management departments, and ordinary drivers.
For the onboard drunk driving detection system, we conducted a literature survey. Existing devices at home and abroad that can be applied to onboard drunk driving detection of shared vehicles include an ignition interlock device using fuel cell sensors [5], an image recognition drunk driving detection system based on driver facial feature detection [6], and a driver alcohol safety detection system based on breathing and touch using infrared optical sensors (DADSS) [7]. The alcohol concentration in the breath is an important indicator to judge whether a driver is drunk while driving. However, the traditional onboard ignition interlock device requires the driver to actively blow air, which will cause unnecessary trouble to drivers who have not drunk alcohol. For the onboard alcohol driving detection system based on the alcohol concentration of gas in the cabin, other sources of alcohol gas in the cabin will affect the judgment of alcohol driving. Other sources include drunken breath from passengers and accidentally spilled alcohol. The breath-based detection method in DADSS eliminates the interference of passengers’ exhalation after drinking by placing sensors in multiple positions, but it is powerless to interfere with alcohol-containing volatile gases such as the volatile gases of spilled wine. Tissue-spectrum recognition can eliminate the interference of foreign alcohol gases, but it is possible to be replaced by fellow passengers, which is still under continuous research and development. Using the image to recognize facial features is a good method to detect drunk driving, but the introduction of cameras will cause concerns about privacy issues, and the data must be stored safely [4]. In general, it is still a huge challenge to accurately detect whether the driver is drunk in the cabin environment.
The electronic nose used in the drunk driving detection system designed in this paper is a system that recognizes single or complex components of gas or odor by a specific sensor array combined with the corresponding pattern recognition algorithm [8]. In recent decades, researchers have applied the electronic nose system to many fields, such as food detection, air quality monitoring, wound bacteria detection, disease detection, and fire detection [9,10,11,12,13,14], and achieved good results. For example, in terms of odor detection in confined spaces, the electronic nose has been used in the Mir space station to monitor variations in air quality within the station [15]. In terms of odor interference, an electronic nose based on the BP-ANN model has been successfully utilized to conduct semi-quantitative, real-time, and anti-interference detection of CO and CH4 in contexts of H2 and CH2O interference [16]. Exhaled gas after drinking is a kind of mixed gas, and there is usually interfering gas in the cabin, so the electronic nose is a suitable device for onboard drunk driving detection.
In addition to the consideration of the detection effect, the user’s experience and installation cost should also be taken into account in the design of the onboard alcohol driving detection system for shared vehicles. To avoid the problem that the traditional onboard ignition interlock device needs each driver to blow air for detection and the cost problem caused by the breath-based DADSS needing to install sensors at multiple locations, we propose a two-step drunk driving detection framework based on the electronic nose. The first step is to detect whether there is gas exhaled after drinking in the cabin to determine whether someone in the vehicle has drunk alcohol. Then, when it is determined that someone has drunk alcohol, the second step is to let the driver actively exhale into the electronic nose to judge whether the driver has drunk alcohol. This design reduces the requirements for the driver to a certain extent and ensures the user’s experience. At the same time, the installation position of the sensor is reduced, and the cost is saved.
In addition to proposing the two-step drunk driving detection framework, we also optimized the sensor array. The array composed of multiple sensors is the kernel component of the electronic nose. With the continuous development of material research, various gas-sensing materials are gradually developed, such as graphene [17], carbon nanotubes [18], conductive polymers [19], and metal oxides [20]. Among them, the metal oxide semiconductor (MOS) gas sensor has been widely used in the electronic nose, mainly because the MOS gas sensor has a fast response to the target gas, a long service life, mature production technology, a low price, and so on [21]. A remarkable feature of the array of MOS sensors in the electronic nose is cross-sensitivity, so the redundancy of the sensor array is inevitable. Sensor array optimization can remove redundant information, speed up data processing, and make the electronic nose use less cost and space, which helps the electronic nose drunk driving detection system be widely used in shared cars.
This paper presents a kind of electronic nose system for drunk driving detection based on a MOS sensor array, which can be widely used in shared cars. The detection system applies a two-step alcohol driving detection framework proposed by us, which reduces interference to the driver and ensures the driver’s user experience. The random forest algorithm is used to optimize the original sensor array, which reduces the cost and volume of the system. The optimal sampling time and detection algorithm are selected by time-slicing the data to ensure detection efficiency and accuracy.
In the second part of this paper, we introduce our two-step detection framework in detail. The third part introduces the simulated exhalation device, electronic nose, test procedure, and optimization method of the sensor array. The fourth part describes the experimental outcomes. The last part provides a conclusion summarizing the research conducted in this paper and discusses the existing problems and future research directions.
2. Two-Step Drunk Driving Detection Framework
2.1. Framework Introduction
Considering the driver’s experience, onboard drunk driving detection should avoid interference with the driver as much as possible. Therefore, we designed a new drunk driving detection framework. The framework includes two steps. The first step is to detect whether there is gas exhaled after drinking in the cabin without the driver’s active cooperation. If not, drive normally. Second, when the gas exhaled after drinking is detected in the cabin, let the driver actively blow into the air inlet of the electronic nose to collect information and judge whether the driver is drunk. See Figure 1 for the schematic diagram of the frame.
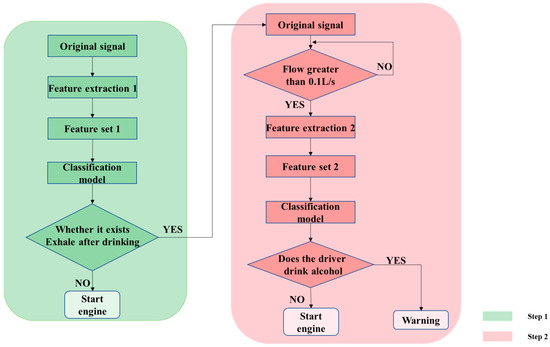
Figure 1.
Schematic diagram of a two-step detection framework for onboard drunk driving of shared vehicles.
2.2. Step 1
In the first step, the purpose of electronic nose detection is to judge whether there is gas exhaled after drinking in the cabin and, therefore, whether someone is drunk. First, collect the original signal from the electronic nose for feature extraction 1 to obtain feature set 1, and then use the trained classification model to judge. If there is no gas exhaled after drinking, start the engine; otherwise, enter the second step.
The classification algorithm was selected from the K-Nearest Neighbor (KNN), Support Vector Machine (SVM), and Random Forest (RF) by comparing the model classification accuracy [22,23,24]. The following is a brief introduction to the KNN, SVM, and RF.
- (1)
- KNN
KNN is a supervised learning algorithm, so it is necessary to provide a training set of data with known tags. When classifying, KNN first calculates the distance between the features of the data to be classified and the features of the known data in the training set and arranges the training set data in ascending order according to the calculated distance. Find the top K training set data and count the frequency of all kinds of tags; the label with the most occurrences is the category of the data to be classified.
- (2)
- SVM
SVM is also a supervised learning algorithm. Its basic idea is to find the hyperplane that can separate two types of sample data with the largest distance on the feature space of the sample data set, and it is mainly used for binary classification problems. SVM can be expressed mathematically as the problem of solving convex quadratic programming. Because many data are, in reality, nonlinear, SVM introduces the kernel function. Common kernel functions include the RBF kernel and the Laplace kernel. This paper used the RBF kernel.
- (3)
- RF
Random forest is a statistical learning theory method based on the decision tree. In addition to expanding the tree into a forest, the random forest algorithm also adds random attributes to the training process of the model. Its randomness is reflected in two aspects. First, for each decision tree in the random forest, its training set data is obtained by randomly extracting N samples from the original training set. Second, when the nodes of the tree need to be split, m features (m is less than the total number of features) are randomly selected from the features contained in each sample of data, and the best features are selected from them to segment the nodes. The addition of randomness improves the ability of the random forest algorithm to resist overfitting and noise. For the classification task, the result of the random forest algorithm adopts the principle that the minority is subordinate to the majority and is determined by the vote of the base classifier.
2.3. Step 2
In the case that the exhaled breath after drinking is detected, the driver still has two possible states: one is not drunk, the exhaled breath after drinking is exhaled by the passenger, and the other is drunk. Further detection is required. In consideration of the numerous interferences that may exist in the cabin, the information is collected by letting the driver actively blow air to improve the judgment accuracy of the detection system. In a practical application, in order to know the timing of starting sampling in the second step, a flowmeter can be set at the blowing port to monitor the instantaneous flow.
When there is gas exhaled after drinking in the cabin, the drunk driver detection system starts to monitor the instantaneous flow of the flowmeter. When the instantaneous flow is greater than 0.1 L/s [25], the system starts to record the data obtained by the sensor array. Then, feature extraction 2 is performed on the obtained data to obtain feature set 2. Finally, the trained classification model is used for judgment. If the driver is not drunk, the engine could be started; otherwise, a warning will be given to the driver.
3. Materials and E-Nose System
3.1. Simulated Expiratory Device
According to the national threshold and inspection standard for blood and expiratory alcohol content of vehicle drivers, the expiratory alcohol content of vehicle drivers is converted into blood alcohol content according to the proportional relationship of 1:2200, that is, the value of expiratory alcohol content multiplied by 2200 equals the value of blood alcohol content. If the blood alcohol content is equal to or exceeds 20 mg/100 mL, it is driving under the influence; if it is equal to or exceeds 80 mg/100 mL, it is drunk driving [26].
The blood alcohol content of people after drinking will vary due to their body shape, age, and gender. Therefore, to reduce the variables in the test and ensure its steadiness and dependability, the test was conducted with artificial mixed gas. The composition of the mixed gas is carbon dioxide 5%/oxygen 16%/ethanol/nitrogen. The concentration of ethanol gas is 0.1 mg/L and 0.5 mg/L (converted into blood alcohol contents of 22 mg/100 mL and 110 mg/mL, respectively) [27]. The mixed gas was provided by JuYang Gas Co., Ltd. To better simulate the real breathing situation of the human body, a simulated exhalation device was assembled and built. The exhalation frequency was 15 times/min, and the respiratory flow was 800 mL [28]. See Figure 2a for details. See Figure 2b for the physical structure of the air outlet.
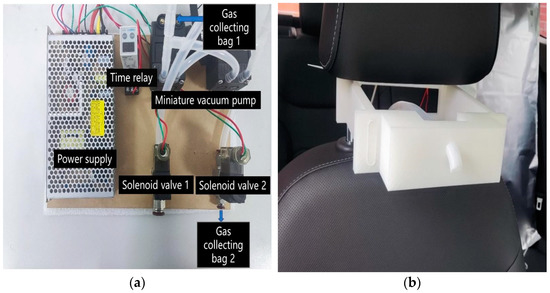
Figure 2.
(a) Picture of simulated exhalation device; (b) Picture of exhalation port structure.
Simulate the working process of the exhalation device: fill the mixed gas into gas collecting bag 1, and the air pump extracts air from gas collecting bag 1; The time relay controls the switching states of solenoid valves 1 and 2. The solenoid valve 1 is connected to the exhalation port structure at the seat, and the solenoid valve 2 is connected to the air collecting bag 2. The device can achieve an intermittent expiratory effect.
3.2. Electronic Nose
The electronic nose system, which was made by our research group, is primarily composed of a hardware unit and a data processing unit. The hardware unit is used to convert scent information into electrical signals and is composed of a micro-vacuum pump, bionic detection chamber [29], sensor array, conditioning circuit, switching power supply, and data acquisition card. The data processing unit is completed by a PC connected to the detection unit. The physical structure of the electronic nose is displayed in Figure 3.
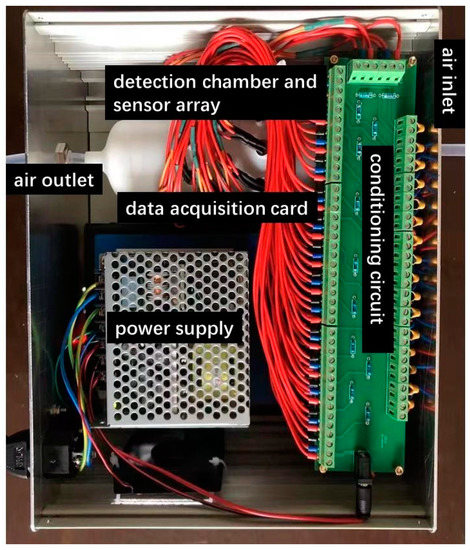
Figure 3.
Internal structure view of a self-made electronic nose system.
In recent years, the field of gas sensors has developed quickly. Considering the stability, cost, and detection of gas composition, 21 commercial MOS sensors were selected as the initial sensor array in this test. Due to their prohibitive cost and bulkiness, electrochemical and optical sensors are not suitable for widespread application in vehicles. Table 1 introduces the relevant information on the 21 MOS sensors in our study. All sensors can detect the concentration of sensitive gases to the ppm level, which is very important to ensure the accuracy of detection.

Table 1.
sensor models, detection gas species, and companies.
The whole system was placed in the cabin. The device uses a lowpass filter circuit to preprocess the response signal from the sensor. At the same time, the computer connected to the electronic nose through a USB interface will record the sensor response data. After the test, the data will undergo further noise reduction and filtering.
3.3. Experiment Procedure
The test has two purposes: one is to verify whether the electronic nose system can accurately detect the exhaled gas after drinking in the cabin, including the interference of volatile gases from liquor and perfume, and the other is to verify whether the system can accurately detect the driver’s drunken driving state when the driver actively blows. According to the above two purposes, the cabin gas detection test and the direct expiratory test were designed, respectively. The test groups are shown in Table 2.
Table 2.
Test groups designed according to the test purpose.
Before conducting the gas detection test in the cabin, we discussed the details of the experiment. According to the results of flow field analysis and the optional positions provided by the automobile manufacturer, the air inlet of the electronic nose was selected to be located at the trim panel of the main driver’s side door [30]. In order to obtain the data when the driver or passenger is drunk, there are three options for the location of the air outlet of the simulated expiratory device: the driver’s seat, the passenger seat, and the driver’s back seat. The laptop and the primary portion of the electronic nose were set down on the driver’s seat. The addition of volatile gas interference from liquor was achieved by pouring 50 mL of liquor on a towel and then placing the towel on the driver’s seat. The addition of perfume volatile gas interference was realized by spraying perfume onto a towel and then placing the towel on the driver’s seat. The electronic nose sensor array was heated beforehand for more than 30 min.
The experiment procedure is as follows:
- (1)
- close the door;
- (2)
- turn on the simulated exhalation device, and the electronic nose starts sampling at the same time; the sampling time is 1 min, and the sampling frequency is 100 Hz;
- (3)
- open the car’s door and introduce clean air to clean the ambient gas in the car and sensor array for 10 min;
- (4)
- for the next experiment, repeat steps (1) to (3).
The test scenario is shown in Figure 4. There were three kinds of gases in the driver’s direct blowing test, namely, the mixed gas with an alcohol content of 0.1 mg/100 mL and 0.5 mg/100 mL and the breath without drinking alcohol. A total of 480 sets of data were acquired in the whole experiment.
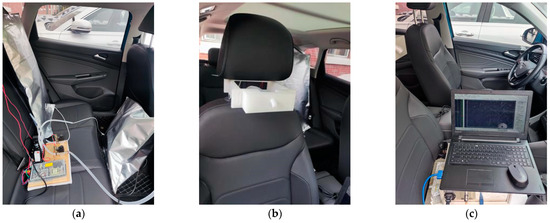
Figure 4.
Pictures of the actual test scene. (a) A photo of the simulated expiratory device placement; (b) A photo of the exhalation port structure placement; (c) A photo of the electronic nose and PC placement.
3.4. Sensor Array Optimization
To obtain as much information as possible about the gas related to drunk driving detection, the initial array was composed of a large number of sensors during the design of the vehicle drunk driving detection electronic nose system. Too many sensors may lead to dimension disaster in the subsequent data processing. And because the sensor has cross-sensitivity, it may lead to sensor redundancy. Therefore, the sensor array should be optimized. Sensor optimization can also effectively reduce costs, reduce the space occupied by the hardware part of the system, and make the drunk driving detection electronic nose more suitable for vehicle use and promotion in shared vehicles.
In this paper, the sensor array optimization was carried out twice, corresponding to the two steps of the detection framework, respectively. Finally, the results of the two sensor optimizations were combined to obtain the final sensor array. There are a lot of different sensor combinations in the basic sensor array, which contains 21 sensors. The exhaustive method is obviously inadequate for finding the ideal sensor array. Thus, the evaluation of the sensors was conducted through Random Forest. The RF was developed by Breiman and is often utilized in the field of pattern recognition [31]. In addition to being an excellent classification algorithm, RF can also use the Gini index to measure the contribution of each feature to classification when it chooses the Gini index as the feature evaluation method for node division [32]. We used the feature importance ranking provided by RF to help optimize the sensor array.
From the original response of each sensor, this paper extracted the maximum value (MAX), integral value (IV), the DC component and 1st–4th order harmonic component coefficients after fast Fourier transform (FFT), and the average value of the similarity coefficient after 12 levels of DB4 wavelet decomposition (WT) [33], including transient characteristics and steady-state characteristics, a total of four different features. See Table 3 for the description of the four characteristic values.
Table 3.
The description of features.
First, we used RF to establish a classification model for the four features, respectively, and obtained the overall sensor importance ranking from the importance rankings of the four features. Then, different numbers of sensors were selected in turn to form subsets of the array, and the classification model of the selected sensor feature set was re-established. Finally, the sensor subset that did not reduce the prediction rate or had little effect on the prediction accuracy was selected as the optimal sensor subset.
4. Experimental Results
4.1. Sensor Array Optimization Results
Four features of Max, IV, FFT, and WT were extracted from the original data of nine situations obtained in the cabin gas detection test. The RF algorithm was used to establish a classification model for whether there is exhaled gas after drinking in the car by using four features. The classification results of the test sets of RF models with different characteristics are displayed in Table 4 and Table 5. It is seen that the recognition precision of the test set can reach more than 99%, indicating that the original sensor array is incredibly effective. It also shows that the electronic nose is resistant to various interferences in the detection of drunk drinking. The RF model used the Gini coefficient to rank the importance of four features. By adding the sensor importance values of the four sequences, an overall sensor importance ranking with universality could be obtained. See Table 6 for the top 11 sensors.
Table 4.
Classification of exhaled gas after drinking by the RF classification model of each feature.
Table 5.
Classification of non-existent exhalation after drinking by the RF classification model of each feature.
Table 6.
Overall importance ranking of sensors.
We selected a different number of sensor subsets according to the overall importance of sensors and used the RF algorithm to re-model. The results are shown in Table 7.
Table 7.
Classification accuracy of the sensor subset RF model test set.
Table 7 exhibits that, when the number of sensors is 8, the accuracy of the RF model established with WT characteristics has reached 100%. Therefore, the optimal sensor subset 1 was selected as TGS2620, TGS2611, TGS2600, TGS2602, MP-4, MP135, TGS2610, and GSBT11.
The same operation was applied to the original data of the three conditions of the direct expiratory test. And the optimal sensor subset 2 was obtained as MP-4, MP-7, and TGS2600.
The final sensor set after the combination of optimal sensor subset 1 and optimal sensor subset 2 is TGS2620, TGS2611, TGS2600, TGS2602, MP-4, MP135, TGS2610, GSBT11, and MP-7, for a total of 9 sensors. In general, sensor array optimization using RF is very effective. This might be a result of keeping sensors that are sensitive to the experimental sample gas while removing unnecessary sensors.
4.2. Drunk Driving Detection Results
After obtaining the optimal sensor array and the optimal features, the optimal detection time and classification algorithm were selected. Considering that most drivers will not drive after drinking, a long drunk driving detection time in shared cars will cause unnecessary trouble to non-drinking car rental drivers. In order to obtain the optimal detection time that can ensure a fast and accurate detection task, we sliced the experimental data.
We sliced and extracted the data with sampling times of 5 s, 10 s, 15 s, 20 s, 25 s, and 30 s from the original data of nine test conditions in the cabin gas detection test. According to the WT characteristics of these slice data, KNN, SVM, and RF algorithm classification models are established to judge whether there is exhaled gas after drinking in the cabin. Table 8 shows the classification accuracy of the three algorithm models using different slice time data.
Table 8.
Classification accuracy of SVM, RF, and KNN algorithm models using different slice time data of the cabin gas detection test.
From Table 8, we can see that the best result is the SVM model built with the slice data with a sampling time of 25 s and the RF model built with the slice data with a sampling time of 15 s, both with an accuracy of 99.72%. However, considering the driver’s experience, the detection time should be reduced as much as possible. At the same time, when the slice time is 5 s, the accuracy of the SVM model and RF model is 99.44%, which is not much different from the highest accuracy. So finally, in the first step of the alcohol detection framework, we choose 5 s as the sampling time and SVM as the classification algorithm.
Similarly, we sliced and extracted the data with sampling times of 5 s, 10 s, 15 s, 20 s, 25 s, and 30 s from the original data of three cases of the direct expiratory test and established KNN, SVM, and RF algorithm classification models for the WT characteristics of these slice data to judge whether the driver has been drinking. Table 9 shows the classification accuracy of the three algorithm models using different slice time data.
Table 9.
Classification accuracy of SVM, RF, and KNN algorithm models using different slice time data of the direct expiratory test.
It can be seen from Table 9 that, using different slice time data, the accuracy of each model has reached 100% at 5 s. This may be due to the obvious difference between the components of exhalation before and after drinking. In the follow-up work, we will further subdivide the alcohol content in exhalation after drinking. However, to some extent, the results can still show that when the driver actively blows, the electronic nose can detect whether the driver is drunk. Finally, in the second step of the two-step drunk driving detection framework, we choose 5 s as the sampling time and SVM as the classification algorithm.
5. Conclusions
The realization of onboard drunk driving detection plays an important role in improving road traffic safety, but the shared car cabin environment is complex and changeable, and conventional technology has encountered some difficulties in accurately judging the driver’s drunk driving situation. In this study, a rapid detection system of the vehicle’s electronic nose for drunk driving based on sensor array optimization and a two-step framework were proposed. It can judge whether there is a drinker in the car within 5 s, and the accuracy rate can reach 99.44%. For the situation where there is a drinker in the car, it can also judge whether the driver is drinking within 10 s, with 100% accuracy. Compared with the traditional onboard ignition interlock device, the drunk driving detection system designed in this paper does not require the driver to actively blow air every time, so it has little interference with the driver of the vehicle without drinking personnel. The sensor array of the system is composed of 9 MOS sensors, so the vehicle drunk driving detection system designed in this paper has a low cost and can be widely used in the shared automobile industry.
However, the system has only verified the feasibility of the electronic nose as an onboard drunk driving detection system, and there are still difficulties in its application. Firstly, shared cars are distributed over a wide area, and the climate environment is very different. The MOS Sensor Array, which serves as the central element of the Electronic Nose, is susceptible to changes in the temperature and humidity of its surroundings. Therefore, before the system is popularized, it is inevitable that it should effectively solve the influence of temperature and humidity. Secondly, the simulated exhalation device is still very rough and needs further optimization to make it closer to the real breathing situation. Finally, at present, what we are making is only a prototype, and it is necessary to redesign its circuit to make it more suitable for vehicles. These are the things we need to do next.
Author Contributions
Conceptualization, F.W., Z.L. and Z.C.; methodology, F.W., Z.Y. and X.W.; software, C.X. and Z.Z.; validation, D.B. and C.X.; formal analysis, D.B. and Z.Z.; investigation, D.B. and K.F.; data curation, D.B., C.X. and K.F.; writing—original draft preparation, F.W. and D.B.; writing—review and editing, F.W., Z.Y. and X.W.; visualization, K.F. and Z.Z.; supervision, Z.Y. and Z.C.; project administration, Z.L. and X.W.; funding acquisition, Z.L. and Z.C.; resources, Z.L. and Z.C. All authors have read and agreed to the published version of the manuscript.
Funding
This work was funded by the National Natural Science Foundation of China (51875245), the Science-Technology Development Plan Project of Jilin Province (20200501013GX, 20200403059SF, 20200403064SF, and 20200403006SF), the Special Project of Industrial Technology Research and Development of Jilin Province (2019C039-5, 2020C023-6), and the “13th Five-Year Plan” Scientific Research Foundation of the Education Department of Jilin Province (JJKH20221018KJ).
Institutional Review Board Statement
Not applicable.
Informed Consent Statement
Not applicable.
Data Availability Statement
The data presented in this study are available upon request from the corresponding author.
Acknowledgments
We would like to express our special thanks to Songyang Wang for his valuable suggestions in the process of writing this paper.
Conflicts of Interest
The authors declare no conflict of interest.
References
- Rosero-Montalvo, P.D.; López-Batista, V.F.; Peluffo-Ordóñez, D.H. Hybrid embedded-systems-based approach to in-driver drunk status detection using image processing and sensor networks. IEEE Sens. J. 2020, 21, 15729–15740. [Google Scholar] [CrossRef]
- In the First Half of 2019, 901,000 Cases of Drunk Driving Were Investigated and Punished Nationwide. Available online: http://www.gov.cn/xinwen/2019-07/24/content_5413938.htm (accessed on 3 March 2023).
- Who Will Bear the Responsibility for Traffic Accidents Caused by Shared Cars? Available online: http://auto.people.com.cn/n1/2019/0905/c1005-31337641.html (accessed on 3 March 2023).
- McShane, J.; Douglas, M.; Meehan, K. Using a Raspberry Pi to prevent an intoxicated driver from operating a motor vehicle. In Proceedings of the IEEE 11th Annual Computing and Communication Workshop and Conference (CCWC), ELECTR NETWORK, Virtual, 27–30 January 2021; pp. 1023–1028. [Google Scholar]
- Radun, I.; Ohisalo, J.; Rajalin, S.; Radun, J.E.; Wahde, M.; Lajunen, T. Alcohol ignition interlocks in all new vehicles: A broader perspective. Traffic Inj. Prev. 2014, 15, 335–342. [Google Scholar] [CrossRef] [PubMed]
- Takahashi, K.; Hiramatasu, K.; Tetsuishi, M. Experiments on detection of drinking from face images using neural networks. In Proceedings of the 2nd International Conference on Soft Computing and Machine Intelligence (ISCMI), Hong Kong, China, 23–24 November 2015; pp. 97–101. [Google Scholar]
- Ferguson, S.A.; Draisin, N.A. Strategies for accelerating the implementation of non-intrusive alcohol detection systems in the vehicle fleet. Traffic Inj. Prev. 2021, 22, 13–19. [Google Scholar] [CrossRef] [PubMed]
- Gardner, J.W.; Philip, N.B. A brief history of electronic noses. Sens. Actuat. B-Chem. 1994, 18, 210–211. [Google Scholar] [CrossRef]
- Cheng, L.; Meng, Q.; Lilienthal, A.J.; Qi, P.F. Development of compact electronic noses: A review. Meas. Sci. Technol. 2021, 32, 062002. [Google Scholar] [CrossRef]
- Modesti, M.; Taglieri, I.; Bianchi, A.; Tonacci, A.; Sansone, F.; Bellincontro, A.; Venturi, F.; Sanmartin, C. E-Nose and Olfactory Assessment: Teamwork or a Challenge to the Last Data? The Case of Virgin Olive Oil Stability and Shelf Life. Appl. Sci. 2021, 11, 8453. [Google Scholar] [CrossRef]
- Arroyo, P.; Meléndez, F.; Suárez, J.I.; Herrero, J.L.; Rodríguez, S.; Lozano, J. Electronic Nose with Digital Gas Sensors Connected via Bluetooth to a Smartphone for Air Quality Measurements. Sensors 2020, 20, 786. [Google Scholar] [CrossRef] [PubMed]
- Sun, H.; Tian, F.; Liang, Z.; Sun, T.; Yu, B.; Yang, S.X.; He, Q.; Zhang, L.; Liu, X. Sensor array optimization of electronic nose for detection of bacteria in wound infection. IEEE Trans. Ind. Electron. 2017, 64, 7350–7358. [Google Scholar] [CrossRef]
- Scarlata, S.; Finamore, P.; Meszaros, M.; Dragonieri, S.; Bikov, A. The Role of Electronic Noses in Phenotyping Patients with Chronic Obstructive Pulmonary Disease. Biosensors 2020, 10, 171. [Google Scholar] [CrossRef]
- Gila, D.M.M.; García, J.G.; Bellincontro, A.; Mencarelli, F.; Ortega, J.G. Fast tool based on electronic nose to predict olive fruit quality after harvest. Postharvest Biol. Technol. 2020, 160, 111058. [Google Scholar] [CrossRef]
- Persaud, K.C.; Pisanelli, A.M.; Szyszko, S.; Reichl, M.; Horner, G.; Rakow, W.; Keding, H.J.; Wessels, H. A smart gas sensor for monitoring environmental changes in closed systems: Results from the MIR space station. Sens. Actuat. B-Chem. 1999, 55, 118–126. [Google Scholar] [CrossRef]
- Zhang, J.; Xue, Y.; Sun, Q.; Zhang, T.; Chen, Y.; Yu, W.; Xiong, Y.; Wei, X.; Yu, G.; Wan, H.; et al. A miniaturized electronic nose with artificial neural network for anti-interference detection of mixed indoor hazardous gases. Sens. Actuat. B-Chem. 2021, 326, 128822. [Google Scholar] [CrossRef]
- Xie, T.; Wang, Q.; Wallace, R.M.; Gong, C. Understanding and optimization of graphene gas sensors. Appl. Phys. Lett. 2021, 119, 013104. [Google Scholar] [CrossRef]
- Bang, J.H.; Mirzaei, A.; Choi, M.S.; Han, S.; Lee, H.Y.; Kim, S.S.; Kim, H.W. Decoration of multi-walled carbon nanotubes with CuO/Cu2O nanoparticles for selective sensing of H2S gas. Sens. Actuat. B Chem. 2021, 344, 130176. [Google Scholar] [CrossRef]
- Zappi, D.; Ramma, M.M.; Scognamiglio, V.; Antonacci, A.; Varani, G.; Giardi, M.T. High-tech and nature-made nanocomposites and their applications in the field of sensors and biosensors for gas detection. Biosensors 2020, 10, 176. [Google Scholar] [CrossRef] [PubMed]
- Voss, A.; Schroeder, R.; Schulz, S.; Haueisen, J.; Vogler, S.; Horn, P.; Stallmach, A.; Reuken, P. Detection of liver dysfunction using a wearable electronic nose system based on semiconductor metal oxide sensors. Biosensors 2022, 12, 70. [Google Scholar] [CrossRef]
- Mirzaei, A.; Leonardi, S.G.; Neri, G. Detection of hazardous volatile organic compounds (VOCs) by metal oxide nanostructures-based gas sensors: A review. Ceram. Int. 2016, 42, 15119–15141. [Google Scholar] [CrossRef]
- Weng, X.; Kong, C.; Jin, H.; Chen, D.; Li, C.; Li, Y.; Ren, L.; Xiao, Y.; Chang, Z. Detection of Volatile Organic Compounds (VOCs) in Livestock Houses Based on Electronic Nose. Appl. Sci. 2021, 11, 2337. [Google Scholar] [CrossRef]
- Chang, Z.; Lv, J.; Qi, H.; Ma, Y.; Chen, D.; Xie, J.; Sun, Y. Bacterial infection potato tuber soft rot disease detection based on electronic nose. Open Life Sci. 2017, 12, 379–385. [Google Scholar] [CrossRef]
- Zhao, R.; Kong, C.; Ren, L.; Sun, Y.; Chang, Z. Real-time monitoring of the oil shale pyrolysis process using a bionic electronic nose. Fuel 2022, 313, 122672. [Google Scholar] [CrossRef]
- GB/T 21254-2017; Breath Alcohol Detector, 1st ed. China Quality and Standards Publishing & Media Co., Ltd.: Beijing, China, 2017; pp. 2–5.
- GB 19522-2010; Blood & Breath Alcohol Concentration and Examination for Vehicle Drivers, 1st ed. China Quality and Standards Publishing & Media Co., Ltd.: Beijing, China, 2011; pp. 1–2.
- Ferguson, S.A.; Zaouk, A.; Dalal, N.; Strohl, C.; Traube, E.; Strassburger, R. Driver Alcohol Detection System for Safety (DADSS)-Phase I Prototype Testing and Findings. In Proceedings of the 22rd International Technical Conference on the Enhanced Safety of Vehicles, Washington, DC, USA, 13–16 June 2011; p. 11-0230. [Google Scholar]
- Zhu, D.; Wang, T. Physiology, 8th ed.; People’s Health Publishing House: Beijing, China, 2013; pp. 152–186. [Google Scholar]
- Weng, X.; Sun, Y.; Xie, J.; Deng, S.; Chang, Z. Bionic Layout Optimization of Sensor Array in Electronic Nose for Oil Shale Pyrolysis Process Detection. J. Bionic. Eng. 2021, 18, 441–452. [Google Scholar] [CrossRef]
- Ljungblad, J.; Hök, B.; Allalou, A.; Pettersson, H. Passive in-vehicle driver breath alcohol detection using advanced sensor signal acquisition and fusion. Traffic Inj. Prev. 2017, 18, S31–S36. [Google Scholar] [CrossRef] [PubMed]
- Breiman, L. Random forests. Mach. Learn. 2001, 45, 5–32. [Google Scholar] [CrossRef]
- Han, H.; Guo, X.; Yu, H. Variable selection using Mean Decrease Accuracy and Mean Decrease Gini based on Random Forest. In Proceedings of the 2016 7th IEEE International Conference on Software Engineering and Service Science (ICSESS), Beijing, China, 26–28 August 2016; pp. 219–224. [Google Scholar]
- Yan, J.; Guo, X.; Duan, S.; Jia, P.; Wang, L.; Peng, C.; Zhang, S. Electronic Nose Feature Extraction Methods: A Review. Sensors 2015, 15, 27804–27831. [Google Scholar] [CrossRef] [PubMed]


Disclaimer/Publisher’s Note: The statements, opinions and data contained in all publications are solely those of the individual author(s) and contributor(s) and not of MDPI and/or the editor(s). MDPI and/or the editor(s) disclaim responsibility for any injury to people or property resulting from any ideas, methods, instructions or products referred to in the content. |
© 2023 by the authors. Licensee MDPI, Basel, Switzerland. This article is an open access article distributed under the terms and conditions of the Creative Commons Attribution (CC BY) license (https://creativecommons.org/licenses/by/4.0/).