Article

Investigating Salinity Effects in Brackish Aquaponics Systems: Evidencing the Co-Cultivation of the Halophyte Crithmum maritimum with the Euryhaline Sparus aurata

1
Department of Fisheries and Aquaculture, School of Agricultural Sciences, University of Patras, 30200 Messolonghi, Greece
2
Department of Ichthyology and Aquatic Environment, School of Agricultural Sciences, University of Thessaly, 38446 Volos, Greece
3
Department of Agriculture Crop Production and Rural Environment, School of Agricultural Sciences, University of Thessaly, 38446 Volos, Greece
4
Laboratory of Animal Physiology, Department of Biology, Aristotle University of Thessaloniki, 54124 Thessaloniki, Greece
5
Institute of Plant Breeding and Genetic Resources, Hellenic Agricultural Organization, Demeter, Thermi, 57001 Thessaloniki, Greece
6
School of Veterinary Medicine, Laboratory of Ichthyology-Culture and Pathology of Aquatic Animals, Aristotle University of Thessaloniki, 54124 Thessaloniki, Greece
*
Authors to whom correspondence should be addressed.
Appl. Sci. 2023, 13(6), 3385; https://doi.org/10.3390/app13063385
Submission received: 26 January 2023 / Revised: 28 February 2023 / Accepted: 4 March 2023 / Published: 7 March 2023
(This article belongs to the Section Marine Science and Engineering)

Abstract

:
The possibility of simultaneous production of halophyte and euryhaline fish creates huge interest in both commercial aquaponics systems and in research. The aim of the present study was to investigate the effect of three different salinities (8, 14, and 20 ppt) on the growth performance and survival rate of sea bream (Sparus aurata) and rock samphire (Crithmum maritimum) in an experimental brackish aquaponic system. Furthermore, induction of heat shock proteins (Hsps) and phosphorylation of mitogen-activated protein kinases (MAPKs) were assessed through the sodium dodecyl sulfate–polyacrylamide gel electrophoresis (SDS-PAGE) and immunoblot analysis. A total number of 234 sea bream individuals were divided into nine autonomous aquaponic systems. The experiment lasted 45 days. In total, 54 individuals of rock samphire were used and were distributed into groups of six individuals per hydroponic tank using the raft method. Water quality showed stable fluctuation throughout the experiment, strongly supporting fish and plant growth performance and survival in both treatments. The results show that better growth performance for both sea bream and rock samphire (height increase) was evident in salinity 8 ppt compared to salinities 14 ppt and 20 ppt. Minimal or mild histopathological alterations were detected in gills, midgut, and liver for all three salinity groups. Exposure to different salinities modified Hsp60 and MAPKs expression in a tissue- and time-specific manner. During exposure to 8 ppt, constant Hsp60 levels and phosphorylation of MAPKs at 15 days may indicate a prominent protective role in the gills. The results show that sea bream and rock samphire can be used in brackish aquaponics systems with satisfactory growth performances, thus allowing for a range of commercial applications generating interest in their production.

1. Introduction

Climate change affects both the distribution and the concentration of global water bodies. In the next centuries, sea level is predicted to rise to 3 m due to the melting of polar ice caps [1], thus leading to a decrease in mean ocean salinity [2]. Correspondingly, gradually increasing extreme environmental events, such as tides and tsunamis often cause large and rapid fluctuations in habitat salinity [3]. Salinity constitutes a crucial abiotic factor for fish that influences both their distribution and activity [4].
Aquaponics systems represent an innovative application that can contribute to the reduction in salinity levels and ever-increasing scarcity of resources due to the continuous growth of human population. Furthermore, the reckless use of freshwater with limited availability compared to the increased availability of brackish water and saltwater triggered the interest of researchers to exploit saline water in aquaponics systems [5,6].
Previous studies report that aquaponics systems are identified to date as ecological and sustainable food production methods that combine aquaculture and hydroponics in a recirculating system [6,7,8]. In such applications, aquatic organisms (fish, invertebrates) co-cultivated with plants (vegetables, herbs, or algae) may create a symbiotic environment [5,7,9,10,11]. Animals, plants, and microorganisms coexist in such multicultural systems offering environmentally friendly solutions and resource use efficiency. In aquaponic systems, the nutrient-rich water acts as a natural fertilizer for plants, while the latter act as water purifiers helping aquatic organisms grow more efficiently. Fish excrete their waste, and bacteria convert it into available nutrients for plant growth [6,7,12,13,14,15]. Ammonia (released as a metabolic product through fish gill mediators) is involved in the process that enables the simultaneous growth of plants, bacteria, and fish. Ammonia-oxidizing bacteria (AOB) (Nitrosomonas spp.) oxidize toxic ammonia to nitrite ions and consequently to nitrate ions through the nitrite-oxidizing bacteria (NOB) (Nitrobacter spp.) [16]. Coupled aquaponics systems’ operation in terms of biological filtration monitoring of the water quality is similar to recirculating aquaculture systems. Water is transported from fish tanks to the biological filter by gravity and via a pump to the plants. Lastly, the water returns from the plants in fish tanks.
Alternative water sources, such as brackish or saltwater can be used in aquaponic systems (maraponics), in which euryhaline or saltwater fish, seaweeds, halophytic plants, and salinity-tolerant glycophytes can be utilized [6].
To date, euryhaline species, such as gilthead sea bream Sparus aurata [7], sea bass Dichentrarchus labrax [8,11,17], flathead grey mullet Mugil chephalus, leaping grey mullet Liza saliens [18], or Nile tilapia Oreochromis niloticus [19], and red tilapia hybrid Oreochromis mossambicus [20,21] were used in saline aquaponic systems. Several euryhaline teleosts, such as European sea bass (Dicentrachus labrax) can adapt to a wide range of environmental salinity [22]. These marine species possess the capability of sensing environmental osmolality and further transducing the sensory stimulus to signaling pathways that generate many physiological changes for adjusting their osmoregulatory strategy [23]. Mitogen-activated protein kinases (MAPK) constitute evolutionary conserved intracellular signal transduction protein cascades that are activated by numerous extracellular stimuli, including salinity levels [24]. Several MAPK subfamilies are involved in the signaling of osmotic stress, thus indicating the important role of cascade in osmoregulatory mechanisms [25]. Furthermore, several members of another intracellular protein family, namely heat shock proteins [HSPs], are highly expressed under stress. HSPs act as molecular chaperones and participate in the prevention of stress-induced protein unfolding and degradation of damaged proteins, thus maintaining cellular protein homeostasis [26,27]. Miscellaneous abiotic and biotic factors may contribute to the induction of HSPs, such as heat, drugs, pathogen infections, and osmotic stress [26,28]. From this angle, it is important to further investigate the expression levels of these groups of proteins (MAPKs and HSPs), revealing their chronic expression under different salinity levels in an aquaponic system.
On the other hand, the growth of plants is closely related to their environment and, in particular, the cultivation conditions, including salinity levels and nitrogen availability as major issues. Nitrogen is an essential element affecting plant growth in a critical way as it is the building block of proteins, enzymes, chlorophyll, coenzymes, and nucleic acids. Plant nitrogen uptake is affected by many factors, such as nutrient concentrations, light intensity, plant growth stages, and genetic factors [29,30]. Regarding salinity, halophytic plants developed adaptive mechanisms to cope with the saline environment. Effective osmoregulation is a key process employed by halophytes to tackle osmotic stress, thus avoiding dehydration. Moreover, the accumulation of osmotically active compounds protects sensitive cellular substances from Na+ toxicity and plays a major role in reactive oxygen species detoxification [31]. Although many halophytes, such as Crithmum maritimum L. (Apiaceae), can grow even at seawater levels of salinity, they show reduced growth at high salinities compared to lower salinities [7,32,33]. In addition, salinity affects the plant’s photosynthetic activity, either directly by targeting photosynthetic apparatus and causing changes in chlorophyll, carotenoids, and proteins levels or indirectly though the deterioration of plant’s water relations [34,35].
The halophyte rock samphire (Crithmum maritimum), a salt-tolerant Mediterranean plant of coastal areas, was used in the present study as it can survive and grow at 12 ppt or higher salinities [7,36]. Rock samphire, therefore, fulfills the requirements as one of the candidate plants in saline aquaponics (maraponics and brackaponics). The aim of the present study was to investigate the effect of different salinity levels (8, 12, and 20 ppt) on the growth performance and survival rate of sea bream (S. aurata) and rock samphire (C. maritimum) in a small-scale brackish aquaponic system. Both species were chosen due to their high commercial value in aquaculture and agriculture operations and their nutritional value. Moreover, their coupling in brackish aquaponics offers increased added value in terms of sustainable cultivation practices.

2. Materials and Methods

2.1. Experimental Setup

The experiment was carried out at the Laboratory of Aquaculture–aquaponics, Department of Ichthyology and Aquatic Environment, University of Thessaly, Greece. Gilthead sea bream (S. aurata) and rock samphire (C. maritimum originated from Mount Athos; GR-1-BBGK-16,5961) were provided by a local nursery facility and the Institute of Plant Breeding and Genetic Resources, Hellenic Agricultural Organization Demeter, respectively. They were divided into three treatments under three different salinities: 8 ppt, 14 ppt, and 20 ppt, respectively. Salinity 8 ppt was chosen as a low salinity for fish and plants aiming to grow well [7]; 20 ppt as the maximum salinity to investigate the growth of both gilthead sea bream and rock samphire; and 14 ppt as an intermediate salinity where sea bream is known to show the optimum growth, beneficial osmoregulatory capacity, and metabolic activity [37].
Nine autonomous small-scale aquaponic systems (135 L) were used consisting of nine fish tanks (54 L), nine hydroponic tanks (54 L), and nine sump biofilters (27 L) used as described in previous own studies [7]. Each aquaponics system consisted of three rectangular fish-rearing tanks (40 × 35 × 26 cm) with a total volume of 36.4 L, supported by an upflow and downflow sump filter with a volume of 53 L. The experiment lasted for 45 days.
Later, fish were gradually adapted to the experimental salinities for 30 days as described previously in our own studies [7]. Upon successful adaptation of the fish to 20 ppt, 14 ppt, and 8 ppt, a small number of fish (20 individuals/aquarium) were placed in each aquaponics fish tank for 15 days until the conditioning of the aquaponic system and the filter bed took place.
After the successful acclimatization of gilthead sea bream and rock samphire in the experimental salinities, 234 gilthead sea bream individuals were divided into 26 individuals per aquarium with an initial average weight of 3.90 ± 0.05 g, and an initial average length of 6.75 ± 0.03 cm. In addition, 54 individuals of rock samphire were divided into six individuals per system with an average initial height of 7.90 ± 0.05 cm. Gilthead sea bream were fed by hand with a commercial pellet (1.5 mm, BIOMAR, SA-GREECE) containing 55% crude protein, 15% crude lipids, ash 9%, and gross energy 21.3 MJ/Kg of D.M., in three meals six days a week, except the seventh day where the fish remained with an empty stomach to let the system discharge from fish wastes. Fish were weighed every 15 days of the experiment, remeasuring their weight and length to redefine the amount of daily food intake. Fish tanks were cleaned, and uneaten food was removed every day by siphoning. At the end of the experiment, fish were anaesthetized with an 0.20 mg/L MSS 222, and final fish body weights and lengths were measured.
Water effluent from the fish tank and hydroponic grow bed was dropped through gravity into the mechanical filter (consisting of a porous sponge to capture the faeces and uneaten food), then the water through downflow and upflow into the biofilter containing 20 L bio balls media (Φ31.8–38.1 mm) creating a specific surface area (SSA) of 600 cm2/cm3 and 20 L ceramic ring media (Φ25 mm), with SSA 1000 cm2/cm3. The SSA of filter media was affected by feeding rate and protein content in fish feed, influencing the carrying capacity of the filter bed, ammonia removal efficiency, and the condition of the filter. The hydraulic load (HLR = 2.51 cm/min), the hydraulic retention time (HRT = 4.59 min), the recirculation rate (r = 0.90), and the water flow (Q = 3.31 m3/h) were adjusted to be similar in both treatments.
The measurement of the morphometric characteristics of fish and plants was performed every 15 days during the experiment. Every 15 days, the amount of food offered was re-adjusted due to the change in weight obtained from the measurements, while the nutrition ration level (5% of b.w.) and the number of meals were kept constant [7,38]. The feed’s high consistency and low solubility were the main selection criteria for this growth experiment.
To investigate the effect of salinity on time-dependent changes in protein expression with stress, we conducted two intermittent samplings on days 15 and 30 of the experiment. Two individuals of gilthead sea bream from each tank (six from each treatment, in total) were sacrificed. The total number of individuals was in line with FELASA’s guidelines for using the minimum required number of experimental animal.
Throughout the experiment, the physicochemical parameters of water were monitored daily for dissolved oxygen, temperature, and pH, with an electronic apparatus HQ 40 d (HACH-LANGE GmbH, Düsseldorf, Germany), and total ammonia nitrogen (TAN), nitrate ions, phosphates, and calcium were monitored once a week using a photometer (HACH-LANGE DR 3800 GmbH, Düsseldorf, Germany). Salinity was measured using an optical refractometer (KERN & SOHN GmbH, Balingen, Germany). All samples were taken from two checkpoints of the aquaponic systems (inlet and outlet of the hydroponic unit) before the first meal.
The plants were placed in the clay pebble (8–16 mm) substrate of the hydroponic tank at a distance of 7 cm. The photoperiod was set up to be 14 light: 10 h dark (summer photoperiod). The homogeneity of photosynthetically active radiation (PAR) reaching the plant top was maintained at the level of 500–600 μmol m2 sec−1.
The operation of the aquaponics systems was monitored daily and included the following:
-
fish and plant observations;
-
water level and water quality monitoring;
-
airflow and dissolved oxygen saturation;
-
salinity and temperature monitoring;
-
pump function of the systems;
-
cleaning the sponges of the mechanical filter from fish waste.

2.2. Fish Histology

At the end of the experiment, five fish were taken per tank for histopathological examination. Fish were euthanized with increased dosage of phenoxyethanol and were placed immediately on ice. Samples of gills, liver, kidney, and midgut were taken from each fish. Tissue samples were first fixed in Davidson’ fixative for 24 h at 4 °C and then they were immediately dehydrated in a graded series of ethanol, immersed in xylol, and embedded in paraffin wax. Sections of 5–10 μm were mounted. After they were deparaffinized, the sections were rehydrated, stained with hematoxylin–eosin, mounted with Cristal/Mount and examined for alterations with a microscope (Axiostar plus Carl Zeiss Light Microscopy, Carl Zeiss Ltd., Gottingen, Germany) under a total magnification of 100× and 400×.
A semi-quantitative grading system was used in order to quantify the histopathological alterations of the examined tissues [39]. Severity grading used the following system: Grade 0 (not remarkable), Grade 1 (minimal), Grade 2 (mild), Grade 3 (moderate), and Grade 4 (severe).

2.3. SDS-PAGE and Immunoblot Analysis

To examine time-dependent changes in the expression of stress-related proteins during exposure to increasing salinity levels, SDS-PAGE/immunoblot analysis was carried out according to well-established protocols. Briefly, homogenization of liver and gill samples for the total protein extraction was conducted in cold lysis buffer as described in [40]. Protein concentration was determined using the BioRad protein assay.
Equivalent amounts of protein (80 μg) were loaded and separated on 10% (w/v) acrylamide and 0.275% (w/v) bisacrylamide slab gels and then electrophoretically transferred to a nitrocellulose membrane (0.45 μm, Schleicher & Schuell, Keene, NH, USA). Ponceau staining of the membranes was performed to assure equal protein loading and transfer efficiency. Following blocking of non-specific binding sites in 5% (w/v) non-fat milk in Tris-buffered saline/Tween (TBST) (20 mM Tris–HCl, 137 mM NaCl, 0.1% (v/v) Tween 20, pH 7.5), membranes were thoroughly rinsed in TBST (3 times, 5 min each) and subsequently incubated overnight at 4 °C with the appropriate primary antibodies. The antibodies used were as follows: monoclonal rabbit anti-heat shock protein, 60 kDa (Cat. No. 12165, Cell Signaling, Beverly, MA, USA), monoclonal rabbit anti-phospho-p44/42 MAPK (Thr202/Tyr204) (Cat. No. 4370, Cell Signaling, Beverly, MA, USA) and polyclonal rabbit anti-phospho-p38 MAPK (Thr180/Tyr182) (Cat. No. 9211, Cell Signaling, Beverly, MA, USA). Thereafter, blots were thoroughly rinsed in TBST (3 times, 5 min each) and subjected to incubation for 1 h with horseradish peroxidase (HRP)-conjugated secondary antibody (anti-rabbit IgG, HRP-linked antibody (Cat. No. 7074, Cell Signaling, Beverly, MA, USA)). The immunoreactive bands were visualized using the enhanced chemiluminescence (ECL) detection system (Cat. No. 7003, Cell Signaling, Beverly, MA, USA) followed by fluorography on Fuji Medical X-ray films. Densitometric analysis using Image Studio Lite (LI-COR Biosciences, Lincoln, NE, USA) was employed for bands quantification.

2.4. Plant and Fish Growth Performance Indicators

At the end of the experiment, the following indices were calculated using the equations below as described by Mente et al. [41], where Win and Wfin are the initial and final weight of the fish, respectively, and Δt is the duration of the experiment in days:
Specific growth rate (SGR, %/day) = ((lnWfin − lnWin)/Δt) × 100;
Weight gain (WG, gr) = Wfin − Win;
Food conversion ration (FCR) = Food offered (g)/weight gain (g);
Daily food intake (DFI, %/d) = 100 × ((food offered/weight gain)/feeding days);
Body weight increase (BWI %) = 100 x (Wfin − Win)/Win;
Condition factor (K) = (W × L−3) × 100 where W is the body weight of the fish (g) and L is the total length of the fish (cm);
Survival (S) = ((final number of fish − initial number of fish)/initial number of fish)) × 100.
The growth performance of rock samphire was assessed through the measurements of (i) branch number at the beginning and end of the experiment, (ii) final plant height, (iii) rate of height gain (as final height/day, cm/d), [42], and (iv) fresh weight of the aerial part. The latter was determined immediately after cutting the above-ground plant part.

2.5. Statistical Analysis

Values are presented as means ± standard error. Data were checked for normality and homeogeneity with Kolmogorov–Smirnov test and Levene’s test, respectively. Comparisons of means (one-way ANOVA) were considered statistically significant at p < 0.05 [43]. The effects of the two independent factors (salinity and time) and their interactions upon the variable (protein expression) were analyzed by two-way ANOVA. Statistical analyses were carried out using the software package IBM SPSS Statistics V27.

3. Results

3.1. Rearing Conditions

Rearing conditions and the dissolved nutrients in the brackish aquaponic system are presented in Table 1. In all treatments, there were no significant differences between total ammonium nitrogen at the inlet (TANin) and outlet (TANout) of the filter, nitrate ions at the inlet (NO3in) and outlet (NO3out) of the plant tank growbed, phosphate ions at the inlet (PO4=in) and outlet (PO4=out) of the plant tank growbed, and ΝO2, (ANOVA, p > 0.05). There were no statistical differences between pHFT and pHGB in both aquaponic systems (ANOVA, p > 0.05). The mean value of pHFT in fish tanks ranged between 6 and 6.5 and was in the same range (6.3–6.6) in the hydroponic tanks (pHGB) (Table 1).

3.2. Fish and Plant Growth Performance

Fish growth performance is presented in Table 2. At the start of the experiment, there were no statistically significant differences in the means of the gilthead sea bream initial body weights, lengths, and initial Fulton’s: coefficient factor (ANOVA, p > 0.05) for all treatments. At the end of the experiment, there were no significant differences in the means of the weight gain and body weight increase (BWI %) in all treatments (ANOVA, p > 0.05). The final mean weight, specific growth rate (SGR), and final Fulton’s coefficient factor (Kfin) were significantly higher at 8 ppt and 20 ppt than 14 ppt treatments (ANOVA, p < 0.05). The survival rate for gilthead sea bream over 45 days of culture ranged between 89.8%, 96%, and 97.3% for aquaponic systems with 20 ppt, 14 ppt, and 8 ppt, respectively (Table 2). The mean values of FCR and DFI at the end of the experiment were not significant different between the salinity treatments (ANOVA, p > 0.05) (Table 2). At the start of the experiment, there were no significant differences in the means of rock samphire initial height (ANOVA, p > 0.05).
Plant size at the beginning of the experiment was similar in all treatments in terms of number of branches per plant (Table 3). At the final harvest, the number of branches reached almost doubled values, yet no significant differences among the various salinity levels were recorded. Both final plant height and fresh weight of the aerial part showed the highest values in the 8 ppt treatment and the lowest in 20 ppt, with among-treatment differences being statistically significant. Notably, the fresh weight of 8 ppt-treated plants exhibited a 6.3-fold and 2.7-fold increase compared with 20 ppt and 14 ppt, respectively. The rate of height gain was significantly enhanced in 8 ppt compared with the other two treatments.

3.3. Fish Histology

3.3.1. Liver

Liver histopathology of all the salinity groups revealed only minimal (grade 1) alterations (Table 4) for 20 ppt, 14 ppt, and 8 ppt, such as micro-haemmoradge, micro-granuloma, and mild lipid accumulation to the liver cells (Figure 1 and Figure S1).

3.3.2. Midgut

Midgut microscopic examination showed minimal histopathological alterations (grade 1) only at the 20 ppt salinity group (Table 4). Structure disorganization of the midgut was observed in two fish (Figure 1 and Figure S1).

3.3.3. Kidney

Sea bream individuals in 20 ppt salinity showed bigger collecting ducts than the ones in 8 ppt salinity. There were minimal histopathological alterations for the 20 ppt salinity group and mild histopathological alterations for the 14 ppt and 8 ppt salinity groups (Table 4). The most important were granulomas, haemmoradge, glomerulopathy, Bowman’s capsule epithelial cells proliferation, and tubule degeneration (Figure 1 and Figure S1).

3.3.4. Gills

Minimal histopathological alterations were observed in the 20 ppt and 8 ppt salinity group (Table 4). The most important were hyperplasia of primary lamellae, epithelium detachment at the secondary lamella (edema), small aneurysms, and micro-haemmoradge. Mild histopathological alterations were detected in the 14 ppt salinity group (Table 4). Hyperplasia of primary lamellae, epithelium detachment at the secondary lamella (edema), micro-haemmoradge, and swollen blood vessels in the secondary lamellae (telangiectasia) were also detected (Figure 1 and Figure S1).

3.4. Expression of Stress-Related Proteins

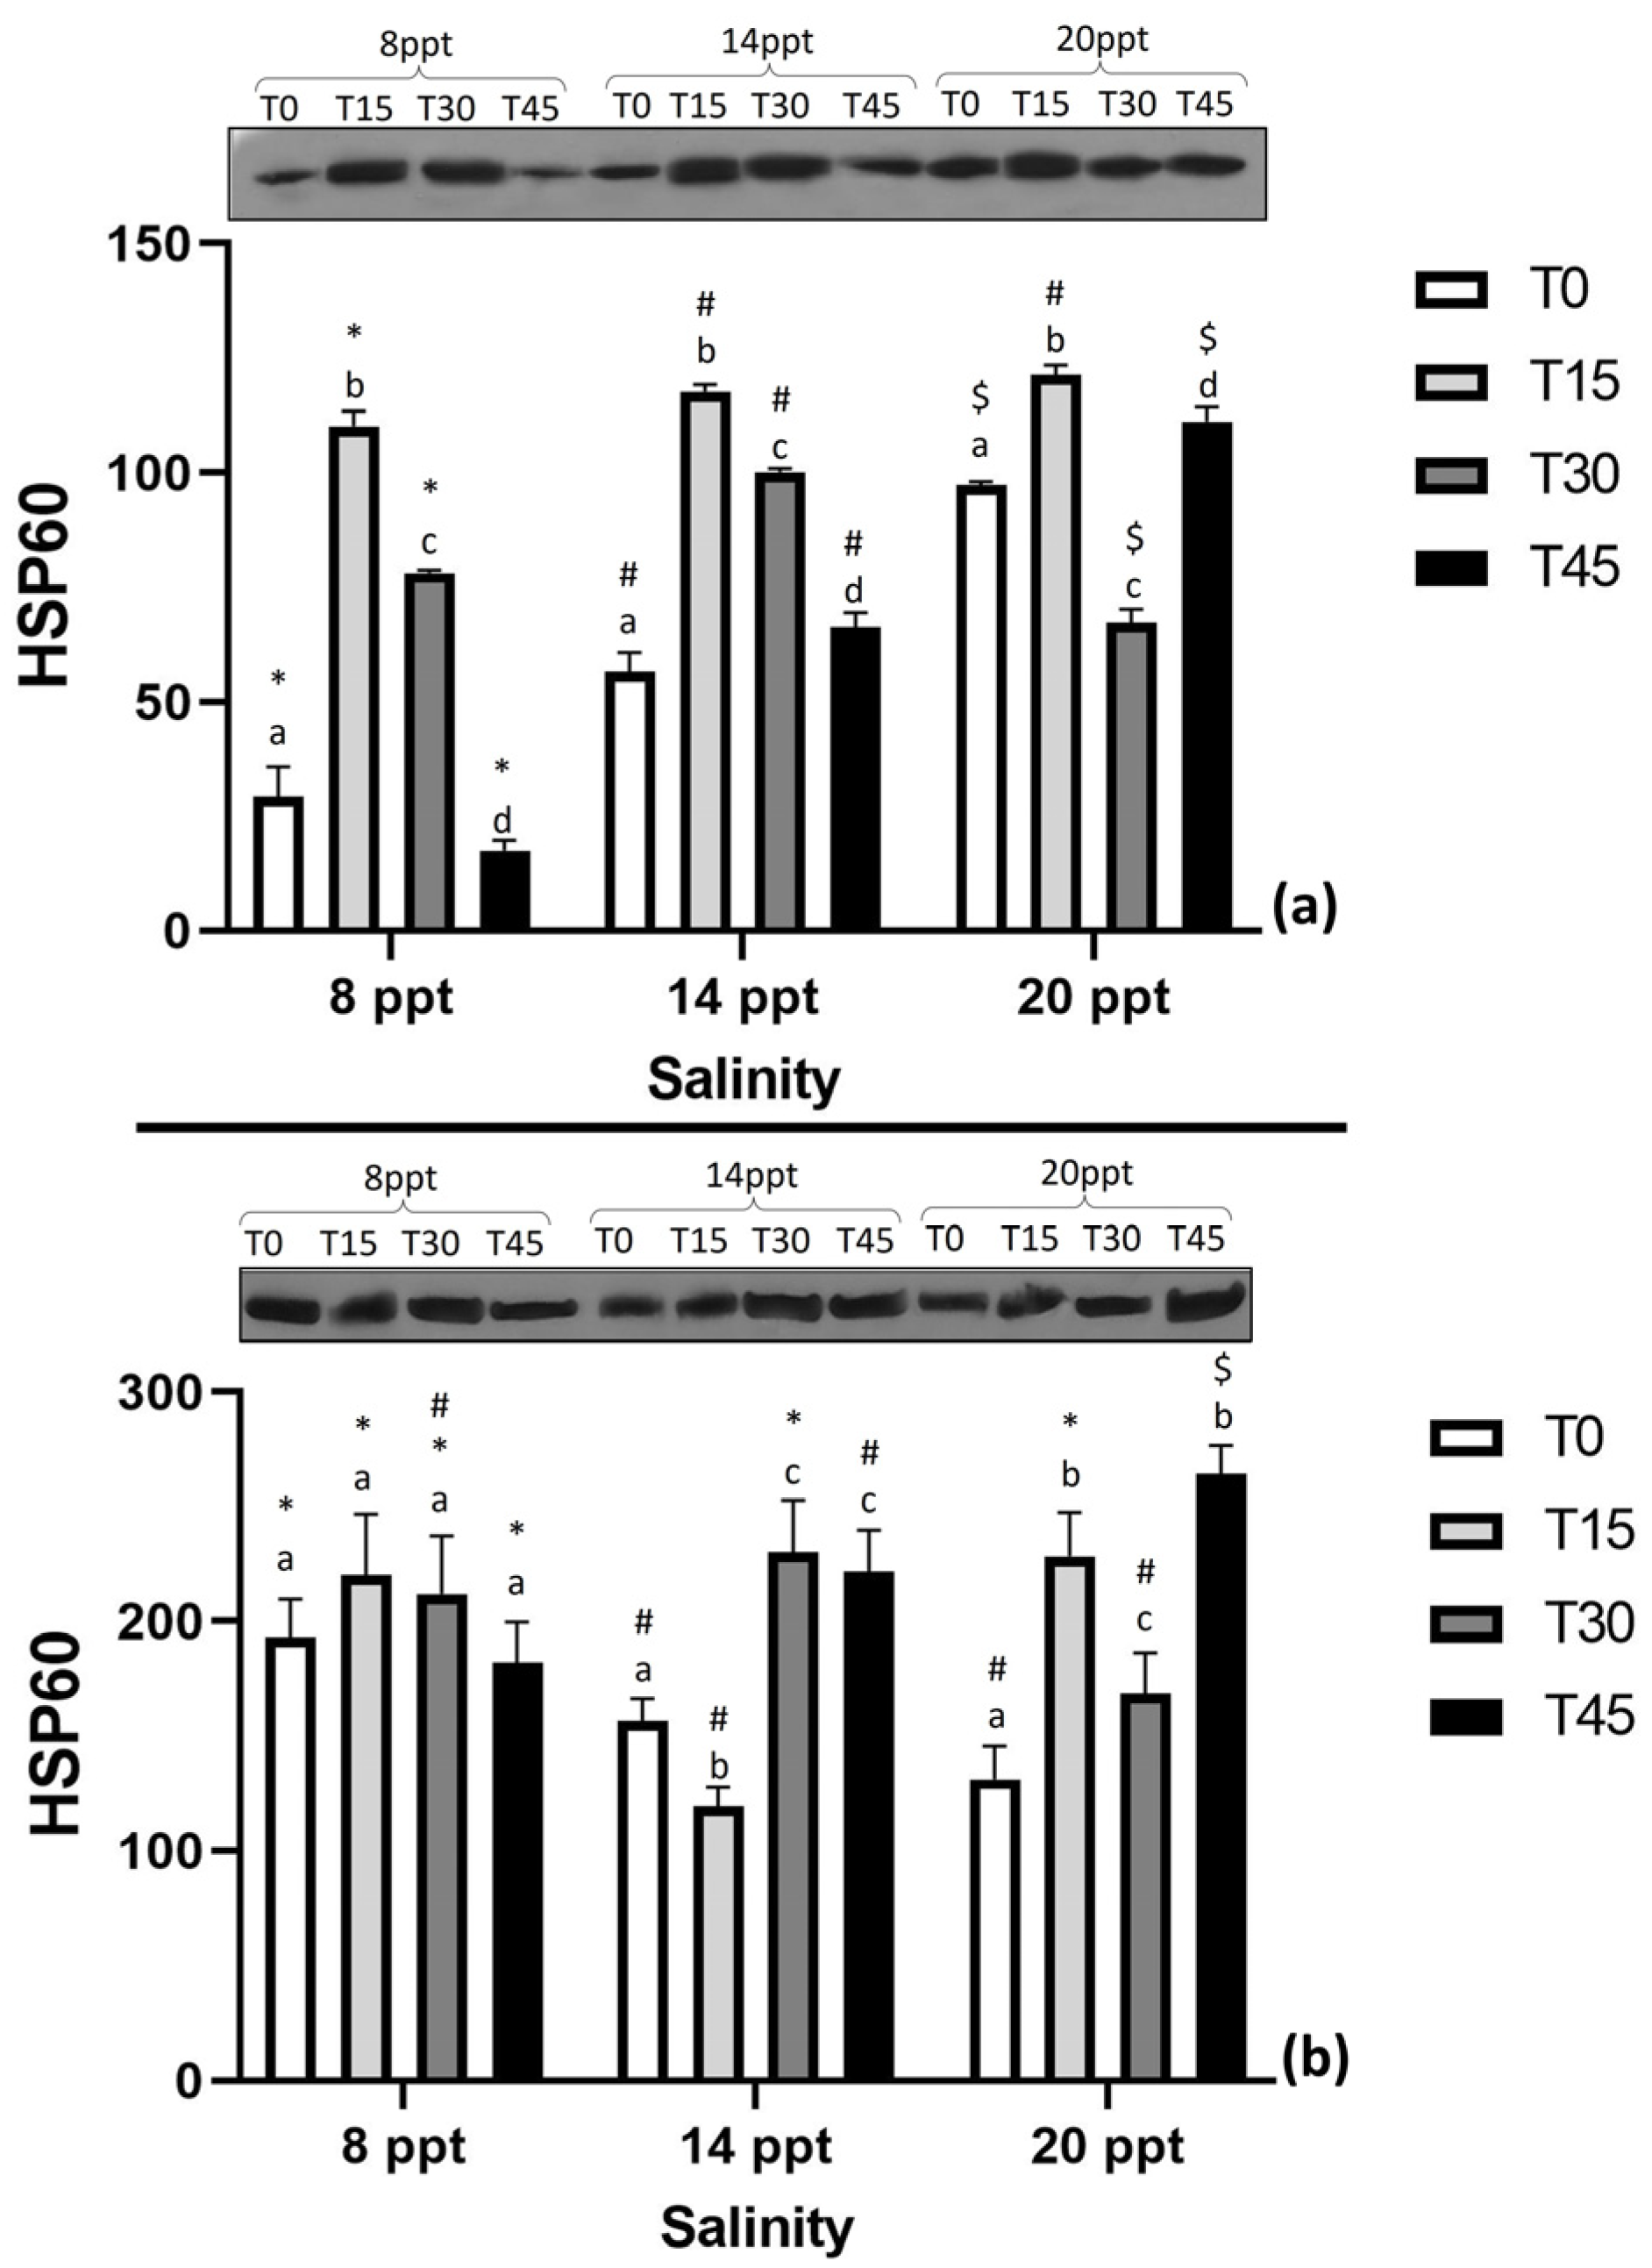
The induction of Hsp60 in the liver and the gills of gilthead sea bream during exposure to increasing salinity (at different times) for 45 days are depicted in Figure 2. Regarding the hepatic Hsp60 expression, two-way ANOVA revealed that there was a statistically significant interaction between the effects of time and salinity on Hsp60 expression (F(6, 24) = 211.88, p < 0.001) (Figure 2a). Compared to the initial Hsp60 levels (T0), a significant induction was apparent after 15 days of exposure (T15) to all examined salinities, while further exposure (T30, T45) led to a significant decrease at salinities 8 and 14 ppt. However, the aforementioned decrease resulted in lower Hsp60 levels, compared to T0, only at the 8 ppt. Concerning Hsp60 levels at 20 ppt, prolonged exposure for 30 days led to a significant decrease compared to both T0 and T15, while a significant induction compared to T0 and T30 was apparent following further exposure (T45). In addition, exposure to increasing salinity at the same time mainly resulted in significantly (p < 0.05) induced Hsp60 levels.
Based on the two-way ANOVA, salinity, time, and the cumulative effect of these two variables significantly affected the Hsp60 levels in the gills (p < 0.01). The exposure of gilthead sea bream to 8 ppt displayed no changes in the expression of Hsp60 among the different times (Figure 2b). In contrast, decreased levels were observed following exposure to 14 ppt for 15 days (T15) compared to T0, while further exposure (T30, T45) significantly induced the Hsp60 expression. However, compared to the initial Hsp60 levels (T0) at 20 ppt, a significant elevation was apparent during prolonged exposure, although a reduction was observed at T30 compared to both T15 and T45. Concerning the exposure time, significant induction of Hsp60 due to the increased salinity (14 and 20 ppt) was evident only at T45.
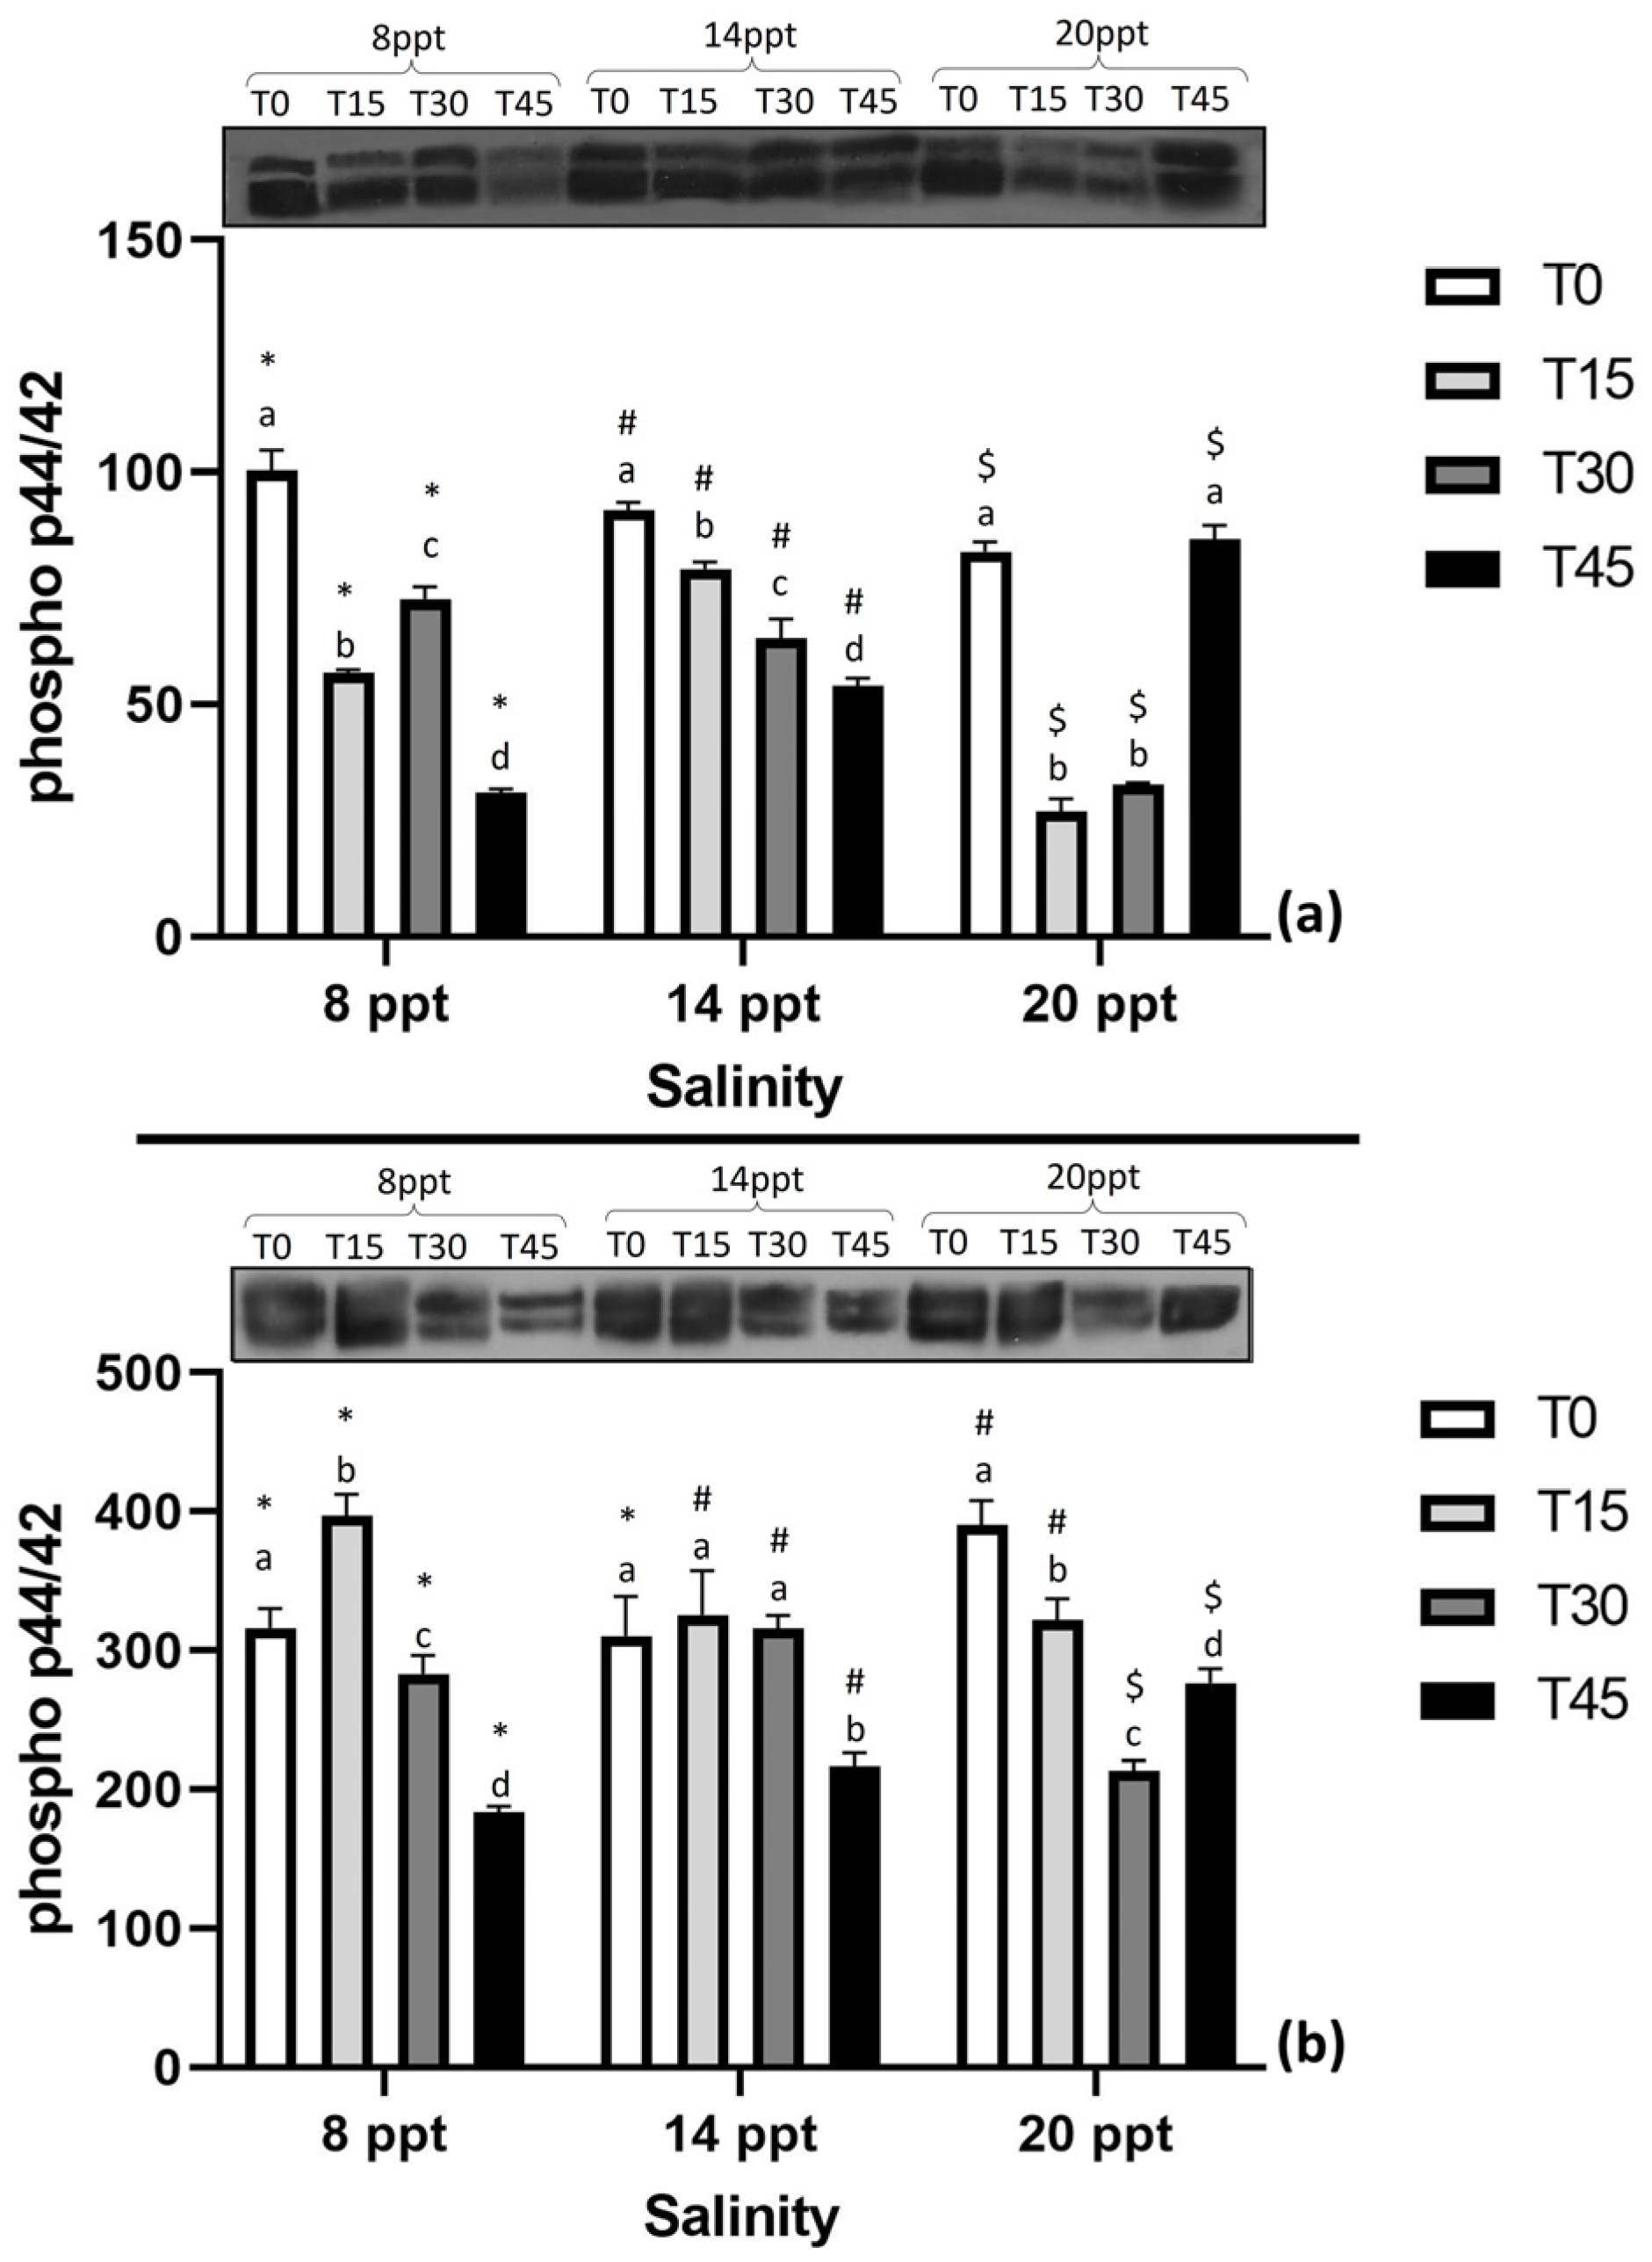
Regarding p44/42 MAPK, the results of two-way ANOVA show a significant interaction between the effects of time and salinity on phosphorylation in both examined tissues. Compared to the initial p44/42 MAPK phosphorylation levels (T0), a significant decrease was observed in the liver at 8 and 14 ppt regardless of the exposure time (Figure 3a). Concerning the hepatic p44/42 MAPK at 20 ppt, significantly decreased levels were observed at T15 and T30 compared to T0, while prolonged exposure for 45 days (T45) led to phosphorylation increase at the initial levels. Furthermore, the hepatic phosphorylation levels decreased with increasing salinity at both T0 and T30, while at T45, increased salinity resulted in elevated levels. However, at T15, a shift from 8 ppt to 14 ppt led to a significant increase in the p44/42 MAPK phosphorylation, while decreased levels compared to both 8 and 14 ppt were observed following exposure to 20 ppt.
In contrast to the liver, two-way ANOVA revealed that salinity did not have a statistically significant effect on the phosphorylation of p44/42 MAPK in the gills (p > 0.05). However, there was a statistically significant interaction between the effects of time and salinity (F(6, 36) = 41.14, p < 0.001). The exposure of gilthead sea bream to 8 ppt resulted in elevated phosphorylation at T15, while further exposure (T30, T45) led to a significant decrease compared to T0 (Figure 3b). During the first 30 days of exposure to 14 ppt, no significant changes were observed in p44/42 MAPK phosphorylation, while at T45 a significant decrease was apparent compared to T0. Compared to the initial p44/42 MAPK phosphorylation levels (T0), a significant reduction was observed during further exposure to 20 ppt. Moreover, initial exposure (T0) showcased increased phosphorylation at 20 ppt compared to 8 and 14 ppt. On the contrary, at T15 exposure at higher salinities significantly decreased the phosphorylation levels compared to 8 ppt. Concerning T30, salinity increase from 8 to 14 ppt elevated p44/42 MAPK phosphorylation in the gills, while decreased levels compared to both 8 and 14 ppt were evident following exposure to 20 ppt. Moreover, phosphorylation levels significantly increased with increasing salinity at T45.
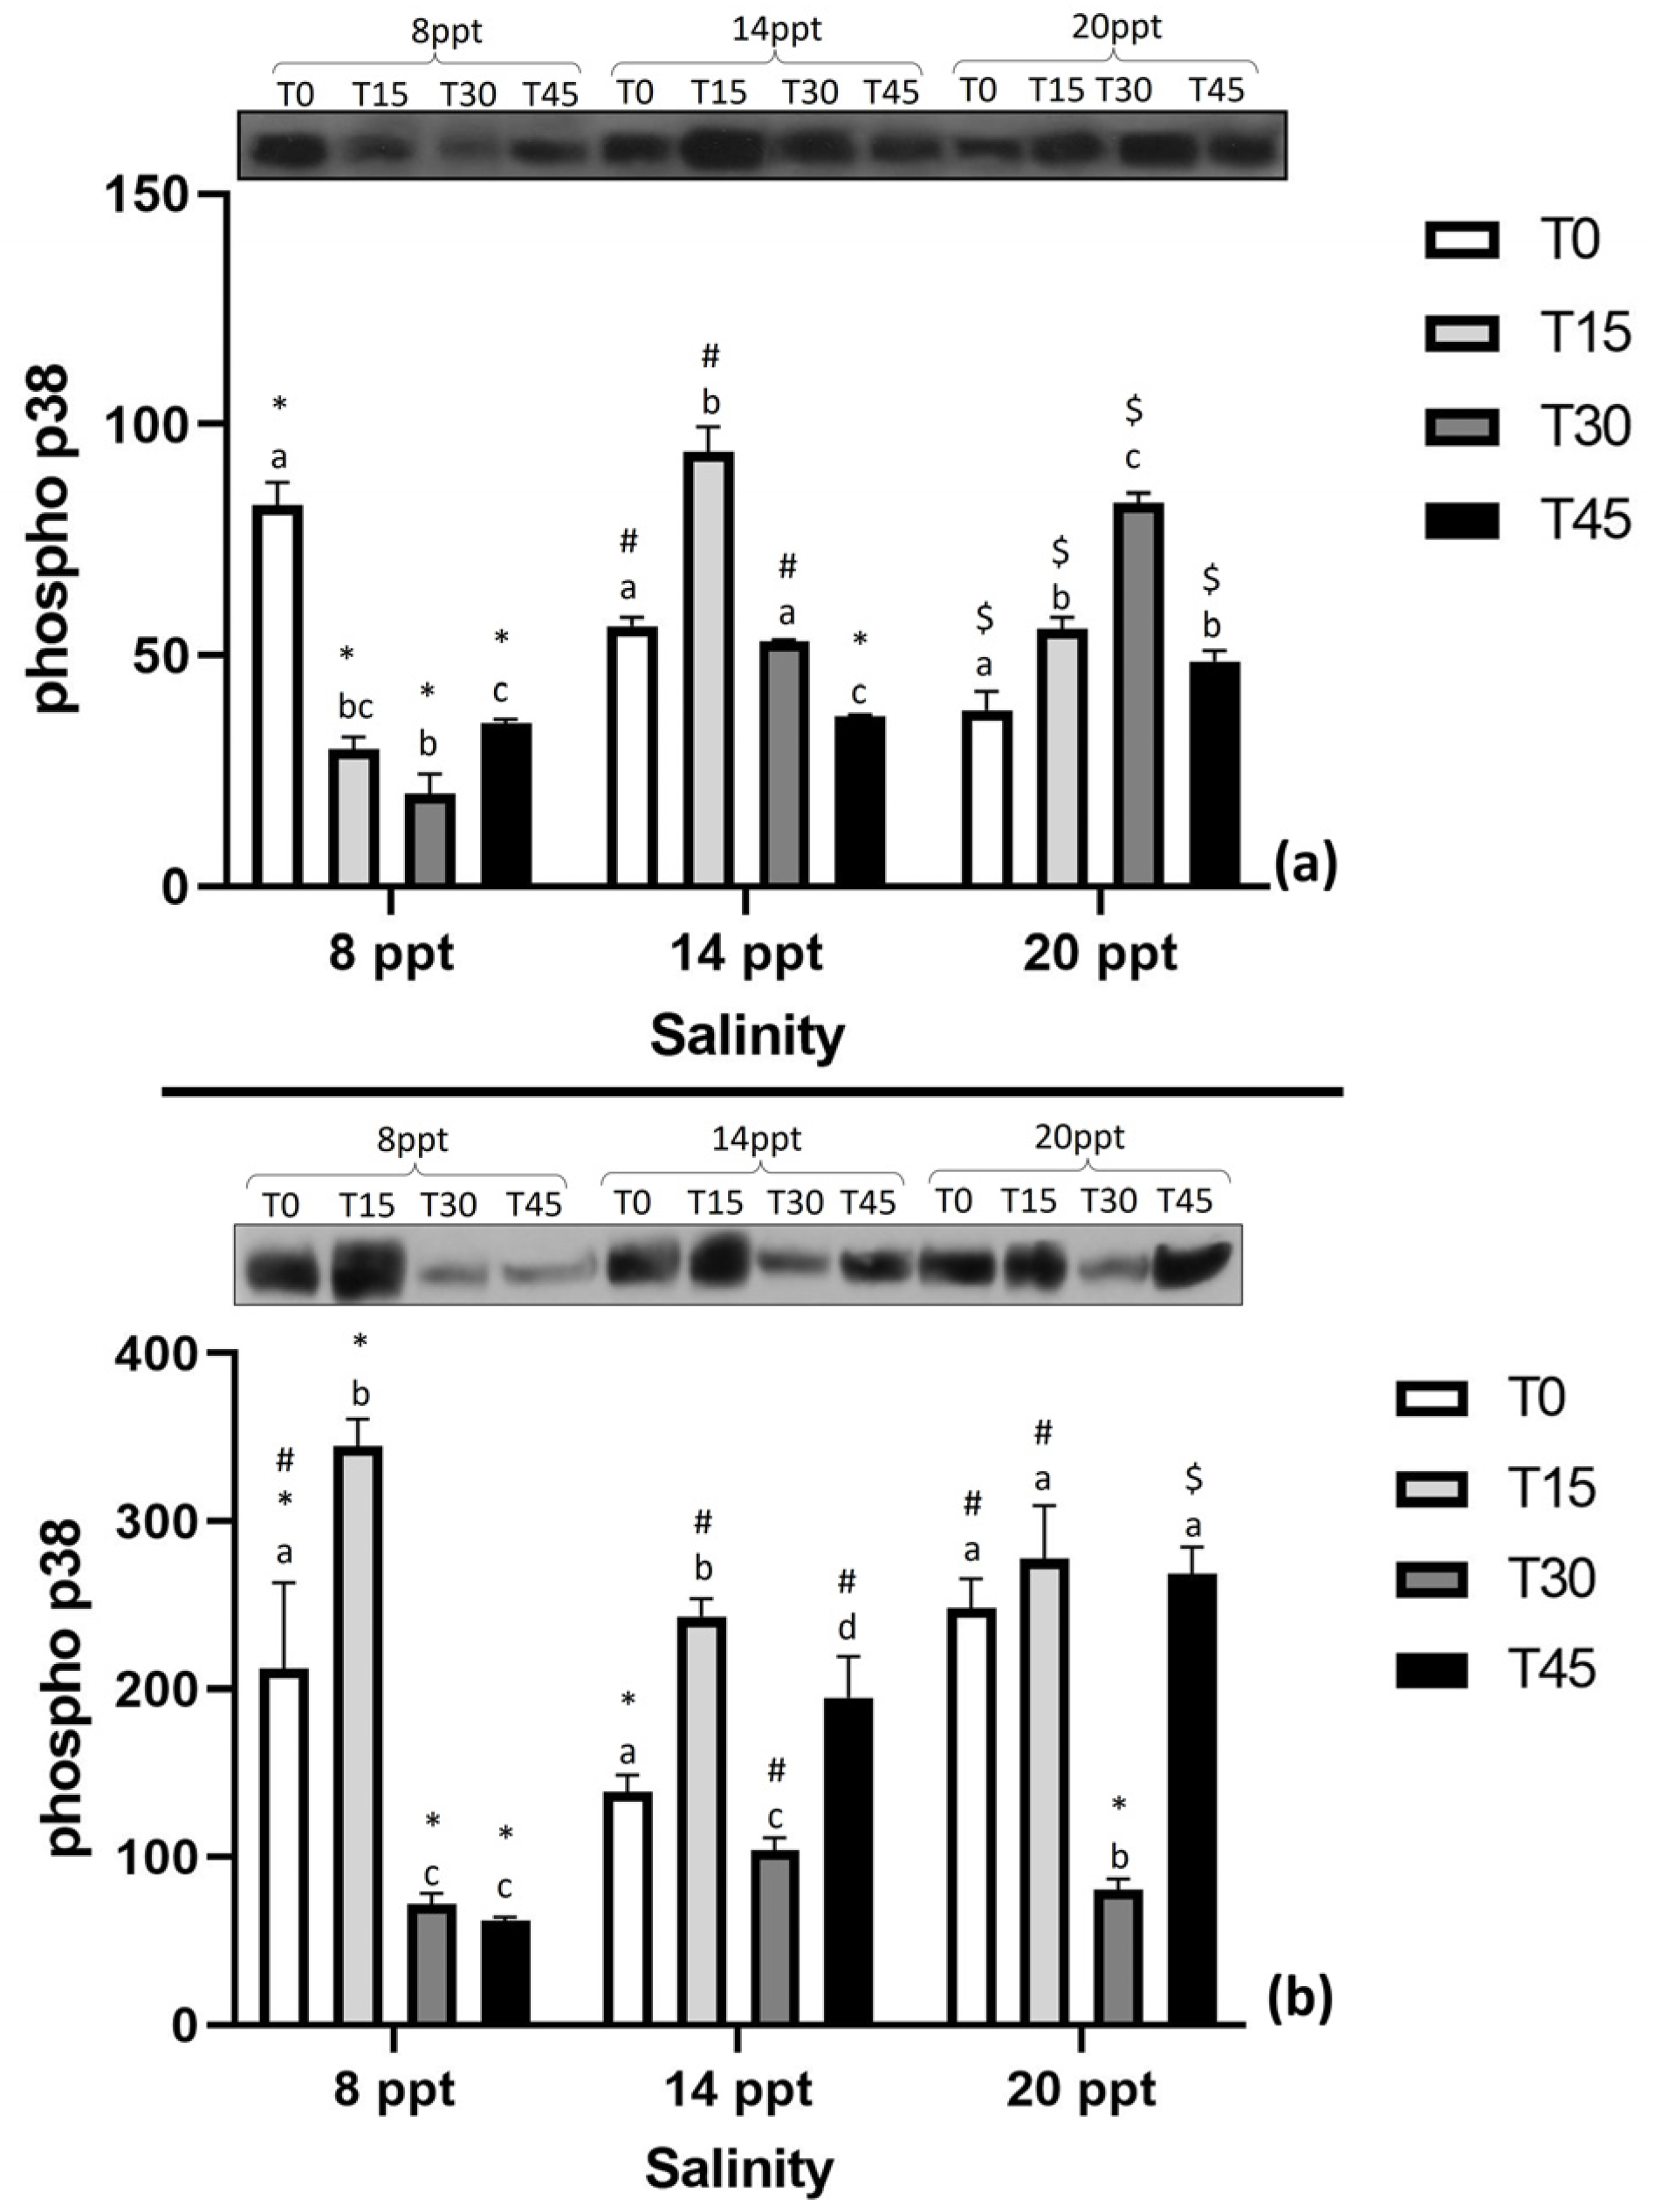
The phosphorylation of p38 MAPK in response to increasing salinity at different exposure times is presented in Figure 4. According to the two-way ANOVA analysis, salinity, time, and the cumulative effect of the two variables significantly influenced the phosphorylation of p38 MAPK in the liver and the gills (p < 0.01). Following exposure to 8 ppt, significantly decreased phosphorylated p38 MAPK levels were observed in the liver at T15, T30, and T45 compared to T0 (Figure 4a). Despite the increased hepatic phosphorylation of p38 MAPK at T15, prolonged exposure to 14 ppt for 45 days (T45) resulted in a significant decrease compared to T0. In contrast, exposure of gilthead sea bream to 20 ppt for 15, 30, and 45 days significantly elevated the phosphorylated p38 MAPK levels compared to T0. However, a significant reduction in the phosphorylation was apparent at T45 compared to T30. Concerning the exposure time, phosphorylated levels significantly decreased with increasing salinity at T0, while the opposite pattern was observed at T30. Elevation of phosphorylated p38 MAPK levels was observed following shift from 8 to 14 ppt at T15, while further increase in the salinity (20 ppt) led to a significant decrease compared to 14 ppt.
Regarding gills, exposure to 8 ppt resulted in significantly increased phosphorylated p38 MAPK levels at T15, while prolonged exposure (T30, T45) decreased the phosphorylation compared to T0 (Figure 4b). Compared to T0, a significant increase in phosphorylated levels was observed following exposure to 14 ppt at T15 and T45, while a decrease was apparent at T30. Similarly, phosphorylation of p38 MAPK was decreased in response to 20 ppt at T30 in comparison to T0, while no changes were observed at T15 and T45. In addition, no differentiations in the phosphorylated levels were observed at T0 compared to 8 ppt following exposure to higher salinities, while a significant decrease was apparent at T15. In contrast, phosphorylation displayed a significant elevation in response to increasing salinity at T45.

4. Discussion

4.1. Rearing Condition

Water quality parameters in all experimental treatments showed a stable fluctuation and were within limits reported by other researchers [7,8,12,17]. The results of the present study in terms of TANin and TANout show a range of values for all treatments ranging from 0.4 to 0.68 mg/L and 0.4–0.7 mg/L, respectively, without showing statistically significant differences. These values are higher than those reported by Vlahos et al. [7] in a brackish aquaponic system with gilthead sea bream and rock samphire at 8 ppt and 20 ppt salinities, which ranged from 0.33 to 0.39 mg/L. Additionally, much lower ammonia values (0.05 mg/L) were reported for sea bass in a brackish water aquaponics system [17] compared to the present study. In addition, much higher ammonia values than those of the present study were reported for tilapia reared in a freshwater and saltwater aquaponic system, which were 1.87 mg/L and 60.5 mg/L, respectively [44]. Other studies reported average ammonia values (range of 0.02 mg/L) in aquaponic systems with tilapia and various herbivorous species in fresh and brackish water of 1.2 ppt salinity [45], which are much lower than the present experiment.
Regarding the nitrate ions, the results show that nitrate ions (NO3) at the inlet checkpoint of the hydroponic tank reported herein (114.61 mg/L for 20 ppt salinity, 122.38 mg/L for 14 ppt salinity, and 120 mg/L at 8 ppt salinity with no significant differences) were higher than those (76.4–77.2 mg/L) reported by Vlahos et al. [7] in a brackish aquaponics system of 20 ppt and 8 ppt salinities with gilthead sea bream and rock samphire.
Concerning the nitrate ions at the water outlet from the hydroponic tanks, the results show a range of variation (109.76 ± 16.09 mg/L for 8 ppt salinity, 115.41 ± 14.73 mg/L for 20 ppt salinity, and 111.41 ± 17.83 mg/L for 14 ppt salinity) which was higher than those reported by Tasiou [46] for sea bass and rock samphire in an aquaponic system with 20 ppt, 14 ppt, and 8 ppt, respectively (8 ppt: 69.19 ± 6.81 mg/L, 14 ppt: 69.50 ± 7.35 mg/L, and 20 ppt: 70.81 ± 7.47 mg/L). Generally, it is known that high nitrate ions may indicate the aquaponic system’s proper functioning and increase the filter’s oxidative capacity [7,12,47,48].
Regarding the nitrite ions, the findings herein show no significant differences in both treatments (ANOVA, p > 0.05). The results from the present study are comparable to that of previous studies [17] reporting similar values of nitrite ions (0.1 mg/L) in a brackish aquaponics system co-cultivating sea bass and Beta vulgaris var. cicla. Previous own studies [7] reported a more comprehensive range of variations in nitrite ion concentration between 0.82 and 0.89 mg/L in a brackish aquaponic system with co-cultivated gilthead sea bream and rock samphire under salinities 20 ppt and 8 ppt. The analysis herein indicated no statistical differences in PO4=in and PO4=out in both treatments (ANOVA, p > 0.05), and these were lower compared to those reported by Stathopoulou et al. [8] in an aquaponic system with seabass and lettuce. In general, the PO4= concentrations are expected to range between 3 and 52 mg/L [49,50].
In this study, the pH in fish tanks (pHFT) varied between 6.0 and 6.5, while the pHGB in grow beds varied between 6.3 and 6.6. These values were lower than those previously reported by Vlahos et al. [7] (7.54 to 7.73) or by Tasiou [46] (6.88 to 7.08) in brackish aquaponics systems. It has been shown that pH in aquaponic systems is one of the main factors affecting fish metabolism and microbial activities, thus influencing the nitrogen supply [51,52,53]. Furthermore, it is known that pH also regulates the solubility of micronutrients such as calcium, phosphorus, potassium, magnesium, etc., and affects the bioavailability of nutrients for uptake by plants [54]. The optimum acceptable pH range for plants in hydroponic systems is pH 5.5–pH 6.5, as nutrient uptake is reduced under pH values greater than 7.0 [46]. The differences between the rearing conditions followed in the present study and those of other studies discussed herein are likely due to (i) hydraulic loading ratio, (ii) oxidation capacity of the filter bed, (iii) filter conditioning, (iv) concentration of nitrogen produced in the aquatic system, (v) nitrogen excretion rate of fish, (vi) nitrogen conversion rate of filter bed bacteria, (vii) size of the filter bed, (viii) environmental variables such as salinity and pH and their effects on the carrying capacity of the systems.

4.2. Fish and Plant Growth Performance

The present study investigated aquaponics in brackish water using salt-tolerant native Mediterranean fish and plant resources (gilthead sea bream and rock samphire) with high commercial and nutritional value. Sea bream is included among the most important aquaculture species cultivated in the Mediterranean region. According to Sadek et al. [55], gilthead sea bream, as a natural euryhaline species, shows increased adaptability to salinity fluctuations allowing it to grow well at low salinities thus occuping an important role in brackish water aquaponic systems [7]. On the other hand, rock samphire, a natural halophyte of the Mediterranean region, is suggested herein as an appropriate species for brackish water aquaponic systems, especially at low salinities (8 ppt) [7].
According to the results of the present study, salinity affected both the specific growth rate (SGR) of gilthead sea bream and the growth performance of rock samphire. Moreover, the results show that gilthead sea bream in the brackish aquaponics system had a high SGR at salinities 20 ppt and 8 ppt (SGR8ppt = SGR20ppt = 3.6%/day) than 14 ppt, which was lower (SGR14ppt = 3.1%/d), high survival rate (S8ppt = 96%, S20ppt = 90%, and S14ppt = 97%), and high FCR. Previous studies [7] reported that gilthead sea bream cultured in a brackish aquaponic system with 20 ppt and 8 ppt salinities show SGR 3.1%/d for both salinities (8 ppt, 20 ppt) which is in agreement to the SGR values of the 14 ppt salinity treatment and lower than 20 ppt and 8 ppt treatments observed in the present study. Other studies [37] reported that 20 g gilthead sea bream cultured in a brackish aquaculture system for 100 days show better growth performance in 12 ppt (1.99%/d) compared to 28 ppt (1.91%/d) and 6 ppt (1.79%/d); however, these values are lower than the SGR findings reported in the present study. At 12 ppt salinity, euryhaline fish, such as gilthead sea bream, seem to operate close to the isotonic environment [37], and therefore the energy cost required to supply its osmoregulatory requirements would be lower compared to higher salinities (28 ppt) or lower salinities (6 ppt), thus saving energy to cover other physiological functions, such as growth [56]. The effect of salinity on growth rate can be used as a mediator between osmotic energy cost and ionic regulation by rectifying the energy required for fish growth [56]. In previous studies [57], it was reported that hormones, such as prolactin, cortisol, and the growth hormone contribute to the adaptation of the species to a hypoosmotic or hyperosmotic living environment.
The findings of the present study show that no significant differences (ANOVA, p > 0.05) were detected in weight gain (WG) and body weight increase (BWI %), and these were lower compared to those reported previously in brackish aquaponic systems at 20 ppt and 8 ppt salinities [7]. At the end of the experiment, there were no significant differences in the survival rates of gilthead sea bream (90% for salinity 20 ppt, 97% for salinity 14 ppt, and 96% for salinity 8 ppt).
Rock samphire showed significantly better growth performance in 8 ppt in terms of plant height, fresh weight of the aerial part, and height gain rate compared to 20 ppt and 14 ppt salinities. The results from the present study are in agreement with those reported by Vlahos et al. [7] and Tasiou [46] and actually confirm its suitability for brackish aquaponics with controlled salinity levels. In cultivating plants, it is known that high salinities may significantly reduce leaf growth due to the inhibition of cell division induced [58]. Some studies indicate that some crops, such as Fragaria spp. and Lactuca sativa, can be grown in brackish aquaponics systems at 1.2 ppt salinity showing fairly good growth [44]. However, natural halophytes can survive and reproduce in salt concentrations around 200 mmol/L NaCl or even higher (>12 ppt) [36,59]. For example, the optimal growth of the halophyte Salicornia rubra occurs at 200 mM NaCl [60] and decreases with increasing salinity (>200 mM). Previous studies indicate that the optimum salinity level for rock samphire’s growth performance is 50 mM NaCl [61], a value that is similar to the 8 ppt salinity used in the present study. Studies on the salt–stress adaptation mechanisms of plants examining the protein expression patterns of Salicornia europaea revealed that energy production and ion homeostasis-associated proteins play essential roles in the plant’s salt tolerance ability [34].

4.3. Fish Histology

The kidney granulomas that were detected in all of the three salinity groups are difficult to be explained. Diet, water temperature, and stress factors [62,63] are reasons that can lead to granulomas formation in kidney. According to Herman [62], visceral granuloma is associated with diet. For sea bream especially, prevalence of systemic granuloma is correlated with long-term storage of formulated feeds, fish meal, or frozen fish [62]. Baudin-Laurencin and Messager [63] suggested that insufficient levels of ascorbic acid in the liver and diets relatively rich in protein and poor in ascorbic acid can also cause granulomas in sea bream’s kidney. Sea bass and sea breams that were successfully adapted to freshwater show smaller collecting ducts than those cultivated in seawater [7,64], which is in line with the results of the present study. The kidney granulomas that were detected in all of the three salinity groups are likely correlated with the long-term storage of formulated feeds or with ascorbic acid deficiency [62,63]. The minimal or mild histopathological alterations that were detected in gills, midgut, and liver for all of the three salinity groups may indicate that the fish were well adapted to different water salinity. Same results were reported previously [7], indicating a successful adaptation to 8‰ and 20‰ salinity with mild and moderate alterations in the structure of liver, kidney, and gills.

4.4. Expression of Stress-Related Proteins

Deviations from optimum ambient salinity may disrupt the equilibrium between generation and neutralization of reactive oxygen species (ROS), thus leading to induction of oxidative stress in aquatic organisms (see review in [65]). The capacity of animals to cope with severe environmental stress, including extreme salinity fluctuations largely relies on the cellular stress response (CSR), an evolutionarily conserved physiological mechanism [66]. Exposure to severe salinities induces several CSR components including Hsps, which, among other functions, protect and repair protein structure due to alterations in the cellular ion regulation [66,67]. Herein, the gilthead sea breams subjected to different salinities showcased a tissue- and time-specific induction of Hsp60. Specifically, regardless of the salinity, hepatic levels of Hsp60 were initially elevated during the first 15 days and subsequently decreased following prolonged exposure. In accordance with the latter results, Liza haematocheila subjected to salinity of 2, 28, and 42 ppt displayed an initial increase in the Hsp90 mRNA expression during the first days, while decreased levels were prominent following further exposure [68].
On the contrary, Hsp60 induction was evident herein in the gills as a response to prolonged exposure to 14 and 20 ppt, as well as during the first 30 days of exposure to the hypotonic environment (8 ppt). Gills, the major respiratory and ionoregulatory organ of fish, are directly exposed to the surrounding water, and thus have to continuously contend with fluctuations in environmental factors [69]. Salinity alterations are known to result in unchanged Hsps levels in the gills of several fish species [70,71]. For instance, shifting from fresh water to seawater may exert no influence on the levels of Hsp90 mRNA in the gills of Chinook salmon (Oncorhynchus tshawytscha) [71]. However, increased Hsps expression as observed herein was also reported in the gills of several fish species including black porgy (Acanthopagrus schlegeli) [72] and sea bream (Sparus sarba) [73] in response to osmotic stress.
The contrast in the Hsp60 expression pattern observed herein among the two examined tissues indicates a more prominent and constant protective role in the gills and an immense recruitment of molecular chaperones to facilitate the adaptive response to salinity stress. On the other hand, liver seemed to be subjected to an initial salinity-induced stress state, thus requiring the functional involvement of Hsp60 facilitating the subsequent recovery period. Previous studies suggested that metabolically active organs are able to efficiently cope with environmental perturbations and restore the prestress state [67].
In addition, cellular response to environmental stressors may include the activation of the MAPK signaling pathway, which was demonstrated in a plethora of fish species (e.g., [40,74,75]). During changes in salinity, MAPKs are involved in osmosensory signaling pathways, such as the regulation of inorganic ions and organic osmolytes intracellular levels, thus mediating the physiological acclimation [76,77]. Several fish species subjected to hypotonic and/or hypertonic environments were reported to display up-regulation of MAPKs members [78,79]. Herein, the phosphorylation of p38 MAPK in gilthead sea bream gills during exposure to 8 and 14 ppt showcased an elevation at the first 15 days, where simultaneously phosphorylated p44/42 MAPK levels were also increased under the hypotonic regime. Similarly, previous studies [78] demonstrated that MAPKs activity in the gill epithelium of the euryhaline teleost Fundulus heteroclitus is more prominent during hyposmotic stress. Thereby, due to the direct interaction with the surrounding water, gills may be more prone to a hypotonic environment, and MAPKs phosphorylation is probably required in gilthead sea bream physiological acclimation and adaptation. Although triggering of MAPK members as a hypotonic stress response seems to occur directly, the peak and the subsequent decrease in activity depends on the cell type [77]. The latter is evident in the present study considering that exposure to 8 ppt exerted opposite effects in the liver of gilthead sea bream compared to the gills. Specifically, phosphorylated levels of both p38 and p44/42 MAPK significantly decreased during the period of exposure to 8 ppt. In contrast to the hypotonic stress, elevated hepatic levels of phospho-p38 MAPK were more evident following the exposure to 20 ppt, which is in agreement with the increased levels observed in the liver of Alburnus vistonicus during a period of high mean salinity [75]. Activation of p38 MAPK, a key mediator in the hyperosmotic signaling response pathway, may indicate involvement in the osmolyte transport regulation during regulatory volume increase [80,81]. Furthermore, contrarily to the cell shrinkage via p38 activation, p44/42 MAPK seems to mediate cell swelling [80], which is consistent with the present findings concerning the higher phospho-p44/42 levels in the liver of gilthead sea bream exposed to 8 ppt compared to 20 ppt at the same time periods.

5. Conclusions

Climate change immensely affects, to date, food production in agriculture with severe global impacts. Climate change and the subsequent severe global impacts immensely affects food production in agriculture. The interest of industry and producers is focused on the development of sustainable food production with alternative, innovative, and environmentally friendly farming methods, such as aquaponics. The results of the present study indicate that rock samphire was able to efficiently utilize nutrients derived from gilthead sea bream metabolites for plant growth even under salinity stress conditions. Specifically, the plants showed optimal growth performance at 8 ppt compared to 14 and 20 ppt, with the latter two levels being considered extremely high even for halophytes. The expression of stress-induced proteins (Hsps and MAPKs) in gilthead sea bream was differentiated according to the examined tissue and the exposure time, thus presenting tissue-specific patterns. However, both Hsps and MAPKs seem to be recruited for the adaptation of such a euryhaline teleost to salinity changes. The results herein document that both co-cultured species may represent promising candidate species for effective cultivation and rearing in brackish water aquaponics systems, with multiple benefits associated with feasible future applications in agriculture.

Supplementary Materials

The following supporting information can be downloaded at: https://www.mdpi.com/article/10.3390/app13063385/s1, Figure S1: Normal tissue histology of Sparus aurata: (A) Liver, (B) Midgut, (C) Kidney, (D) Gills.

Author Contributions

Conceptualization, N.V., P.B., E.L., E.A. and E.M., methodology, N.V., E.P.; N.P., M.D., K.M., G.V., N.V., P.B., E.L., E.A. and E.M.; software, N.V., P.B. and E.M., validation, N.V., P.B., E.M. and E.A.; formal analysis, N.V., N.P., E.A., E.M., E.L., N.K. and P.B.; investigation, N.V., P.B., E.L. E.P., E.A., N.P., M.D, K.M., G.V., N.K., K.K. and E.M., resources, N.V., P.B., E.L. E.P.,E.A., N.P., M.D, K.M., G.V., N.K., K.K. and E.M.; data curation, N.V., P.B., E.L., E.M. and E.A.; writing—original draft preparation, N.V., P.B., E.L., E.A., N.P., N.K., K.K. and E.M.; writing—review and editing, N.V., P.B., E.L., N.P., N.K., E.A. and E.M.; visualization, N.V., P.B., E.L., N.P. and E.A.; supervision, E.M., N.V. and E.A.; project administration, N.V., P.B., E.L., E.A. and E.M. All authors have read and agreed to the published version of the manuscript.

Funding

This research received no external funding.

Institutional Review Board Statement

All experimental procedures were conducted according to the guidelines of EU Directive 2010/63/EU regarding the protection of animals used for scientific purposes and were applied by FELASA accredited scientists (functions A–D). The experimental protocol was approved by the Ethics Committee of the Region of Thessaly, Veterinary Directorate, Department of Animal Protection-Medicines-Veterinary Applications. The experiment was conducted at the registered experimental facility (EL-43BIO/exp-01) of the Laboratory of Aquaculture, Department of Ichthyology and Aquatic Environments, University of Thessaly.

Informed Consent Statement

Not applicable.

Data Availability Statement

Not applicable.

Acknowledgments

The authors wish to express their thanks to I. Mitsopoulos, K. Babouklis, C. Stefanou and A. Agapitos for their help with the experimental procedure. In addition, the authors are very grateful to PHILOSOFISH SA and BIOMAR for the generous sponsorship of the gilthead sea bream fish (Sparus aurata) and feed used in the experiment, respectively.

Conflicts of Interest

The authors declare no conflict of interest.

References

  1. Horton, B.P.; Rahmstorf, S.; Engelhart, S.E.; Kemp, A.C. Expert assessment of sea-level rise by AD 2100 and AD 2300. Quat. Sci. Rev. 2014, 84, 1–6. [Google Scholar] [CrossRef]
  2. van Wijk, E.M.; Rintoul, S.R. Freshening drives contraction of Antarctic bottom water in the Australian Antarctic Basin. Geophys. Res. Lett. 2014, 41, 1657–1664. [Google Scholar] [CrossRef]
  3. Nielsen, U.N.; Wall, D.H.; Adams, B.J.; Virginia, R.A.; Ball, B.A.; Gooseff, M.N.; McKnight, D.M. The ecology of pulse events: Insights from an extreme climatic event in a polar desert ecosystem. Ecosphere 2012, 3, 1–15. [Google Scholar] [CrossRef]
  4. Kültz, D. Physiological mechanisms used by fish to cope with salinity stress. J. Exp. Biol. 2015, 218, 1907–1914. [Google Scholar] [CrossRef] [PubMed] [Green Version]
  5. Palm, H.W.; Knaus, U.; Applebaum, S.; Strauch, S.M.; Kotzen, B. Coupled aquaponic systems. In Aquaponics Food Production Systems; Goddek, S., Joyce, A., Kotzen, B., Burnell, G.B., Eds.; Springer Nature: Cham, Switzerland, 2019; pp. 163–199. [Google Scholar] [CrossRef]
  6. Goddek, S.; Joyse, A.; Kotzen, B.; Burnell, G. Aquaponics Food Production Systems. Combined Aquaculture and Hydroponic Production Technologies for the Future; Goddek, S., Joyse, A., Kotzen, B., Burnell, G., Eds.; Springer Nature: Cham, Switzerland, 2019; pp. 3–619. [Google Scholar]
  7. Vlahos, N.; Levizou, E.; Stathopoulou, P.; Berillis, P.; Antonopoulou, E.; Bekiari, V.; Krigas, N.; Kormas, K.; Mente, E. An experimental brackish aquaponic system using juvenile gilthead sea bream (Sparus aurata) and rock samphire (Crithmum maritimum). Sustainability 2019, 11, 4820. [Google Scholar] [CrossRef] [Green Version]
  8. Stathopoulou, P.; Asimaki, A.; Berillis, P.; Vlahos, N.; Levizou, E.; Katsoulas, N.; Karapanagiotidis, I.T.; Rumbos, C.I.; Athanassiou, C.G.; Mente, E. Aqua-Ento-Ponics: Effect of insect meal on the development of sea bass, Dicentrarchus labrax, in co-culture with lettuce. Fishes 2022, 7, 397. [Google Scholar] [CrossRef]
  9. Nelson, R.L. Aquaponic Food Production: Growing Fish and Vegetables for Food and Profit; Nelson, R.L., Pade, J.S., Eds.; Nelson and Pade, Inc.: Montello, WI, USA, 2008; p. 224. [Google Scholar]
  10. Fronte, B.; Galliano, G.; Bibbiani, C. From freshwater to marine aquaponic: New opportunities for marine fish species production. In Proceedings of the 4th Conference with International Participation Conference VIVUS-on Agriculture, Environmentalism, Horticulture and Floristics, Food Production and Processing and Nutritioh “With Knowledge and Experience to New Entrepreneurial Opportunities”, Slovenia, Poland, 20–21 April 2016. [Google Scholar]
  11. Stathopoulou, P.; Berillis, P.; Vlahos, N.; Nikouli, E.; Kormas, K.; Levizou, E.; Katsoulas, N.; Mente, E. Freshwater-adapted sea bass Dicentrarchus labrax feeding frequency impact in a lettuce Lactuca sativa aquaponics system. PeerJ 2021, 9, e11522. [Google Scholar] [CrossRef] [PubMed]
  12. Somerville, C.; Cohen, M.; Pantanella, E.; Stankus, A.; Lovatelli, A. Small-Scale Aquaponic Food Production: Integrated Fish and Plant Farming; FAO: Rome, Italy, 2014; pp. 16–18, 22–26, 75–81. [Google Scholar]
  13. Gunning, D. Cultivating Salicornia europaea (marsh samphire). In BIM; Watson, L., Ed.; Irish Sea Fisheries Board Marine Research Station & University College Cork: Dublin, Ireland, 2016; Volume 4, pp. 1–95. [Google Scholar]
  14. Delaide, B.; Delhaye, G.; Dermience, M.; Gott, J.; Soyeurt, H.; Jijakli, M.H. Plant and fish production performance, nutrient mass balances, energy and water use of the PAFF Box, a small-scale aquaponic system. J. Aquac. Eng. Fish. Res. 2017, 78, 130–139. [Google Scholar] [CrossRef]
  15. Colt, J.; Schuur, M.A.; Weaver, D.; Semmens, K. Engineering design of aquaponics systems. Rev. Fish. Sci. Aquac. 2021, 30, 33–80. [Google Scholar] [CrossRef]
  16. Li, G.; Taoa, L.; Lia, X.; Penga, L.; Songa, C.; Daia, L.; Wub, L.; Xieb, L. Design and performance of a novel rice hydroponic biofilter in a pond-scale aquaponic recirculating system. Ecol. Eng. 2018, 125, 1–10. [Google Scholar] [CrossRef]
  17. Nozzi, V.; Parisi, G.; Di Crescenzo, D.; Giordano, M.; Carnevali, O. Evaluation of Dicentrarchus labrax meats and the vegetable quality of Beta vulgaris var. cicla farmed in freshwater and saltwater aquaponic systems. Water 2016, 8, 423. [Google Scholar] [CrossRef] [Green Version]
  18. Theodorakaki, E.; Papadakis, G.; Kaloussias, S.; Mente, E.; Vlahos, N. Leaping grey mullet Liza saliens as an alternative and candidate fish species to be used in a brackish aquaponic system co-cultivating with plant Eruca sativa. In Proceedings of the 4th International Congress on Applied Ichthyology, Oceanography & Aquatic Environment, HydroMediT 2021, Virtual Congress, Mytilene, Greece, 4–6 November 2021. [Google Scholar]
  19. Thomas, R.M.; Verma, A.K.; Krishna, H.; Prakash, S.; Kumar, A.; Peter, R.M. Effect of salinity on growth of Nile tilapia (Oreochromis niloticus) and spinach (Spinacia oleracea) in aquaponic system using inland saline groundwater. Aquac. Res. 2021, 52, 6288–6298. [Google Scholar] [CrossRef]
  20. Stathopoulou, P.; Tsoumalakou, E.; Levizou, E.; Vanikiotis, T.; Zaoutso, S.S.; Berillis, P. Iron and potassium fertilization improve rocket growth without affecting Tilapia growth and histomorphology characteristics in aquaponics. Appl. Sci. 2021, 11, 5681. [Google Scholar] [CrossRef]
  21. Suarez-Caceres, G.P.; Quevedo-Ruiz, F.J.; Lobillo-Eguíbar, J.; Fernandez-Cabanas, V.M.; Quevedo-Ruiz, F.J.; Perez-Urrestarazua, L. Polyculture production of vegetables and red hybrid tilapia for self-consumption by means of micro-scale aquaponic systems. Aquac. Eng. 2021, 95, 1–11. [Google Scholar] [CrossRef]
  22. Holmes, W.N.; Donaldson, E.M. The body compartments and the distribution of electrolytes. Fish Physiol. 1969, 1, 1–89. [Google Scholar] [CrossRef]
  23. Kültz, D. 2—Osmosensing. Fish Physiol. 2012, 32, 45–68. [Google Scholar] [CrossRef]
  24. Nishida, E.; Gotoh, Y. The MAP kinase cascade is essential for diverse signal transduction pathways. Trends Biochem. Sci. 1993, 18, 128–131. [Google Scholar] [CrossRef] [PubMed]
  25. Kültz, D.; Burg, M. Evolution of osmotic stress signaling via MAP kinase cascades. J. Exp. Biol. 1998, 201, 3015–3021. [Google Scholar] [CrossRef] [PubMed]
  26. Tutar, L.; Tutar, Y. Heat shock proteins: An overview. Curr. Pharm. Biotechnol. 2010, 11, 216–222. [Google Scholar] [CrossRef] [PubMed]
  27. Roberts, R.J.; Agius, C.; Saliba, C.; Bossier, P.; Sung, Y.Y. Heat shock proteins (chaperones) in fish and shellfish and their potential role in relation to fish health: A review. J. Fish Dis. 2010, 33, 789–801. [Google Scholar] [CrossRef] [PubMed]
  28. Iwama, G.K.; Thomas, P.T.; Forsyth, R.B.; Vijayan, M.M. Heat shock protein expression in fish. Rev. Fish Biol. Fish. 1998, 8, 35–56. [Google Scholar] [CrossRef]
  29. Rakocy, J.E.; Bailey, D.S.; Shultz, R.C.; Danaher, J.J. Preliminary evaluation of organic wastes from two aquaponic systems as a source of inorganic nutrients for hydroponics. Acta Hortic. 2007, 742, 201–208. [Google Scholar] [CrossRef]
  30. Wongkiew, S.; Hu, Z.; Chandran, K.; Lee, J.W.; Kumar Khanal, S. Nitrogen transformations in aquaponic systems: A review. J. Aquac. Eng. Fish. Res. 2017, 76, 9–19. [Google Scholar] [CrossRef] [Green Version]
  31. Grigore, M.-N.; Toma, C. Morphological and anatomical adaptations of halophytes: A review. In Handbook of Halophytes: From Molecules to Ecosystems towards Biosaline Agriculture; Springer: Cham, Switzerland, 2021; pp. 1079–1221. [Google Scholar]
  32. Aghaleh, M.; Niknam, V.; Ebrahimzadeh, H.; Razavi, K. Effect of salt stress on physiological and antioxidative responses in two species of Salicornia (S. persica and S. europaea). Acta Physiol. Plant. 2011, 33, 1261–1270. [Google Scholar] [CrossRef]
  33. Rena, M. Reviewing the prospects of sea fennel (Crithmum maritimum L.) as emerging vegetable crop. Plants 2018, 7, 92. [Google Scholar] [CrossRef] [PubMed] [Green Version]
  34. Wang, X.; Fan, P.; Song, H.; Chen, X.; Li, X.; Li, Y. Comparative proteomic analysis of differentially expressed proteins in shoots of Salicornia europaea under different salinity. J. Proteome Res. 2009, 8, 3331–3345. [Google Scholar] [CrossRef] [PubMed]
  35. Cabot, C.; Sibole, J.V.; Barceló, J.; Poschenrieder, C. Lessons from crop plants struggling with salinity. Plant Sci. 2014, 226, 2–13. [Google Scholar] [CrossRef]
  36. Flowers, T.J.; Comler, T.D. Salinity tolerance in halophytes. New Phytol. 2008, 179, 945–963. [Google Scholar] [CrossRef]
  37. Laiz-Carrión, Ρ.; Sangiao-Alvarellos, S.; Guzmán, J.M.; Martín del Río, M.P.; Soengas, J.L.; Mancera, J.M. Growth performance of gilthead sea bream Sparus aurata in different osmotic conditions: Implications for osmoregulation and energy metabolism. Aquaculture 2005, 250, 849–861. [Google Scholar] [CrossRef]
  38. Deering, M.J.; Fielder, D.R.; Hewitb, D.R. Growth and fatty acid composition of juvenile leader prawns, Penaeus monodon, fed different lipids. Aquaculture 1997, 151, 131–141. [Google Scholar] [CrossRef]
  39. Johnson, R.; Wolf, J.; Braunbeck, T. Guidance Document on the Diagnosis of Endocrine-Related Histopathology in Fish Gonads; Organisation for Economic Co-Operation and Development: Paris, France, 2009; p. 96. [Google Scholar]
  40. Antonopoulou, E.; Chatzigiannidou, I.; Feidantsis, K.; Kounna, C.; Chatzifotis, S. Effect of water temperature on cellular stress responses in meagre (Argyrosomus regius). Fish Physiol. Biochem. 2020, 46, 1075–1091. [Google Scholar] [CrossRef]
  41. Mente, E.; Solovyev, M.M.; Vlahos, N.; Rotllant, G.; Gisbert, E. Digestive enzymes activity during initial ontogeny and after feeding diets with different protein sources in zebra cichlid Archocentrus nigrofasciatus. J. World Aquac. Soc. 2016, 48, 831–848. [Google Scholar] [CrossRef]
  42. Endut, A.; Jusoh, A.; Ali, N.; Wan-Nik, W.; Hassan, A. A study on the optimal hydraulic loading rate and plant ratios in recirculation aquaponic system. Bioresour. Technol. 2010, 101, 1511–1517. [Google Scholar] [CrossRef] [PubMed]
  43. Zar, J.H. Biostatistical Analysis; Prentice-Hall: London, UK, 1999; p. 718. [Google Scholar]
  44. Kotzen, B.; Appelbaum, S. An investigation of aquaponics using brackish water resources in the Negev Desert. J. Appl. Aquac. 2010, 22, 297–320. [Google Scholar] [CrossRef]
  45. Appelbaum, S.; Kotzen, B. Further investigations of aquaponics using brackish water resources of the Negev desert. Ecocycles 2016, 2, 26–35. [Google Scholar] [CrossRef] [Green Version]
  46. Tasiou, K. The Production Process of Sea Bass in an Aquaponic System. Master’s Thesis, Department of Ichthyology and Aquatic Environment, School of Agricultural Sciences, University of Thessaly, Volos, Greece, 2019. [Google Scholar]
  47. Spotte, S. Captive Seawater Fishes; John Wiley & Sons: New York, NY, USA, 1992; p. 942. [Google Scholar]
  48. Endut, A.; Jusoh, A.; Ali, N.; Wan Nik, W.N.; Hassan, A. Effect of flow rate on water quality parameters and plant growth of water spinach (Ipomoea aquatica) in an aquaponic recirculating system. Desalin. Water Treat. 2009, 5, 19–28. [Google Scholar] [CrossRef]
  49. Rakocy, J.; Shultz, R.C.; Bailey, D.S.; Thoman, E.S. Aquaponic production of Tilapia and basil: Comparing a batch and staggered cropping system. Acta Hortic. 2004, 648, 63–69. [Google Scholar] [CrossRef]
  50. Lennard, W.A.; Leonard, B.V. A comparison of three different hydroponic sub-systems (gravel bed, floating and nutrient film technique) in an aquaponic test system. Aquac. Int. 2006, 14, 539–550. [Google Scholar] [CrossRef]
  51. Kuhn, D.D.; Lawrence, L.A.; Boardman, D.G.; Patnaik, S.; Marsh, L.; George, J.; Flick, J. Evaluation of two types of bioflocs derived from biological treatment of fish effluent as feed ingredients for Pacific white shrimp, Litopenaeus vannamei. Aquaculture 2010, 303, 28–33. [Google Scholar] [CrossRef]
  52. Taiz, L.; Zeiger, E. Plant Physiology, 3rd ed.; Sinauer Associates, Inc.: Sunderland, MA, USA, 2002; pp. 67–86. [Google Scholar]
  53. Zou, Y.; Hu, Z.; Zhang, J.; Xie, H.; Guimbaud, C.; Fang, Y. Effects of pH on nitrogen transformations in media-based aquaponics. Bioresour. Technol. 2016, 210, 81–87. [Google Scholar] [CrossRef]
  54. Resh, M.H. (Ed.) 2013 Hobby Hydroponics; Taylor and Francis Group: Boca Raton, FL, USA, 2013; p. 129. [Google Scholar]
  55. Sadek, S.S.; Fathy Osman, M.; Adel Mansour, M. Growth, survival and feed conversion rates of sea bream (Sparus aurata) cultured in earthen brackish water ponds fed different feed types. Aquac. Int. 2004, 12, 409–421. [Google Scholar] [CrossRef]
  56. Boeuf, G.; Payan, P. How should salinity influence fish growth? Comp. Biochem. Physiol. C Toxicol. Pharmacol. 2001, 130, 411–423. [Google Scholar] [CrossRef]
  57. Laiz-Carrión, R.; Martín del Río, M.P.; Miguez, J.M.; Mancera, J.M.; Soengas, J.L. Influence of cortisol on osmoregulation and energy metabolism in gilthead sea bream Sparus aurata. J. Exp. Zool. 2003, 298A, 105–118. [Google Scholar] [CrossRef] [PubMed]
  58. Chartzoulakis, K.; Klapaki, G. Response of two greenhouse pepper hybrids to NaCl salinity during different growth stages. Sci. Hortic. 2000, 86, 247260. [Google Scholar] [CrossRef]
  59. Mohammadi, H.; Kardan, J. Morphological and physiological responses of some halophytes to salinity stress. Ann. Univ. Mariae Curie Sklodowska Sect. C Biol. 2016, 70, 31. [Google Scholar] [CrossRef]
  60. Khan, Μ.A.; Gul, Β.; Weber, J.D. Effect of salinity on the growth and ion content of Salicornia rubra. Soil. Sci. Plant. Anal. 2001, 32, 2965–2977. [Google Scholar] [CrossRef]
  61. Ben Amor, N.; Ben Hamed, K.; Debez, A.; Grignon, C.; Abdelly, C. Physiological and antioxidant responses of the perennial halophyte Crithmum maritimum to salinity. Plant Sci. 2005, 168, 889–899. [Google Scholar] [CrossRef]
  62. Herman, R.L. Systemic Noninfectious Granulomatoses of Fishes; National Biological Service, Leetown Science Center, National Fish Health Research Laboratory: Kearneysville, WV, USA, 1996; p. 9. [Google Scholar]
  63. Baudin-Laurencin, F.; Messager, J.L. Granulomatous hypertyrosonaemia. In ICES (International Council for the Exploration of the Sea) Identification Leaflets for Diseases and Parasites of Fish and Shellfish; DK-1261; ICES: Copenhagen, Denmark, 1991; Volume 41, p. 4. ISSN 0109-2510. [Google Scholar]
  64. Nebel, C.; Romestand, B.; Nègre-Sadargues, G.; Grousset, E.; Aujoulat, F.; Bacal, J.; Charmantier, G. Differential freshwater adaptation in juvenile sea-bass Dicentrarchus labrax involves gills and urinary system. J. Exp. Biol. 2005, 208, 3859–3871. [Google Scholar] [CrossRef] [Green Version]
  65. Lushchak, V.I. Environmentally induced oxidative stress in aquatic animals. Aquat. Toxicol. 2011, 101, 13–30. [Google Scholar] [CrossRef] [PubMed]
  66. Evans, T.G.; Kültz, D. The cellular stress response in fish exposed to salinity fluctuations. J. Exp. Zool. A Ecol. 2020, 333, 421–435. [Google Scholar] [CrossRef] [PubMed]
  67. Deane, E.E.; Kelly, S.P.; Luk, J.C.; Woo, N. Chronic salinity adaptation modulates hepatic heat shock protein and insulin-like growth factor I expression in black sea bream. J. Mar. Biotechnol. 2002, 4, 193–205. [Google Scholar] [CrossRef] [PubMed]
  68. Shen, A.; Jiang, K.; Wang, J.; Shen, X. Effects of salinity on growth, feeding and the mRNA expression of Na+/K+-ATPase and HSP 90 in Liza haematocheila. Ecol. Res. 2015, 3, 51–59. [Google Scholar] [CrossRef] [Green Version]
  69. Deane, E.E.; Woo, N. Advances and perspectives on the regulation and expression of piscine heat shock proteins. Rev. Fish Biol. Fish. 2011, 21, 153–185. [Google Scholar] [CrossRef]
  70. De Wachter, B.; Scholliers, A.; Blust, R. Semiquantitative immunoblot detection of 70 kDa stress proteins in the carp Cyprinus carpio. Bull. Environ. Contam. Toxicol. 1998, 60, 37–44. [Google Scholar] [CrossRef] [PubMed]
  71. Palmisano, A.N.; Winton, J.R.; Dickhoff, W.W. Tissue-specific induction of Hsp90 mRNA and plasma cortisol response in chinook salmon following heat shock, seawater challenge, and handling challenge. J. Mar. Biotechnol. 2000, 2, 329–338. [Google Scholar] [CrossRef] [PubMed]
  72. Choi, C.Y.; An, K.W. Cloning and expression of Na+/K+-ATPase and osmotic stress transcription factor 1 mRNA in black porgy, Acanthopagrus schlegeli during osmotic stress. Comp. Biochem. Physiol. B Biochem. Mol. Biol. 2008, 149, 91–100. [Google Scholar] [CrossRef] [PubMed]
  73. Deane, E.E.; Woo, N.Y. Differential gene expression associated with euryhalinity in sea bream (Sparus sarba). Am. J. Physiol. Regul. Integr. Comp. Physiol. 2004, 287, R1054–R1063. [Google Scholar] [CrossRef] [PubMed] [Green Version]
  74. Feidantsis, K.; Poertner, H.O.; Antonopoulou, E.; Michaelidis, B. Synergistic effects of acute warming and low pH on cellular stress responses of the gilthead seabream Sparus aurata. J. Comp. Physiol. 2015, 185, 185–205. [Google Scholar] [CrossRef]
  75. Tsakoumis, E.; Tsoulia, T.; Feidantsis, K.; Mouchlianitis, F.A.; Berillis, P.; Bobori, D.; Antonopoulou, E. Cellular stress responses of the endemic freshwater fish species Alburnus vistonicus Freyhof & Kottelat, 2007 in a constantly changing environment. Appl. Sci. 2021, 11, 11021. [Google Scholar] [CrossRef]
  76. Fiol, D.F.; Kültz, D. Osmotic stress sensing and signaling in fishes. FEBS Lett. 2007, 274, 5790–5798. [Google Scholar] [CrossRef] [PubMed]
  77. Zhou, X.; Naguro, I.; Ichijo, H.; Watanabe, K. Mitogen-activated protein kinases as key players in osmotic stress signaling. Biochim. Biophys. Acta Gen. Subj. 2016, 1860, 2037–2052. [Google Scholar] [CrossRef]
  78. Kültz, D.; Avila, K. Mitogen-activated protein kinases are in vivo transducers of osmosensory signals in fish gill cells. Comp. Biochem. Physiol. B Biochem. Mol. Biol. 2001, 129, 821–829. [Google Scholar] [CrossRef] [PubMed]
  79. Tian, Y.; Wen, H.; Qi, X.; Zhang, X.; Li, Y. Identification of mapk gene family in Lateolabrax maculatus and their expression profiles in response to hypoxia and salinity challenges. Gene 2019, 684, 20–29. [Google Scholar] [CrossRef] [PubMed]
  80. Nielsen, M.B.; Christensen, S.T.; Hoffmann, E.K. Effects of osmotic stress on the activity of MAPKs and PDGFR-β-mediated signal transduction in NIH-3T3 fibroblasts. Am. J. Physiol. Cell Physiol. 2008, 294, C1046–C1055. [Google Scholar] [CrossRef] [PubMed]
  81. Sheikh-Hamad, D.; Gustin, M.C. MAP kinases and the adaptive response to hypertonicity: Functional preservation from yeast to mammals. Am. J. Physiol. Renal Physiol. 2004, 287, F1102–F1110. [Google Scholar] [CrossRef] [PubMed]
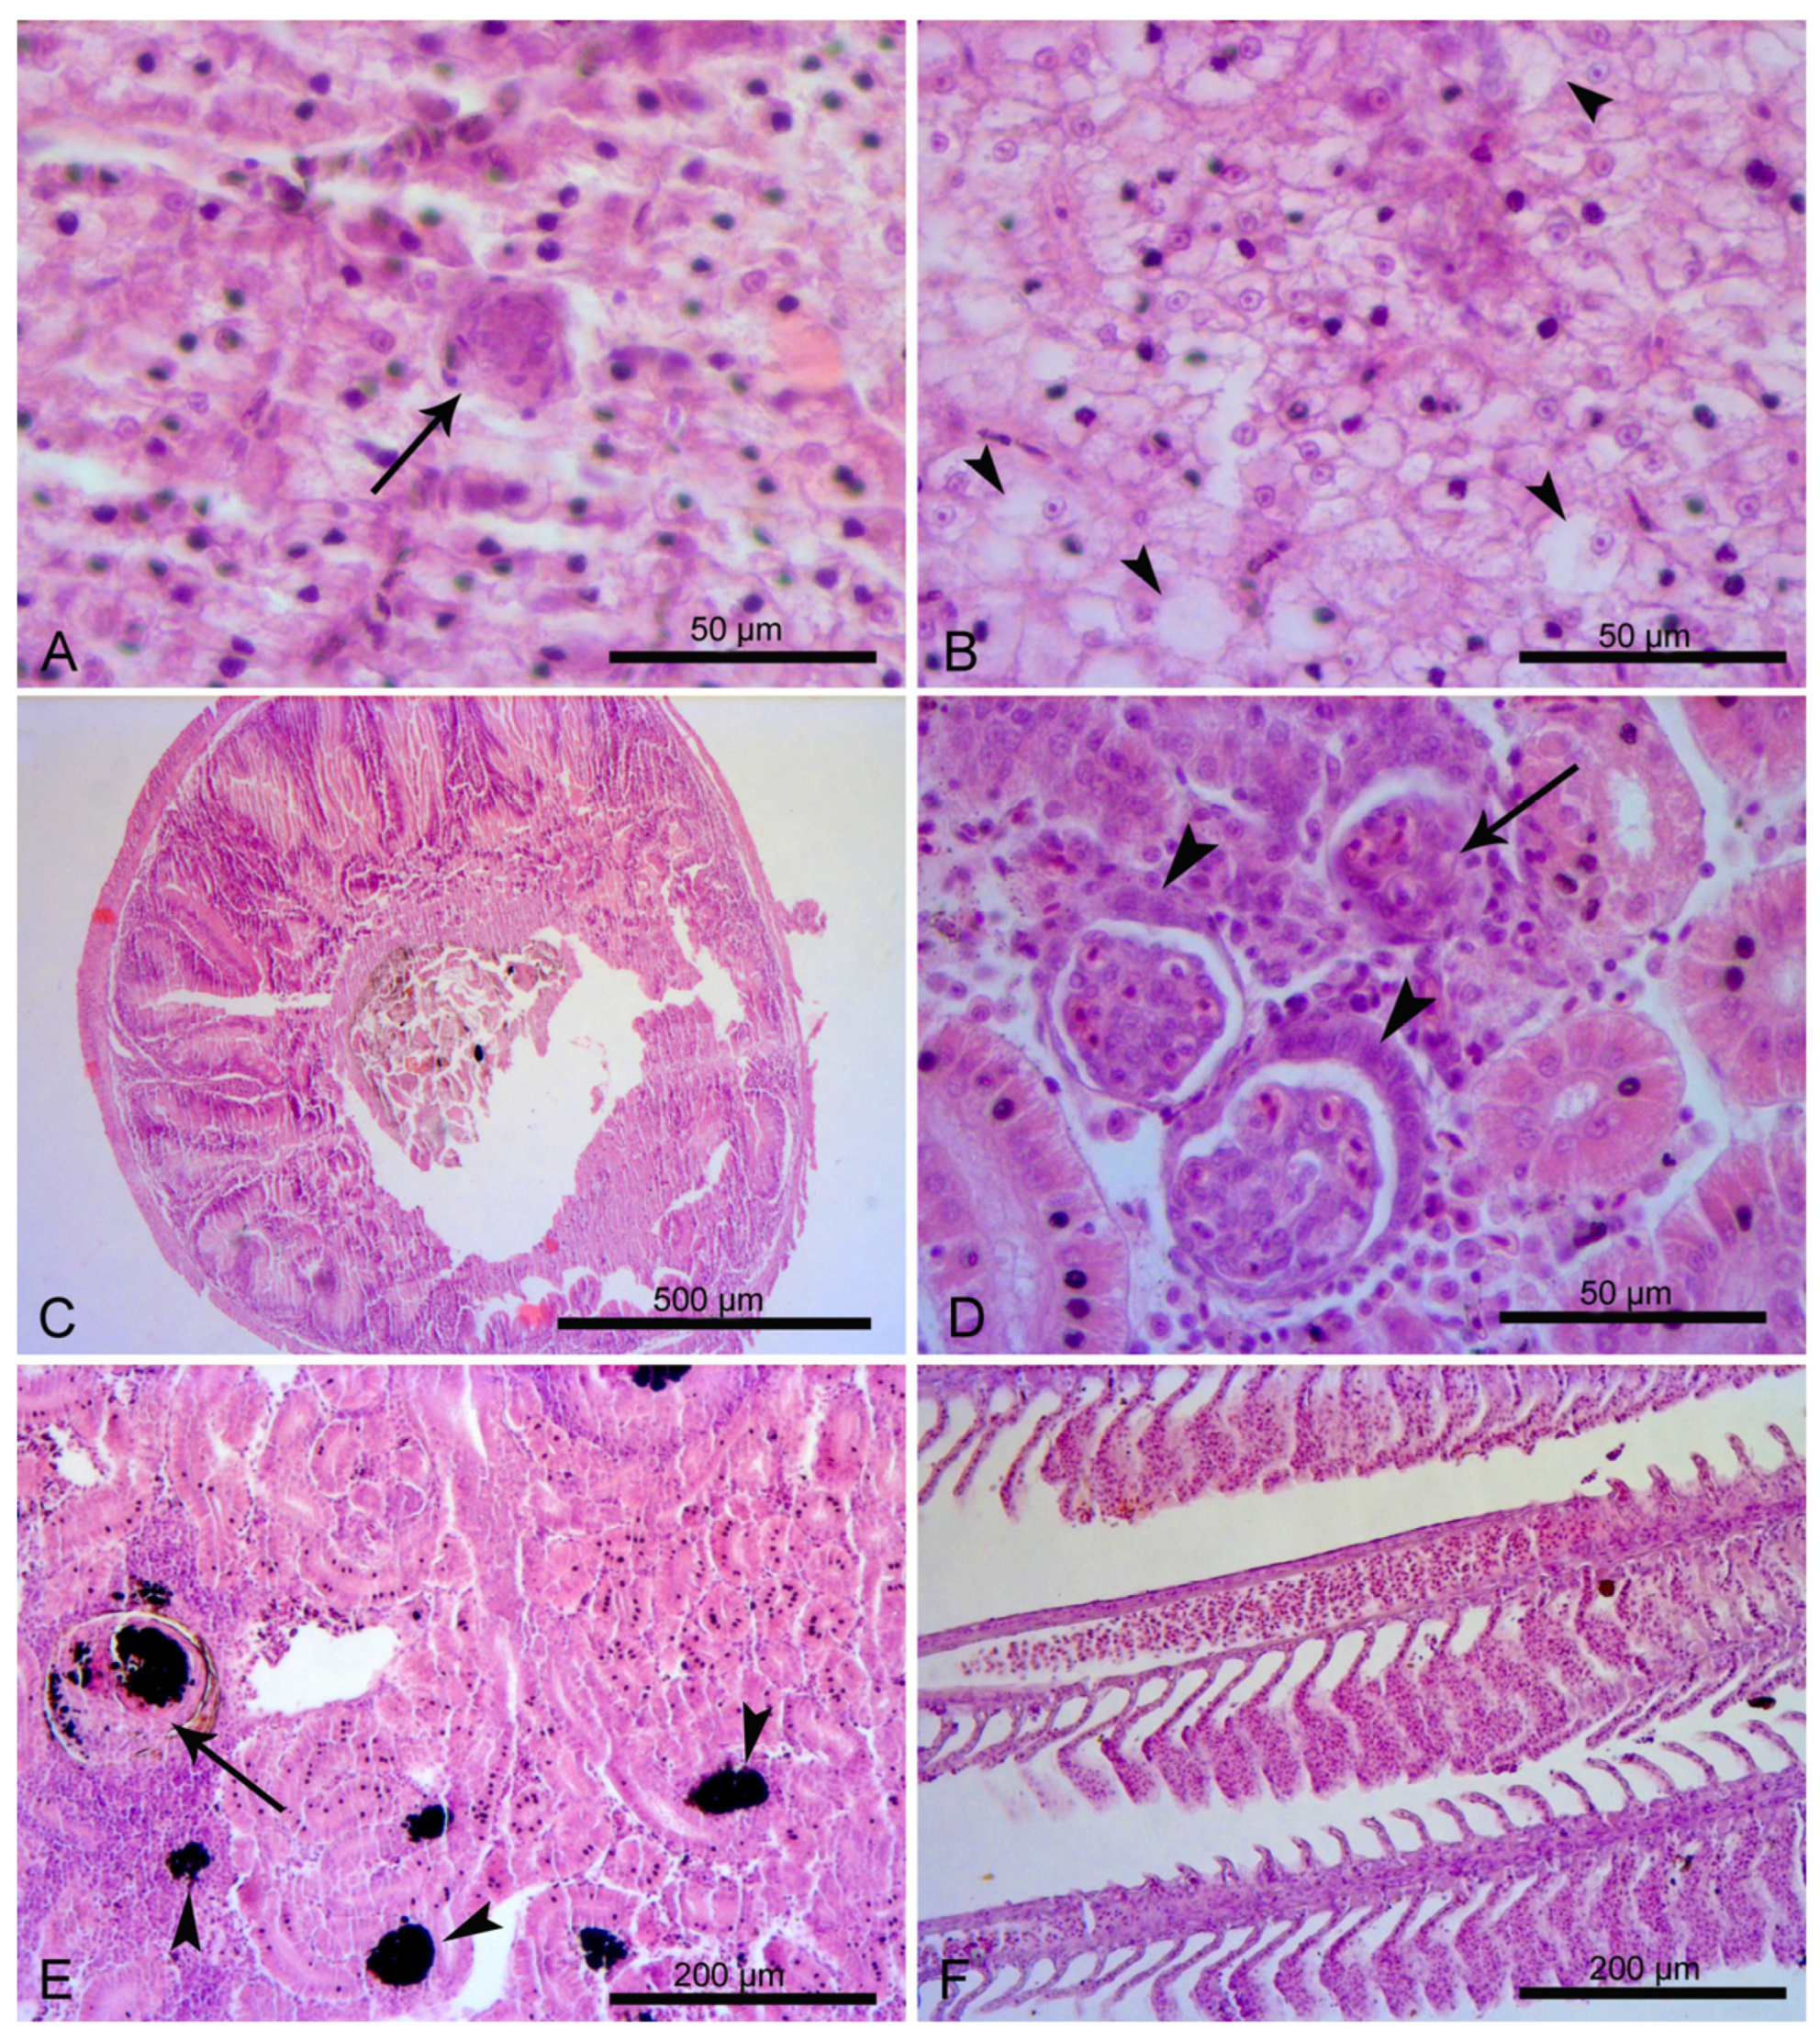
Figure 1. (A) Salinity 20 ppt: liver micro-granuloma (arrow). (B) Salinity 14 ppt: lipid accumulation in the liver cells (arrowheads). (C) Salinity 20 ppt: structure disorganization of the midgut. (D) salinity 20 ppt: Bowman’s capsule epithelial cells proliferation (arrowheads) and glomerulopathy (arrow). (E) Salinity 14 ppt: kidney granuloma (arrow) with many melanomacrophage centers indicated with arrowheads. (F) Salinity 8 ppt: telangiectasia of the gills’ secondary lamellae.
Applsci 13 03385 g001
Figure 2. Induction of Hsp60 in the liver (a) and gills (b) of gilthead sea bream following exposure to a salinity of 8, 14, or 20 ppt for 0, 15, 30, and 45 days. Different bar colors represent the exposure time to the experimental salinities (T0: 0 days, T15: 15 days, T30: 30 days, and T45: 45 days). Data are expressed as mean values of three replicates ± S.D. Different letters depict significant changes in Hsp60 expression between different exposure times in each salinity, while different symbols (*, #, and $) are used to denote significant differences between the three experimental salinities at the same exposure time.
Applsci 13 03385 g002
Figure 3. Phosphorylation levels of p44/42 MAPK in the liver (a) and gills (b) of gilthead sea bream following exposure to a salinity of 8, 14, or 20 ppt for 0, 15, 30, and 45 days. Different bar colors represent the exposure time to the experimental salinities (T0: 0 days, T15: 15 days, T30: 30 days, and T45: 45 days). Data are expressed as mean values of three replicates ± S.D. Different letters depict significant changes in phosphorylated levels of p44/42 MAPK between different exposure times in each salinity, while different symbols (*, #, and $) are used to denote significant differences between the three experimental salinities at the same exposure time.
Applsci 13 03385 g003
Figure 4. Phosphorylation levels of p38 MAPK in the liver (a) and gills (b) of gilthead sea bream following exposure to a salinity of 8, 14, or 20 ppt for 0, 15, 30, and 45 days. Different bar colors represent the exposure time to the experimental salinities (T0: 0 days, T15: 15 days, T30: 30 days, and T45: 45 days). Data are expressed as mean values of three replicates ± S.D. Different letters depict significant changes in phosphoryalted levels of p38 MAPK between different exposure times in each salinity, while different symbols (*, #, and $) are used to denote significant differences between the three experimental salinities at the same exposure time.
Applsci 13 03385 g004
Table 1. Rearing conditions (pHFT, pHGB) and dissolved nutrients (TANin, TANout, NO3in, NO3out, PO4=in, PO4=out, and ΝO2) in the fish and hydroponic of the brackish aquaponic system over the experimental period of 45 days.
20 ppt14 ppt8 pptp-Value
TANin0.51 ± 0.13 a0.50 ± 0.11 a0.70 ± 0.24 a0.498
TANout0.48 ± 0.09 a0.46 ± 0.08 a0.67 ± 0.22 a0.678
ΝO3in114.61 ± 14.73 a122.38 ± 11 a120 ± 11.12 a0.903
ΝO3out 112.08 ± 16.05 a111.41 ± 17.83 a109.76 ± 16.09 a0.971
ΝO20.17 ± 0.04 a0.14 ± 0.04 a0.18 ± 0.96 a0.895
PO4in0.51 ± 0.18 a0.52 ± 0.16 a0.52 ± 0.18 a0.918
PO4out0.42 ± 0.15 a0.47 ± 0.18 a0.43 ± 0.10 a0.955
pHFT6.0 ± 0.41 a6.1 ± 0.41 a6.5 ± 0.38 a0.690
pHGB6.3 ± 0.4 a6.5 ± 0.34 a6.6 ± 0.29 a0.860
Data were expressed as mean ± S.E.M (n = 16). Means in a row followed by the same superscript are not significantly different in statistical terms (p > 0.05).
Table 2. Gilthead sea bream growth performance of the trials during the 45 days of cultivation in brackish aquaponics systems.
20 ppt14 ppt8 pptp-Value
Initial mean weight (Win, g)3.89 ± 0.05 a3.85 ± 0.04 a3.97 ± 0.05 a0.321
Final mean weight (Wfin, g)19.44 ± 0.31 a18.52 ± 0.28 a19.71 ± 0.36 b0.024
Weight gain (WG, g) 15.6 ± 0.32 a14.67 ± 0.28 a15.7 ± 0.38 a0.173
Specific growth rate (SGR, %/d) 3.60 ± 0.05 b3.09 ± 0.14 a3.58 ± 0.06 b0.032
Survival (%)90± 6.74 a97 ±1.33 a96 ±2.30 a0.436
Body weight increase (BWI %) 412.8 ± 11.88 a387.3 ± 10.24 a408.9 ± 13.70 a0.268
Initial coefficient factor (Kin)1.24 ± 0.01 a1.28 ± 0.01 a1.26 ± 0.01 a0.178
Final coefficient factor (Kfin)1.49 ± 0.01 a1.48 ± 0.01 a1.54 ± 0.01 b0.02
Initial mean length (Lin, cm)6.77 ± 0.03 a6.70 ± 0.03 a6.80 ± 0.03 a0.123
Final mean length (Lfin, cm)10.71 ± 0.18 a10.76 ± 0.05 a10.82 ± 0.06 a0.787
Food conversion ration (FCR) 0.70 ± 0.01 a0.70 ± 0.01 a0.74 ± 0.04 a0.121
Daily food intake (DFI %/d)1.54 ± 0.02 a1. 55 ± 0.04 a1.56 ± 0.04 a0.945
Data were expressed as mean ± S.E.M (ninitial = 234). Means in a row followed by the same superscript are not statistically significantly different (ANOVA, p > 0.05).
Table 3. Rock samphire’s growth performance during the 45 days of cultivation trials in brackish aquaponics systems.
20 ppt14 ppt8 pptp-Value
Initial number of branches8.38 ± 0.44 a7.33 ± 0.49 a9.11 ± 0.74 a0.100
Final number of branches14.22 ± 1.93 a13.38 ± 1.26 a18.94 ± 2.55 a0.114
Final height (cm)10.22 ± 0.56 a14.66 ± 0.78 b20.27 ± 1.2 c0.027
Rate of height gain (cm/d)2.82 ± 0.42 a2.62 ± 0.45 a8.97 ± 0.92 b0.000
Final fresh weight of the aerial part8.99 ± 0.88 a21.26 ± 3.15 b57.03 ± 586 c0.000
Data were expressed as mean ± S.E.M (n = 54). Means in a row followed by the same superscript are not significantly different in statistical terms (ANOVA, p > 0.05).
Table 4. Severity scoring for the observed histopathological alterations of sea bream in different levels of salinity.
LiverMidgutKidneyGills
20‰ salinity1111
14‰ salinity1022
8‰ salinity1021
Disclaimer/Publisher’s Note: The statements, opinions and data contained in all publications are solely those of the individual author(s) and contributor(s) and not of MDPI and/or the editor(s). MDPI and/or the editor(s) disclaim responsibility for any injury to people or property resulting from any ideas, methods, instructions or products referred to in the content.