Abstract
In this research, copper nanocomposites reinforced with carbon nanotubes (CNTs) were produced by ultrasonication and conventional sintering, followed by cold rolling. These nanocomposites may be good candidates due to their excellent properties for components in the electrical, electronics, or aerospace industries with highly demanding requirements. The main objectives of this work were to produce and characterize the Cu/CNT nanocomposites, identify the strengthening mechanisms, and study the deformation behavior of the nanocomposites during cold rolling. The nanocomposites exhibited an improvement in hardness and tensile strength of 17 and 67%, respectively, attesting to the strengthening effect of the reinforced material. The yield strength of the nanocomposites was determined considering different mechanisms: (1) load transfer, (2) grain refinement or texture, (3) dislocation, and (4) Orowan strengthening mechanisms. The microstructural and calculated results show that the mechanism that contributes the most to the increase in the properties of the nanocomposite is the load transfer. The nanocomposites show a different texture evolution of the Cu matrix during cold rolling. This can be due to differences in the active slip planes between the matrix and the nanocomposite, which affects the lattice rotation.
1. Introduction
In recent years, developing new materials with unique properties has been the goal of several studies to meet the requirements imposed by various industries. Carbon nanotubes (CNTs) have been defined as an optimal reinforcement for nanomaterials due to their properties (good ductility and strength, high elastic modulus, electrical and thermal conductivities), resulting in an advantageous material with increased fatigue and fracture resistances. Implementing these advanced lightweight metal matrix nanocomposites (MMNCs) can yield several advantages, such as reduced fuel combustion and CO2 emissions [1,2,3].
The copper’s outstanding electrical and thermal properties make this material extremely valuable for microelectronic devices. Nonetheless, its applicability is limited due to poor mechanical characteristics, such as hardness and wear resistance [4]. The use of CNTs as a reinforcement material for copper matrices can be a practical approach to improve their properties, such as compression and tensile strength [5], hardness [6,7], and also electrical and thermal conductivities [8]. However, the beneficial effect of adding CNTs to a copper matrix depends on their homogeneity, a function of the dispersion process and the selected manufacturing route [9].
In the literature, it is possible to identify several production routes for MMNCs. Still, powder metallurgy is an efficient, simple, accessible, and widely used technique for manufacturing these nanocomposites [10,11,12]. The powder metallurgy process can be subdivided into four key steps, starting with the powder mixing and dispersion with the metal powder and reinforcement, followed by the pressing and the sintering of the samples [13]. In recent years, there has been an increase in published papers on Cu/CNT nanocomposites [4,5,6,7,8,14,15,16,17,18]. However, producing these nanocomposites by this process is still less reported than the Al/CNT and Ni/CNT nanocomposites, even though identifying strengthening mechanisms has been a topic of these works.
Identifying and understanding the strengthening mechanisms is crucial for optimizing and implementing MMNCs. For Cu/CNT nanocomposites, although the load transfer mechanism is the most reported, grain refinement or texture, Orowan, and dislocation strengthening mechanisms are also observed to contribute to the increased yield strength of the nanocomposites. For instance, Yoon et al. [14] reported on the grain refinement strengthening in Cu/CNT nanocomposites processed by high-pressure torsion. The grain size was evaluated by electron backscatter diffraction (EBSD), and the presence of CNTs promotes a reduction from approximately 517 nm (Cu matrix) to 180 nm (nanocomposite) in the average grain size. This can be explained due to the presence of CNTs at grain boundaries that act as inhibitors of grain boundary movement. Moreover, the CNTs significantly affected the dislocation motion, promoting a dislocation density increase during the deformation of the nanocomposites. The results of tensile tests and analyses of the fracture surface showed an improvement in the mechanical properties of the nanocomposites and the presence of individual CNTs embedded in the matrix. Chen et al. [7] investigated the mechanical properties of Cu/CNT nanocomposites produced by electrodeposition. The authors observed an improvement in the tensile strength and ductility of the nanocomposites. The strengthening mechanisms identified were the load transfer and the dislocation hardening due to the increased dislocation density observed for the nanocomposites. Fu et al. [17] applied mathematical calculations to investigate the strengthening mechanisms of Cu/CNT nanocomposites produced by SPS. The results showed that load transfer was the mechanism that most contributed to strengthening the nanocomposite, followed by increased dislocation density and grain refinement. Duong et al. [18] produced nanocomposites of Cu reinforced with CNT by high-energy ball milling followed by conventional sintering and cold rolling—the nanocomposites showed an improvement in mechanical properties compared to the Cu matrix. The strengthening mechanisms identified were load transfer, grain refinement, and dislocation strengthening.
Therefore, it is well-known and widely studied that the combination of some intrinsic characteristics of the material, such as its crystallographic orientation and stacking fault energy, affects its deformation behavior. However, the influence of CNTs on the mode and extent of these processes still needs to be explored and understood for implementing nanocomposites reinforced with CNTs. In this sense, this work aims to detail the mode of production and behavior during the deformation processes of nanocomposite Cu/CNTs, such as the interaction of the CNT with dislocations, which can be extremely useful to improve its behavior in service. For this reason, this work aims to present the conventional powder metallurgy route of Cu/CNT nanocomposites and discuss the effect of CNT reinforcement in the copper matrix after sintering. It also seeks to explain the deformation behavior of nanocomposites during cold rolling up to different strain values. Since the ultrasonication process proved effective in dispersing and mixing the CNTs and metallic powders, the samples were processed using this method as it has the advantage of promoting good dispersion with less damage to the structure of the CNTs.
2. Materials and Methods
The copper powders were provided by Goodfellow (Goodfellow Cambridge Ltd., Huntingdon, UK), and the multiwalled carbon nanotubes, used as reinforcing material, are from Fibermax (Fibermax Ltd., London, UK). The outer and inner diameters and the structure of the CNTs can be seen in detail in a previous work [19]. The as-received copper powder and ultrasonicated mixtures were characterized by optical microscopy (OM) and scanning electron microscopy (SEM) electron backscattered diffraction (EBSD). Raman spectroscopy (Jobin Yvon T64000; HORIBA Scientific, Kyoto, Japan) experiments were conducted with a laser wavelength of 514 nm.
Image analysis was performed using the software Image J (version 1.51, Wayne Rasband, National Institutes of Health, Bethesda, MD, EUA) for particle size, length, and wide measurements. These measurements were obtained from OM images using a DM 4000 M optical microscope equipped with a Leica DFC 420 camera (Leica Microsystems, Wetzlar, Germany). An SEM (Thermo Fisher Scientific QUANTA 400 FEG SEM, Thermo Fisher Scientific, Hillsboro, OR, USA) with an EBSD detector TSL-EDAX EBSD Unit (EDAX Inc. (Ametek), Mahwah, NJ, USA) was used. Furthermore, dynamic light scattering (DLS) with a Laser Coulter LS230 (Beckman Coulter, Inc., Brea, CA, EUA) complementarily analyzed the as-received copper powder.
Several amounts of CNTs (from 1.0 to 2.5% vol.) were added to the Cu matrix to determine the effect of the reinforcement’s volume fraction in the nanocomposites’ production. The dispersion and mixing were performed in one step by ultrasonication for 15 min in isopropanol. This procedure has already been adopted for other matrices such as Al and Ni to produce nanocomposites reinforced with CNTs [19,20,21]. These mixtures were then cold pressed to 900 MPa and sintered under vacuum for 120 min at 950 °C.
The cold rolling of the sintered samples was performed at a low speed (10 rpm) until strains from 0.11 to 1.61 were achieved in a maximum of 4 more minor passes. OM, SEM, and EBSD conducted the microstructural characterization of the nanocomposites.
EBSD has proven to be an extraordinarily advanced technique to characterize nanocomposites and deformed samples, ideal for the present work [20]. The raw EBSD data must be cleaned using TSL OIM Analysis 5.2 (EDAX Inc. (Ametek), Mahwah, NJ, USA) to avoid false results. In this sense, a grain tolerance angle of 15° and a minimum 2 points grain size were established before performing the different maps. The overall EBSD map inverse pole figures (IPFs), Kernel average misorientation (KAM), and grain boundary maps were elaborated as described, with conditions similar to those of previous work [20]. Furthermore, to analyze the density of the geometrically necessary dislocations (GNDs) of the samples, crucial in the deformation studies, the ATEX software (University of Lorraine, Metz, France) was used [22].
The mechanical properties of the nanocomposites were evaluated by hardness and tensile tests. Vickers microhardness tests were performed using a load of 98 mN for a normalized time of 15 s on a Duramin-1 durometer (Duramin-1; Struers A/S, Ballerup, Denmark). The average microhardness value and respective standard deviation were calculated from 12–20 indentations performed in each sample. The tensile test was performed with a velocity of 0.2 mm/s, using Shimadzu EZ Test equipment (Shimadzu Corporation, Kyoto, Japan), and three samples of each, nanocomposite and copper matrix, were tested.
3. Results and Discussion
3.1. Powders Characterization
The powders’ morphology, shape, and particle size have an essential role in the success of the production by powder metallurgy. Figure 1 shows the scanning electron microscopy (SEM) images using the secondary electron mode of the as-received Cu powders. These powders exhibited a dendritic shape. Dynamic light scattering (DLS) analysis of particle size distribution revealed a D50 value of 29.45 μm. The length and width are very different, meaning the particles are elongated.
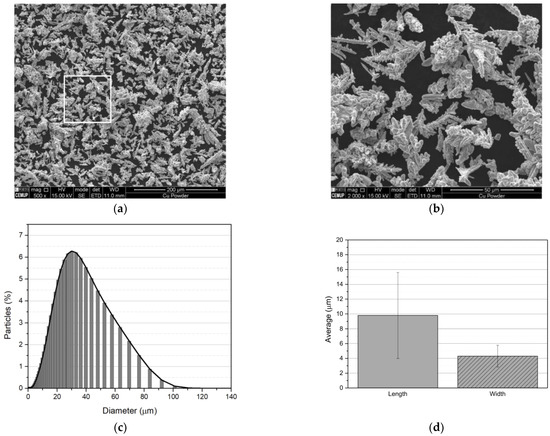
Figure 1.
(a) SEM images of the as-received Cu powders, (b) higher magnification of the region marked in (a), (c) particle size distribution, and (d) average length and width of the particles.
The microstructure of the powders was analyzed in more detail by EBSD. Figure 2 shows a Cu particle’s inverse pole figure (IPF), Kernel average misorientation (KAM), and grain boundary maps. The IPF reveals that the particle comprises grains with different crystallographic orientations. Some misorientation is detected, mainly at the surface of the particle. The high-angle misorientation regions, associated with a high density of low-angle grain boundaries, can be attributed to plastic deformation during production.
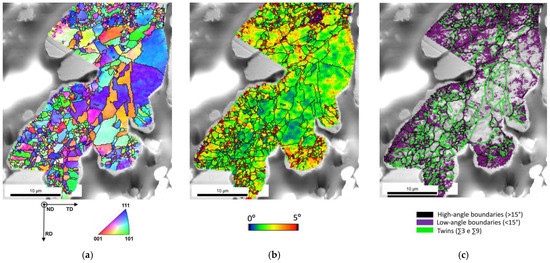
Figure 2.
Cu powder particle as-received: (a) Inverse pole figure (IPF) map, (b) Kernel average misorientation (KAM) map overlapped with image quality (IQ) map, and (c) IQ map with delineated high- and low-angle boundaries as well as twins.
The dispersing/mixing process can change the powders’ shape and size, affecting the pressing and sintering steps of nanocomposite production. The evaluation of the effect of ultrasonication on the size and dimension of Cu powders was carried out. The impact of introducing CNTs on these parameters was also studied during this process step. The OM images of the received and dispersed powders and the roundness and particle size distributions for the Cu powders and Cu/CNTs can be seen in Figure 3. Based on these results, it is clear that CNTs do not significantly affect the shape and size of copper powders. Roundness values show only a slight decrease for the value of 1, i.e., a form faintly closer to sphericity. There are also no significant differences in size, and all samples have the same particle size distribution. Similar results were observed for Ni powders processed to the same dispersion and mixing process [20].
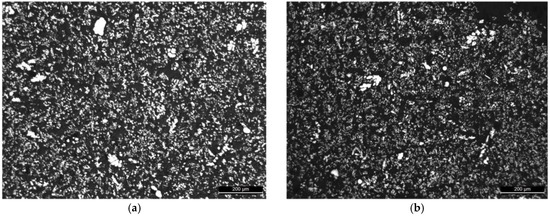
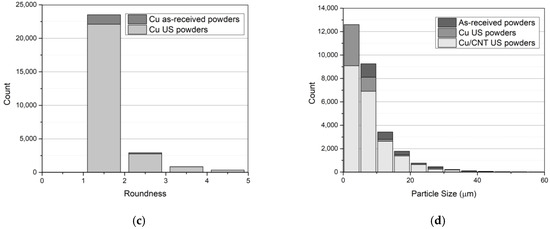
Figure 3.
(a,b) OM images of as-received and dispersed Cu powders and (c) roundness distribution of the particles, and (d) particle size distribution, for as-received and dispersed Cu (US: Ultrasonication) and Cu/CNTs powders.
Furthermore, the ultrasonication process does not cause significant damage to the structure of the CNTs that would impair their strengthening effect. Figure 4 shows the SEM, TEM, and HRTEM images exhibiting the structure of the CNTs after the ultrasonication process. The size distribution of the outer diameters is also presented in this figure which shows a decrease that may be associated with the exfoliation of the CNTs. Moreover, the process only significantly affects the shape of the powders to avoid influencing the next steps of the powder metallurgy process, mainly during densification in the sintering step. Regarding structural damage, the ultrasonication process causes less damage than the ball milling process, which is one of the most reported in the literature. In the Raman results in Figure 4, the influence of these processes on the structure of the initial CNTs is observed. The decrease in the intensity ratio of the D band (ID) and G band (IG) may be associated with the exfoliation that occurred on the CNTs due to the ultrasonication treatment already observed in previous work [21]. The increase observed for this ratio for ball milling may be due to the growth of defects in the structure of CNTs. Similar results were also obtained by Ya et al. [4], who observed few defects promoted in the structure of the CNTs using sonication. However, defects increase with the cold rolling process due to plastic deformation, as Duong et al. have shown [18].
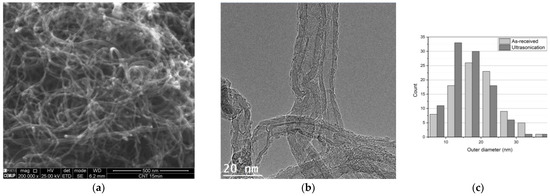
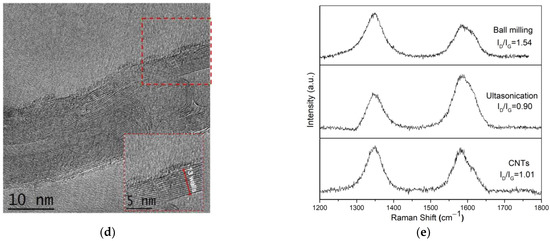
Figure 4.
(a) SEM and (b) TEM images of ultrasonication CNTs, (c) distribution of outer diameter of the as-received and dispersed CNTs by ultrasonication, (d) HRTEM image of the CNT dispersed by ultrasonication showing in the region marked the magnification image the structure and the number of the walls, and (e) Raman results for the as-received CNTs and CNTs dispersed by ultrasonication and ball milling for 1 h.
3.2. Strengthening Mechanisms
The nanocomposites were produced with different volume fractions of CNTs. Figure 5 shows the volume fraction’s influence on the hardness of the nanocomposites. There is an increase in hardness for 1.0% vol. of CNTs, and a decrease in hardness is observed for higher fractions of CNTs. The rise of CNT content above 1.0% vol. leads to larger clusters, increasing the heterogeneous distribution of CNTs and thus softening the nanocomposites. These results are similar to those already observed for Ni/CNT and Al/CNT nanocomposites produced by the same route [9,20,21,22,23,24].
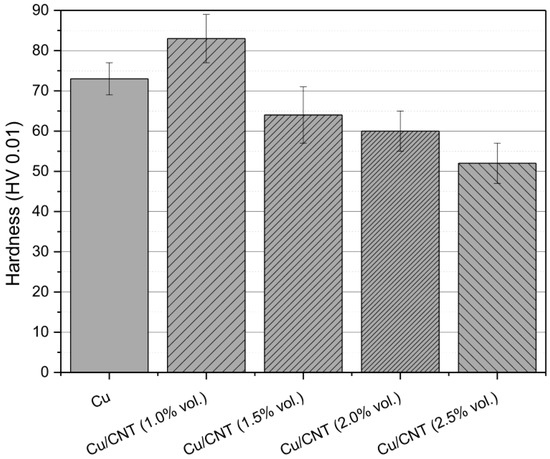
Figure 5.
Evolution of the microhardness of Cu/CNT nanocomposites with the fraction of CNTs.
The effectiveness of the dispersion process in these nanocomposites can be seen in the results presented in Figure 6. Figure 6a shows the evolution of the percentage of CNT pores and agglomerates with the volume fraction of the reinforcement. Approximately 0.5% pores can be observed for the Cu sample, but with the addition of 1.0% vol. CNTs or more, the pore fraction increases, which is associated with agglomerates of CNTs. CNTs are present in the Cu matrix as agglomerates, mainly in the grain boundaries. Still, some can also be observed individually in the matrix, as previously reported [20,21]. In the SEM image of Figure 6b, a nanocomposite’s microstructure and a CNT cluster’s detail can be observed. Measurements of CNT pores and clusters for the nanocomposite samples showed that their percentage increases with an increase in the reinforcement volume fraction. Increasing the reinforcement fraction makes it challenging to obtain a homogeneous dispersion of CNTs, as a more significant amount of pores and clusters of CNTs appear in the microstructure. This behavior can be explained by the processing conditions, especially dispersion, which limits the fraction of CNTs successfully dispersed in metal matrices.
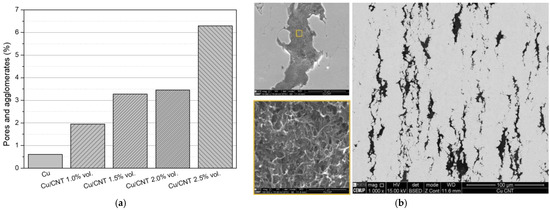
Figure 6.
(a) Evolution of the fraction of pores and agglomerates with the volume fraction of the CNTs and (b) SEM image of the cross-section of a nanocomposite with 1.0% vol. the marked region in the figure represents the magnified area showing the CNTs.
Since the increase in hardness was not significant with the addition of CNTs (a 17% increase over the hardness of the copper matrix), tensile tests were performed to further investigate the effect of CNT strengthening on the nanocomposites. Figure 7 and Table 1 show the tensile test results and the relative density of the sintered samples. The relative density is somewhat lower for the nanocomposites than for the Cu matrix, which agrees with what was already mentioned. However, the cold rolling process mainly aims to increase these values for the nanocomposites. As for the tensile test results, a more significant increase in tensile strength is observed when CNTs are added to the matrix (67% increase over the Cu matrix value). Based on these results, it can be indicated that the process proved to be effective in the production of Cu/CNT nanocomposites since, for instance, Duong et al. [18] report a 44% increase in the mechanical strength of Cu/CNT nanocomposites produced by ball milling as a dispersion process followed by the sintering and cold rolling processes. The improvement in the mechanical properties of the nanocomposites with 1.0% vol. can be attributed to different strengthening mechanisms that can act simultaneously.
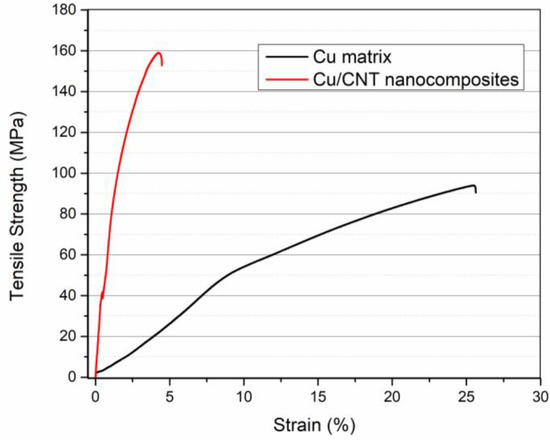
Figure 7.
Stress–strain curves of the Cu matrix and Cu/CNT nanocomposite as-sintered samples.

Table 1.
Tensile strength, elongation, and relative density of the Cu matrix and Cu/CNT nanocomposite as-sintered samples.
Different characterizations were performed to determine the strengthening mechanisms acting simultaneously on these nanocomposites. The load transfer mechanism was observed with the increase in the mechanical properties of the nanocomposites but confirmed by the characterization of the fracture surface of the nanocomposites by SEM (shown in Figure 8). Elongated and fractured CNTs were detectable on this surface. This led to the conclusion that one of the factors responsible for the difference in hardness and tensile strength between the copper matrix and the nanocomposite is the load transfer mechanism. The increase in tensile strength observed for the nanocomposites can be attributed to a uniform CNT distribution and effective load transfer between the matrix and CNTs due to a strong matrix/CNT interface. Duong et al. [18] observed similar results in Cu/CNT nanocomposites produced by powder metallurgy and cold rolling. The fracture surfaces shown in the CNTs prove the good interface bonding between the strengthening material and the matrix that enhances the load transfer mechanism.
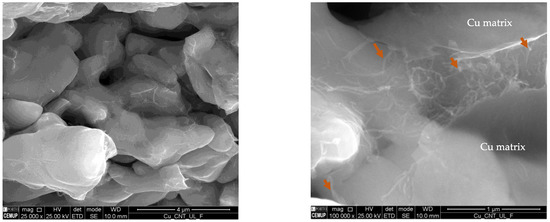
Figure 8.
SEM image of the Cu/CNT fracture surface of the nanocomposites produced by ultrasonication, where the arrows point to elongated and fractured CNTs.
However, other mechanisms may play a role in reinforcing Cu/CNT nanocomposites. In this regard, in addition to the load transfer mechanism, Orowan, dislocation, and grain boundary or texture strengthening mechanisms were considered in this work.
The effect of CNTs in grain refinement due to grain growth inhibition during nanocomposite sintering was investigated using EBSD maps. Figure 9 shows the unique color grain maps and grain size distributions of the as-sintered Cu and Cu/CNT samples. These results show that the samples have a similar average grain size, indicating that adding CNTs does not significantly influence the grain size.
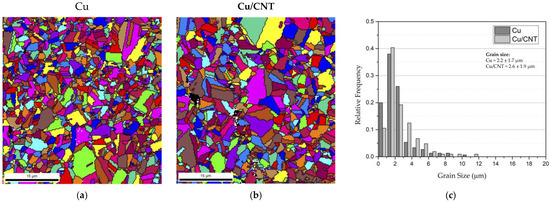
Figure 9.
Unique color grain maps of (a) Cu matrix and (b) Cu/CNT nanocomposites, and (c) grain size distribution of Cu matrix and Cu/CNT nanocomposite sintered samples.
The pole figures (PFs), inverse pole figures (IPFs), and IPF maps shown in Figure 10 allowed the evaluation of the crystallographic orientation of the grains. Neither sample shows a preferential orientation but a strong crystallographic orientation in the ND and TD directions. However, some slight differences in crystallographic orientation are detected for the nanocomposites. Unlike what was observed for Al and Ni matrices, where the crystallographic orientation of the matrix changes significantly, CNTs do not considerably affect the orientation of the Cu matrix [20,24]. In this context, it is evident that the CNTs do not influence the grain size or texture of the Cu matrix during the sintering process.
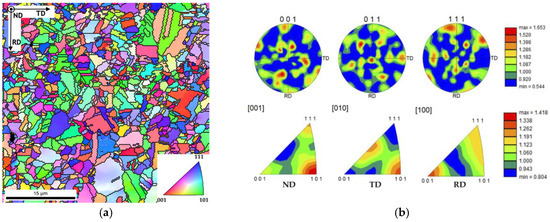
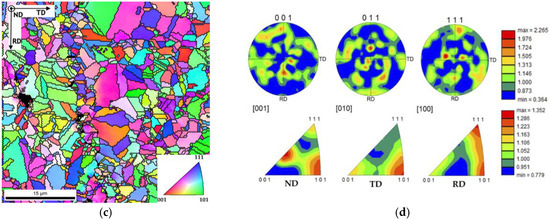
Figure 10.
(a,c) IPF maps and (b,d) [001], [010] and [100] IPFs and {001}, {011} and {111} PFs of Cu and Cu/CNT nanocomposites, respectively.
Another mechanism that can contribute to strengthening the Cu matrix is the dislocation or Orowan strengthening that occurs in the presence of reinforcement material. Figure 11 shows the image quality (IQ) maps with the high- and low-angle boundaries (HAGB and LAGB, respectively) and the estimated geometrically necessary dislocation (GND) density maps for the Cu and Cu/CNT samples. Based on these results, it is clear that the addition of CNTs does not significantly increase the copper matrix’s dislocation density (1.8 × 10¹⁴ m−2 and 1.9 × 10¹⁴ m−2 are the estimated dislocation densities for Cu and Cu/CNT samples, respectively). There is only an increase in the dislocation density near the CNT clusters, as seen at higher magnification. However, it is possible to observe dislocations of cells related to CNTs embedded inside the grains. This increase in dislocation density can be attributed to the mismatch of strains at the MWCNT/matrix interfaces due to the difference in thermal expansion coefficients between MWCNTs, and the Cu matrix will block the movement of dislocations. Other authors [7,17,18] have also reported dislocation strengthening as one of the most common mechanisms acting on these nanocomposites.
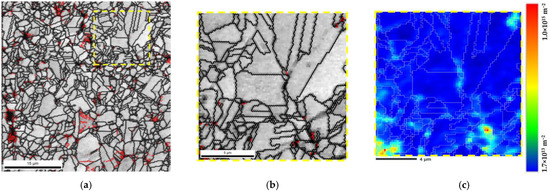
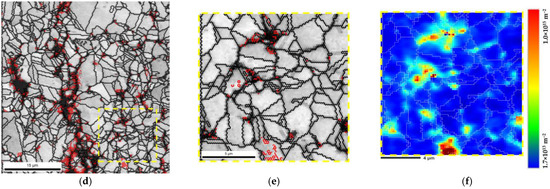
Figure 11.
(a–c) Cu and (d–f) Cu/CNT (1.0% vol.) samples were analyzed using (a,b,d,e) IQ maps with high- (black) and low-angle (red) boundaries and (c,f) GND estimated density maps of the area marked in (a,d).
The contribution of the different strengthening mechanisms related to yield strength was quantitatively calculated to fully understand the microstructure’s effects on the mechanical properties of the nanocomposites. Based on the available literature and the obtained microstructures, the reinforced yield strength should be derived from the sum of the yield strength of the matrix and the strengthening mechanisms [18]. The improvement in the yield strength of the nanocomposites could be attributed to the following mechanisms: (i) load shear strengthening (ΔσLT) [18,25,26], (ii) grain refinement strengthening (Δσgb) [18,25,27], (iii) Orowan strengthening (ΔσOr) [17,18,25,28], and (iv) dislocation strengthening (ΔσDis) [17,18,25,28]. The yield strength (σys) can be determined by Equation (1):
The strength increase by a load transfer from the CNTs and Cu matrix was calculated by the shear-lag theory developed by Kelly and Tyson [26]. Kelly and Tyson’s modified shear-lag model [26] is the most typically used to characterize the load transfer mechanism. Based on this model, the load transfer (ΔσLT) can be obtained by Equation (2):
where VCNT is the volume fraction of the CNTs, σm is the matrix yield strength, and Seff is the effective aspect ratio of the CNTs (the value of 1.32 was used in this work). Based on the results obtained by the microstructural characterization, it was found that ΔσLT can be 57.2 MPa. For the grain refinement strengthening (Δσgb), using the Hall–Petch equation [28], it was calculated to be 8.1 MPa. Regarding the Orowan strengthening (ΔσOr), the value was estimated using the equation reported by Nardone et al. [28]. The (ΔσDis) contribution was achieved as 2 MPa. This mechanism results in the thermal mismatch between the CNTs and the Cu matrix. The different contribution of these strengthening mechanisms is present in Figure 12. Based on the estimated values, the load transfer mechanism contributes more to improving the mechanical properties of the nanocomposites. These results are consistent with the results obtained in the microstructural characterization, where it was observed that in this work, the increase in dislocation density and grain size differences were not significant between the matrix and the nanocomposite.
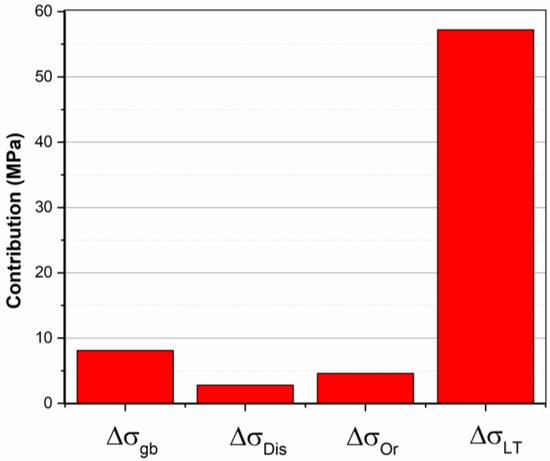
Figure 12.
Contribution of the strengthening mechanisms on the yield strength of the nanocomposites.
3.3. Deformation Behavior during Cold Rolling
The behavior during cold rolling of the nanocomposites was also investigated. Figure 13 reveals the hardness evolution with increasing deformation of Cu and Cu/CNT samples and the IQ maps with the grain boundaries of sintered and cold-rolled samples up to strains of 0.11, 0.69, and 1.61.
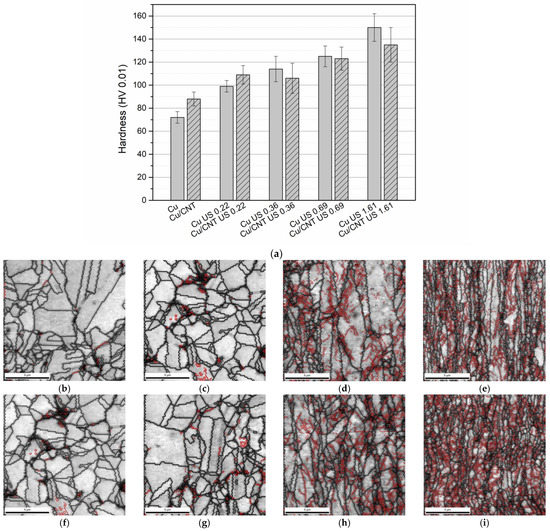
Figure 13.
(a) Evolution of Cu and Cu/CNT microhardness with cold-rolling strain (b–i) and IQ maps marked with LAGBs (in red) and HAGBs (in black) for (b–e) Cu (f–i) and Cu/CNT samples, as-sintered and cold rolled to strains of 0.11, 0.69, and 1.61, respectively.
As expected, the increased hardness is observed with the increasing of the strain. However, the matrix exhibits higher hardness for high strain values. This means that the strengthening effect of the CNTs no longer plays a role in these strain values. These results can be explained due to (i) the damage in the CNTs during the increase in the strain and/or (ii) the different behavior of the nanocomposites during the cold rolling. Regarding structural damage during the cold rolling, Doung et al. [18] observed an increase in the ID and IG intensity ratio, which means a growth in the defect in the CNTs during plastic deformation.
The grain boundary character and dislocation density were investigated to evaluate the differences between the Cu matrix and the nanocomposites. The IQ maps with the HAGB and LAGB boundaries show no significant differences between the samples. The high density of the LAGB can be associated with regions with a high density of dislocations. Figure 14 shows the evolution of the estimated GND density and the GND maps for the Cu and Cu/CNT as-sintered and cold-rolled samples.
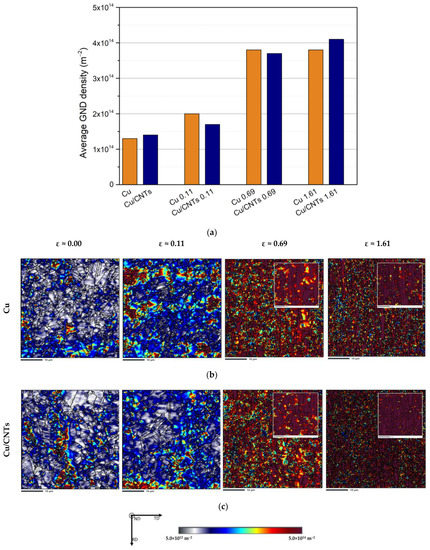
Figure 14.
(a) Estimated GND density and (b,c) GND maps of the Cu and Cu/CNT samples, as-sintered and cold rolled to strains up to 0.11, 0.69, and 1.61, respectively. A higher magnification detailed is present for the higher strains.
These results show that with increasing strain, there is an apparent increase in the dislocation density until stabilization is reached. The Cu and Cu/CNT samples show similar values of this density. For this reason, the discrepancies observed in hardness cannot be associated with the movement and multiplication of dislocations during deformation. The texture evolution of Cu and Cu/CNTs was investigated during the cold rolling. Figure 15 shows the results of the orientation distribution function (ODF) and their development during the deformation of Cu and Cu/CNTs. The ODFs of sintered samples were added for comparison and are present as ε = 0.00.
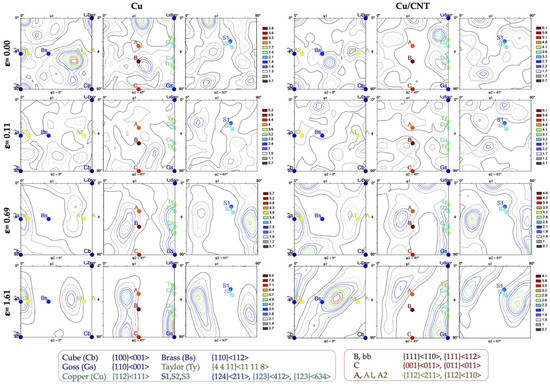
Figure 15.
ODFs of Cu and Cu/CNT samples, as-sintered and after cold rolling to strains of 0.11, 0.69 and 1.61, respectively. In these ODFs, the main possible texture components are marked.
In the as-sintered samples, no texture was observed, although slight differences exist between the inherent crystallographic orientations. The Cu sample deformed with ε = 0.11 showing a random orientation without any prominent component, while the Cu/CNTs revealed the Goss, Brass, A2, Ab, and B components. For samples cold rolled at a strain of 0.69, the main components are Copper, Goss, and Taylor for the Cu sample, while for Cu/CNTs, the Goss component shows the highest intensity, followed by Copper. However, the matrix texture at a 1.61 strain has Goss and A2 as the main components. Note that Goss is one of the characteristic components of cold rolling in face-centered cubic (FCC) structures. On the other hand, the nanocomposite and the components Copper, Goss, and Brass also show shear components.
Based on these results, the matrix and the nanocomposite show a different texture evolution. In nanocomposites, CNTs in the matrix can affect the lattice rotation during deformation, making the active slip systems different from the Cu matrix and affecting texture evolution. Thus, the evolution of hardness during deformation is also affected by this change.
However, the texture evolution needs to fully explain the difference in behavior between the nanocomposites and the matrix. Since the average hardness values shown in Figure 13a were obtained randomly on all the sample surfaces, it does not fully reflect the possible heterogeneities in the deformed sample. For that reason, hardness profiles were obtained along the cross-section (normal to the rolling direction) of the samples rolled at 1.61 strain to understand the difference in results between the samples. Figure 16 shows the results for Cu and Cu/CNT samples.
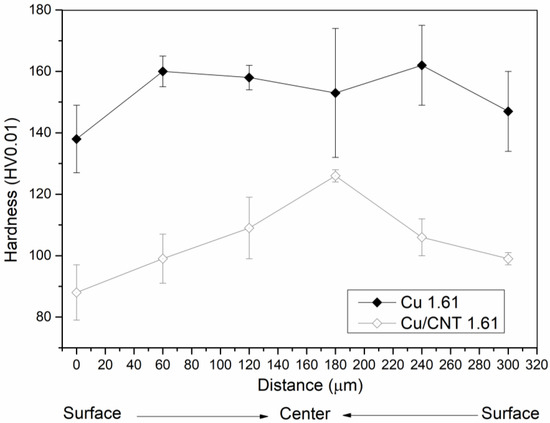
Figure 16.
Hardness profiles of Cu and Cu/CNT samples after cold rolling to a strain of 1.61.
The hardness distribution, from the surface to the center, differs for the nanocomposite and the matrix at a strain of 1.61. A non-uniform distribution of deformation across the sample was observed for the nanocomposites. The presence of the CNTs and even the slight difference in texture evolution originate different stress states, which will cause heterogeneities and differences in the deformation of the samples.
Previous work [29] on the deformation behavior of Ni and Ni/CNTs has shown that the CNTs influence the hardness and texture evolution of nanocomposites. The Ni/CNT nanocomposites softened at minor strains (0.11 and 0.22), which was attributed to the Bauschinger effect. For larger strains, different textures were observed for Ni and Ni/CNTs, which was explained by the initial crystallographic orientations and the presence of CNTs in the nanocomposites.
4. Conclusions
Cu/CNT nanocomposites were produced by conventional powder metallurgy using ultrasonication as a mixing and dispersion method. Different volume fractions of CNTs were investigated. The best dispersion was obtained for 1.0% vol. of CNTs. The nanocomposites were characterized by CNT agglomerates mainly at grain boundaries.
The increase of 17% in hardness and 67% in tensile strength attested to the strengthening effect of the CNTs in the Cu matrix. This improvement is a consequence of several mechanisms: (1) load transfer, (2) grain refinement or texture, (3) dislocation, and (4) Orowan strengthening mechanisms. The results show that the load transfer was the strengthening mechanism that played the leading role in these nanocomposites. Elongated and fractured CNTs were observed on the fracture surface of nanocomposites. The introduction of CNTs did not significantly affect the Cu matrix’s dislocation density, grain size, or texture.
The deformation behavior of the nanocomposites was observed during cold rolling under different strains. As expected, the Cu matrix and the nanocomposite show increased hardness values with deformation. At higher strains (greater than 0.36), the nanocomposites have a lower hardness than the Cu matrix. This can be explained due to the damage that can occur during the plastic deformation and the different texture evolution of the nanocomposites. The dislocation density analysis does not show differences between the Cu and Cu/CNT samples. The texture evolution shows various components for the nanocomposites and the Cu matrix. This can be due to differences in the active slip planes between the matrix and the nanocomposite, which affects the lattice rotation.
Author Contributions
Conceptualization, Í.C.; investigation, Í.C., B.M., B.R. and S.S.; writing—original draft preparation, Í.C. and S.S; supervision, S.S. and J.V.F.; formal analysis, S.S and J.V.F.; validation, S.S. and J.V.F.; writing—review and editing, S.S. All authors have read and agreed to the published version of the manuscript.
Funding
Íris Carneiro was supported by a Ph.D. grant for scientific research from the Portuguese Foundation for Science and Technology (FCT), with the reference PD/BD/143030/2018, and the P2020|Norte2020 program, with the reference NORTE-08-5369-FSE-000051. This research was supported by FEDER funds through the program COMPETE—Programa Operacional Factores de Competitividade and by national funds through FCT—Fundação para a Ciência e a Tecnologia, under the project UIDB/EMS/00285/2020 and ARISE with reference LA/P/0112/2020.
Institutional Review Board Statement
Not applicable.
Informed Consent Statement
Not applicable.
Data Availability Statement
Data can be available upon request from the authors.
Acknowledgments
The authors are grateful to CEMUP—Centro de Materiais da Universidade do Porto for the expert assistance with SEM.
Conflicts of Interest
The authors declare no conflict of interest.
References
- Every Breath We Take: Improving Air Quality in Europe; Agency, E.E., Ed.; Europe Union: Luxemburg, Luxemburg, 2013. [Google Scholar]
- Malaki, M.; Xu, W.; Kasar, A.K.; Menezes, P.L.; Dieringa, H.; Varma, R.S.; Gupta, M. Advanced Metal Matrix Nanocomposites. Metals 2019, 9, 330. [Google Scholar] [CrossRef]
- Dinesh Kumar, S.; Ravichandran, M.; Alagarsamy, S.V.; Chanakyan, C.; Meignanamoorthy, M.; Sakthivelu, S. Processing and properties of carbon nanotube reinforced composites: A review. Mater. Today Proc. 2020, 27, 1152–1156. [Google Scholar] [CrossRef]
- Ya, B.; Xu, Y.; Meng, L.; Zhou, B.; Zhao, J.; Chen, X.; Zhang, X. Fabrication of Copper Matrix Composites Reinforced with Carbon Nanotubes Using an Innovational Self-Reduction Molecular-Level-Mixing Method. Materials 2022, 15, 6488. [Google Scholar] [CrossRef]
- Chai, G.; Sun, Y.; Sun, J.J.; Chen, Q. Mechanical properties of carbon nanotube–copper nanocomposites. J. Micromech. Microeng. 2008, 18, 035013. [Google Scholar] [CrossRef]
- Kim, K.T.; Cha, S.I.; Hong, S.H. Hardness and wear resistance of carbon nanotube reinforced Cu matrix nanocomposites. Mater. Sci. Eng. A 2007, 449, 46–50. [Google Scholar] [CrossRef]
- Chen, L.; Hou, Z.; Liu, Y.; Luan, C.; Zhu, L.; Li, W. High strength and high ductility copper matrix composite reinforced by graded distribution of carbon nanotubes. Compos. Part A Appl. Sci. Manuf. 2020, 138, 106063. [Google Scholar] [CrossRef]
- Han, B.; Guo, E.; Xue, X.; Zhao, Z.; Luo, L.; Qu, H.; Niu, T.; Xu, Y.; Hou, H. Fabrication and densification of high performance carbon nanotube/copper composite fibers. Carbon 2017, 123, 593–604. [Google Scholar] [CrossRef]
- Carneiro, Í.; Viana, F.; Vieira, M.F.; Valdemar Fernandes, J.; Simões, S. Characterization of Ni–CNTs Nanocomposites Produced by Ball-Milling. Metals 2020, 10, 2. [Google Scholar] [CrossRef]
- Kondoh, K.; Threrujirapapong, T.; Imai, H.; Umeda, J.; Fugetsu, B. Characteristics of powder metallurgy pure titanium matrix composite reinforced with multi-wall carbon nanotubes. Compos. Sci. Technol. 2009, 69, 1077–1081. [Google Scholar] [CrossRef]
- Simões, S.; Viana, F.; Reis, M.A.L.; Vieira, M.F. Improved dispersion of carbon nanotubes in aluminum nanocomposites. Compos. Struct. 2014, 108, 992–1000. [Google Scholar] [CrossRef]
- Turkoglu, T.; Celik, S. Process optimization for enhanced tribological properties of Al/MWCNT composites produced by powder metallurgy using artificial neural networks. Surf. Topogr. 2021, 9, 045032. [Google Scholar] [CrossRef]
- Awotunde, M.A.; Adegbenjo, A.O.; Obadele, B.A.; Okoro, M.; Shongwe, B.M.; Olubambi, P.A. Influence of sintering methods on the mechanical properties of aluminium nanocomposites reinforced with carbonaceous compounds: A review. J. Mater. Res. Technol. 2019, 8, 2432–2449. [Google Scholar] [CrossRef]
- Yoon, E.Y.; Lee, D.J.; Park, B.; Akbarpour, M.R.; Farvizi, M.; Kim, H.S. Grain refinement and tensile strength of carbon nanotube-reinforced Cu matrix nanocomposites processed by high-pressure torsion. Met. Mater. Int. 2013, 19, 927–932. [Google Scholar] [CrossRef]
- Long, X.; Bai, Y.; Algarni, M.; Choi, Y.; Chen, Q. Study on the strengthening mechanisms of Cu/CNT nano-composites. Mater. Sci. Eng. A 2015, 645, 347–356. [Google Scholar] [CrossRef]
- Wang, H.; Zhang, Z.-H.; Hu, Z.-Y.; Wang, F.-C.; Li, S.-L.; Korznikov, E.; Zhao, X.-C.; Liu, Y.; Liu, Z.-F.; Kang, Z. Synergistic strengthening effect of nanocrystalline copper reinforced with carbon nanotubes. Sci. Rep. 2016, 6, 26258. [Google Scholar] [CrossRef] [PubMed]
- Fu, S.; Chen, X.; Liu, P. Preparation of CNTs/Cu composites with good electrical conductivity and excellent mechanical properties. Mater. Sci. Eng. A 2020, 771, 138656. [Google Scholar] [CrossRef]
- Duong, L.V.; Van Luan, N.; Ngoc Anh, N.; Bao Trung, T.; Danh Chung, L.; Quang Huan, N.; Thi Nhung, D.; Ngoc Minh, P.; Dinh Phuong, D.; Van Trinh, P. Enhanced mechanical properties and wear resistance of cold-rolled carbon nanotubes reinforced copper matrix composites. Mater. Res. Express 2020, 7, 015069. [Google Scholar] [CrossRef]
- Carneiro, Í.; Simões, S. Effect of Morphology and Structure of MWCNTs on Metal Matrix Nanocomposites. Materials 2020, 13, 5557. [Google Scholar] [CrossRef] [PubMed]
- Carneiro, Í.; Viana, F.; Vieira, F.M.; Fernandes, V.J.; Simões, S. EBSD Analysis of Metal Matrix Nanocomposite Microstructure Produced by Powder Metallurgy. Nanomaterials 2019, 9, 878. [Google Scholar] [CrossRef]
- Simões, S.; Viana, F.; Reis, M.A.L.; Vieira, M.F. Influence of dispersion/mixture time on mechanical properties of Al–CNTs nanocomposites. Compos. Struct. 2015, 126, 114–122. [Google Scholar] [CrossRef]
- Beausir, B.; Fundenberger, J.-J. Analysis Tools for Electron and X-ray Diffraction, ATEX—Software. Available online: www.atex-software.eu (accessed on 27 January 2023).
- Simões, S.; Viana, F.; Reis, M.A.L.; Vieira, M.F. Microstructural Characterization of Aluminum-Carbon Nanotube Nanocomposites Produced Using Different Dispersion Methods. Microsc. Microanal. 2016, 22, 725–732. [Google Scholar] [CrossRef]
- Simões, S.; Viana, F.; Reis, M.A.L.; Vieira, M.F. Aluminum and Nickel Matrix Composites Reinforced by CNTs: Dispersion/Mixture by Ultrasonication. Metals 2017, 7, 279. [Google Scholar] [CrossRef]
- Guo, B.; Song, M.; Zhang, X.; Liu, Y.; Cen, X.; Chen, B.; Li, W. Exploiting the synergic strengthening effects of stacking faults in carbon nanotubes reinforced aluminum matrix composites for enhanced mechanical properties. Comp. Eng. 2021, 211, 108646. [Google Scholar] [CrossRef]
- Kelly, A.; Tyson, A.W. Tensile Properties of Fiber-Reinforced Metals: Copper/Tungsten and Copper/Molybedenumn. J. Mech. Phys. Solids 1965, 13, 329–350. [Google Scholar] [CrossRef]
- Hansen, N. Hall-petch relation and boundary strengthening. Scr. Mater. 2004, 51, 801–806. [Google Scholar] [CrossRef]
- Nardone, V.C.; Prewo, K.M. On the strength of discontinuous silicon carbide reinforced aluminum composites. Scr. Metall. 1986, 20, 43–48. [Google Scholar] [CrossRef]
- Carneiro, Í.; Fernandes, J.V.; Simões, S. Deformation behavior of cold-rolled Ni/CNT nanocomposites. Appl. Sci. 2022, 12, 9471. [Google Scholar] [CrossRef]
Disclaimer/Publisher’s Note: The statements, opinions and data contained in all publications are solely those of the individual author(s) and contributor(s) and not of MDPI and/or the editor(s). MDPI and/or the editor(s) disclaim responsibility for any injury to people or property resulting from any ideas, methods, instructions or products referred to in the content. |
© 2023 by the authors. Licensee MDPI, Basel, Switzerland. This article is an open access article distributed under the terms and conditions of the Creative Commons Attribution (CC BY) license (https://creativecommons.org/licenses/by/4.0/).