Article

Experimental Analysis of the Influence of Gear Design and Catch Weight on the Fluid–Structure Interaction of a Flexible Codend Structure Used in Trawl Fisheries

1
College of Marine Sciences, Shanghai Ocean University, Shanghai 201306, China
2
National Engineering Research Center for Oceanic Fisheries, Shanghai 201306, China
3
Key Laboratory of Oceanic Fisheries Exploration, Ministry of Agriculture and Rural Affairs, Shanghai 201306, China
4
The Key Laboratory of Sustainable Exploitation of Oceanic Fisheries Resources, Shanghai Ocean University, Ministry of Education, Shanghai 201306, China
5
Center for Polar Research, Shanghai Ocean University, Shanghai 201306, China
6
Department of Marine Biosciences, Tokyo University of Marine Science and Technology, Minato, Tokyo 108-8477, Japan
*
Authors to whom correspondence should be addressed.
Appl. Sci. 2023, 13(4), 2505; https://doi.org/10.3390/app13042505
Submission received: 12 January 2023 / Revised: 12 February 2023 / Accepted: 14 February 2023 / Published: 15 February 2023
(This article belongs to the Section Marine Science and Engineering)

Abstract

:
This study evaluated the behavior of different codend designs to provide the basic information that is relevant for improving the gear selectivity, energy efficiency, to better understand the fish behavior inside the codend, and prevent the probability of the fish escaping. Three different codends were designed from the standard codend commonly used in the Antarctic krill fisheries based on modified Tauti’s law and evaluated. The first and the third codends were designed with four-panel and two-panel nettings, respectively, both made of diamond meshes. While, the second one was a four-panel diamond mesh design with cutting ratio 4:1(N [NBNBN]16). We measured the drag force, codend shape, fluttering codend motions, and the flow field inside and behind the different codends composed of different catch weights under various flow velocities in flume tank. The power spectra density was undertaken to analyze the time evolution of measured parameters. The results showed that the drag force and the codend motion increased and decreased, respectively, with the number of net panels and the cutting ratio. Due to the catch weight and flow velocity, which caused significant codend motions and deformation, a complex interaction occurred between the fluid and the structure, and there was a strong correlation between the codend drag, the codend motions, and the turbulent flow inside and behind the codend. The study showed that the use of the four-panel codend with cutting ratio and the two-panel codend resulted in drag reductions of 6.07% and 6.41%, respectively, compared to the standard codend. The velocity reduction and turbulent kinetic energy were lower inside and behind the four-panel codend than inside and behind the two-panel codend, indicating that turbulent flow through the two-panel codend is more important than through the four-panel codend. The results of the power spectral density analysis showed that the drag and codend motions were mainly low frequency in all codends, with another component related to turbulent flow street. In addition, the two-panel codend showed more unstable behavior with more pendulum motion compared to the four-panel codends, resulting in a smaller mesh size in this codend that could affect swimming energy and thus influence fish escape, making it the least selective codend. The results of this study provide fundamental insights useful for understanding and improving the hydrodynamic performance and selectivity of trawls in the Antarctic krill fishery, especially to reveal the masking effects of the number of net panels on codend design.

1. Introduction

Understanding the engineering performance of the trawl codend in terms of hydrodynamic characteristics and selectivity is essential for the improvement, development, and operation of bottom trawl and midwater trawl effectiveness with successful retention of target catch, high fuel efficiency, and low collateral environmental impact [1,2,3,4]. Indeed, as one of the main components of the trawl net, the codends are the rear part of the trawls, which collect the catch and where most selectivity process occurs [5,6]. In addition, the codend drag has a particularity that varies during the towing in the fact that it increases as the catch builds up, which must be taken into account [7,8,9,10]. This codend drag varies considerably depending on the trawl motions, which will influence the codend geometry and reduce the mesh opening, restricting the flow passage through the codend. Therefore, taking into account the codend drag linked to the codend design and oscillatory motions is essential for the better knowledge and understanding of the trawl selectivity process, fish behavior, and the state of health of fish escaping into the trawl mesh [10,11,12,13].
However, the interaction between fluid and fluttering codend motions is an extremely complex and important issue that can be used to understand the development of unsteady turbulent flow such as vortex shedding inside and outside the codend and its impact on the trawl performance. Indeed, the interaction between the catches and water motions will create a pressure gradient on the codend surface that will create intense codend motions. These codend motions produce the vortex shedding and the wake of the gear directly related to elastic, kinematic, and dynamic instabilities of the drag force acting on it and may affect the selectivity via the fish response, such as swimming speed and maneuverability [14,15,16]. The fact that the study of the interaction between fluid and fluttering codend motions greatly affects the gear selectivity makes it a hot research topic in many fisheries. This is because the improvement in gear selectivity has increased in recent years due to the decline in fish stocks influenced by several discards at sea and bycatches of undesirable species [10,15,17]. However, much research has improved the gear selectivity, largely by examining the mesh size selection relative to the fish size without considering this complex interaction [18,19,20,21]. Therefore, the development and the innovation of the codend design to improve the selective properties, the physical performance of the codend, and increasing the fisheries sustainability are some of the great challenges that have attracted more attention and studies in scientific research in order to maintain the marine ecosystem.
In the past decades, some experimental studies on the analysis of the codend behavior have been reported in several researches. O’Neill et al. [10,22] examined the effect of flow velocity and codend catch on the codend drag associated with the drag coefficient of each codend. They concluded that the towing speed and the maximum frontal area of the codend were the predominant components of the codend drag. Priour and Prada [18] analyzed the effect of catch weight on trawl behavior by using the real measurements at sea and found that the ratio of the volume behind the front on the catch volume could significantly influence the netting surface area affected by the catch. Madsen et al. [17] evaluated the behavior of six different codends designed with different mesh shapes to evaluate the impact of codend design (four- and two-pieces using diamond, T0, and T90 meshes) on the codend drag and movement of the codend, and found that each codend oscillates considerably when loaded with the catch. Liu et al. [6] analyzed the effect of cutting ratio and catch on drag characteristics and fluttering codend motions and found that the unfolding degree of codend netting and the height of codends was directly proportional to the current speed and inversely proportional to the cutting ratio. Some researchers have studied the physical performance and the codend selectivity by analyzing the flow field around the codend linked to their motions. For example, Kim [16,23] performed one-point measurements inside realistic codends of a shrimp beam and bottom trawls using Acoustic Doppler Velocimeter (ADV) and confirmed that turbulence flow inside the codend structure impacted the selective properties of the codend by impacting the likelihood of escape. Druault and Germain [15] characterized the flow in the unsteady wake developed behind the fluttering codend structure and found that the local hydrodynamic effects that occur in the wake zone, and the motion of the fluttering codend can cause the codend oscillations. Cheng et al. [24] analyzed the hydrodynamic performance of one full-scale T0 and T90 codends and compared using flume tank testing, with and without a small-mesh cover. They discovered that T90 codends kept meshes that were comparatively open and had much more drag than T0 codends. Nguyen et al. [25] developed a full-scale shaking codend (T90 codend with canvas) to reduce the retention of undersized fish in the redfish. They discovered that the total acceleration and drag forces estimated for the shaking codend were significantly higher than the T90 codend across all flow velocities.
However, despite the existing work on the subject and the available data, there is no relevant conclusion on the experimental studies evaluating the effect of the catch weight and codend design on the fluid–structure interaction of the codend. The existing experimental and numerical research lacks a detailed analysis of the simultaneous effect of turbulent flow and the fluttering codend motions on the hydrodynamic behavior of the codend, although it is important for the trawl design because of its effect on hydrodynamic forces, selectivity, and fish behavior. In addition, the previous studies have other limitations, such as: (i) the different size of catches was not taken into account; and (ii) the effect of the codend oscillations and shape on the analysis of the hydrodynamic forces and unsteady turbulent flow in order to reliably improve the engineering performance and understand the catch process and fish selectivity were not discussed.
In this study, three scaled flexible codend structure models were designed and tested in a flume tank with different catch weights to evaluate the basic behavior of different codend designs mainly used in the midwater fisheries to discuss the relevant information that could be used to improve codend selectivity, reducing energy consumption, and understand the fish behavior. More precisely, the analysis was focused on the hydrodynamic force’s measurements, codend motions, gear shape, and velocity measurements inside and behind the codend on the determination of the instantaneous velocity fields and turbulence indicator such as turbulent kinetic energy. Thereby, this study analyzes the influence of gear design parameters, catch weights, and inflow velocities on the fluid structure interaction of the flexible codend structure. The power spectra density (PSD) method was applied to analyze the frequency of temporal measured parameters. The findings are expected to contribute to the improvement of the trawl performance and selectivity control.

2. Material and Methods

2.1. Choice and Design of the Codends

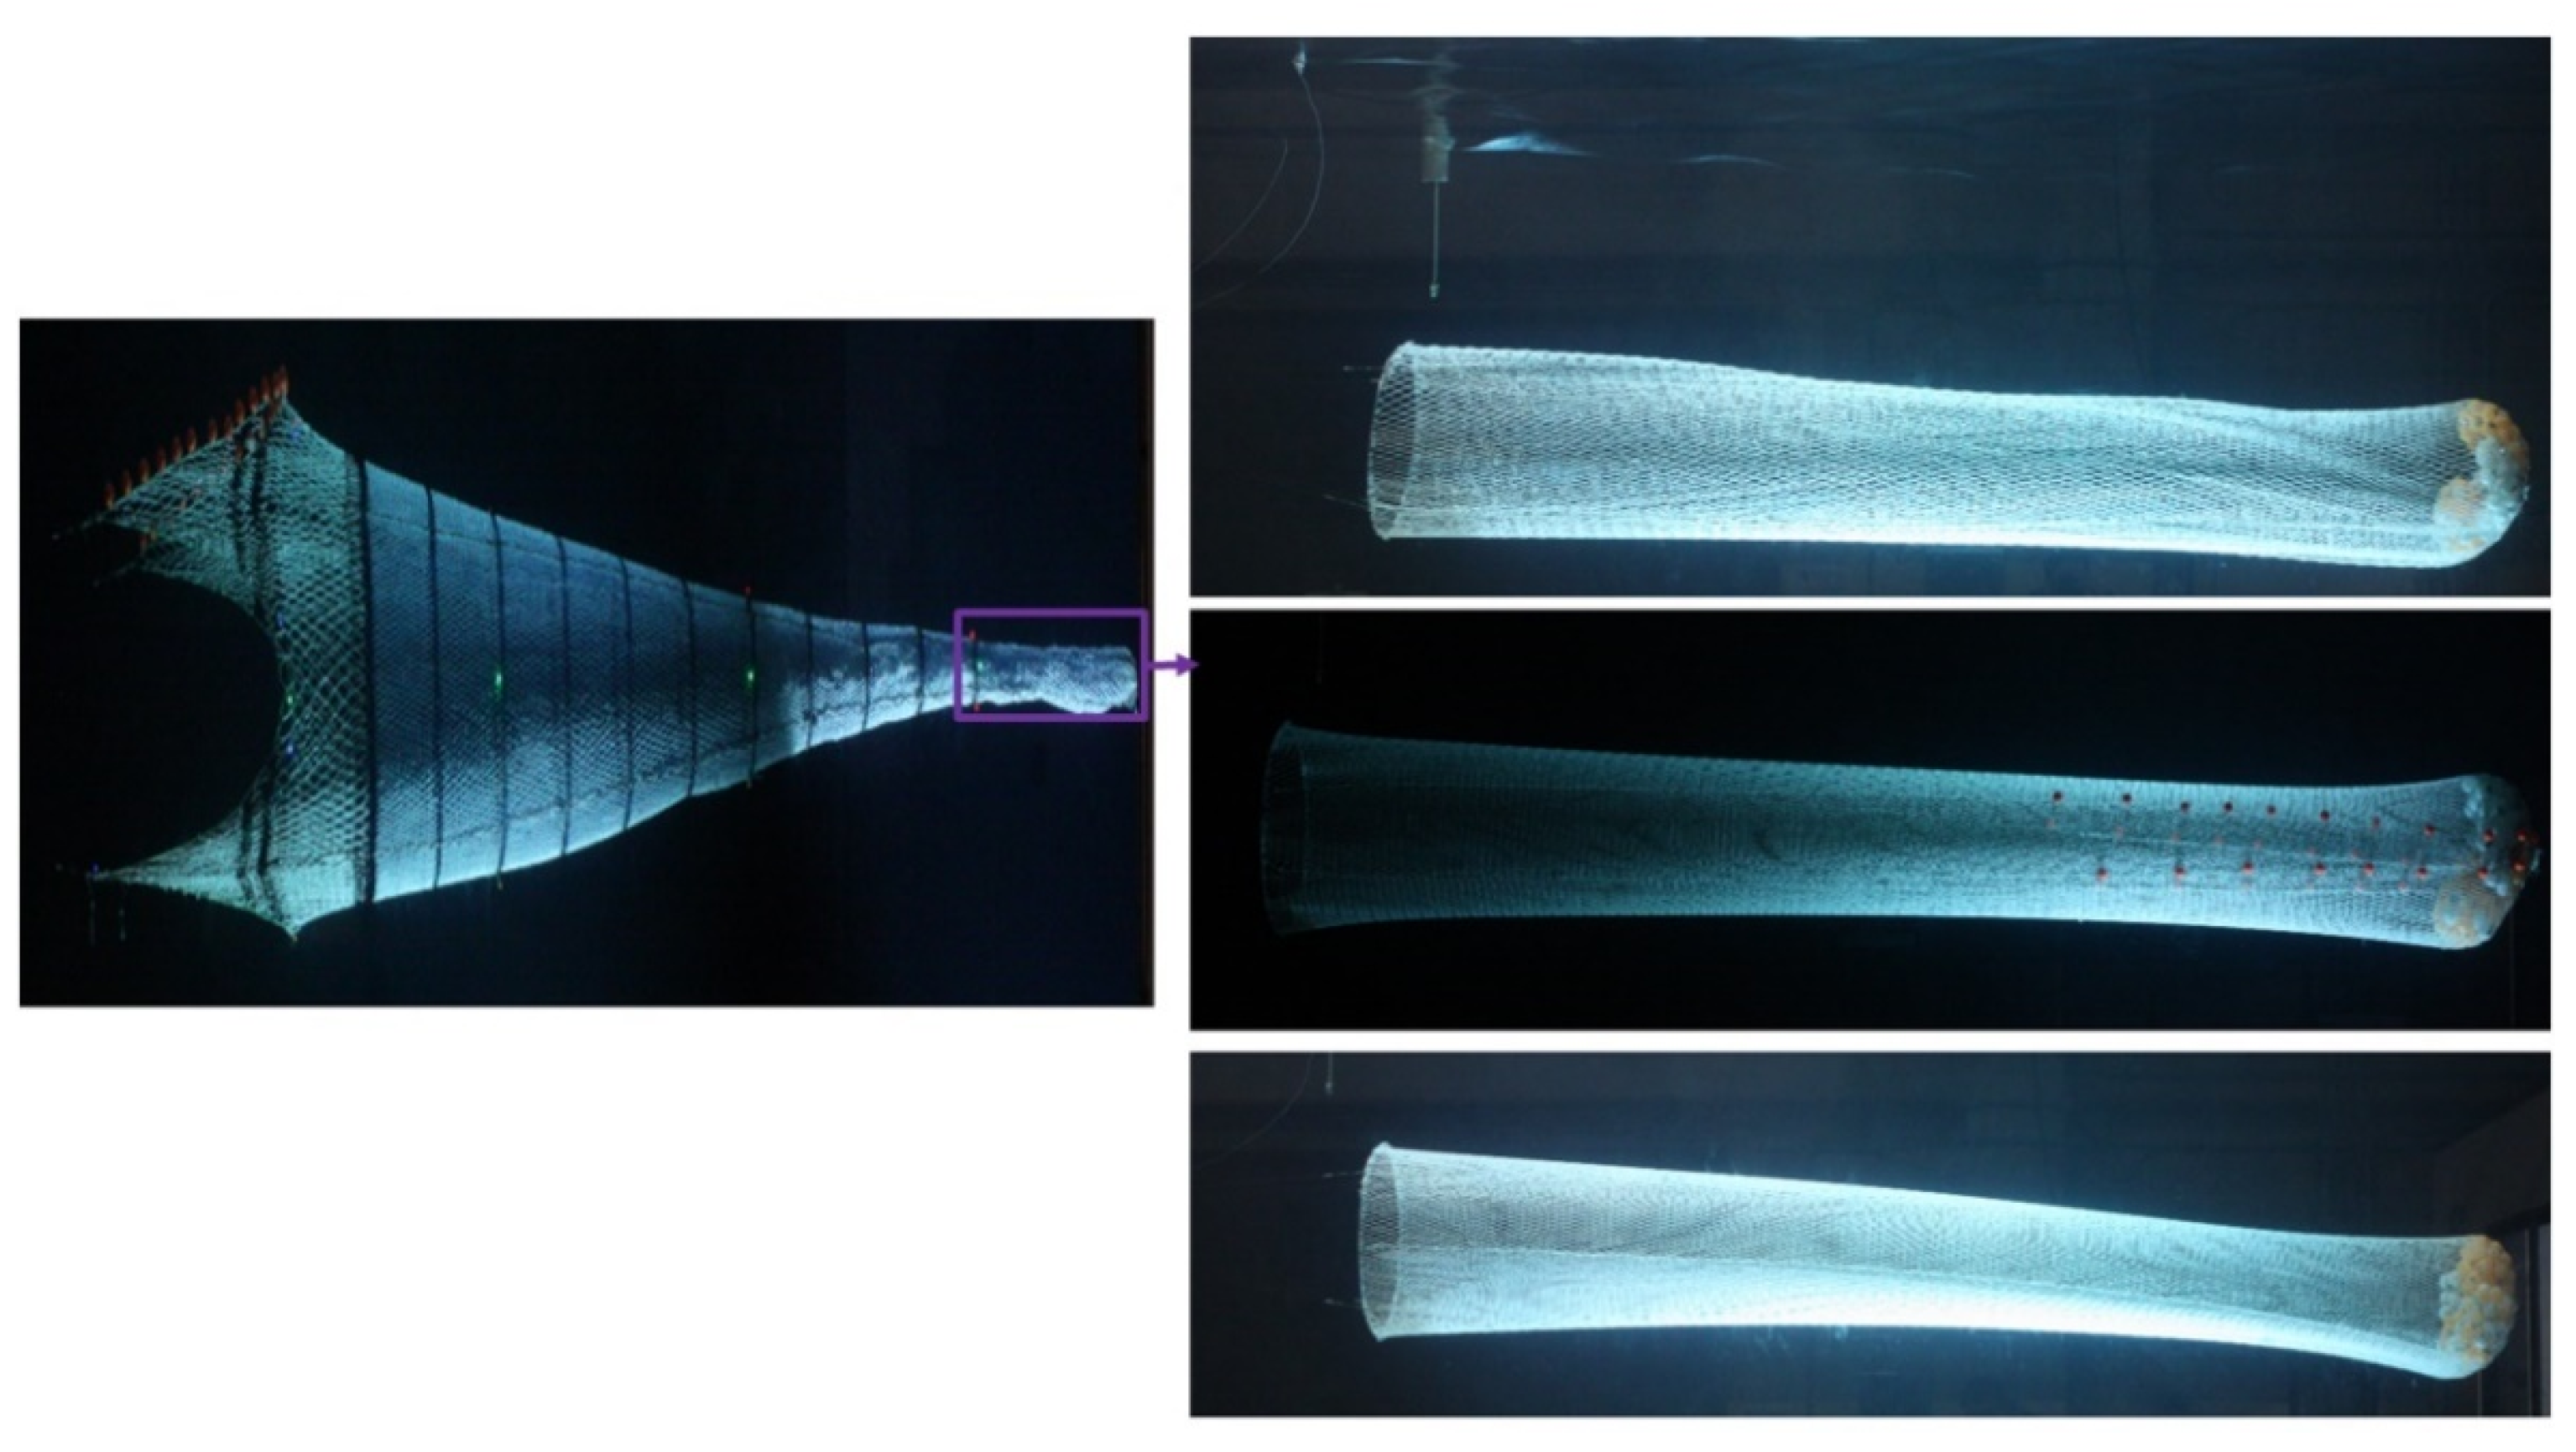
Three different trawl codends were selected and constructed in model scale based on modified Tauti’s Law (See Figure 1 and Figure 2). All three codends were designed with particular attention to the Antarctic fisheries. Overall, three codend models were designed on 1/15th scale in length and 1/5th scale in mesh size and twine diameter based on the full-scale trawl codend. The first codend (standard codend) called “codend 1” was a four-panel (4p) diamond mesh. The second one called “codend 2” was a four-panel (4p) diamond mesh design with cutting 4:1. Finally, the third one called “codend 3” was a two-panel (2p) codend made of full diamond meshes; this codend may provide better hydrodynamic performance for Antarctic krill fisheries compared to other codends (See Figure 2).
The three codends were designed with the same overall length of 2.59 m, a mesh size of 30 mm, and a twine diameter of 3 mm using polyamide (PA) twine materials with diamond-shaped meshes. Codends 1 and 2 were constructed by assembling four pieces of netting, while codend 3 was designed by assembling two pieces of netting (See Figure 1 and Table 1). For codends 1 and 3, each piece of netting is joined by part 1 (40 mesh × 50 mesh) and part 2 (40 mesh × 50 mesh). However, for the codend 2, the part 1 was designed with 40 mesh × 50 mesh and the part 2 was design with a cutting ratio 4:1. These codend models were combined with a liner constructed using polyamide (PA) material, with a mesh of 10 mm and a twine diameter of 0.2 mm.
During the experimental measurement, the small plastic balls filled with on average, 0.045 kg of water each were used to simulate the fish catch inside the gear (see Figure 2). Thus, four different catch weights of 0, 7.4, 14.8, and 22.3 kg were used in each codend.

2.2. The Measurement of the Hydrodynamic Forces in the Flume Tank

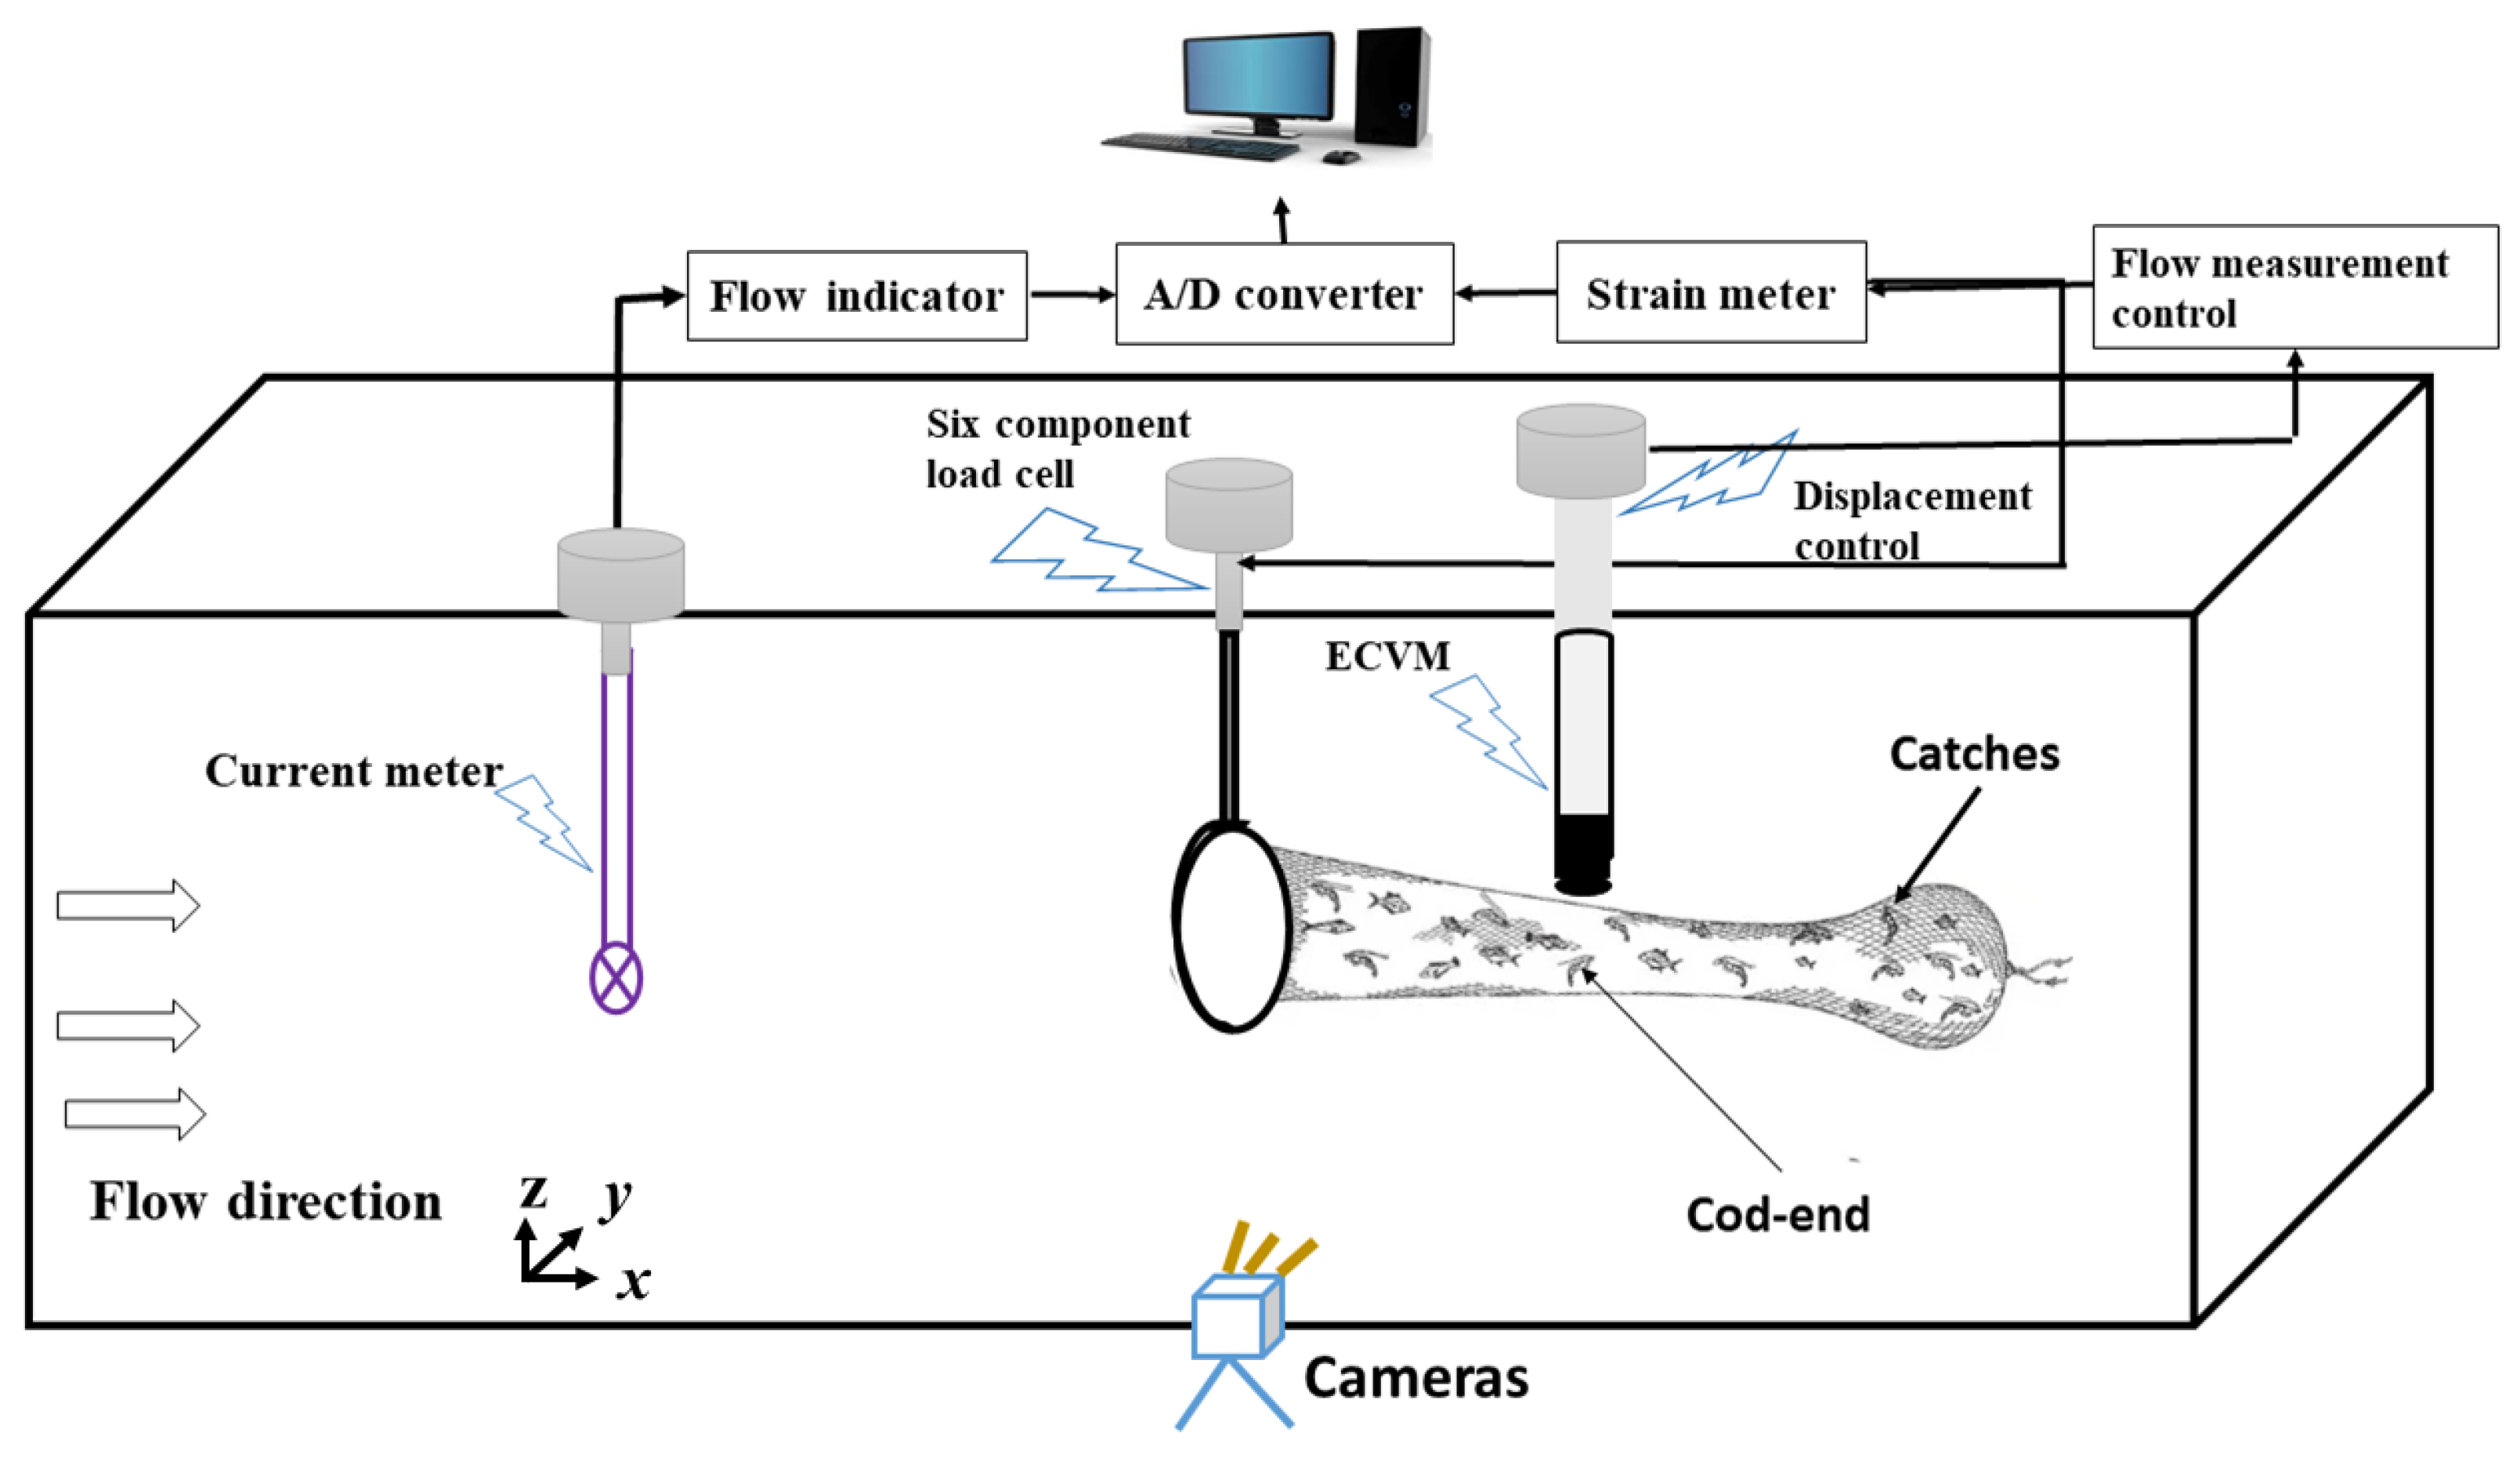
A series of experiments measuring the drag of the three codends for a range flow velocities and range catch sizes were carried out in the flume tank at Tokyo University of Marine Sciences and Technology (TUMSAT). The flume tank is 9.0 m long by 2.2 m wide and 1.95 m deep with a side observation window of 9.0 m × 1.6 m. A front and bottom view window of the flume tank allows users to observe the codend behavior during testing and to take video footage during drag measurements. The volume of the water in the flume tank was ~150 m3. The flow was circulated with four contra-rotating impellers via constant-speed hydraulic delivery pumps with a diameter of 1.6 m in diameter. The flow speed can be varied from 0.1 to 2.0 m/s, the acceleration varied from 1.0 to 5.0 cm/s2, and the reciprocating oscillation flow of velocity amplitude was ±0.5 m/s. The turbulent level in the flume tank is 4.63% and can be increased to 18% when removing the flow straighteners [26,27]. The codend models were mounted on a 0.45 m circular rigid frame and submerged in water at a depth of 0.15 m that were attached at a vertical bar to a sensor recording the drag forces of the codend (see Figure 3). A current meter was installed at approximately 2.0 m upstream of the codend model to detect the flow velocity. The drag force signals, as measured using the load cell, were amplified using a dynamic strain amplifier (DPM-6H). These signals and the flow velocity signals were then sent to an A/D converter and subsequently to a computer. The drag forces were measured using a six-component load cell with a capacity of 5 kg each and a specified accuracy of 2% (TLP-5KS, Tokyo Measuring Instruments Co., Ltd.; Tokyo, Japan). These load cells were calibrated and zeroed at both the beginning and the end of each test, and their linearity was confirmed. The measurements were taken using five (5) flow velocities varying from 0.5 to 0.9 m/s with an interval of 0.1m/s. The flow velocity in the flume is relatively even (±4%). The data rate was 50 samples per second and an average value was estimated based on 3000 individual measurements obtained over 60 s. The data were sampled at the frequency of 50 Hz. As shown in Figure 3, the codend models located at the middle of the flume tank were free to move in the water flow. The measuring methods and steps of hydrodynamic forces are as follows (see Figure 3):
(1)
The voltage signals of hydrodynamic forces are transmitted to the strain meter using the sensor during the flow passage thought the combining codend and circular frame system;
(2)
The strain meter amplifies and integrates sensor signals, producing analog signal information that can be displayed continuously online;
(3)
The analog signals are changed to digital signals by an A/D converter;
(4)
Hydrodynamic forces are represented using computer calibration coefficients. In the above manner, flow velocity signals are also obtained from the propeller tachometer sensor.
The displacement of the catch was not observed during the test. The end-part of the codend was assumed to be a sphere, and the diameter of this sphere (d) was measured during the experiments and the values are reported in Table 2. Thus, to evaluate the effect of twine area and catch size on the drag of different codends, the relationship between drag coefficient and Reynolds number was established. Reynolds number represents the ratio of inertial and viscous forces:
R e     =   u 0   L ν ,
where u 0   is the flow velocity, L is the length in m, ν is the kinematic viscosity, and R e   is the Reynolds number. In this study, twine thickness was used to evaluate the effect of twine material and twine diameter on the drag, and codend diameter was used to evaluate the effect of catch weight on the drag.
The drag coefficient was calculated based on d in order to establish the influence of the catch weight on the codend drag and also as a function of twine area to evaluate the effect of twine area on codend drag:
C d 1 = 8 F D ρ π d 2   u 0   2
C d 2 = F D 0.5 ρ A   u 0   2
where C d 1 is the drag coefficient as a function of catch, C d 2 is the drag coefficient as a function of twine area, F D is the codend drag, d is the codend diameter, and A is the twine area.
Twine area A was calculated using Equation (4):
A = 2adn
where d is twine diameter; a is the mesh size; n is the number of meshes in the trawl codend. The resulting twine areas of the model codends are shown in Table 2.

2.3. Measurement of the Codend Shape and Motions

As we mentioned above, a series of videos describing the codend fluttering motions were taken from the front and bottom views of the flume tank observation port as indicated in Figure 3. A three-minute recording was made of the codend during each test case with a video camera that was kept in a fixed position and with constant zoom and focus settings. These video cameras used to record the different codend behaviors had a frequency of 59 Hz per frame image and a resolution of 1920 × 1080 pixels 2 (manufactured by Dantec Hi-sense, with a focal lens length of 60 mm) [9,27]. In order to obtain the fluttering motions of the three codends at different catch weight, we used the first minute (60 s) of the three-minute recorded. Thus, to obtain the codend motions, a series of images (240) were firstly captured at 0.25 s each from the recorded video footage.
These series of images were imported in MATLAB R2018A software to extract the coordinates of the of the characteristic’s points on each codends based on a plane-coordinate system. Thereafter, these coordinates that represented the codend behaviors were subsequently interpolated, thereby allowing the determination of the temporal motions of the different codends under different catch weights. The strains in the camera lens, water refraction, and parallax have affected the extraction of these coordinates, thus, a standard bar was used to mitigate the effect of the strains and to calibrate the measurements. Moreover, the 2D coordinates encoding the codend shape with different catch weights were obtained from the images captured via the same digital cameras. The codend motions were obtained at the frequency of 4 Hz.

2.4. Flow Measurements

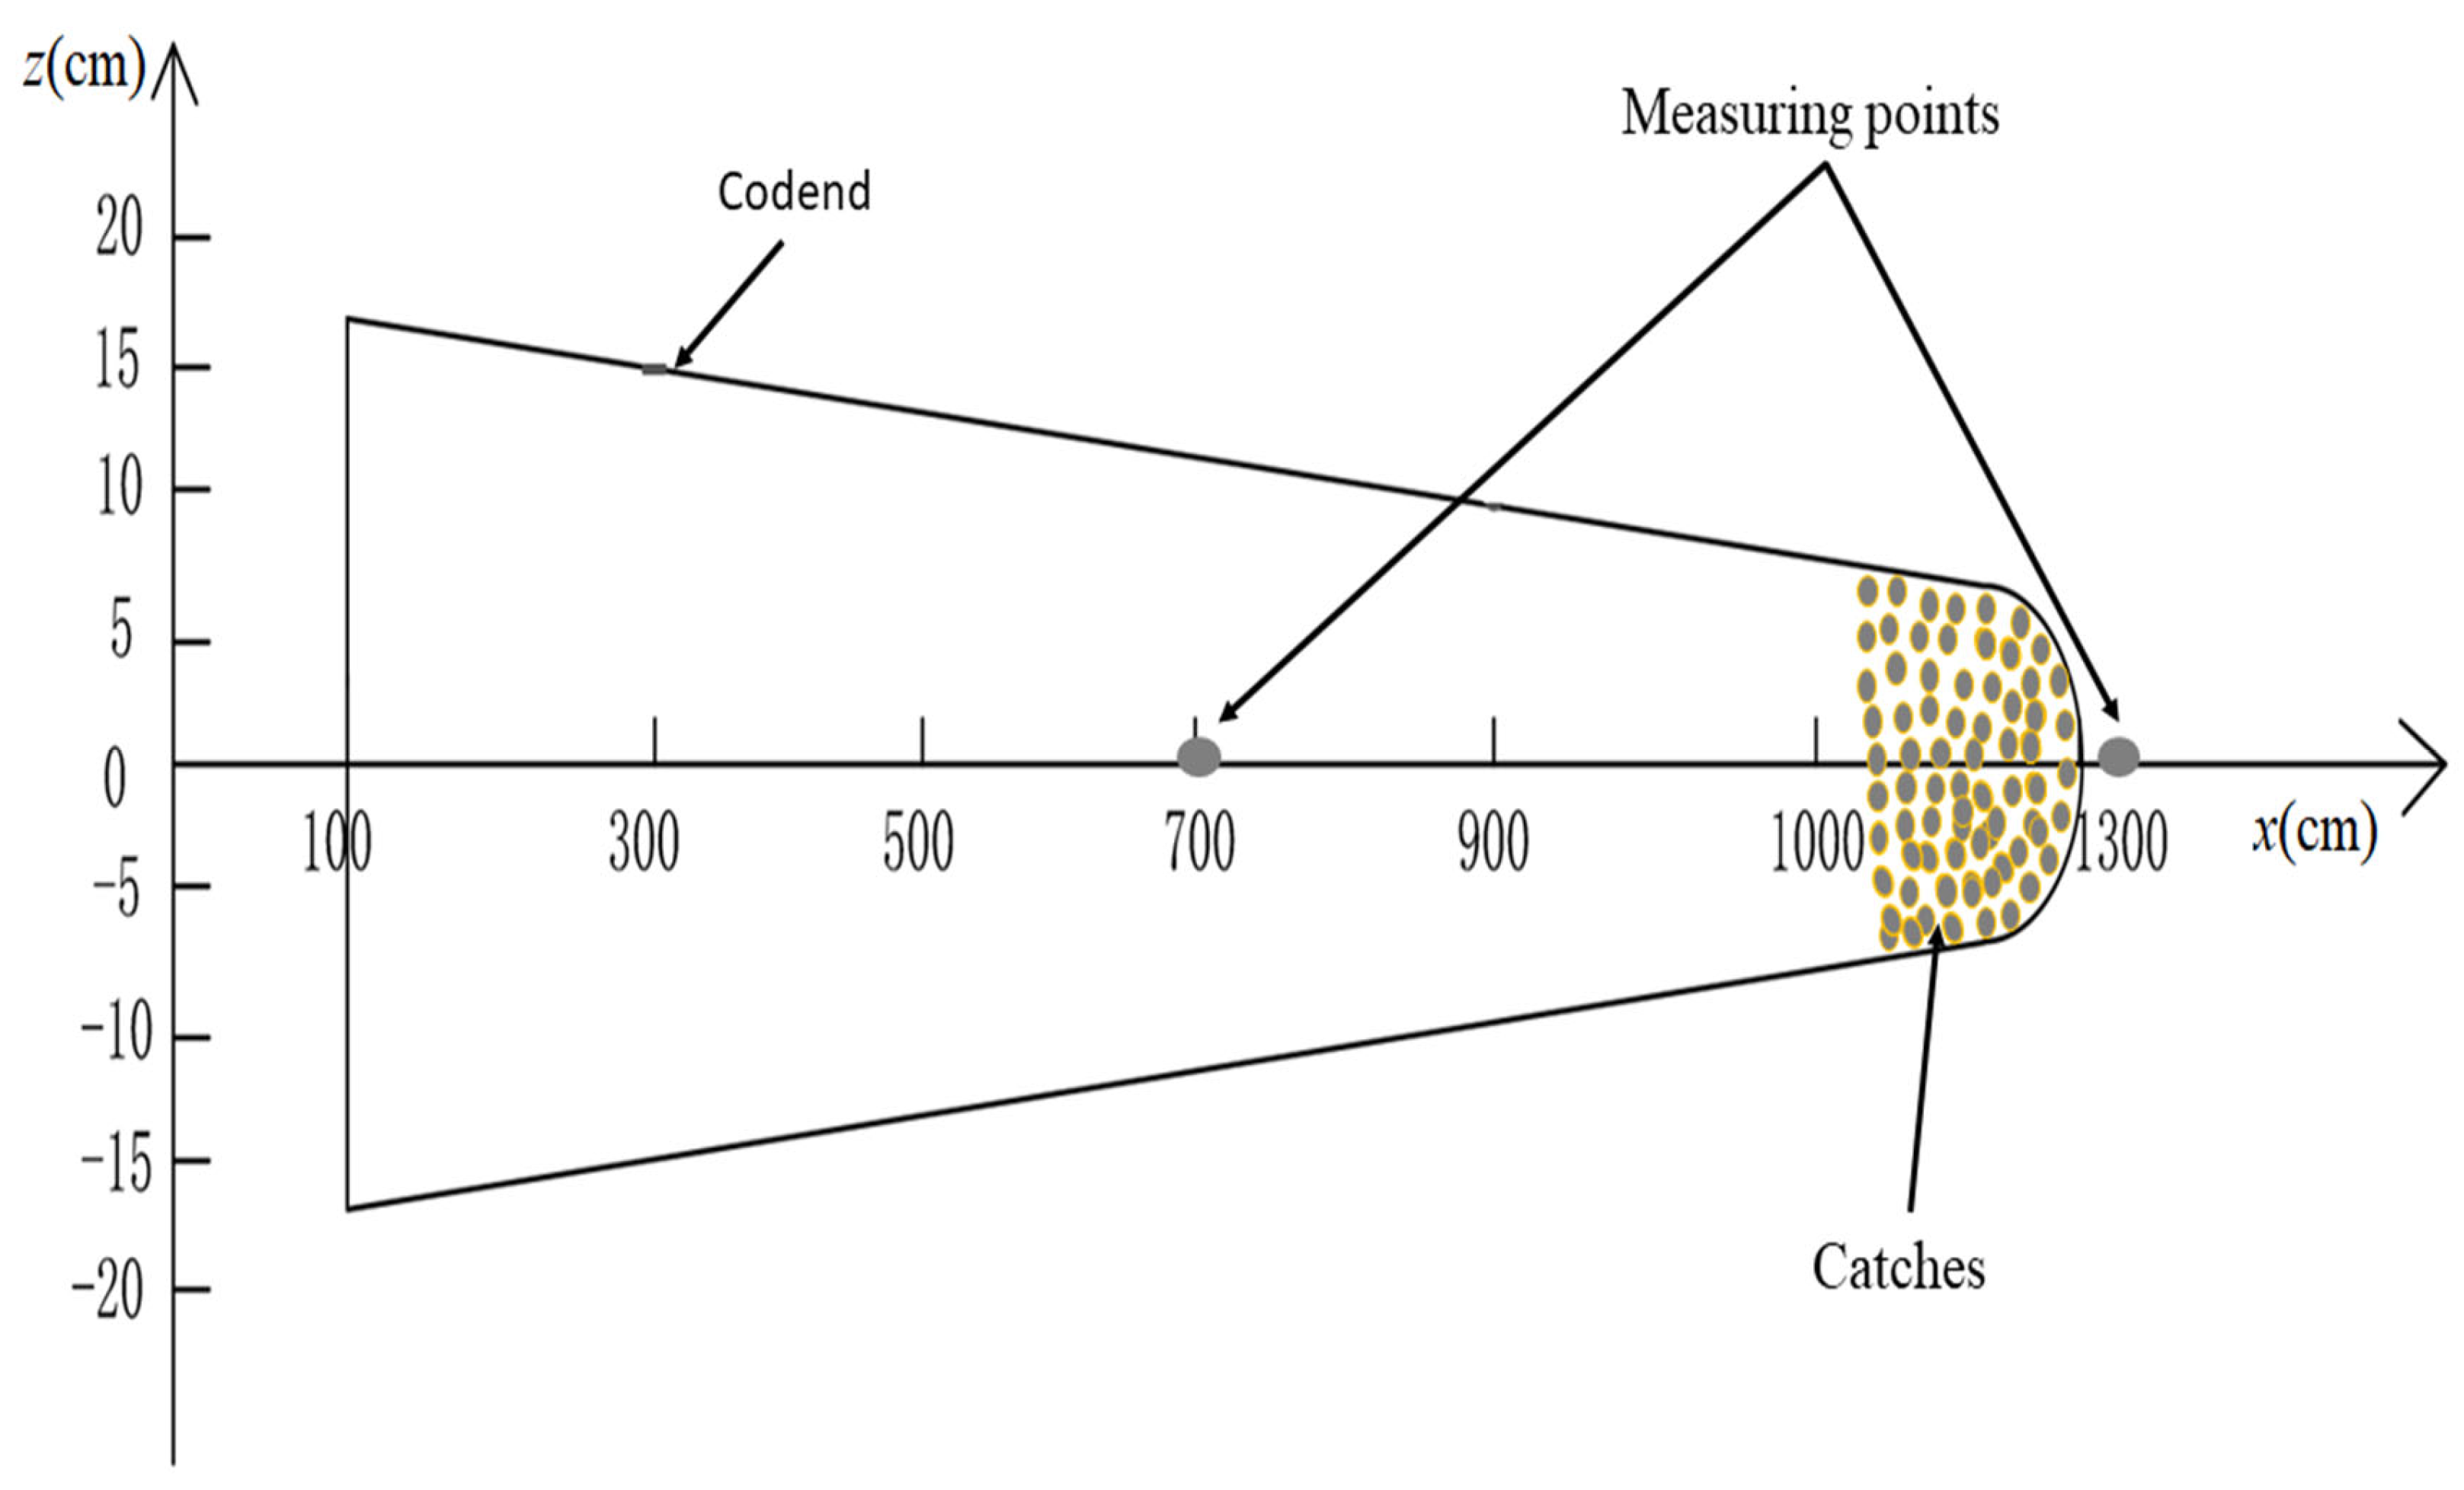
The flow measuring device used was a two-component ECVM ACM2-RS techniques manufactured by JFE Advantech Co., Ltd., Nishinimiya, Japan. This device is an electromagnetic induction type with a diameter of 34 mm and a length of 420 mm [27]. The detecting parts are characterized with a diameter of 6 mm, a length of 18 mm, and a specified accuracy of 0.5 cm/s (2%), a resolution of 0.1 cm/s, and zero-point stability of ±0.15 cm/s from JFE Advantech Co., Ltd. technical specifications. A steel frame was designed as a holding frame and formed a cylinder to keep the device in the orthogonal position, and to protect the sensor of the device from the net and other obstacles (Figure 3). The flow field through the codend was determined as the flow velocity relative to the upper and side panel of the codend; these two instantaneous velocity components are denoted (u, v) along (x, z) directions, respectively. Due to the low mesh size of the liner, the mesh on the measurement point inside the codend was increased by combining four meshes on the liner as a mesh with the size of 40 mm. The ECVM probe was attached to the parallelepiped steel frame that allowed it to asses different codend, keep it in the orthogonal position, and protect the device sensor from the obstacles. The combined ECVM probe and steel frame were mounted on an instrumentation rack that could be moved in two dimensions at 5 cm steps, the vector device was held in an orthogonal position, and the device sensor was protected from obstacles [27]. Two points were set on the central line inside and behind each codend along the x-axis (See Figure 4). The flow field measurements were carried under an inflow velocity of 50 cm/s and the catch weight of 7.4 kg.
Datasets were obtained as 4 Hz sampling of flow velocity data. The two components of velocity data were assessed every 125 s (i.e., 4 Hz × 125 s = 500 velocity datasets) to determine the turbulent kinetic energy and oscillation frequency. These measurements were run three times to assess the repeatability of the findings. The data was post-processed to eliminate erroneous velocity data and a two-dimensional (2D) velocity correlation value upwards of 95% among the two components of velocity data.
Due to the random motions of the codend structure and the limited number of instantaneous ECVM samples available, in the case of a completely unstable flow, each velocity field u (x, z, t) can be instantaneously decomposed as follows:
u ( x ,   z ,   t ) = u x , z ¯ + u   ( x ,   z ,   t ) ,   t = t 1 ,   t 2 , , t N t ,  
where u ¯ and u′ correspond to the mean velocity field and its associated fluctuating part, respectively.
The turbulence kinetic energy (TKE) can be written as:
T k e = u 2 ¯ + v 2 ¯ 2 ,
where u′ and v′ represent the flow velocity components of the fluctuation in u and v, respectively.

2.5. Power Spectral Density Features from Fast Fourier Transform

The power spectral density (PSD) of the fast Fourier-transform (FFT) was used to analyze the time series of the drag, codend motions, and the flow field inside and behind different codend based Welch’s method and using a Hann window. An examination of the power distribution throughout the whole frequency range is provided by the PSD of a signal. The primary objective of this approach is to estimate the spectral density from the provided data. It is calculated by performing an autocorrelation function FFT on the signals. It determines the signal’s strength after interpreting it as a stochastic process [28,29]. The method has been implemented using MATLAB R2019B software. During the implementation of the Fourier spectral analysis, the Welch method is used to compute spectra in order to improve statistical convergence. This is because of the complexity of the interaction between the flow and the codend structure linked to the catches that allow the need for the much longer signals in order to evaluate the predominant frequency peaks with sufficient precision. Indeed, the PSD describes how power is distributed over the frequency content of the random process. It complements the probability density function in the definition of a specific random process. An intuitive and historically important way of obtaining a PSD was by filtering and averaging random process. Abundant processing capabilities of modern computers make it possible to obtain the PSD by means of the Fourier-transform, commonly using the FFT algorithm of the Discrete Fourier-Transform (DFT) [30,31,32,33,34]. The transformed vector 𝑋(𝑘) is generally a complex value, and the spectral content of the signal is expressed by the real value of the PSD function:
S ( f k ) = S ( k ) = 1 N X f k 2
where
f k = k N
As the PSD is based on a finite set of samples, it can be calculated even for periodic signals. In the case of noncoherent sampling, the estimation suffers from the phenomena of picket fence and leakage. To suppress these effects, windowing techniques have been developed. Windowing means that the signal x n is multiplied by the so-called window function w n prior to the transform:
X w k = n = 0 N 1 x n w n e j 2 π N   n ,   k = 0 . . N 1
A huge set of window functions have been developed in the last decades. All of them can improve the result of the estimation, and many of them are optimal in a certain sense. A significant application of PSD calculation is the analysis of periodic or quasi-periodic signals corrupted by measurement noise. Unfortunately, the measurement noise can hinder the detection of all important harmonic components of the signal. In this case, one finite set of 𝑁 samples is insufficient, a long series of samples are recorded, and many consecutive blocks of 𝑁 samples are transformed, and the estimator is obtained by averaging the individual PSDs. The blocks can overlap, according to the Welch method. The mean of the individual estimates can be calculated by linear averaging:
S ¯ k = 1 M m = 0 M 1 S m k
where S ¯ k denotes the averaged PSD, and S m k is the PSD of block m. Exponential averaging is also commonly used, when the averaged PSD is calculated in the following way:
S ¯ k = S ¯ k + α S m k S ¯ k
where α is the so-called smoothing constant, S ¯ k   and S m k denote the averaged and the individual PSD, respectively. For high-precision measurements, the bias caused by the noise can be eliminated by subtracting the PSD of the noise from S ¯ k .

2.6. Statistical Analysis

The data regarding the drag force, flow velocity, and the motions of the three codends obtained from the flume tank were analyzed to investigate differences in codend geometry, motions, and drag force between the three codends. In our first analysis, we compared the engineering performance between the three codends when tested under the same conditions. In our second analysis, we study the effect of catch weights and gear design on the hydrodynamic performance of the codend.
The hypotheses that the codend design accurately impacted the gear performance and secondly that the catch weight impacted the codend drag and motions were statistically tested, requiring either parametric or non-parametric statistical test depending on the degree of homogeneity of variance within the datasets. To this end, the generalized linear mixed models (GLMM) were found to be appropriate statistical approaches to investigate these hypotheses. More detail about the method can found in McCulloch [35]. All of the statistical procedures were performed using the IBM SPSS Statistics software package.

3. Results

3.1. Spectral Analysis of Effect of Catch Weight and Gear Design on the Codend Drag

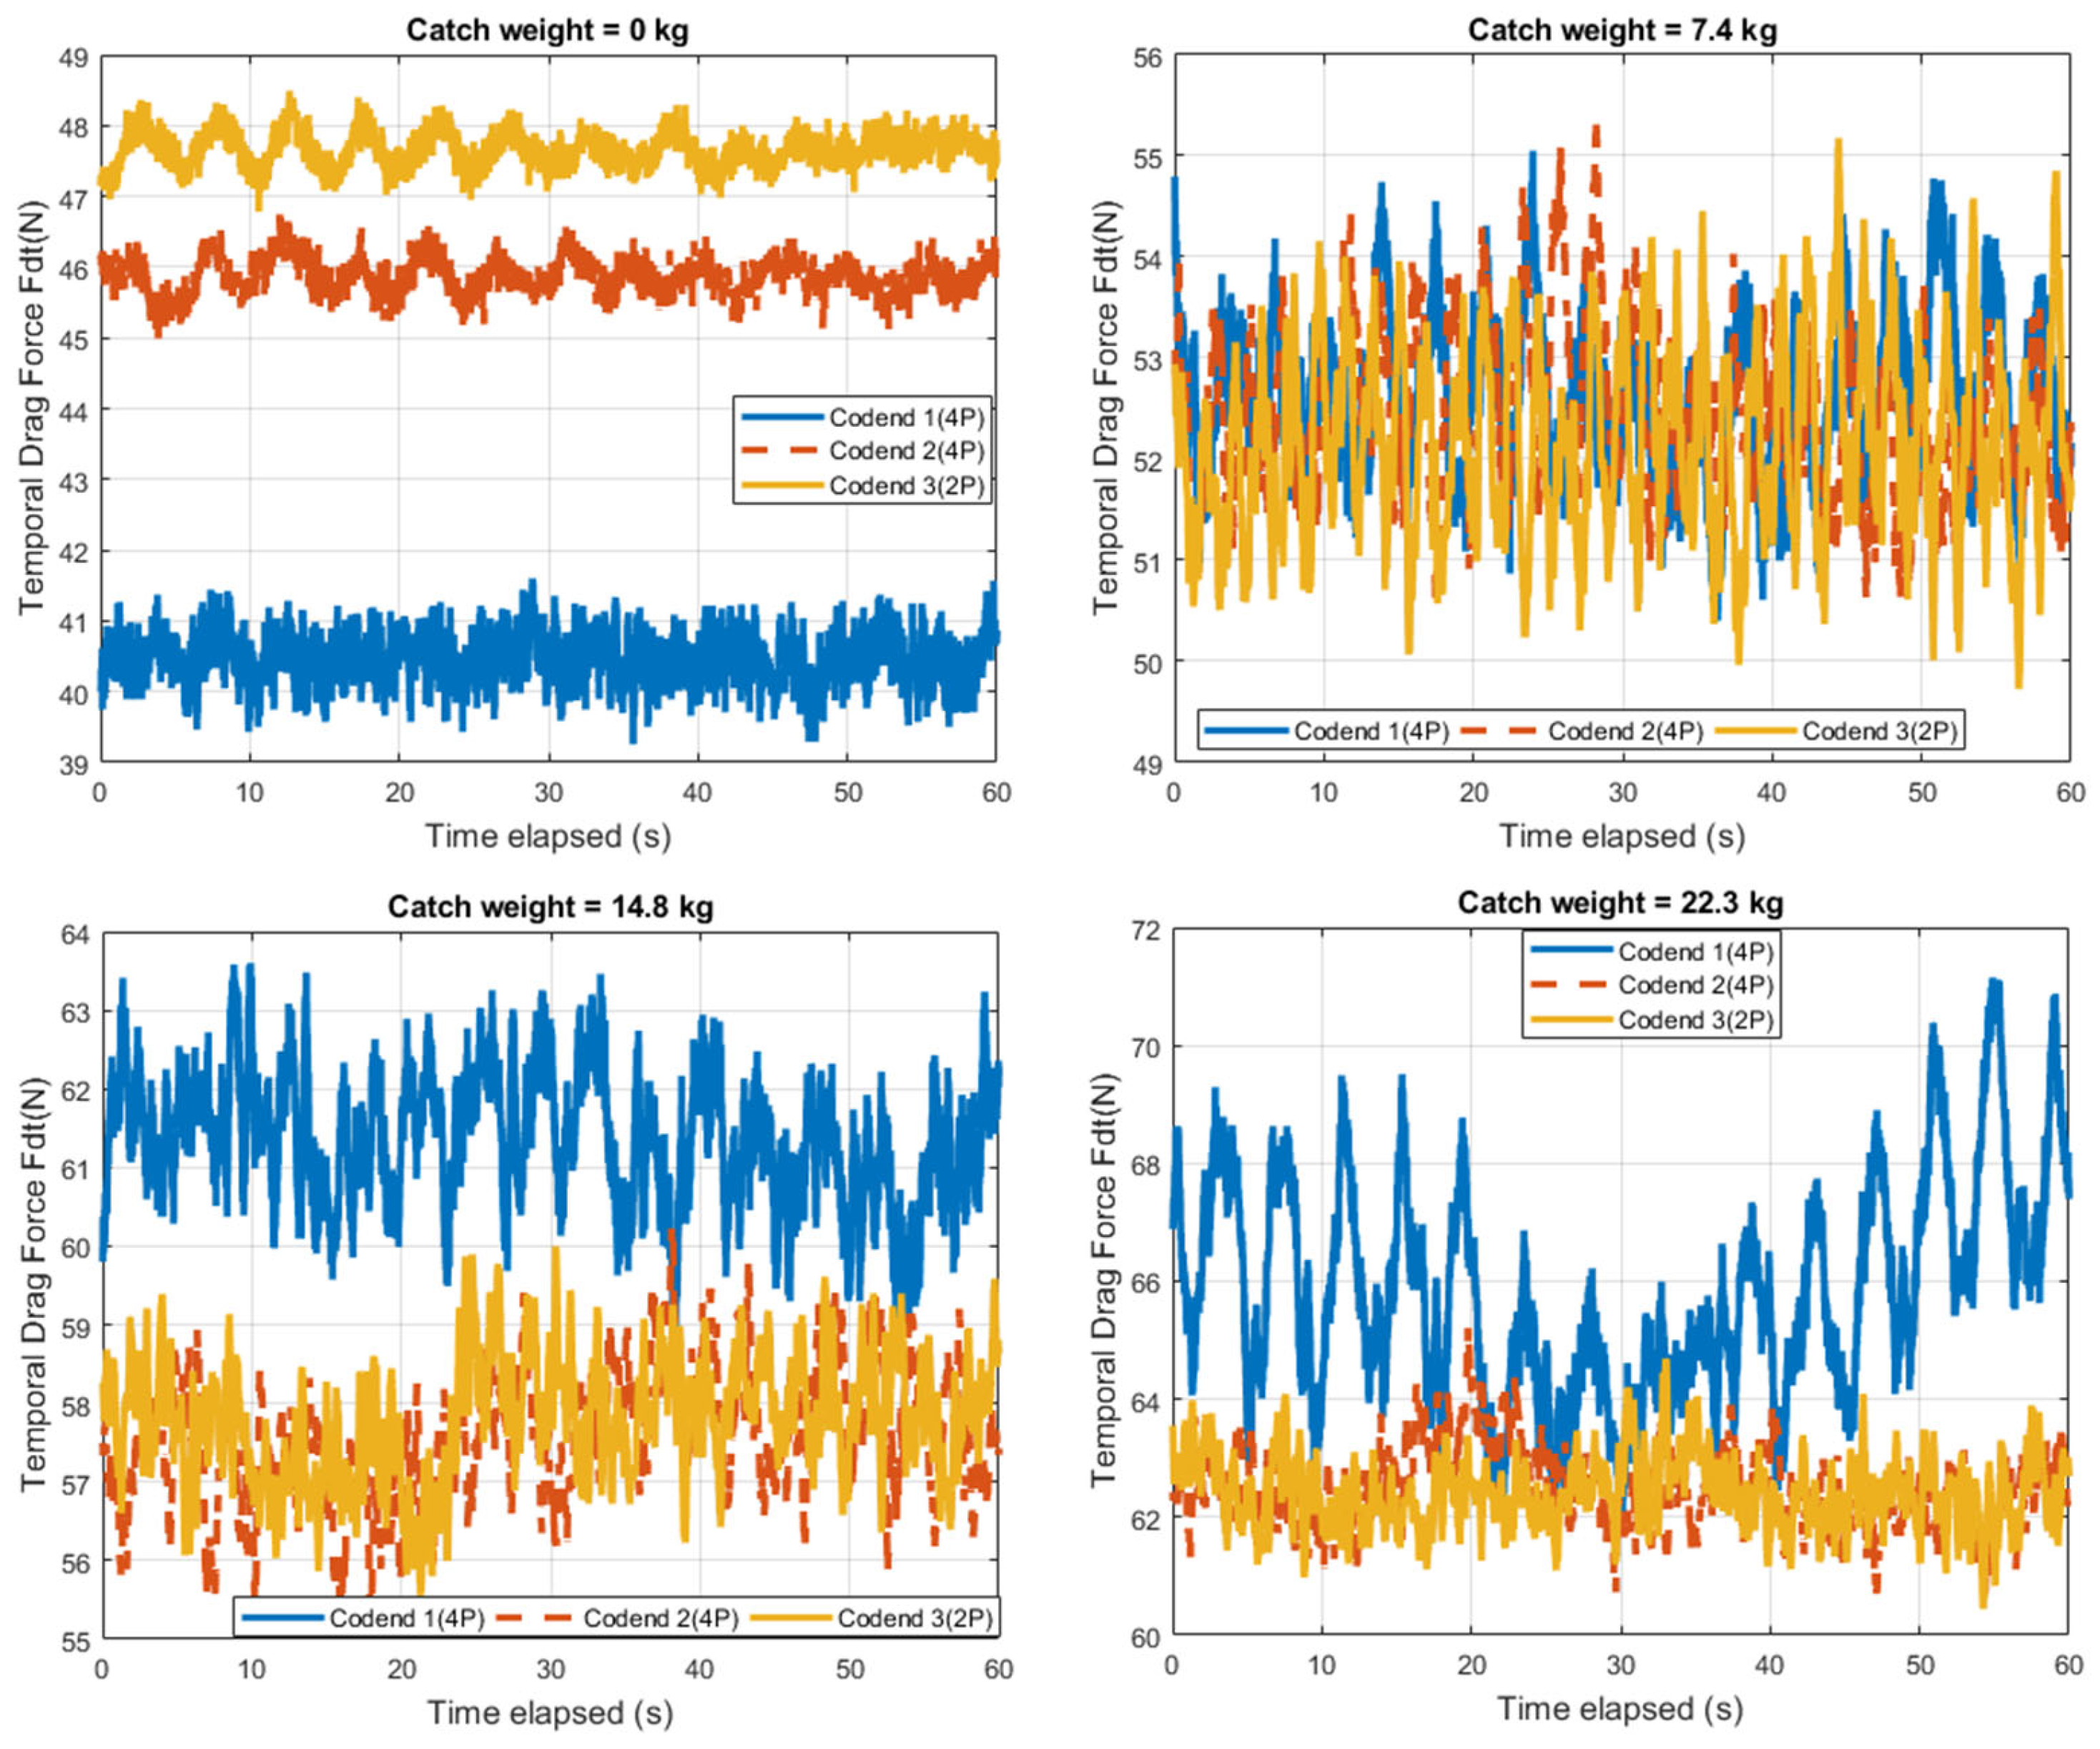
The three codends’ temporal drag forces at various catch weights are shown in Figure 5. The temporal evolution of the drag force for all the three codend presents oscillation in a quasi-periodic nature and highlights the codend motions on the codend drag forces. At the empty stage, the drag force of the three codends oscillates continuously over time. In this case the 2p codend (codend 3) had a greater drag force than those of 4p codends (codends 1 and 2). At the catch stage, the drag force fluctuates greatly over time. The more the catch weight and number of netting panels increases, the more the oscillation amplitudes of the drag force increase. Indeed, for each codend, the maximum amplitudes of the codend drag oscillations were 0.15 N, 0.41 N, 0.63 N, and 0.74 N at the catch weight of 0, 7.4, 14.8, and 22.3 kg, respectively. While, at the same catch weight, the maximum amplitude of drag oscillations for the codends 1, 2, and 3 was 0.71N, 0.61N, 0.74N, respectively. It was observed that the amplitude oscillations of the temporal drag of the 2p codend is greater than the one of 4p codends (codends 1 and 2) due to its greater instability and motions.
The PSD obtained using the temporal drag data of the three codends decreases as the frequency increases at all catch weights (Figure 6). The PSD results of the temporal drag reveal that the highest power spectrum peak is achieved at a very low frequency for all the three codends at all catch weights. Indeed, at the same catch weight, the maximum PSD peak is obtained at the frequencies of 0.21–0.28Hz, 0.033–0.41Hz, and 0.016–0.57Hz for the codends 1, 2, and 3, respectively. Note that the highest frequency peaks of the temporal drags for codends 2 and 3 were obtained at the very low-frequency compare to codend 1 because of the greater unsteady motions of these codends. When regarding the raw spectra, at the empty stage, the maximum PSD amplitude of the 2P codend (codend 3) is 79.72% and 54.72% greater than that of codends 1 and 3, respectively. At catch stage, the maximum spectra amplitude of the 2P codend is more than fifty and seventy times lower than that of temporal drag spectra for the codends 1 and 2, respectively (see Figure 6). There is significant difference in the oscillation frequency of each codend (p < 0.05). The PSD results for the drag force also show that the power spectrum obtained for all the codends exhibits quasi-periodic oscillations.

3.2. Analysis of the Mean Hydrodynamic Characteristics of Different Codends

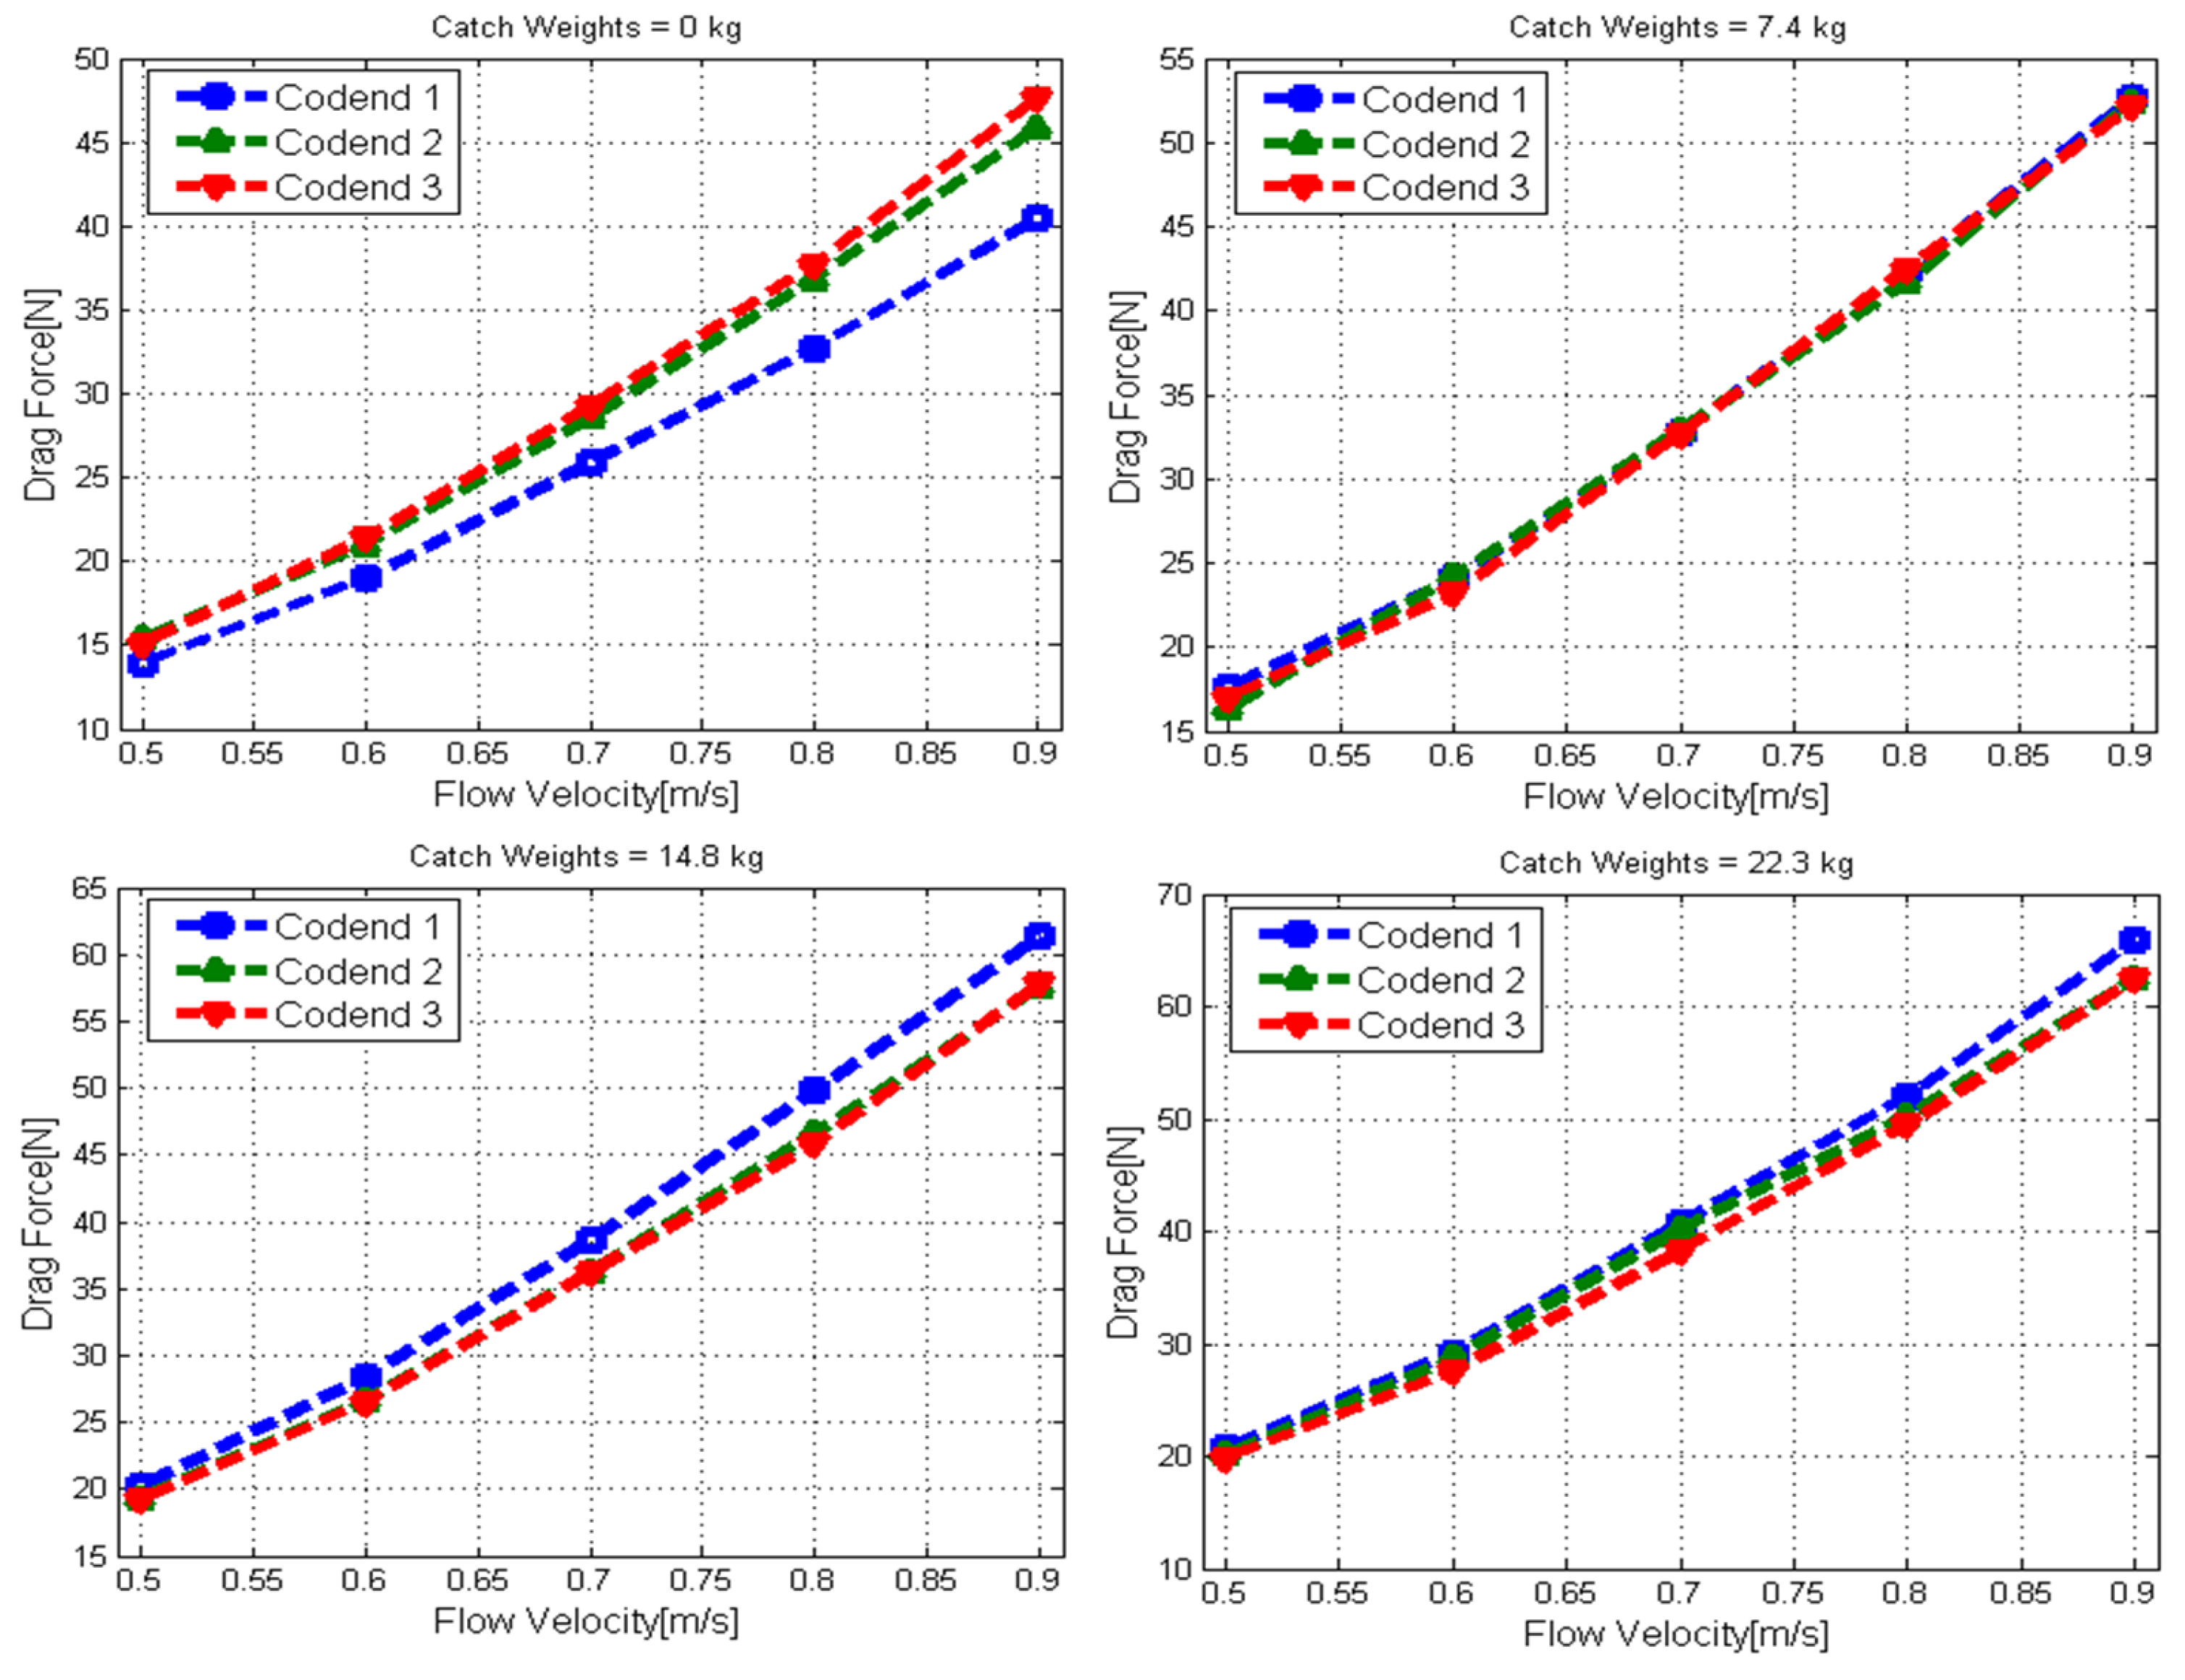
The drag forces acting on the three codends were found by subtracting the averaged measurements for each flow velocity on the rigid frame from the averaged measurements for each flow velocity on the frame and codends; the results are shown in Figure 7. At the same catch weight, the drag force of the three codends increase as the flow velocity increases, varying between 20.64% and 27.94% at each flow velocity level (p < 0.05) (Figure 7). Furthermore, for a given flow velocity, the drag force of the three codends increases with the increase of the catch weight from 20.83% to 23.52% (p < 0.05). At the empty stage, the drag force of the codend 3 was greater; it was 12.62% and 2.27% greater than that of codends 1 and 2, respectively (Table 3). However, when the codends had the catch inside, the codend 1 was the codend with a greater drag force; it was 6.07% and 6.41% higher than those of codends 2 and 3 (p < 0.05). Codend 3 was designed to contain a small amount of twine compared to codends 1 and 2 and those used in the Antarctic krill fisheries. The twine area of codend 1 was 15% and 50% greater than those of codends 2 and 3, respectively (Table 2). The measured drag values of the codends differed significantly (lack of overlap of 95% confidence limits) from each other (Table 3).
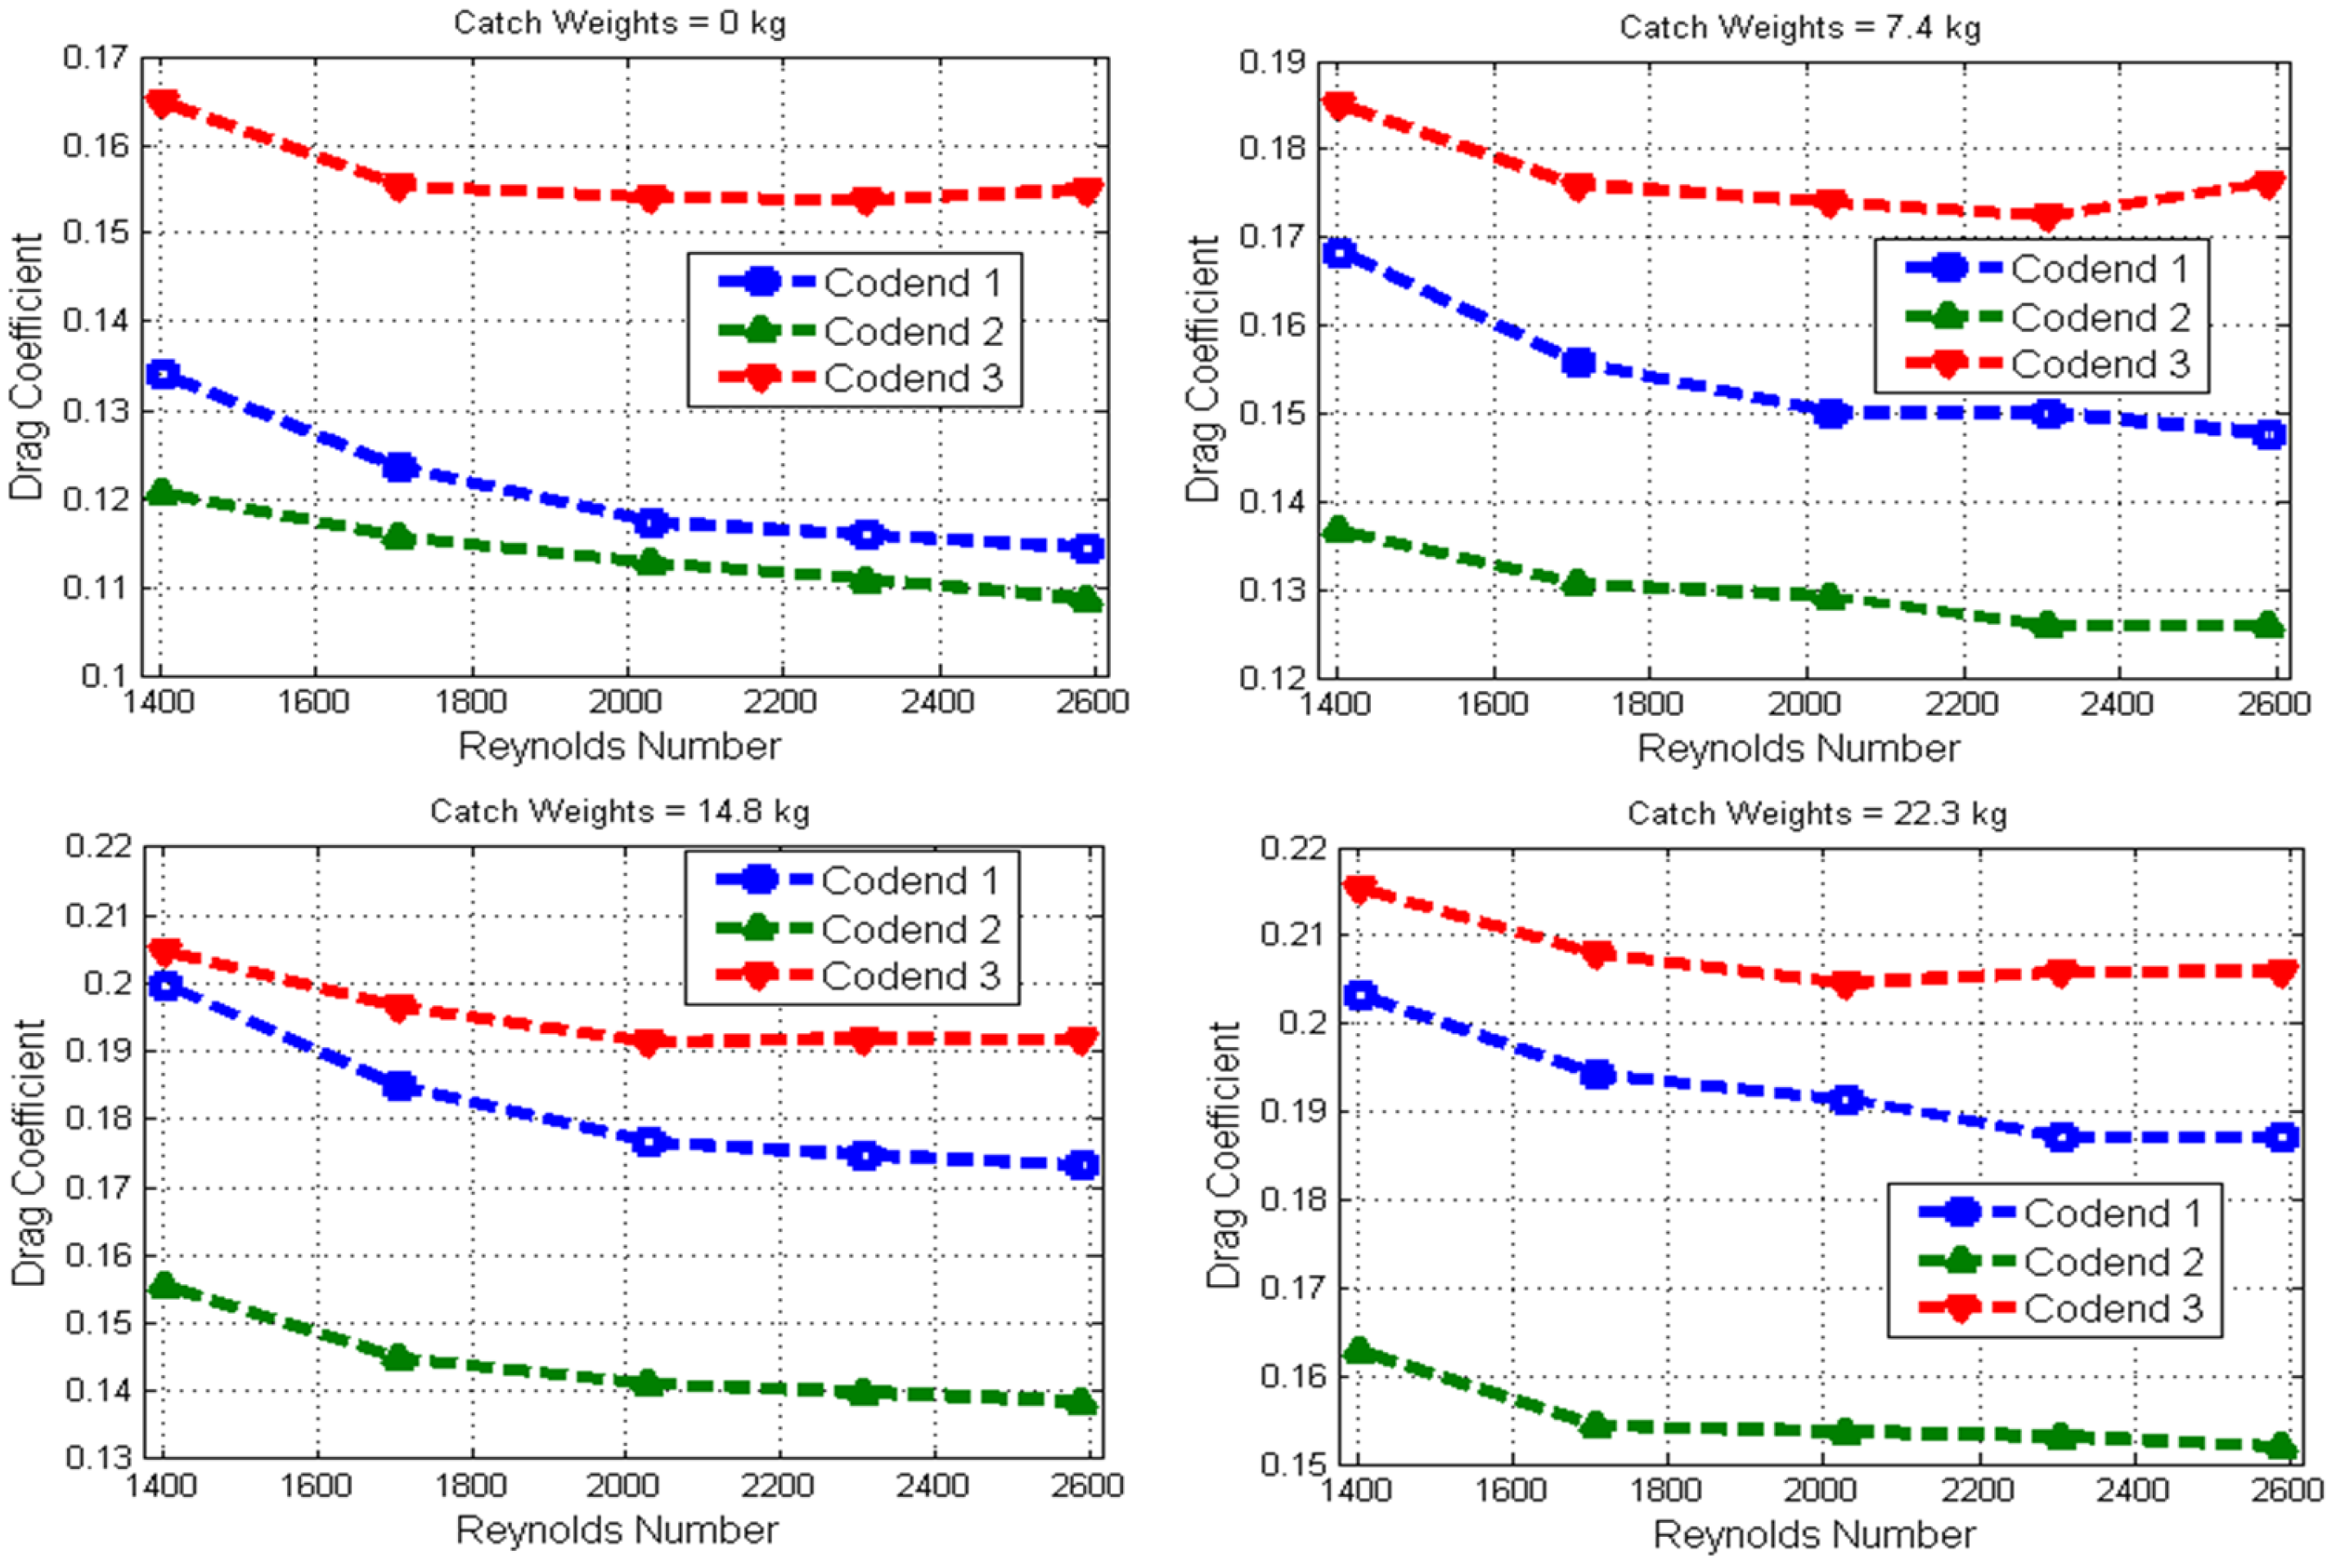
To evaluate the effects of twine diameter on net drag, the Reynolds number was determined as a function of twine diameter and the drag coefficient as a function of twine area. Thus, the greater the twine area, the greater the drag coefficient (Figure 8). When the Reynolds number increased, the drag coefficient of the three codends decreased, and the codends with a lower twine area had a greater drag coefficient. The mean drag coefficient of the codend 3 was 22.73% and 27.42% greater than that of codends 1 and 2, respectively, (p < 0.05).
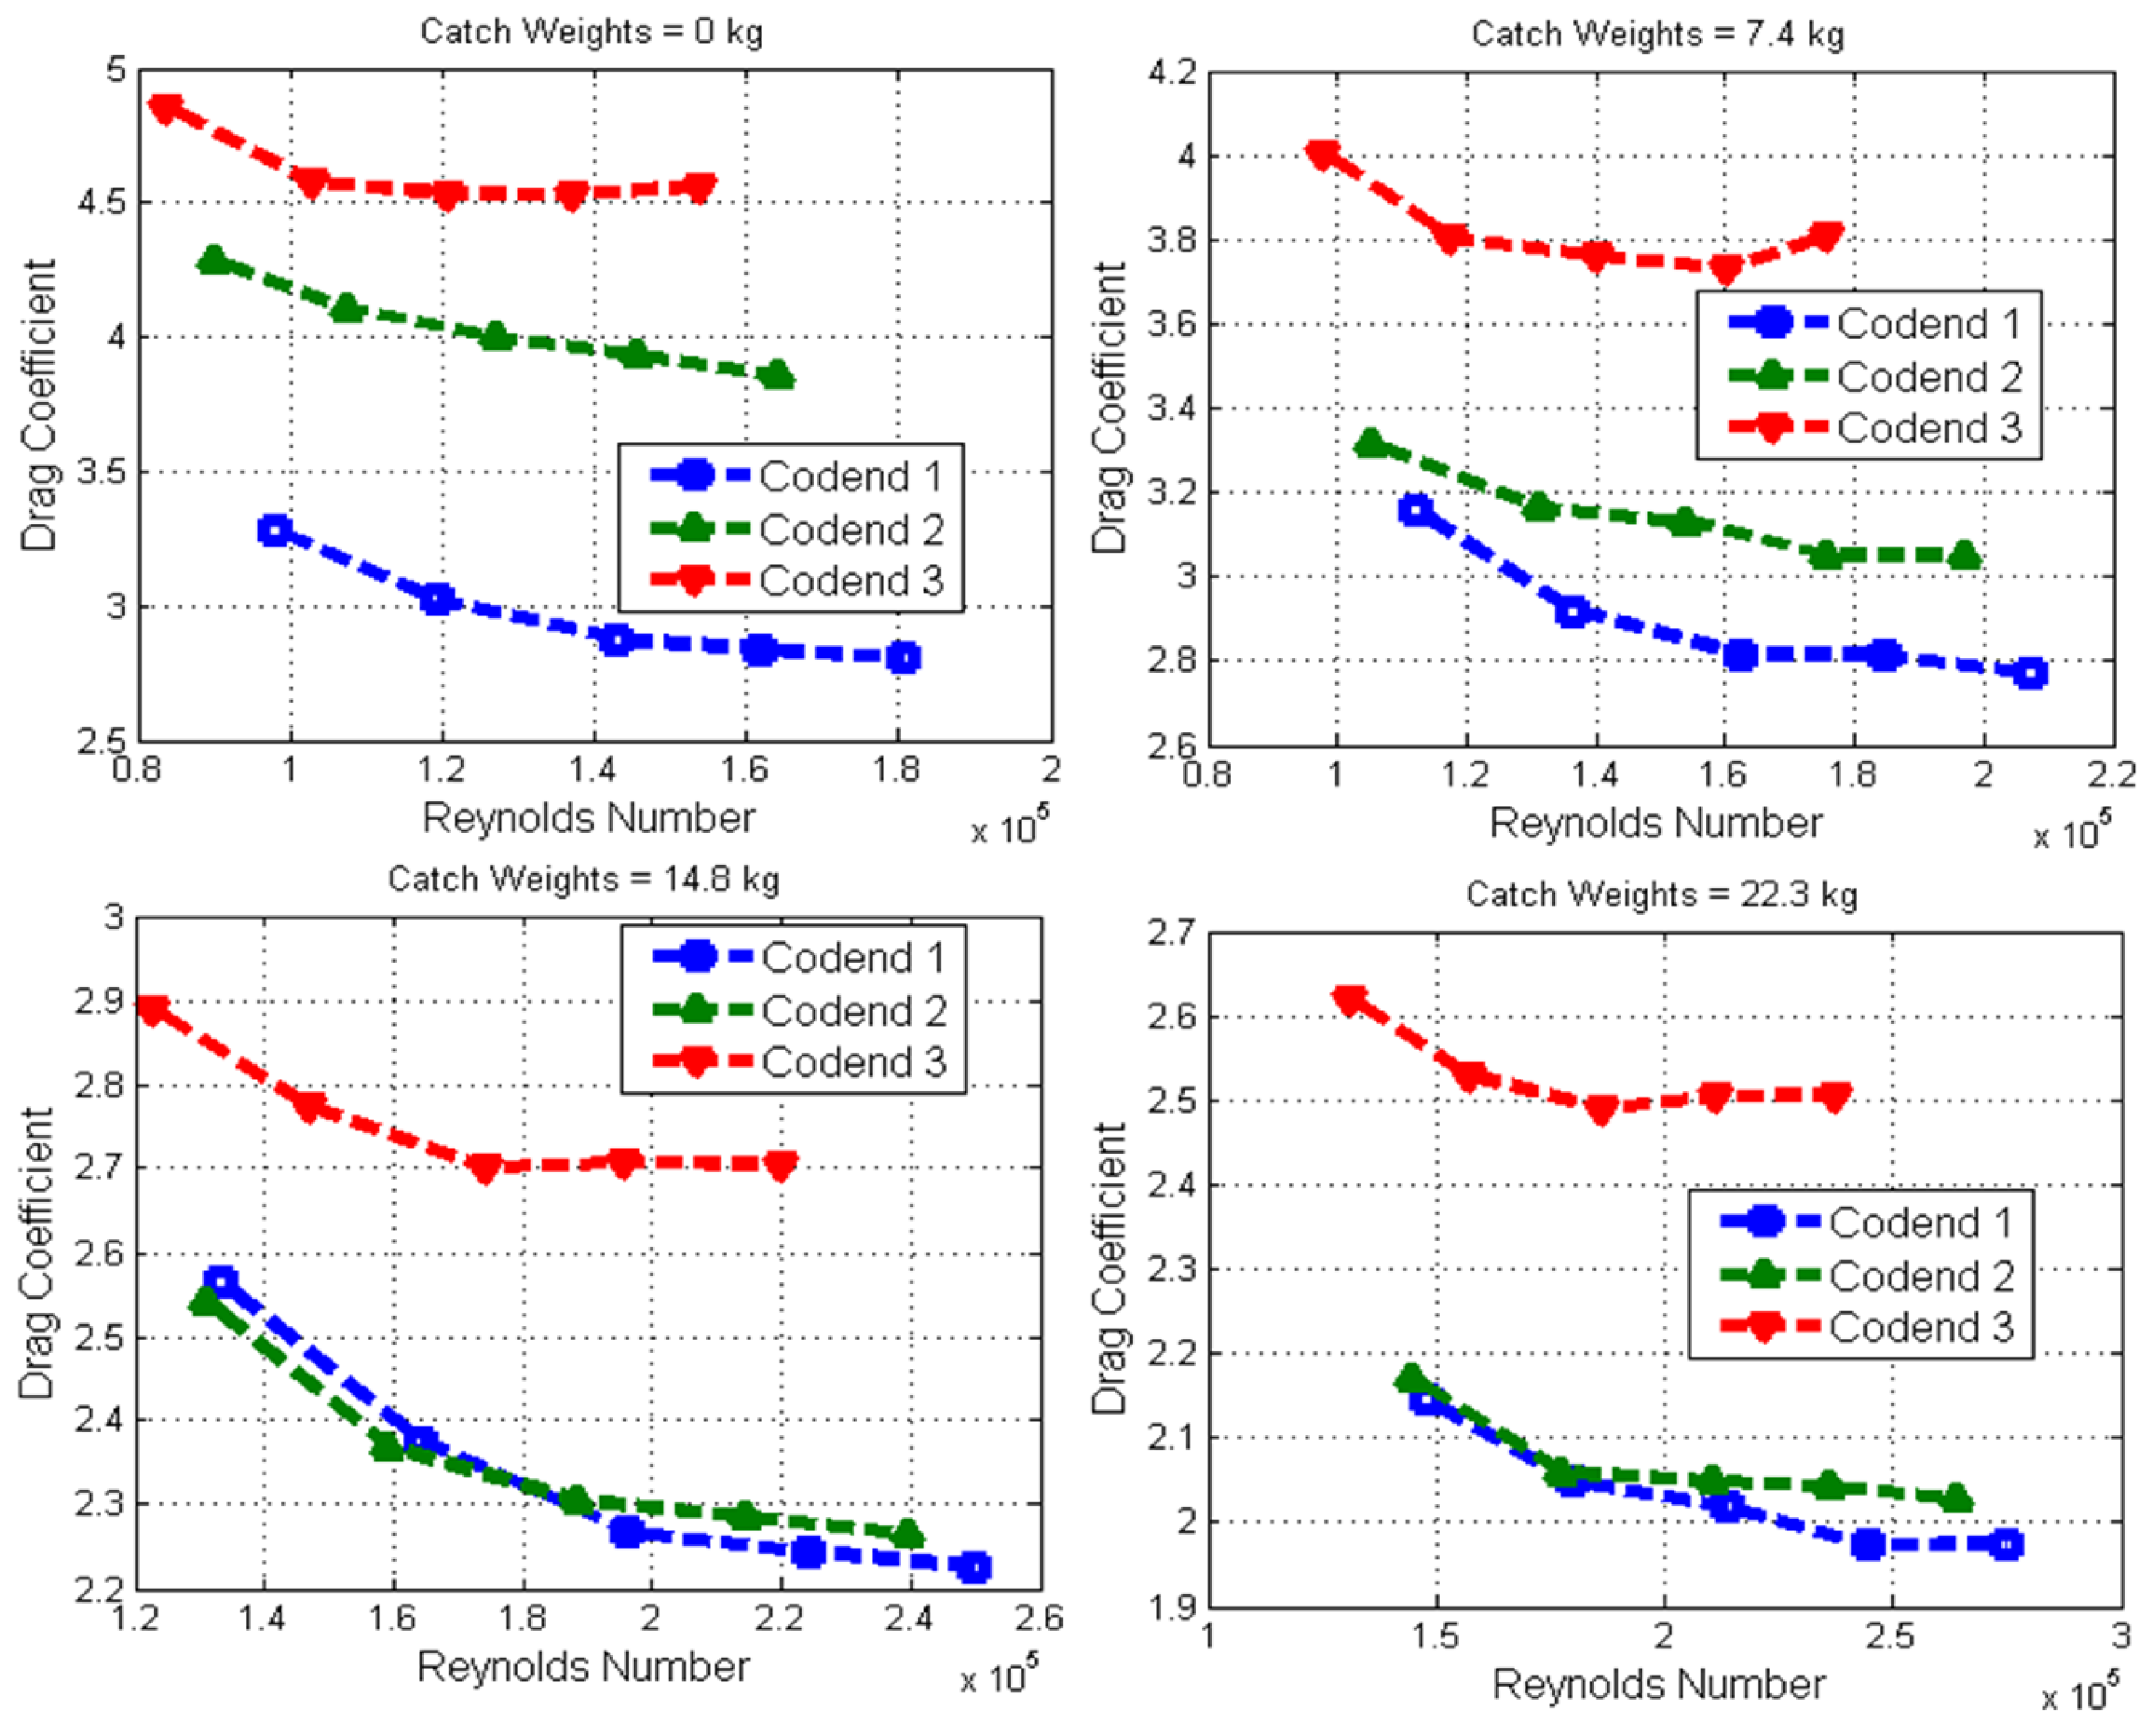
To evaluate the effects of the shape imposed by the catches on the codend, the drag coefficient and the Reynolds number were determined as a function of codend diameter (Figure 9). The drag coefficient of the three codends increased as the codend diameter increased, while the Reynolds number decreased as the codend diameter increased. On average, the drag coefficient of the codend 3 was 24.28% and 17.82% greater than those of the codends 1 and 2, respectively, (p < 0.05). By contrast, the mean Reynolds number of the codend 1 was 4.85% and 13.83% greater than the codends 1 and 2, respectively, (p < 0.05) (Figure 9 and Table 3).

3.3. Analysis of the Fluttering Motions of the Different Codends

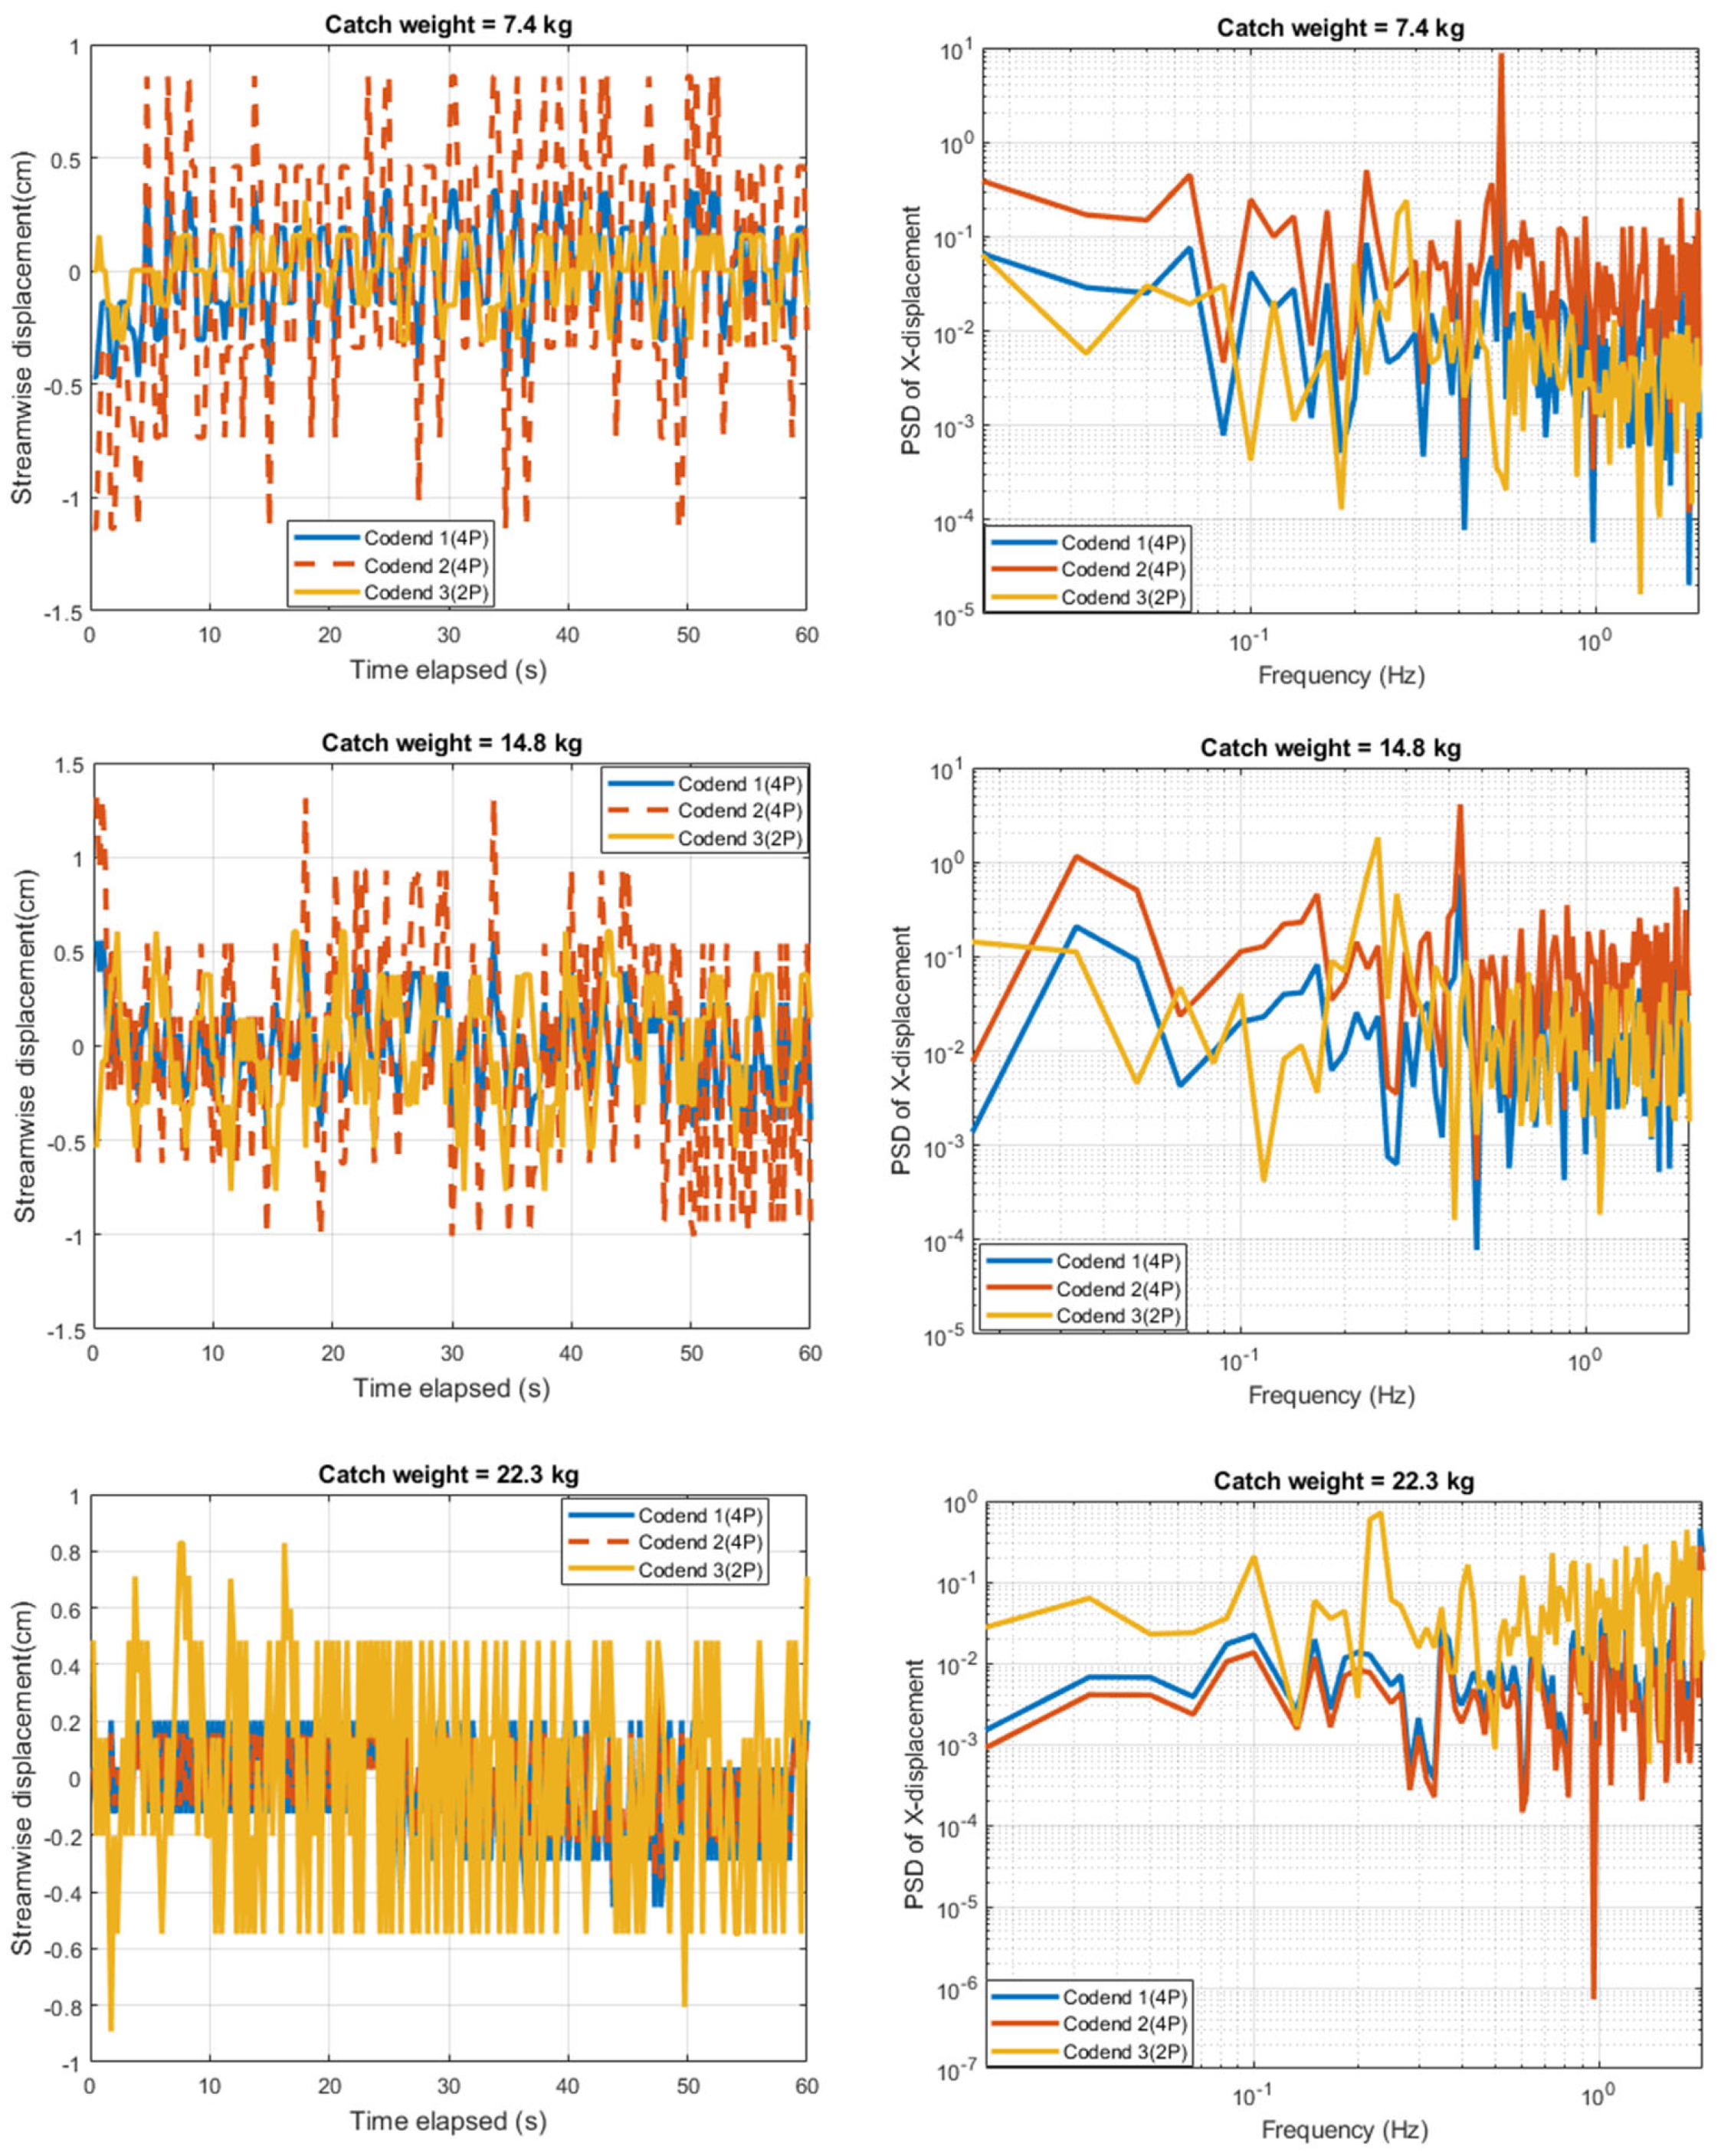
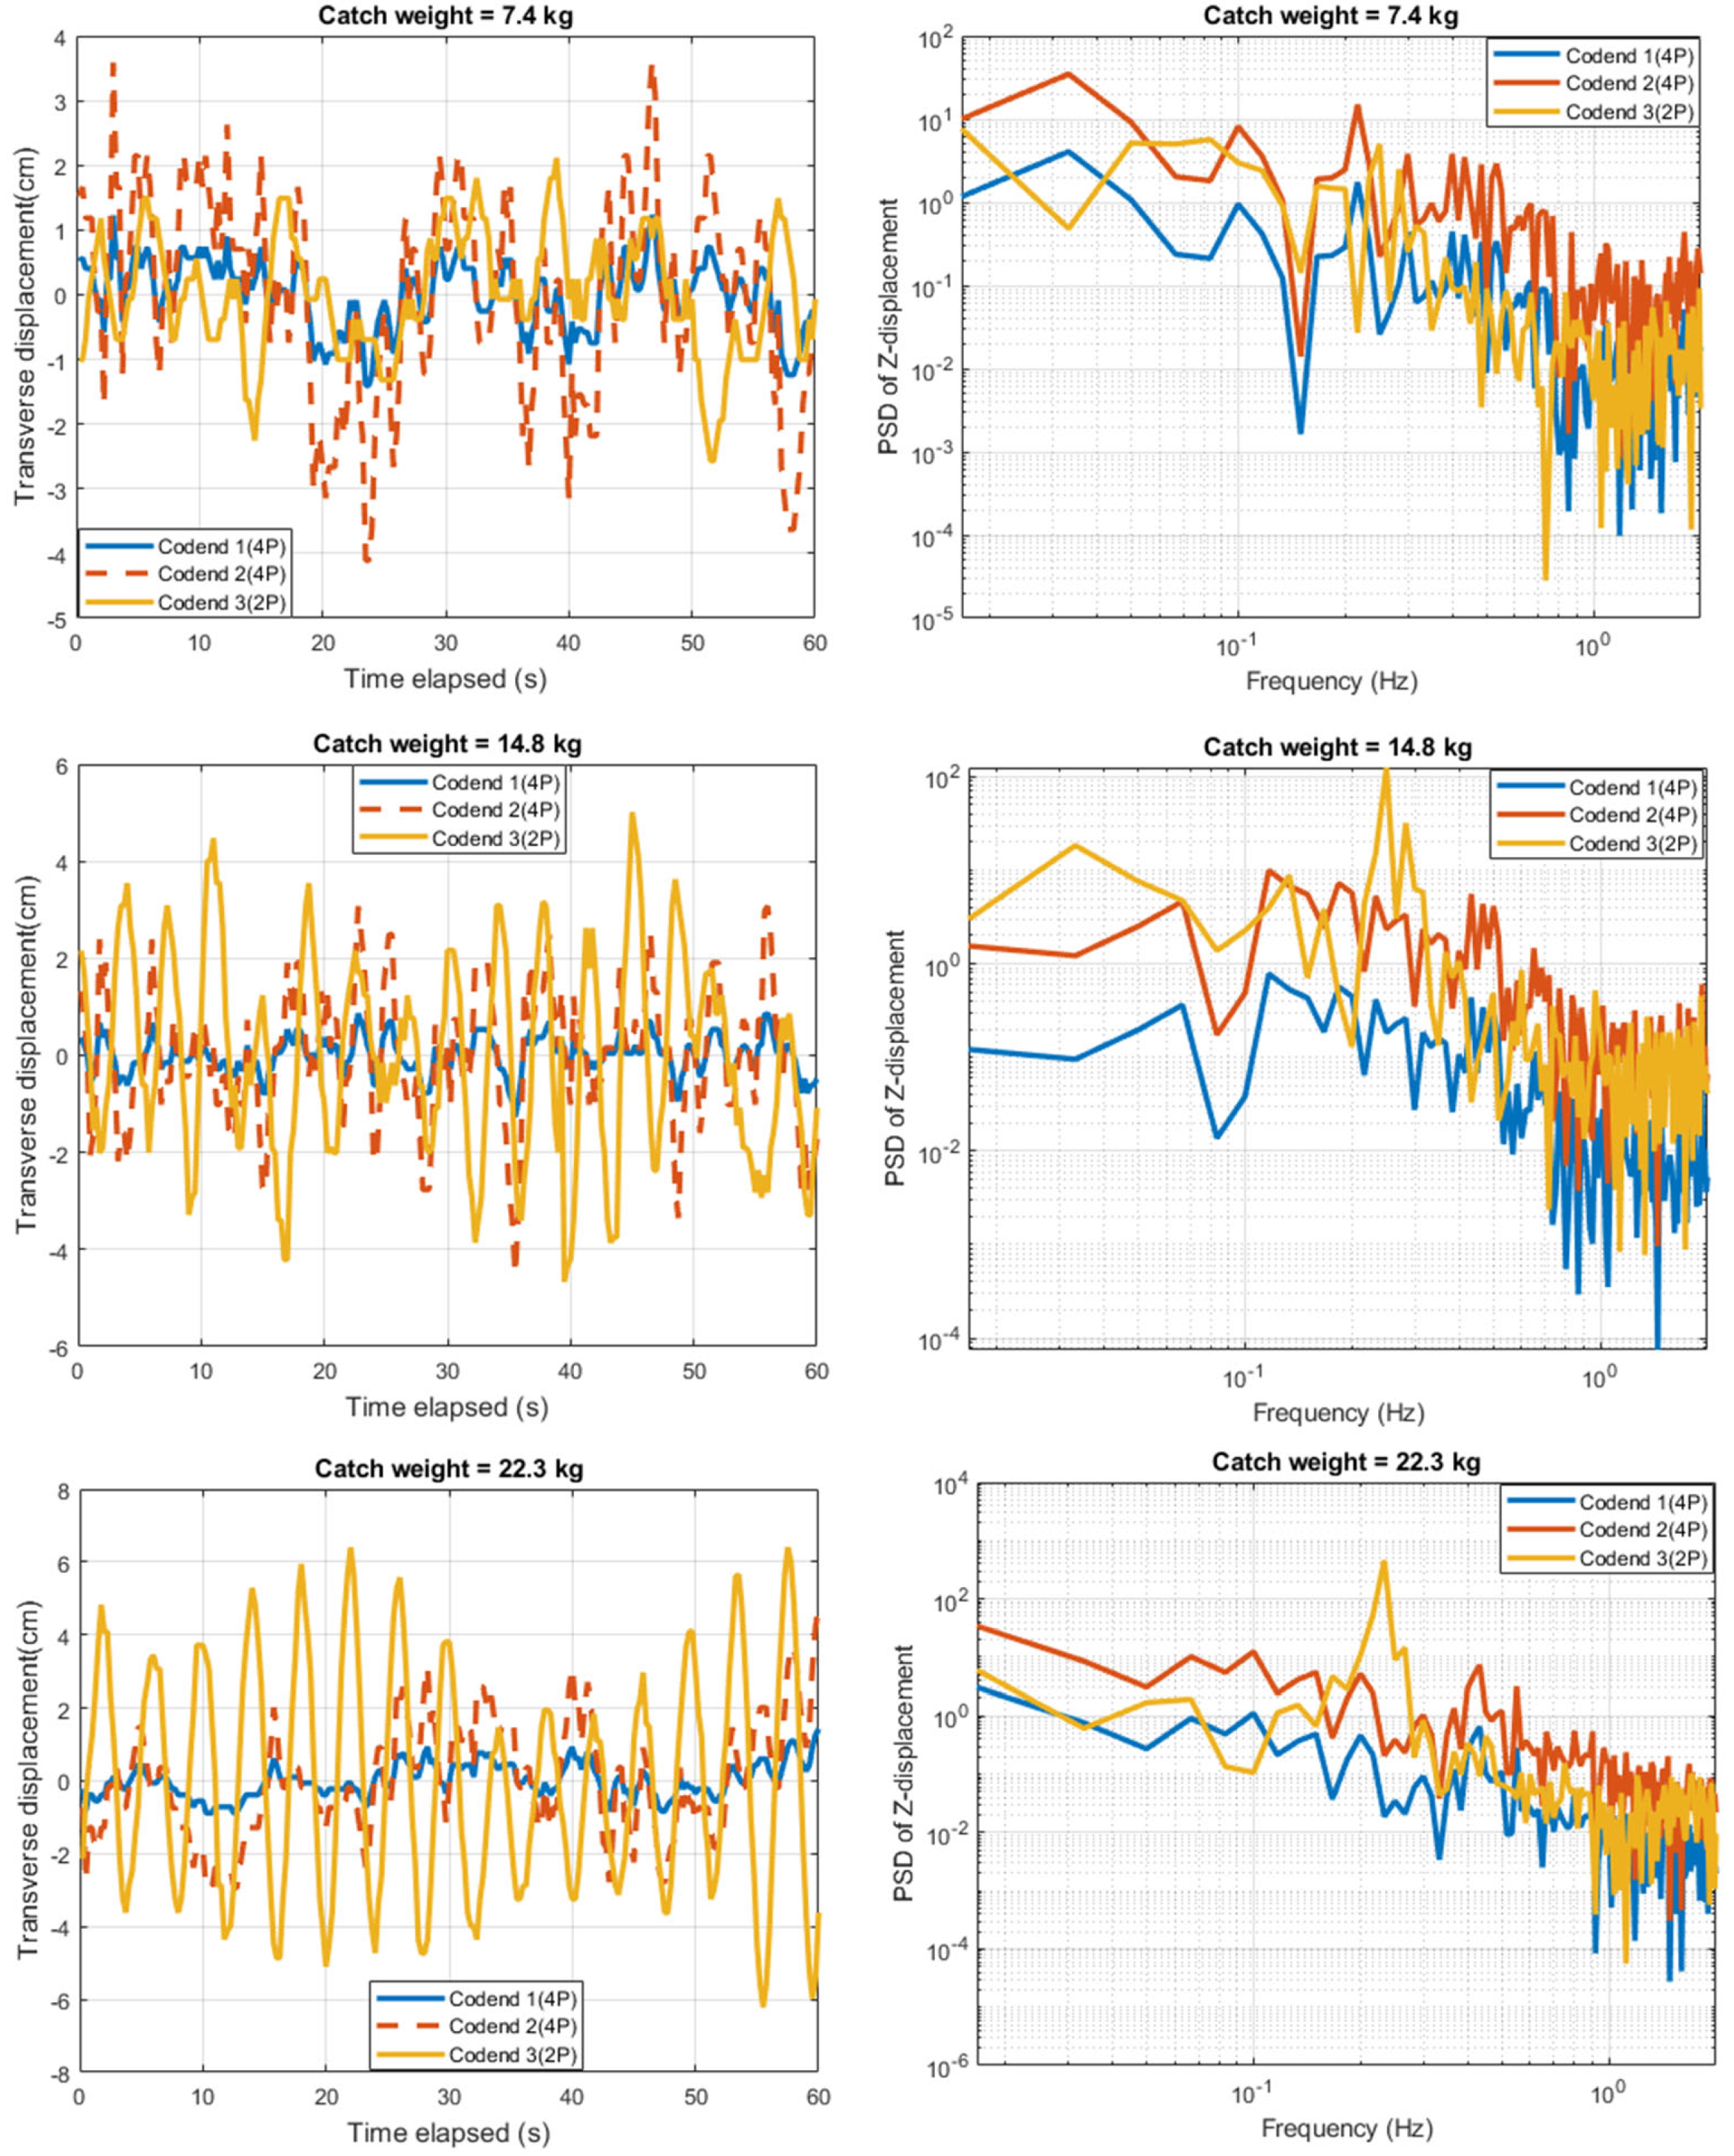
Figure 10 displays the time evolution of the streamwise oscillations of the three codends and shown that the codend motion in x—direction is influenced by the design parameters such as geometrical shape and the catch weight. The oscillation amplitude increases as the catch weight varies from 7.4 to 14.8 kg, then decreases as the catch weight varies from 14.8 to 22.3 kg (Figure 10). The structure of the streamwise oscillation amplitude for the codend 2 is more than two- and three-times greater than that related to the streamwise oscillations of codend 1 and codend 3, respectively. At the lower catch weight (7.4 kg), the peak-to-peak vibration of streamwise oscillations are 0.025d, 0.056d, and 0.021d which correspond to ± 2.67%, ±5.75%, and ±2.05%, of d for codend 1, codend 2, and codend 3, respectively. While at the higher catch weight (22.3 kg), the peak-to-peak vibration of streamwise oscillations are 0.023d, 0.016d, and 0.029d which correspond to ±2.37%, ±1.65%, and ±2.95%, of d for codend 1, codend 2, and codend 3, respectively (Figure 10).
The transverse motion of the three codends is characterized by quasi-periodic oscillations and increases as the catch weight and the number of netting panels increases (Figure 11). Furthermore, the amplitude of the transverse oscillations of the codend 3 is very high compared with those of codends 1 and 2 at the catch weights of 14.8 and 22.3 kg, while at 7.4 kg, the codend 2 was the codend having the greater amplitude of the transverse oscillations (Figure 11). Indeed, the maximum amplitude of the transverse oscillations of the codend 3 is 2.2 cm, 7.4 cm, and 10.3 cm at 7.4, 14.8, and 22.3 kg, respectively, which represented about 0.11d–0.36d. Meanwhile, that of codend 2 is 3.7 cm, 5.1 cm, and 2.3 cm at 7.4, 14.8, and 22.3 kg, respectively, which represented about 0.074d–0.17d. For codend 1, it was about 72.22% and 79.72% lower than those obtained on codend 2 and codend 3, respectively (see Figure 11).
As shown in Figure 10 (right side), the spectral representation of the streamwise structure’s oscillations is given in a log-log scale. The highest frequency peaks of the streamwise oscillations are obtained at the very low-frequency components of f 1   = 0.0125 Hz for the codend 1 and codend 2, and 0.025 Hz for the codend 3 at 7.4 kg. While, at 14.8 kg and 22.3 kg, the highest frequency peaks are obtained at 0.037 and 0.0125 Hz, respectively, for all the three codends. The second frequency peaks are observed at f 2   = 0. 41 Hz for codend 1 and codend 2, and 0.22 Hz for codend 3 at 7.4kg, while, it is observed at 0.33 Hz for the codend 1 and codend 2, and 0.20 Hz for codend 3 at 14.8 kg. Finally, these second frequency peaks are obtained at the frequency components of 1.49 Hz for codend 1 and codend 2, and 0.18 Hz for codend 3 at 22.3 kg (Figure 10). The spectra obtained in codend 3 exhibit a dominant low-frequency component compared to other codends. When regarding PSD content, the amplitude of the streamwise oscillations spectra for the codend 1 and codend 2 is 97.27%, 54.64%, and 57.89% higher than that of streamwise oscillation spectra codend 3 at 7.4, 14.8, and 22.3 kg, respectively (Figure 10).
A Fourier analysis is conducted by watching the power spectral density of the transverse motion of the three codend at different catch weights in the log-log scale (see the right side of Figure 11). For codend 1 and codend 2, the highest frequency peak representing the periodic motion is obtained at a very low-frequency ( f 1   ) 0.037 Hz, 0.11 Hz, and 0.025 Hz for the catch weight of 7.4, 14.8, and 22.3 kg, respectively. While, for codend 3, the highest frequency peak was attained at very low-frequency components f 1   = 0.025 Hz, 0.037 Hz, and 0.027 Hz for the catch weight of 7.4, 14.8, and 22.3 kg, respectively. The second frequency peak is observed at f 2   = 0.17, 0.32, and 0.33 Hz for the catch weight of 7.4, 14.8, and 22.3 kg, respectively, for both codends 1 and 2. For the codend 3, f 2   = 0.19 Hz for all the three catch weights. When regarding the raw density spectra, the amplitude of the transverse spectra for codend 3 is more than one hundred and fifty and twenty-four times higher than that of transverse motion spectra for the codends 1 and 2, respectively at the catch weight of 14.8, and 22.3 kg (see Figure 11). The result of the power spectral density content obtained with the transverse motion of all the three codends presents quasi-periodic oscillations corresponding to a global mean flow and can be linked to the time evolutions of the unsteady turbulent motions imposed by the catch inside the codend which affect the drag and the selectivity.

3.4. Analysis of the of Cross-Section of the Three Codends at Different Catch Weights

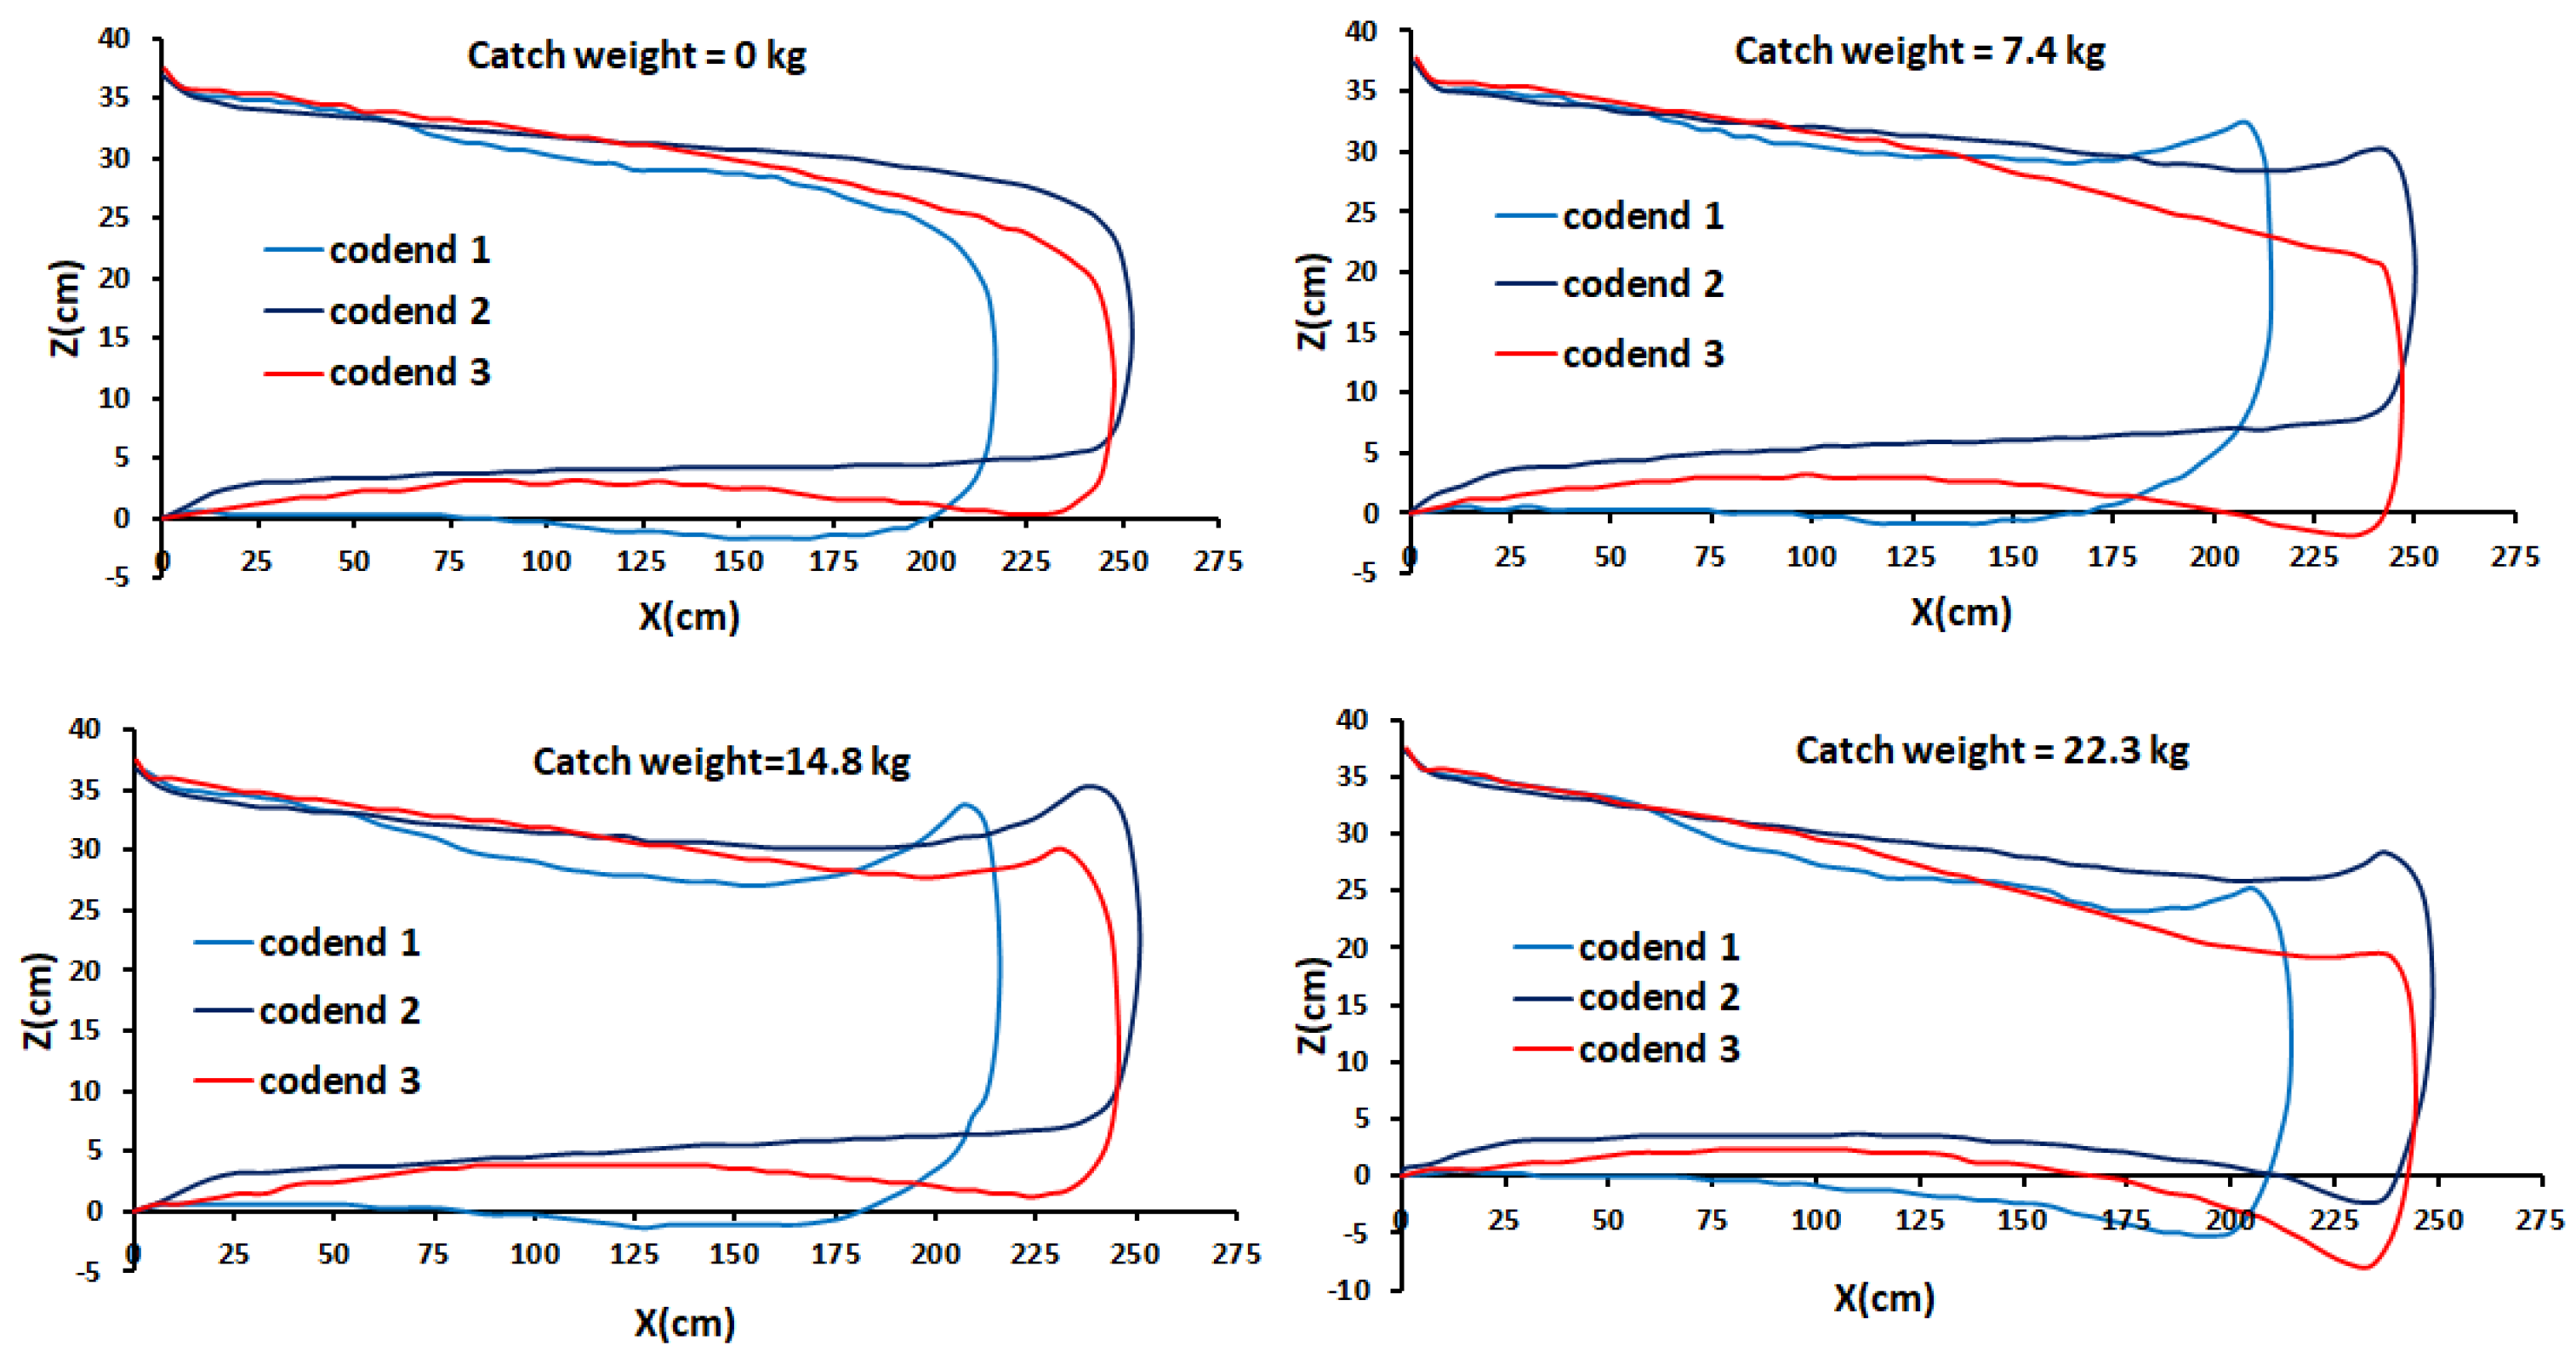
At the empty stage, the end-part of the codend 1 was higher than those of codends 2 and 3, because the shape of the codend 1 allowed it to be stable compared to other codends (see Figure 12). The tilt angle between the centerline of the codend and the flow direction was about 2.86 ° , 0 ° , and 1.31 ° for codends 1, 2, and 3, respectively. On the other hand, at the catch stage, the codend structures exhibits different upward trends, and the unfolding degree was greater than that of empty codends (Figure 12). The unfolding degree of the three codend increased as the catch weight increased. It can be observed that the unfolding degree of codend 3 was greater than those of codends 1 and 2. The consequence of this was a decrease in the mesh opening going in the forward direction due to the higher instability of this codend caused by the intense motions linked to the hydrodynamic of this codend. The circumference of the catch regions of the 2p codend (codend 3) and 4p codend (codend 2) was significantly smaller than that of the codend 1 (4p codend). As a consequence, these codends will be filled up faster with greater oscillations.
Figure 12 also showed that the length of the codend 1 was lower compare to that of codends 2 and 3 at all catch weights. The maximum difference (the difference between the lowest and highest distance estimated between the results obtained from the different catch weights) was 2.15 cm, 3.6 cm, and 5.95 cm for the codends 1, 2, and 3, respectively. This suggests that the movements of the three codends in the longitudinal direction were relatively limited. The maximal vertical length of the end-part of codend was greater for the codend 1 (30.22 cm) and codend 2 (28.52 cm); these distances were lower than that of codend 3 (21.77 cm).

3.5. Analysis of the Effect of Gear Design on the Unsteady Turbulent Flow Organization Inside and behind the Codend

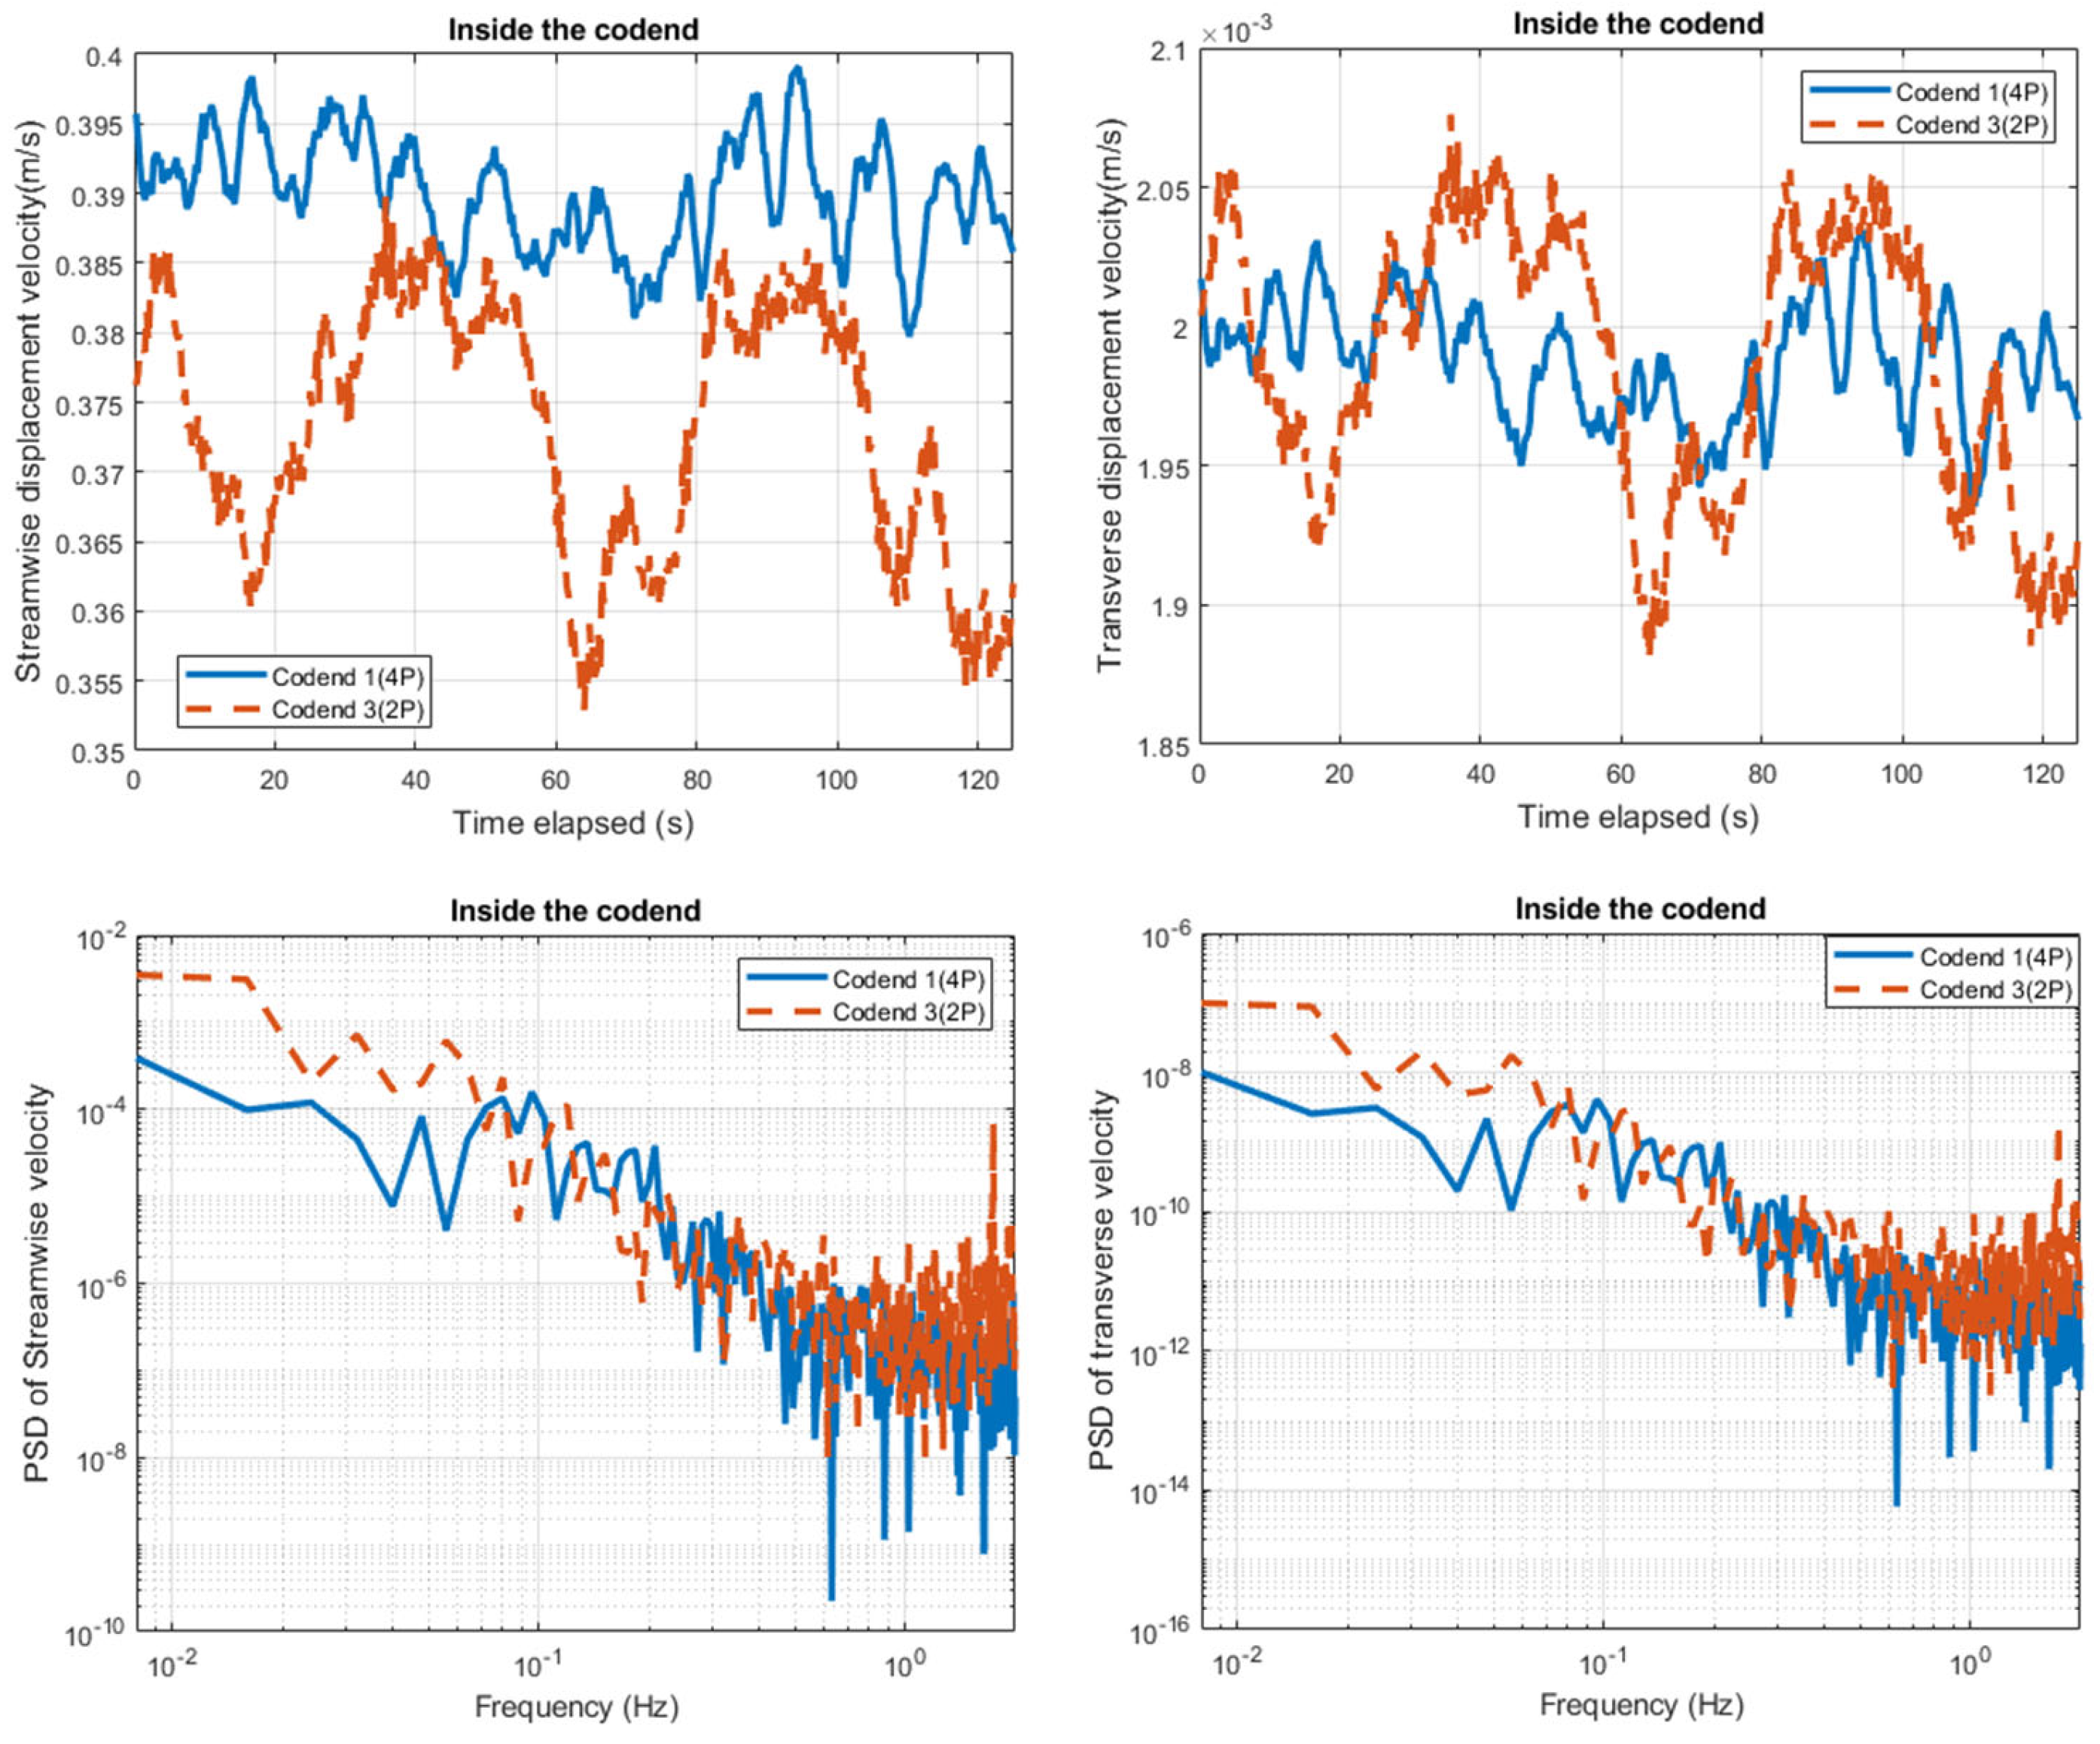
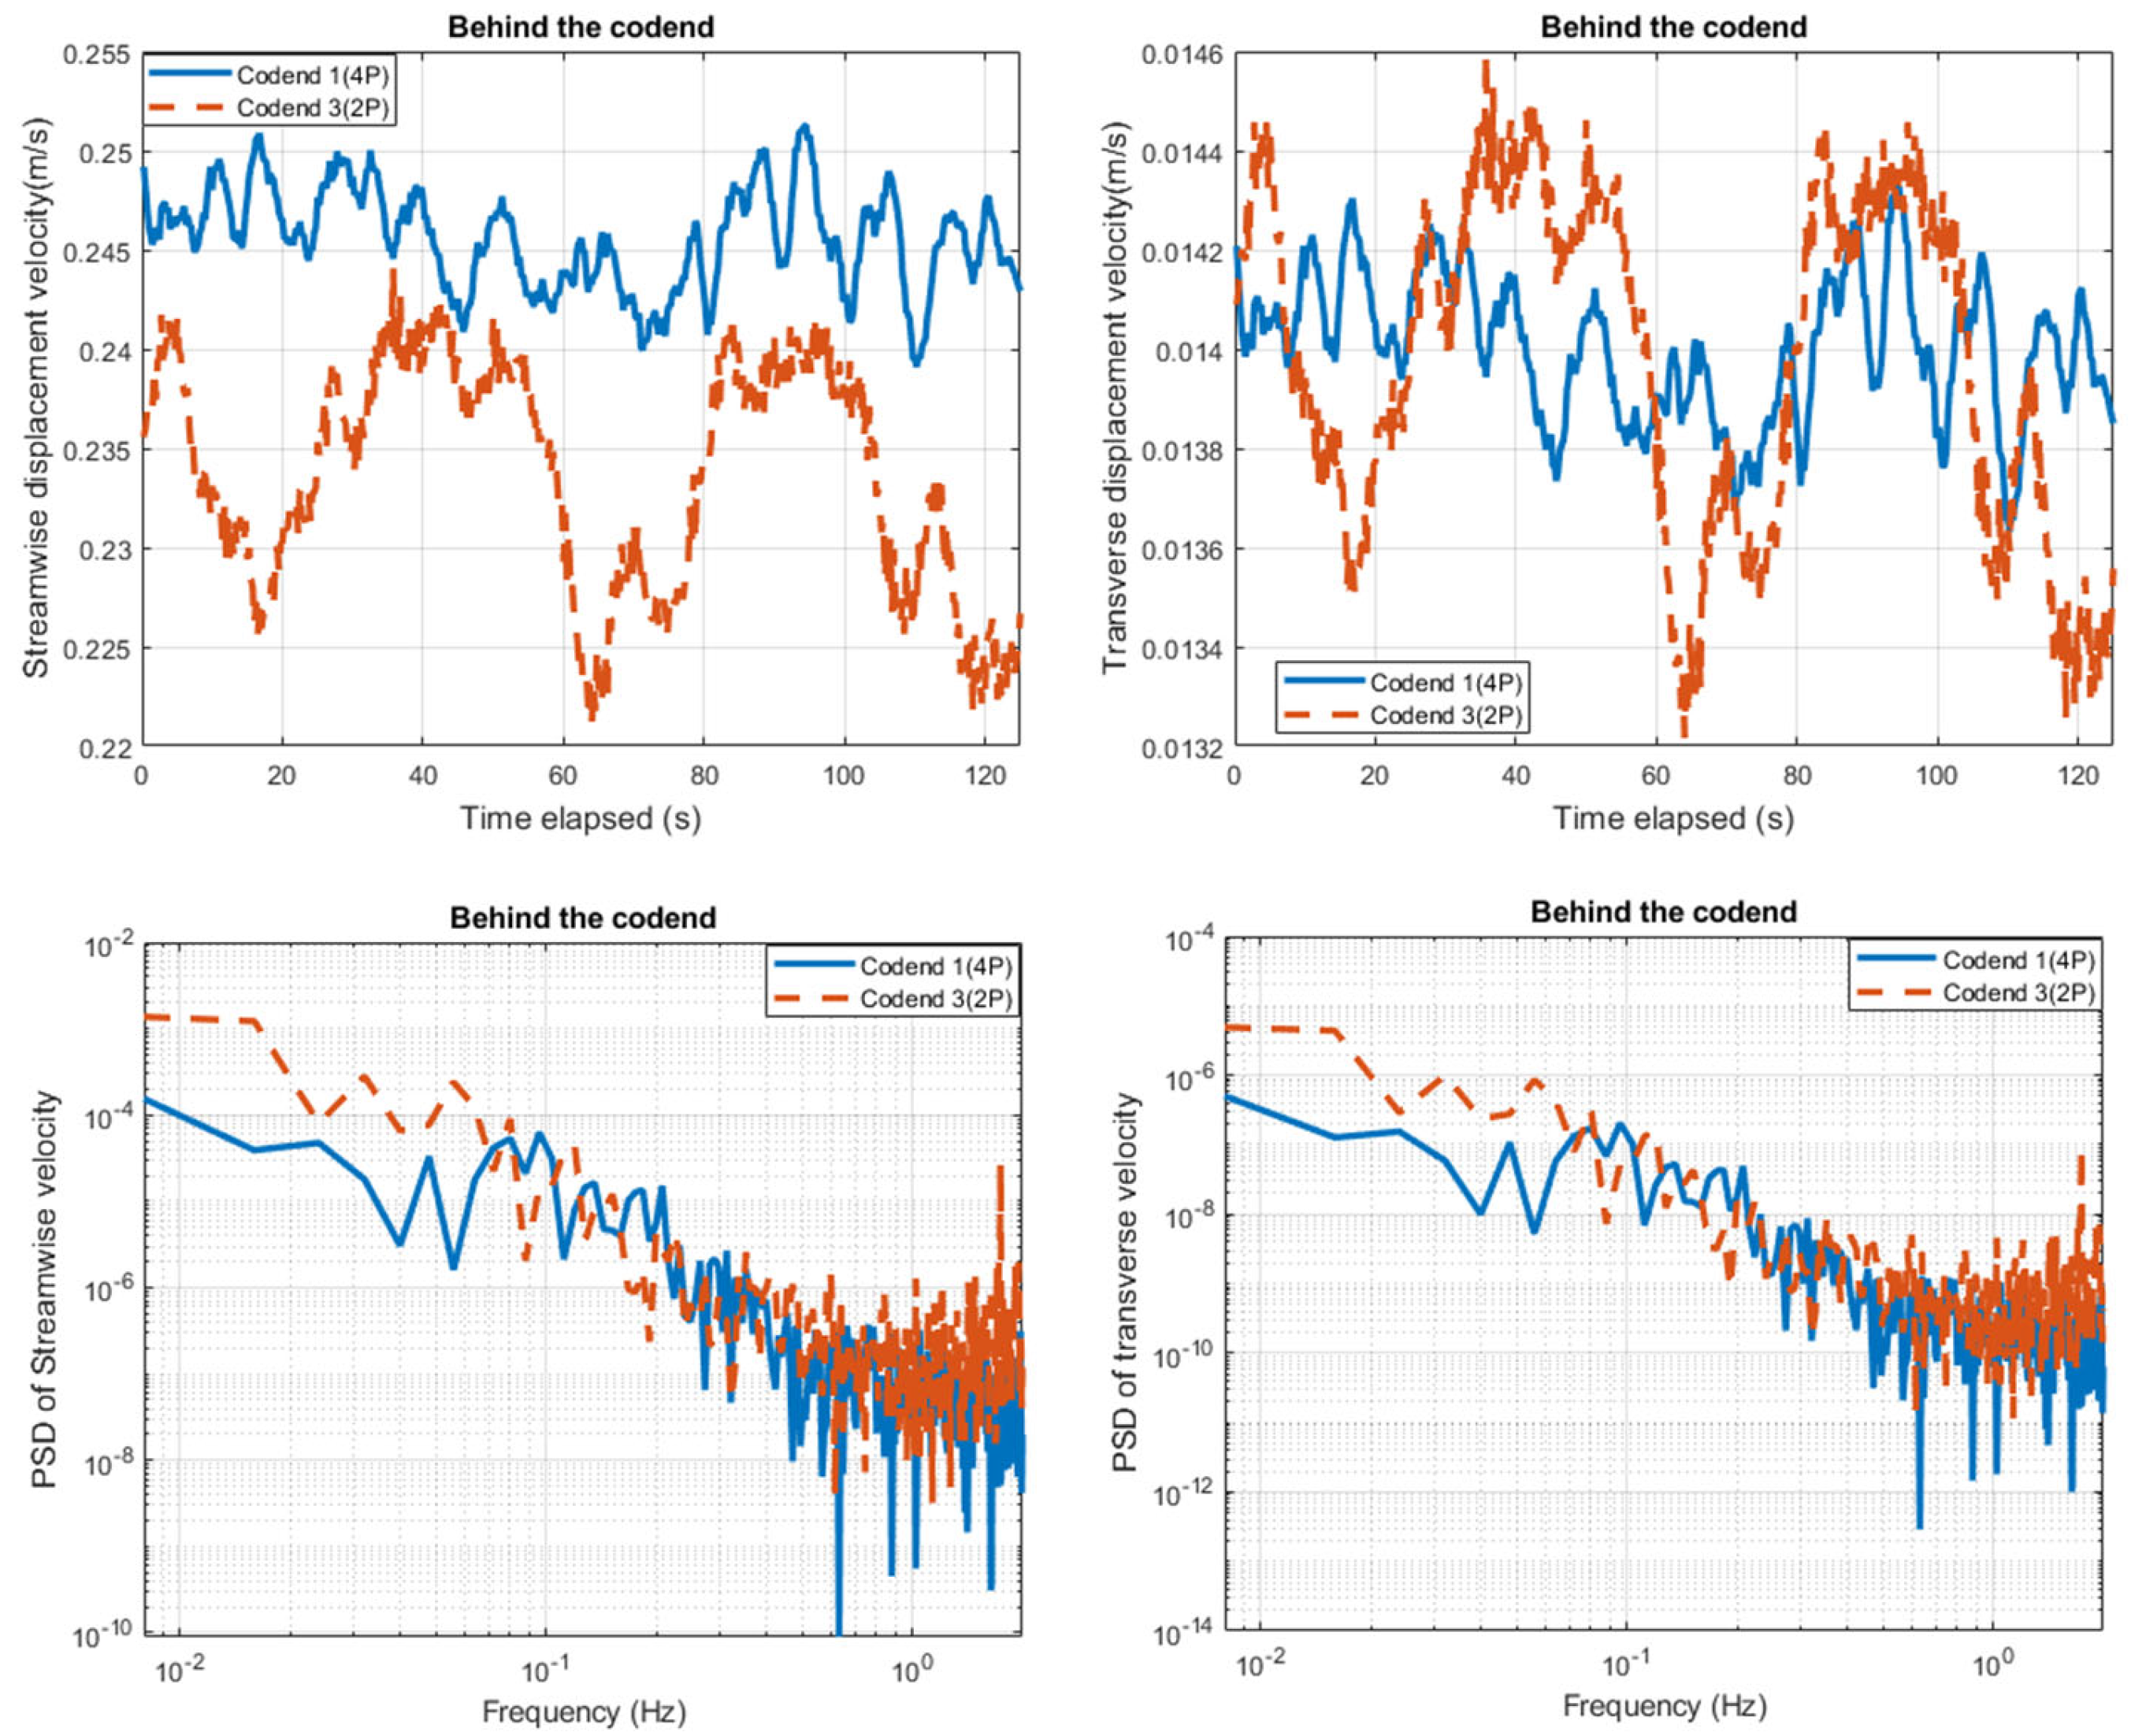
Figure 13 and Figure 14 compare the time evolution of the flow velocity components (u, v) and the associated PSD inferred from the ECVM database on the centerline inside and behind the codend between the 2p and 4p codends. The temporal evolution of the flow velocities both for the 2p and 4p presents an oscillation of quasi-periodic nature, highlighting the unsteady nature of the flow field inside and behind and downstream to the codend. It can be observed that the temporal flow velocity fields have the same oscillation evolution as that of the temporal drag and transverse motion of the codends (Figure 10, Figure 11, Figure 13 and Figure 14), thereby confirming that the trawl motions significantly influence the flow passage through the codend structure. The mean flow velocities of the two components inside the 4P codend are 5.82% greater than that developing inside 2P codend, while the mean flow field (u, v) behind the 4P codend are 2.91% greater than those behind the 2P codend (Table 4). The distribution of the streamwise velocity ratio 0.79   u 0 and 0.75 u 0 inside the 4P codend and 2P codend, while it was 0.48   u 0 and 0.45 u 0 behind the 4P codend and 2P codend, respectively (Figure 13 and Figure 14). The streamwise flow velocities are lower behind the codend than inside the codend. These lower streamwise velocities are due to the large motions of the codend during ECMV measurements and the presence of the unsteady turbulent flows corresponding to the vortex shedding.
Inside the 4p codend, the highest frequency peak representing the periodic flow is obtained at a very low frequency ( f 1 ) 0.044 Hz and 0.009 Hz for the streamwise and transverse velocities, respectively (see the bottom of Figure 13). While, behind this codend, the PSD results of the variation in flow velocity showed that the highest frequency peak was attained at very low frequency components f 1 = 0.014 and 0.008 Hz for streamwise and transverse velocities, respectively (see the bottom of Figure 14). Inside the 2P codend, the oscillation frequency of u and v is obtained at a very low frequency ( f 1 ) 0.0081 Hz and 0.012 Hz, respectively, while, behind this codend, the highest frequency peak of the oscillations obtained at the very low-frequency components of 0.0071 and 0.012 Hz, and there is no obvious law of energy change. The second frequency peak is observed at f 2 = 0.18 and 0.105 Hz inside 4P codend and 2P codend, respectively, for both streamwise and transverse velocities (see the bottom of Figure 13 and Figure 14). Behind 4P codend and 2P codend, the second frequency peaks were observed at f 2 = 0.11 and 0.092 Hz, respectively, for both streamwise and transverse velocities. When regarding the raw spectra, the amplitude of the streamwise velocity spectra is more than three hundred and thousand times higher than that of transverse velocity spectra inside the codend and behind the codend, respectively, for both 4P and 2P codends (Figure 13 and Figure 14). The result of the power spectrum content obtained with the streamwise velocities correspond to a global mean flow and the obtained transverse velocities can be linked to the time evolutions of velocities imposed by the unsteady turbulent motions on codend.
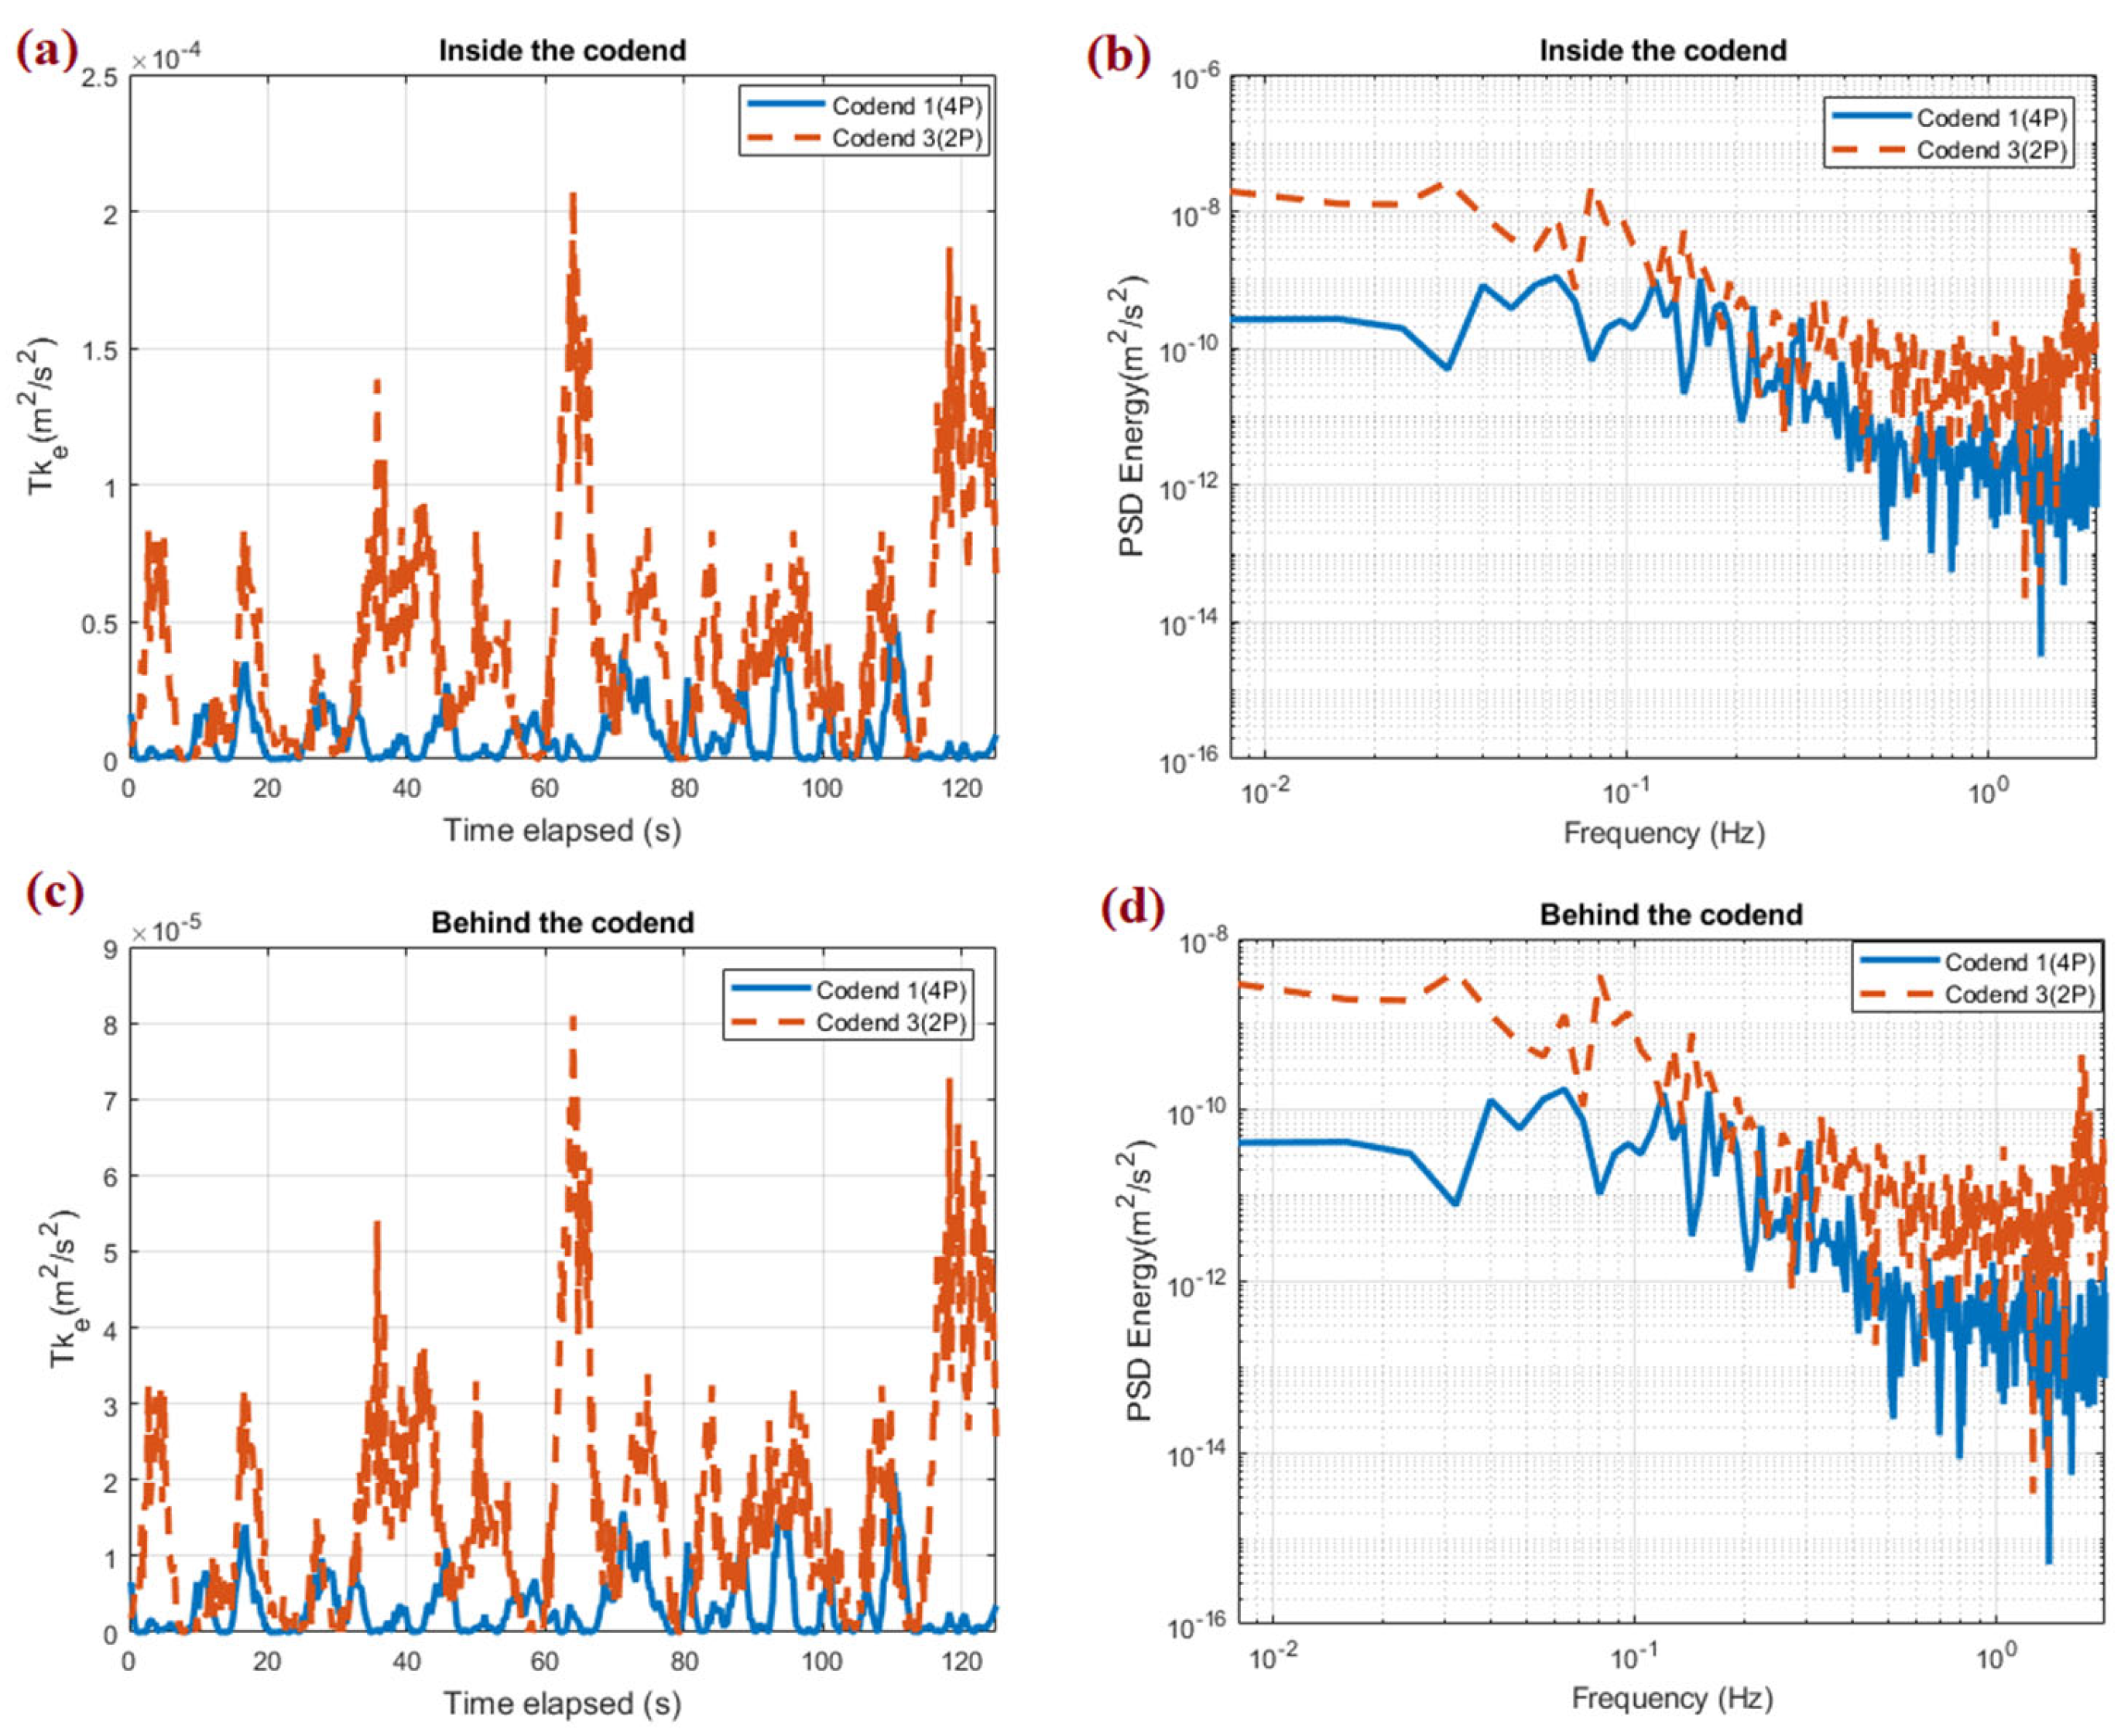
Turbulent kinetic energy (TKE) is a scorekeeper of the unsteady turbulent disturbance extension inside and behind the codend and gives an estimate of the unsteady turbulent energy content produced in the flow (Figure 15). These TKE present the evolution of the unsteady turbulent flow corresponding to the flow passage through the codend associated to codend motions and were influenced by the number of netting panels used to construct the codend. Indeed, the amplitudes of the oscillations of the TKE for the 2p codend is about 75% greater compared to those of the 4p codend and presents an oscillation of quasi-periodic nature. However, inside the codend, the average TKE was about 8.12 ×   10 6   m 2 / s 2 and 5.17 × 10 5   m 2 / s 2 , while behind the codend, it was 3.22 × 10 6   m 2 / s 2 and 1.61 × 10 5   m 2 / s 2 for the 4p codend and 2p codend, respectively (Figure 15).
Each energy spectrum associated with the temporal TKE signal presents two main peaks. The first one at: f 1 = 0.04 and 0.032 Hz and the second maximal frequency peak corresponds to f 2 = 0.28 and 0.14 Hz for the temporal signals of 4p codend and 2p codend TKE oscillations, respectively, inside the codend (Figure 15b). Behind the codend, the frequency of the TKE indicated several peaks when using the PSD method as shown in Figure 15d. The energy spectrum exhibits a higher frequency peak corresponding to low frequencies of f 1 = 0.064 and 0.032 Hz, and the second peak was obtained at f 2 = 0.304 and 0.16 Hz for the 4p codend and 2p codend, respectively.

4. Discussion

Changes in the codend design by modifying its geometrical shape and the number of netting panels and catch weights may be some of the solutions to improve the selective properties of the codend by increasing the likelihood of fish escape, the engineering performance of the whole trawl net, and to better understand the fish behavior inside the trawl net. Indeed, this study demonstrates that the modification of the geometrical shape of the codend and catch weight are directly related at the origin of the intense fluttering motions of the codend, which influence flow passage through the codend and will create the unsteady turbulent flow, in particular, the vortex shedding inside and behind the codend. The development of this turbulent flow affects overall trawl performance, fish swimming speed, and maneuverability of the fish in the codend. However, the results of this study did not only identify the dependence of the codend deformation and the nature of the codend motions on the codend design and the maximum cross-sectional of the catch (catch weight), but also to demonstrate the dependence of the codend drag on the complex interaction between the codend structure and flow field. Therefore, it has been shown in this study that the use of 4p codend such as codend 2 and 2p codend such as codend 3 certainly increases the codend motions and TKE, and decreases the velocity field through the codend compared to the standard codend (codend 1) due to their instability but, allows it to considerably reduce the codend drag. The findings of this study confirmed the trend followed by O’Neill et al. [10], Maldsen et al. [17], Priour and Prada [18], and Druault and Germain [15], who modified the geometrical shape of the codend (mesh shape, twine diameter, and mesh size) and the catch weights to better understand the codend behavior.
In contrast to the investigation of O’Neill et al. [10], Bouhoubeiny et al. [14], Kim [16,23], Maldsen et al. [17], Druault and Germain [15], and Liu et al. [6], the present study showed how changing the gear design and catch weight can strongly affect the codend drag and turbulent flow developing inside and behind the codend. However, the results obtained experimentally in the present study showed that the use of the 2p codend instead of 4p codends led to a decrease in drag force ~4.7% and ~2.12% compared to those of codends 1 and 2, respectively. Furthermore, it was found that at the empty stage, the 2p codend had a drag force higher than those of 4p codends. This difference in drag was attributed to the netting friction, another plausible explanation is that the decrease in the netting panel number during the design made it more unstable thus, decreasing the water flow velocity and an increase of the vertical pressure acting on the empty codend free surface [10,36,37]. This increase in vertical pressure allows the 2p codend to oscillate more than 4p codend that decreases its mesh opening, limiting the flow passage, and thus increasing its drag. This hypothesis is supported by the study of Liu et al. [6] who demonstrated that the 4p codend did not oscillate significantly under the condition of an empty codend that which could make its drag weaker unlike the 2p codend [17].
This study also demonstrated that the increase in catch weight led to an increase in drag due to the intense codend motions caused by the presence of catch inside the codend. Indeed, the statistical analysis indicated that the variation in drag force was about 18.73%, 17.175, and 15.91% between the lowest catch weight and the greater catch weight for the codends 1, 2, and 3, respectively. These increases in drag with the increase in the catch weight can be explained by the fact that the presence of the catch inside the codend reduces the flow field in the region in front of the catch due to the increase in codend motions. That modifies the meshes opening on the end-part of the codend, leading to a decrease in the flow passage through this part of the codend. Thus, creating the unsteady turbulent flow inside and behind the codend thus increasing the drag and influenced the physiology and behavior of fish [13,15,27]. Another reason is that when the catch weight rose, the codend diameter (the diameter of the sphere defining the catch shape) increased as well. As a result, the water flow field near this area of the codend decreased. By increasing the presence of the unsteady turbulent flow that affects the codend drag, this decrease in water flow will raise the water pressure on the codend, which will be especially critical on codends 1 and 2. The great presence of this vortex shedding and eddy flow inside the codend could affect the swimming energy, which influences fish escape by the fluttering net panel from the codend. In this case, because the motions of the 2p codend (codend 3) are greater than those of 4p codends (codends 1 and 2), velocity fluctuation inside this codend will be higher than those inside other codend [10,13,17]. This greater velocity fluctuation inside the 2p codend will facilitate the higher production of the turbulent kinetic energy, its redistribution, and its dissipation within the unsteady flow develop inside compared to the 4p codends (Figure 15). That will reduce the probability of the fish escaping inside this codend, which makes it the least selective codend unlike the others codends although it is the codend having a significant amount of drag (though smaller compared to the others). To solve this problem of selectivity on this codend (2p codend), it will be judicious to adapt the solutions proposed by Priour [38] who recommended replacing the diamond mesh with the hexagonal mesh or that of Maldsen et al. [17] having replaced the diamond mesh by the square mesh, which will thus make the 2p codend the most efficient codend.
The reason for the lower drag on the codend 3 (2p codend) was also because its cross-section was lower than that of 4p codend (codends 1 and 2). Thereby, because the increase in drag affects the energy efficiency, it would be relevant to consider the fuel consumption as one of the improved parameters during codend design, although the codend drag is a lower proportion of the drag of the whole trawl net. That could justify the recommendation of the 2p codend, unlike the 4p codend. However, according to O’Neill et al. [10], Maldsen et al. [17], and Liu et al. [6], the lower cross-section such as the one of 2p codend could allow the catch to build up in the forward direction thus increasing the vertical pressure acting on the codend. This increase in pressure could impact the catch quality. This might be a particular disadvantage for the 2P codend, which allows us to recommend the 4p codend (codend 2) due to the fact the difference between its drag and the one of 2p codend is lower than 4%.
During the flume tank experiment, the three codends were attached to a circular rigid frame generating more intense oscillations than a codend attached to a trawl by O’Neill et al. [22] and Madsen et al. [17]. These oscillations were synchronized with the drag and velocity field oscillations. Moreover, the temporal drag oscillations includes a weak wave oscillation and are caused by the unsteady turbulent flows developed inside and downstream to the codend in the wake zone, which gives rise to a transverse pressure on the codend [15,17]. These oscillations were mainly of low frequency with amplitude increasing with increasing catch size and number of netting panels. Thereby, the drag oscillation of the 2P codend was linked to the low frequency small than those obtained on the temporal drag oscillations of the 4p codends. Indeed, the results of the PSD revealed that the low frequencies of the drag were obtained at 0.21, 0.033, and 0.016Hz for the codends 1, 2, and 3, respectively, and they increased with the increasing catch weight. These temporal drag oscillations were synchronized with those of the codend transverse motions and transverse and streamwise flow velocities. That is why, because the 4P codend (codend 1) had a more agitated and intense transverse motion and streamwise flow velocity oscillation compared to the 2p codend, the oscillations of its drag are also intense. This trend was confirmed by Madsen et al. [17] who reported that 2p codend can have lower drag and a very lower motions compared with 4p codend. Moreover, the hypothesis that showed that the low frequency of temporal drag had a synchronization with those of the temporal flow velocity and codend motions was demonstrated by Kim [16,23] who studied the turbulence and tilt inside the codend of trawl, and found that the tension oscillation period was about 3~8 s and shortened with the increase in flow velocity. Furthermore, the results of the PSD obtained in the present study showed the frequencies of the drag are lower than those reported by Nepali et al. [39] for a square cylinder drag force.
Concerning the codend motions, the codend 2 (4p codend) and the codend 3 (2p codend) showed more unstable behavior with more pendulum motions compared to the codend 1 (standard codend). This could be because the cross-section of these two codends could respond differently to the drag, resulting in instability. The higher motions of these two codends could impact the catch quality because the greater codend motion can push the fish to be rubbed by twine materials compared to the standard codend (Madsen et al., 2015). However, it was demonstrated that codends oscillations are synchronized with the drag force oscillations that showed that more codend resulted in an unstable behavior as the drag increased. This hypothesis was verified with the individual results obtained on each codend as a function of the catch weights showing that the drag and the transverse motions of the codend increase as the catch weight increase. While, when we spontaneously compared the tendency followed by the drag and the three codend motions, it was noted that the drag was not the only function of the codend motions but also of the twine area, which allows us to justify the lower drag obtained on codend 2 and codend 3 having more unstable movements unlike codend 1. We can therefore evoke a new hypothesis according to which the codend motions have more impact on the fish behavior inside the trawl net and selectivity as its drag which also depends on the warp motions and the design characteristic of the trawl [8,10,17].
In this study, the unstable behavior of the codend motions observed on the three codend can be caused by the greater pressure generated by the vortex shedding developing behind the codend and the unsteady turbulent flow inside the codend. This greater pressure could also increase the instability and the amplitude of the oscillatory motions of the codend due to the periodicity of the unsteady turbulent flow [15]. Indeed, the codend oscillations induce to a vortex flow generated inside the codend and behind the codend in the flume tank. This vortex flow increased with the codend motion and limited the flow passage through the codend by reducing the mesh opening. That is why the development of this vortex shedding was more important in the 2P codend compared to the 4P codend. This because velocity field observed inside and behind the 2P codend was lower than that observed on the 4P codend.
The results showed that the PSD of transverse oscillations of the three codends are greater than that observed in the streamwise oscillations. It means that the codend oscillates more violently in the z-direction than in the x-direction, the reason for this phenomenon may be that the vortex shedding pressure is the same in each direction, but there is the binding effect of the codend itself in the x-direction, while the binding effect of codend itself at z-direction is far less than that at x-direction. This conclusion was similar to those obtained by Druault et al. [40] on the fishing net and Druault and Germain [15] on the codend.
The quasi-periodic oscillations of the motions of the three codends obtained in this study showed two peak frequencies of 0.037 and 0.33 Hz for the 4P codends, and 0.025 and 0.19 Hz for the 2P codend both on the streamwise and transverse motions. These frequencies observed on the three codends showed flat spectra, which is consistent with the results reported by Bouhoubeiny et al. [14] and Druault and Germain [15]. These flat spectra occurred because the codend motions were caused by the presence of vortex shedding behind the codend related to the low frequencies [14,41]. This vortex shedding can be justified by observing the Reynolds number as function of the codend diameter which was varied between 119,309.94–180,707.41, 107,519.87–164,040.63, and 102,829.49–153,736.04 for codends 1, 2, and 3, respectively. Indeed, according to the research of O’Neill et al. [10] and that of Druault and Germain [15], the presence of the catch inside the trawl net results in a larger codend volume and blockage of the meshes, that limits the flow passage through the trawl structure and generates a greater transverse pressure on the codend and create the vortex shedding. However, the low-frequency observed on the codend motions seems to be directly linked to the cyclical variations in the three codend drag and associated to the elastic nature of the extended codend. Furthermore, the first peaks of these two motions can due to structure vibrations, while the second peaks could be due to the periodic oscillations induced by the vortex shedding behind these codends [15,27].
Concerning the flow organization, this study analyzed the influence of the gear design on the development of the turbulent flow inside and behind the codend using ECVM measurements obtained at two points inside and outside the codends. This analysis showed that the turbulent intensity inside and behind the 4p codend were lower than that obtained inside and behind the 2P codend. Indeed, inside the codend, the turbulent intensity varied from 0.077–2.64% and 0.12–5.11% for the 4P codend and 2P codend, respectively. Behind the codend, it varied from 0.11–3.84% and 0.25–6.85% for the 4P codend and 2P codend, respectively. The reason of this grater turbulent intensity observed through the 2P codend compared to 4P codend was due to the fact that 2P codend motions were unstable and intense unlike those of the 4P codend. These unstable and intense motions decreased the mesh opening of the codend which limits the flow passage through the codend structure engendering flow disturbances. These disturbances engender the creation of the unsteady turbulent flow inside the codend and the vortex shedding behind the codend which was considerably important on the 2P codend compared to 4P codend making it less selective. This trend was confirmed by the experimental study carried out by Bouhoubeiny et al. [14], Druault and Germain [15], and Thierry et al. [13,27] who demonstrated the existence of the vortex shedding behind the codend.
The circumference of the standard codend (codend 1) was greater than that of codends 2 and 3 in the end-part of the codend, meaning that the mesh was more open in the standard codend. This greater mesh opening in the standard codend can be justified by the fact its motions are very lower compared to those of other codends. However, in codends 2 and 3, the mesh opening is not stable due to their intense motions. In this case, the mesh opening angle on these two cod-ends depends on the catch size and the codend position. This depends on the catch size (catch weight) because the more the catches increase in these two codends, the more the codends had greater instability with the large oscillation amplitudes on the transverse motion, which reduce the mesh opening. The main reason could be that the presence of the large catches inside the codend reduces the water filtration, which led to the formation of vortex flow inside the codend on the wake zone. One of the drawbacks of this vortex flow is that they prevent juvenile resources from escaping into the codend, making codends 2 and 3 less selective compared to codend 1. In addition, the selectivity effect on these two codends will also depend on the species. Thus, for the case of the Antarctic krill fisheries, the mesh opening observed in these two codends could increase their selectivity due to the lower length of the Antarctic krill, but for other species such as round fish, the selectivity will decrease [42,43]. The other solution to solve the problem of selectivity apart from the recommendation we mentioned above will be to implement a By-Catch Reduction Device (BRD) to reduce unintended catch of Antarctic krill fisheries, to drive the fish close to the cod-end and then to reduce the bycatch [12,13,15,23].

5. Conclusions

This study was carried out to experimentally evaluate the impact of gear design and catch weight on the hydrodynamic performances, ECVM flow field inside and behind the codend, cross-section, and codend motions with the main of better understanding of the fluid–structure interaction of the codend in order to predict trawl drag, the fish behavior, and the trawl selectivity. Three 1/15th scale codend models were designed and tested in the flume tank. The power spectra density (PSD) method was used to analyze the non-stationary time series of the drag, codend motions, flow velocity field, and the ensemble-averaged turbulence indicator. The following main conclusions can be drawn from this study:
(1)
The drag forces, codend motions, codend deformation, and Reynolds number increased as the catch weight, number of netting panels, and flow velocity increased, while the drag coefficient decreased as the catch weight and number of netting panels increased.
(2)
The circumference of the catch regions of the 2P codend was significantly smaller than that of the 4p codends. As a consequence, this codend had lower drag but it is less selective and can impact the catch quality than the 4p codends.
(3)
The analysis of temporal flow velocities presents an oscillation of quasi-periodic nature and clearly showed that inside and behind the 4P and 2P codends, the flow velocity field recovered between 0.48–0.79 u 0 and 0.45–0.75 u 0 , respectively. In addition, the analysis of TKE has underlined that the TKE is mainly produced inside the codend (about 60% greater) compared to those obtained behind the codend, and this turbulent kinetic energy is greater inside and behind the 2P codend compare to that obtained on 4P codend. Thus, the distribution of the turbulent fluctuation inside and behind the 2P codend was more important.
(4)
The spectra content obtained on the motions of the 2P codend exhibited a dominant low frequency component compared to those obtained on the motions of the 4p codends. Moreover, it was found that the vortex frequency of the 2P codend structure are greater than that of the 4P codend structure. Therefore, the gear design and catch weight greatly influenced the codend behavior.
(5)
These basic results from the measurements of flow field, drag forces, and fluttering motions could help with understanding the complex fluid-structure interactions that induce large deformation and oscillation of the codend which modifies the drag force instantaneously, the mouth opening, and herding response or escape behavior of fish due to the towing velocity. In this case, it can be concluded that 2p codend has very good performance in terms of drag force, but considering the improvement in fish behavior and selectivity we recommend the codend 2 (4p codend).

Author Contributions

Conceptualization, B.T.N.N., H.T., J.Z. and F.H.; Methodology, B.T.N.N.; Software, B.T.N.N. and W.L.; Validation, B.T.N.N., H.T. and J.Z.; Formal analysis, B.T.N.N. and F.H.; Investigation, B.T.N.N., H.T., J.Z. and W.L.; Resources, B.T.N.N., H.T. and F.H.; Data curation, B.T.N.N., J.Z., W.L. and F.H.; Writing—original draft, B.T.N.N.; Writing—review & editing, H.T., L.X. and F.H.; Visualization, B.T.N.N.; Supervision, H.T., J.Z. and F.H.; Project administration, L.X.; Funding acquisition, H.T. and L.X. All authors have read and agreed to the published version of the manuscript.

Funding

This study was financially sponsored by the National Natural Science Foundation of China (Grant No. 31902426), Shanghai Sailing Program (19YF1419800), and a Special project for the exploitation and utilization of Antarctic biological resources of Ministry of Agriculture and Rural Affairs (D-8002-18-0097).

Informed Consent Statement

This manuscript does not contain any studies with human participants or animals performed by any of the authors.

Data Availability Statement

Data will be available upon request by the corresponding author Hao Tang.

Conflicts of Interest

The authors declare no conflict of interest.

References

  1. Sterling, D.; Balash, C. Engineering and catching performance of five netting materials in commercial prawn-trawl systems. Fish. Res. 2017, 193, 223–231. [Google Scholar] [CrossRef]
  2. Tang, H.; Hu, F.; Xu, L.; Dong, S.; Zhou, C.; Wang, X. Variations in hydrodynamic characteristics of net panels with various twine materials, knot types, and weave patterns at small attack angles. Sci. Rep. 2019, 9, 1923. [Google Scholar] [CrossRef] [PubMed] [Green Version]
  3. Tang, H.; Nsangue, B.T.N.; Pandong, A.N.; He, P.; Liuxiong, X.; Hu, F. Flume Tank Evaluation on the Effect of Liners on the Physical Performance of the Antarctic Krill Trawl. Front. Mar. Sci. 2022, 8, 2144. [Google Scholar] [CrossRef]
  4. Jung, J.-M.; Matsushita, Y.; Kim, S. Study on Reducing Towing Drag by Varying the Shape and Arrangement of Floats and Gears. Appl. Sci. 2022, 12, 7606. [Google Scholar] [CrossRef]
  5. Priour, D. Modelling axisymmetric codends made of hexagonal mesh types. Ocean Eng. 2014, 92, 1–11. [Google Scholar] [CrossRef] [Green Version]
  6. Liu, W.; Tang, H.; You, X.; Dong, S.; Xu, L.; Hu, F. Effect of Cutting Ratio and Catch on Drag Characteristics and Fluttering Motions of Midwater Trawl Codend. J. Mar. Sci. Eng. 2021, 9, 256. [Google Scholar] [CrossRef]
  7. Thierry, N.N.B.; Tang, H.; Liuxiong, X.; You, X.; Hu, F.; Achile, N.P.; Kindong, R. Hydrodynamic performance of bottom trawls with different materials, mesh sizes, and twine thicknesses. Fish. Res. 2019, 221, 105403. [Google Scholar] [CrossRef]
  8. Thierry, N.N.B.; Tang, H.; Achile, N.P.; Xu, L.; Hu, F.; You, X. Comparative study on the full-scale prediction performance of four trawl nets used in the coastal bottom trawl fishery by flume tank experimental investigation. Appl. Ocean Res. 2019, 95, 102022. [Google Scholar] [CrossRef]
  9. Nsangue, B.T.N.; Tang, H.; Pandong, A.N.; Xu, L.; Adekunle, D.M.; Hu, F. Examining engineering performance of midwater trawl with different horizontal spread ratio, floatage, and weight parameters: A case study of model net for Antarctic krill fisheries. Int. J. Nav. Arch. Ocean Eng. 2022, 14, 100448. [Google Scholar] [CrossRef]
  10. O′Neill, F.; Knudsen, L.; Wileman, D.; McKay, S. Cod-end drag as a function of catch size and towing speed. Fish. Res. 2004, 72, 163–171. [Google Scholar] [CrossRef]
  11. Brinkhof, J.; Herrmann, B.; Sistiaga, M.; Larsen, R.B.; Jacques, N.; Gjøsund, S.H. Effect of gear design on catch damage on cod (Gadus morhua) in the Barents Sea demersal trawl fishery. Food Control. 2020, 120, 107562. [Google Scholar] [CrossRef]
  12. Nsangue, B.T.N.; Tang, H.; Xu, L.; Hu, F.; Dong, S.; Achille, N.P.; Zou, B. Comparison between physical model testing and numerical simulation using two-way fluid-structure interaction approach of new trawl design for coastal bottom trawl net. Ocean Eng. 2021, 233, 109112. [Google Scholar] [CrossRef]
  13. Thierry, N.N.B.; Tang, H.; Xu, L.-X.; Hu, F.; You, X.; David, M.A.; Achille, N.P. Identifying the turbulent flow developing inside and around the bottom trawl by Electromagnetic Current Velocity Meter approach in the flume tank. J. Hydrodyn. 2021, 33, 636–656. [Google Scholar] [CrossRef]
  14. Bouhoubeiny, E.; Germain, G.; Druault, P. Time-resolved PIV investigations of the flow field around rigid cod-end net structure. Fish Res. 2011, 108, 344–355. [Google Scholar]
  15. Druault, P.; Germain, G. Analysis of hydrodynamics of a moving trawl codend and its fluttering motions in flume tank. Eur. J. Mech. B/Fluids 2016, 60, 219–229. [Google Scholar] [CrossRef] [Green Version]
  16. Kim, Y.-H. Analysis of the turbulent flow and tilt in the cod-end of a bottom trawl during fishing operations. Ocean Eng. 2013, 64, 100–108. [Google Scholar] [CrossRef]
  17. Madsen, N.; Hansen, K.; Madsen, N.A.H. Behavior of different trawl codend concepts. Ocean Eng. 2015, 108, 571–577. [Google Scholar] [CrossRef]
  18. Priour, D.; La Prada, D. An experimental/numerical study of the catch weight influence on trawl behavior. Ocean Eng. 2015, 94, 94–102. [Google Scholar] [CrossRef] [Green Version]
  19. Larsen, R.B.; Herrmann, B.; Sistiaga, M.; Brinkhof, J.; Tatone, I.; Langård, L. New approach for modelling size selectivity in shrimp trawl fisheries. ICES J. Mar. Sci. 2017, 75, 351–360. [Google Scholar] [CrossRef]
  20. Thierry, B.N.N.; Tang, H.; Achile, N.P.; Xu, L.; Zhou, C.; Hu, F. Experimental and Numerical Investigations of the Hydrodynamic Characteristics, Twine Deformation, and Flow Field Around the Netting Structure Composed of Two Types of Twine Materials for Midwater Trawls. J. Ocean Univ. China 2021, 20, 1215–1235. [Google Scholar] [CrossRef]
  21. Wilson, G.J. Australian polymer banknote: A review, Optical Security and Counterfeit Deterrence Techniques II. Proc. SPIE 1998, 3314, 2–7. [Google Scholar] [CrossRef]
  22. O′Neill, F.; McKay, S.; Ward, J.; Strickland, A.; Kynoch, R.; Zuur, A. An investigation of the relationship between sea state induced vessel motion and cod-end selection. Fish. Res. 2002, 60, 107–130. [Google Scholar] [CrossRef]
  23. Kim, Y.-H. Analysis of turbulence and tilt by in-situ measurements inside the cod-end of a shrimp beam trawl. Ocean Eng. 2012, 53, 6–15. [Google Scholar] [CrossRef]
  24. Cheng, Z.; Winger, P.D.; Bayse, S.M.; Kelly, D. Hydrodynamic Performance of Full-Scale T0 and T90 Codends with and without a Codend Cover. J. Mar. Sci. Eng. 2022, 10, 440. [Google Scholar] [CrossRef]
  25. Nguyen, V.Y.; Bayse, S.M.; Cheng, Z.; Winger, P.D.; DeLouche, H.; Kebede, G.E.; Legge, G. Developing a full-scale shaking codend to reduce the capture of small fish. PLoS ONE 2023, 18, e0280751. [Google Scholar] [CrossRef]
  26. Hu, F.; Tadashi, T.; Seiichi, T.; Daisuke, S.; Hiroshi, I.; Yasuhisa, H. The Performance of the New Circulating Water Channel of Tokyo University of Marine Science and Technology. Jpn. Soc. Fish. Eng. 2004, 41, 153–163. (In Japanese) [Google Scholar]
  27. Thierry, N.N.B.; Tang, H.; Achille, N.P.; Xu, L.; Hu, F. Unsteady turbulent flow developing inside and around different parts of fluttering trawl net in flume tank. J. Fluids Struct. 2021, 108, 103451. [Google Scholar] [CrossRef]
  28. Gupta, H.R.; Mehra, R. Power spectrum estimation using Welch method for various window techniques. Int. J. Sci. Res. Eng. Technol. 2013, 2, 389–392. [Google Scholar]
  29. Jwo, D.-J.; Chang, W.-Y.; Wu, I.-H. Windowing Techniques, the Welch Method for Improvement of Power Spectrum Estimation. Comput. Mater. Contin. 2021, 67, 3983–4003. [Google Scholar] [CrossRef]
  30. Tummers, M.J.; Passchier, D.M. Spectral estimation using a variable window and the slotting technique with local normalization. Meas. Sci. Technol. 1996, 7, 1541–1546. [Google Scholar] [CrossRef]
  31. Johnsson, R.C.F.; Zijerveld, J.C.; Schouten, C.M.; van den Bleek, B. Leckner Characterization of fluidization regime by time-series analysis of pressure fluctuations. Int. J. Multiph. Flow 2000, 26, 663–715. [Google Scholar] [CrossRef]
  32. Tropea, C.; Nobach, H.; Ramond, A.; Reulet, P. Turbulent Velocity Spectra from Laser Doppler Data. In Proceedings of the 3rd ONERA-DLR Aerospace Symposium, Paris, France, 20–22 June 2001. [Google Scholar]
  33. Abbasi, M.; Sotudeh-Gharebagh, R.; Mostoufi, N.; Mahjoob, M.J. Non-intrusive monitoring of bubbles in a gas–solid fluidized bed using vibration signature analysis. Power Technol. 2009, 196, 278–285. [Google Scholar] [CrossRef]
  34. Zakaria, R.; Ruyet, D.L. Theoretical Analysis of the Power Spectral Density for FFT-FBMC Signals. IEEE Commun. Lett. 2016, 20, 1748–1751. [Google Scholar] [CrossRef]
  35. McCulloch, C.E. An introduction to generalized linear mixed models. Conf. Appl. Stat. Agric. 1996. [Google Scholar] [CrossRef] [Green Version]
  36. Jones, E.G.; Summerbell, K.; O′Neill, F. The influence of towing speed and fish density on the behaviour of haddock in a trawl cod-end. Fish. Res. 2008, 94, 166–174. [Google Scholar] [CrossRef]
  37. O′Neill, F.G.; O′Donoghue, T. The fluid dynamic loading on catch and the geometry of trawl cod–ends. Proc. R. Soc. A Math. Phys. Eng. Sci. 1997, 453, 1631–1648. [Google Scholar] [CrossRef]
  38. Priour, D. Numerical optimization of trawls design to improve their energy efficiency. Fish. Res. 2009, 98, 40–50. [Google Scholar] [CrossRef] [Green Version]
  39. Nepali, R.; Ping, H.; Han, Z.; Zhou, D.; Yang, H.; Tu, J.; Zhao, Y.; Bao, Y. Two-degree-of-freedom vortex-induced vibrations of two square cylinders in tandem arrangement at low Reynolds numbers. J. Fluids Struct. 2020, 97, 102991. [Google Scholar] [CrossRef]
  40. Druault, P.; Germain, G.; Facq, J.-V. PIV measurements combined with the motion tracking technique to analyze flow around a moving porous structure. J. Fluids Struct. 2015, 56, 190–204. [Google Scholar] [CrossRef] [Green Version]
  41. Pichot, G.; Germain, G.; Priour, D. On the experimental study of the flow around a fishing net. Eur. J. Mech. B/Fluids 2009, 28, 103–116. [Google Scholar] [CrossRef] [Green Version]
  42. Krag, L.A.; Herrmann, B.; Iversen, S.A.; Engås, A.; Nordrum, S.; Krafft, B.A. Size Selection of Antarctic Krill (Euphausia su-perba) in Trawls. PLoS ONE 2014, 9, e102168. [Google Scholar] [CrossRef] [PubMed] [Green Version]
  43. Juáres, M.A.; Casaux, R.; Corbalán, A.; Blanco, G.; Pereira, G.A.; Perchivale, P.J.; Coria, N.R.; Santos, M.M. Diet of Adélie penguins (Pygoscelis adeliae) at Stranger Point (25 de Mayo/King George Island, Antarctica) over a 13-year period (2003–2015). Polar Biol. 2018, 41, 303–311. [Google Scholar] [CrossRef]
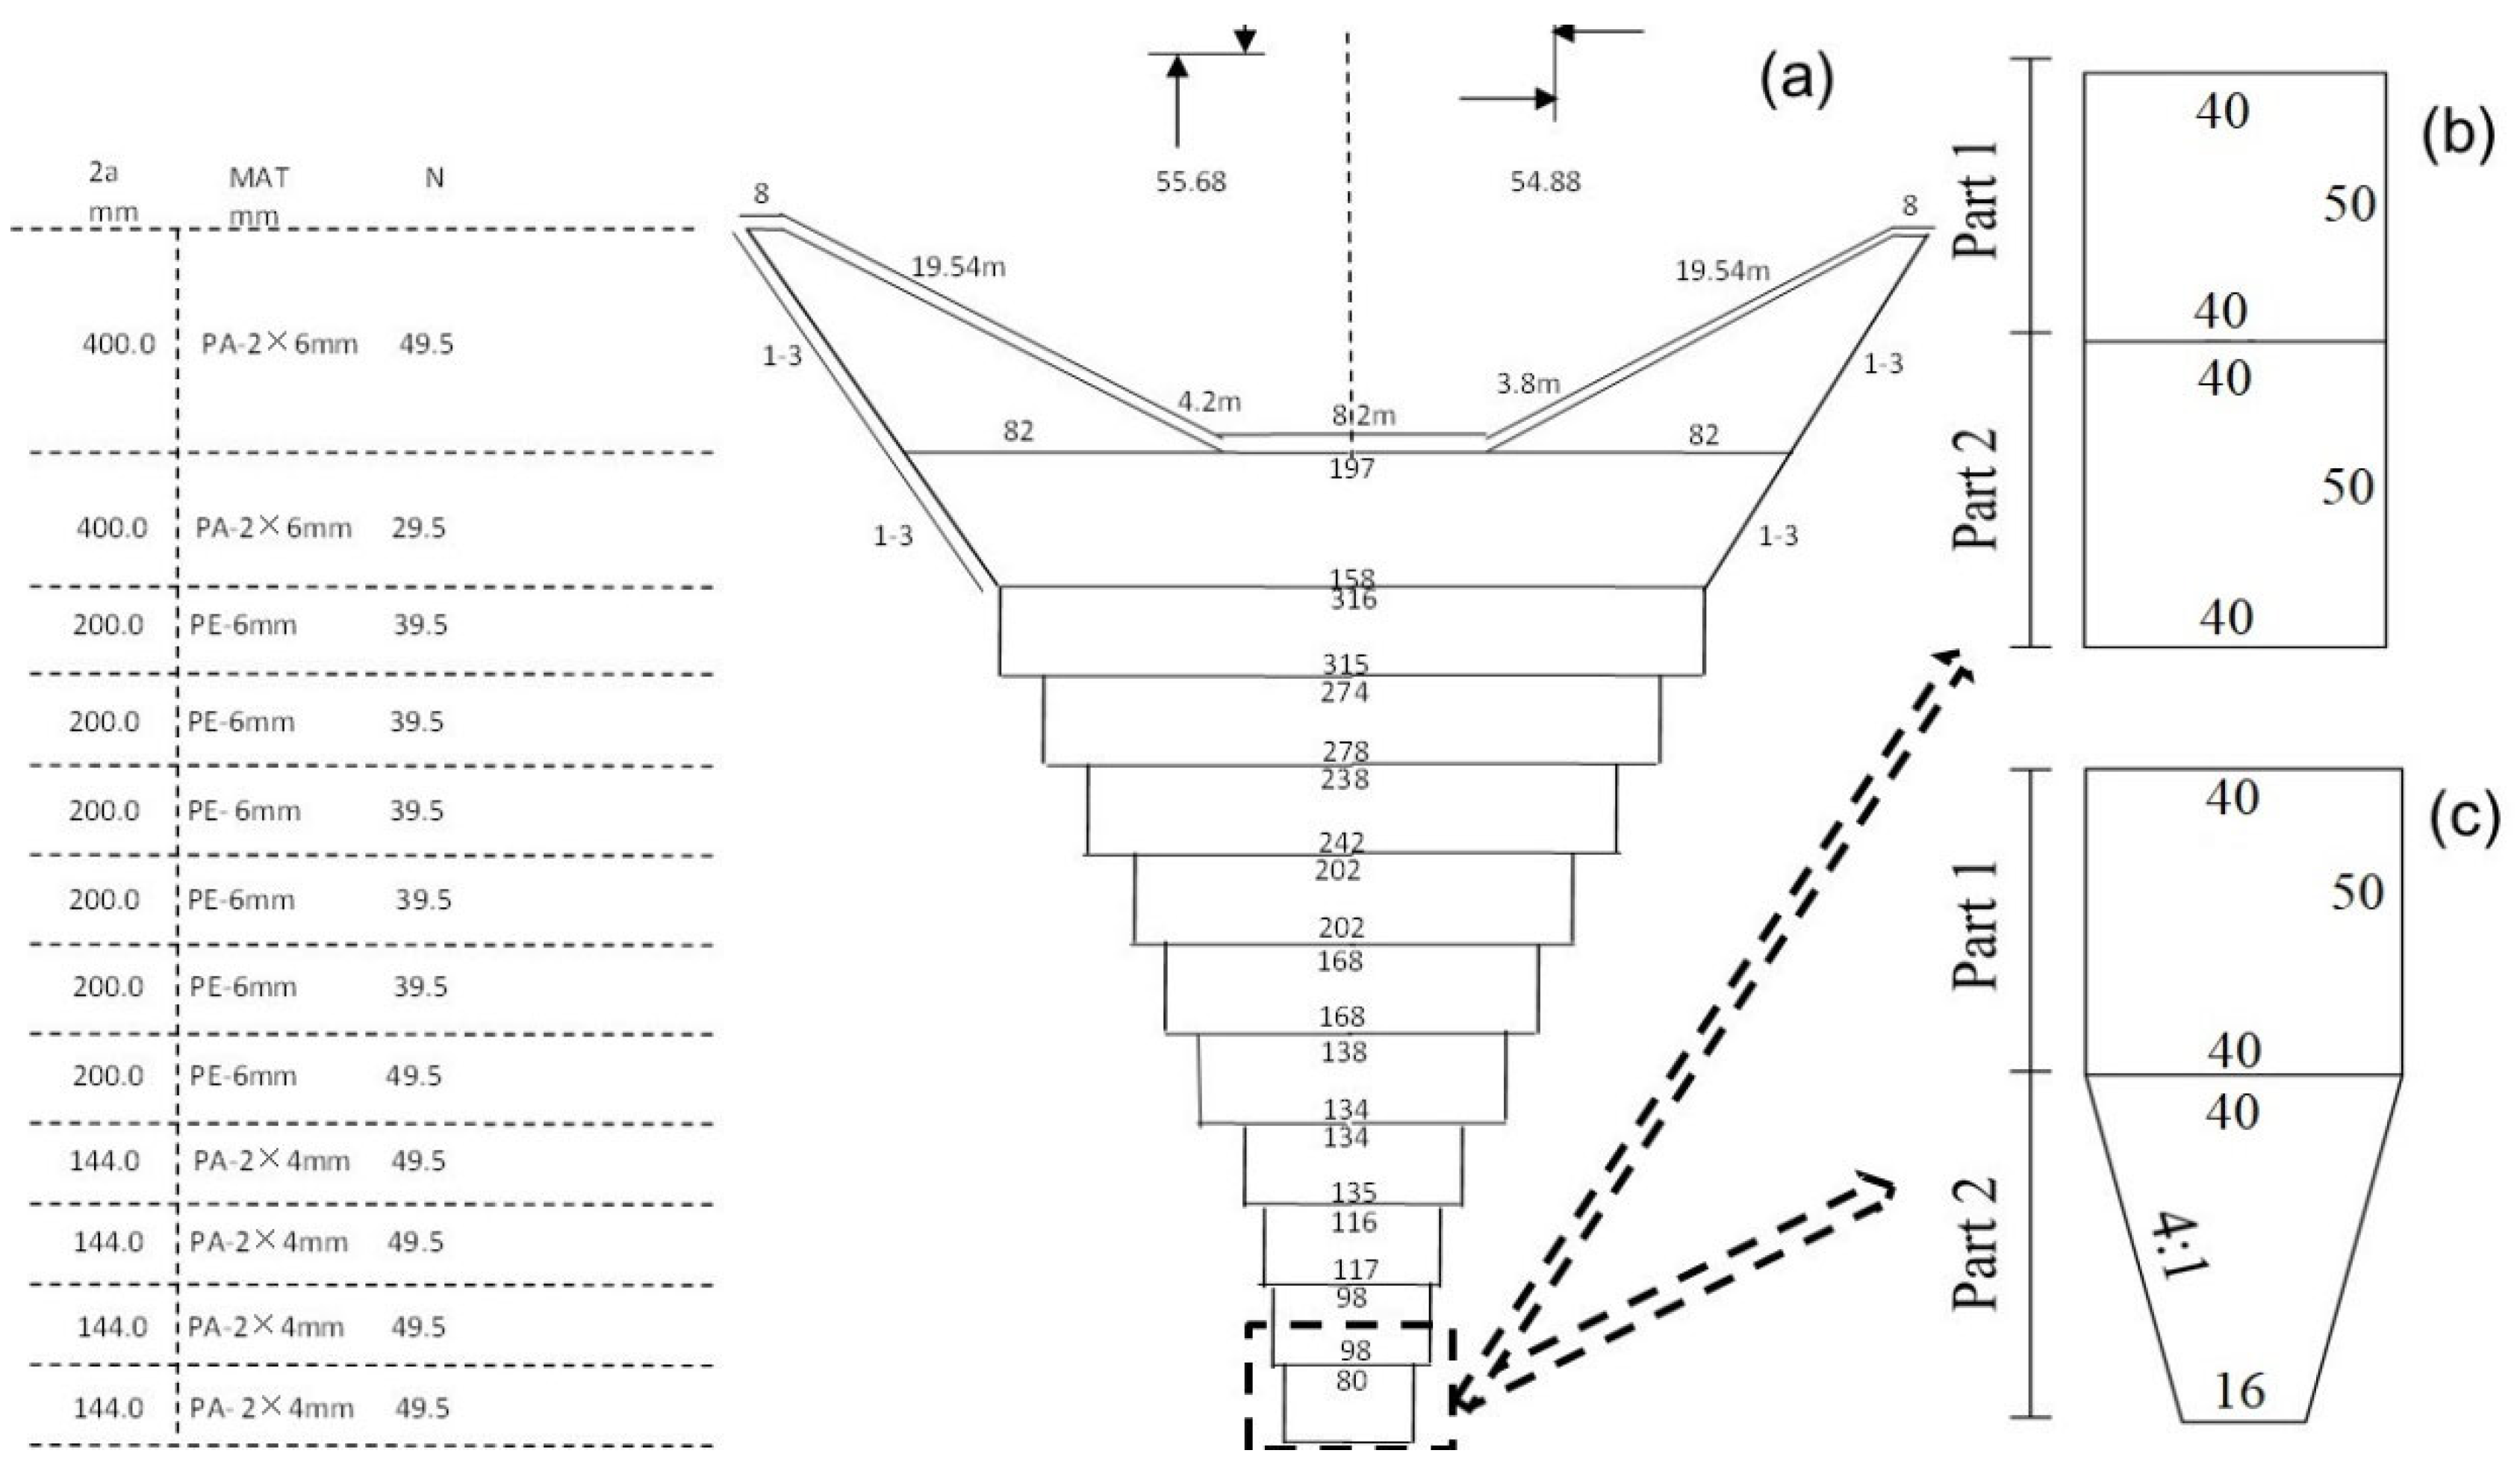
Figure 1. Schematic net plan of: (a) Antarctic krill trawl, (b) Codends 1 and 3, and (c) Codend 2.
Applsci 13 02505 g001
Figure 2. Trawl model (left side) and codend models test (right side) in the flume tank: (up) codend 1, (middle) codend 2, and (bottom) codend 3.
Applsci 13 02505 g002
Figure 3. Schematic diagram of the experimental setup to measure the hydrodynamic forces, flow velocity, shape, and the motion of the codend model.
Applsci 13 02505 g003
Figure 4. Schematic of the experimental setup of flow velocity measurement inside and behind codend: The two grey solid dot indicates the measurement points.
Applsci 13 02505 g004
Figure 5. Time evolution of the three codend drag forces at different catch weight and at u 0   = 0.9 m/s.
Applsci 13 02505 g005
Figure 6. PSD representation (in a log–log scale) of the codend drag force at different catch weights.
Applsci 13 02505 g006
Figure 7. Drag force of the three codends at different catch weight as function of flow velocity.
Applsci 13 02505 g007
Figure 8. Drag coefficient of the three codends at different catch weight as function of Reynolds number calculated with twine diameter.
Applsci 13 02505 g008
Figure 9. Drag coefficient of the three codends at different catch weight as a function of Reynolds number calculated with codend diameter.
Applsci 13 02505 g009
Figure 10. Fluctuations of the x—structure motion of the three codends (left) associated to the power spectral density (PSD) representation (in a log–log scale) (right) at different catch weights.
Applsci 13 02505 g010
Figure 11. Fluctuations of the z-structure motion of the three codends (left) associated to the power spectral density (PSD) representation (in a log–log scale) (right) at different catch weights.
Applsci 13 02505 g011
Figure 12. Geometrical profile of the three codends obtained from video cameras at catch weight ( u 0   = 0.9 m/s).
Applsci 13 02505 g012
Figure 13. Time evolution of the streamwise velocity (right) and transverse velocity (left) linked to the normalized frequency spectrum (bottom in a log-log scale) inside the different codends.
Applsci 13 02505 g013
Figure 14. Time evolution of the streamwise velocity (right) and transverse velocity (left) linked to the normalized frequency spectrum (bottom in a log-log scale) behind the different codends.
Applsci 13 02505 g014
Figure 15. Time evolution of the TKE (a) inside and (c) behind the different codends linked to the normalized frequency spectrum energy (left in a log-log scale) (b) inside and (d) behind the different codends.
Applsci 13 02505 g015
Table 1. Characteristic of trawl net models.
CodendTwine
Materials
Mesh Size
(mm)
Twine
Diameter
(mm)
Cutting RatioCutting
Sequence
(Subscripts
Represent Cycle Index)
Part 1 PA303No cutting ratio[N]22
Part 2Codend 1PA303No cutting ratio[N]25
Codend 2PA3034:1N [NBNBN]16
Codend 3PA303No cutting ratio[N]25
N represents the cutting on the points and B the cutting on the mesh bars.
Table 2. The twine area and the diameter of the three trawl codends.
Codend Twine   Area   ( c m 2 ) Diameter (m)
0 kg7.4 kg14.8 kg22.3 kg
Codend 128,8000.210.240.290.32
Codend 224,4800.190.230.280.31
Codend 314,4000.180.210.260.28
Table 3. Summary statistics results of the hydrodynamic performance parameters for the three codends (the mean values with the standard deviation); current data estimated with 95% confidence intervals from the GLMM.
CodendsCatch Weights F D C d 1 C d 2 R e   as   Function   of   d
Codend 10 kg 26.41 ± 10.59 2.96 ± 0.196 0.12 ± 0.0081 140,467.92 ± 32,882.28
7.4 kg 33.88 ± 14.02 2.86 ± 0.156 0.15 ± 0.0083 160,607.39 ± 37,654.54
14.8 kg 39.64 ± 16.45 2.33 ± 0.141 0.18 ± 0.011 193,508.74 ± 46,289.02
22.3 kg 41.70 ± 17.94 2.03 ± 0.071 0.2 ± 0.0066 211,988.54 ± 50,384.62
Codend 20 kg 29.53 ± 12.17 4.04 ± 0.16 0.11 ± 0.0047 126,906.05 ± 29,338.69
7.4 kg 33.47 ± 14.20 3.14 ± 0.11 0.13 ± 0.0044 152,805.04 ± 36,011.46
14.8 kg 37.24 ± 15.31 2.35 ± 0.12 0.14 ± 0.0068 186,676.91 ± 43,151.27
22.3 kg 40.34 ± 16.84 2.07 ± 0.57 0.15 ± 0.0043 206,588.87 ± 47,033.56
Codend 30 kg 30.23 ± 12.92 4.61 ± 0.13 0.156 ± 0.0047 119,711.53 ± 27,563.24
7.4 kg 33.23 ± 14.20 3.81 ± 0.11 0.176 ± 0.0049 138,395.59 ± 31,510.67
14.8 kg 37.11 ± 15.32 2.75 ± 0.81 0.195 ± 0.0057 171,871.21 ± 38,497.62
22.3 kg 39.53 ± 16.97 2.52 ± 0.53 0.207 ± 0.0043 184,693.12 ± 42,263.68
Table 4. Mean flow velocities of the two components.
CodendInsideBehind
uvuv
4P codend 0.395 ± 0.0320.014 ± 0. 0016 0.241 ± 0.089 0.002 ± 0.0047
2P codend 0.372 ± 0.0290.0139 ± 0.0044 0.234 ± 0.0940.0019 ± 0.0043
Disclaimer/Publisher’s Note: The statements, opinions and data contained in all publications are solely those of the individual author(s) and contributor(s) and not of MDPI and/or the editor(s). MDPI and/or the editor(s) disclaim responsibility for any injury to people or property resulting from any ideas, methods, instructions or products referred to in the content.