1. Introduction
Demand-response (DR) control in smart grids is a demand-side management (DSM) technique that defines how the demand side reacts to price tactics or incentive actions from a power unit [
1,
2]. DR control is used for variations in consumption patterns by end-use consumers in reaction to adjustments in electricity pricing through time, to incentivize payments aimed at encouraging lesser energy consumption in periods of high power-side price, or when whole-system dependability is compromised. Demand-response management is a cost-effective approach to reducing power use. Therefore, the cost of implementing demand-response algorithms is lower than the price of adding more power utilities to ensure peak shaving [
3,
4]. The deployment of DR management can help demand-side consumers receive cost-effective, high-quality, and customized services while also promoting supply–demand balance [
5]. Price-based programs (PBP) [
6] and incentive-based programs (IBP) [
7] are the two types of demand-response control. According to the PBR, high power prices not only boost market costs but also limit domestic demand, as it leads to a provisional loss of comfort [
8]. As a result, one of the most pressing smart-grid challenges is to determine optimal and acceptable electricity pricing. There have been some recent research efforts focusing on power prices around the world, with various practical applications [
9]. However, there will be a slew of difficulties, including increased administrative involvement, state-owned firm monopolies, a lack of competition, inefficient operations, and difficulty ensuring consumer rights [
10]. By using DR control, electricity users would decrease peak electricity consumption or shift some peak consumption to off-peak periods [
11]. DR management is becoming more and more important in the relationship between consumers and producers of electricity, which is the most essential element of the smart grid in comparison to traditional power systems. The demand-response approach has emerged as one of the most critical strategies for dealing with ever-increasing peak loads. Consumers are inclined to shift or reduce their electricity use through crucial peaks when participating in DR programs [
12]. As a result, power system economy and security are enhanced. Real-time DR and distributed algorithms have been extensively studied in recent decades [
13,
14].
Demand-response methods are an important tool for managing electricity demand in the smart grid. They allow utilities to respond to changes in demand and supply, while also providing customers with incentives to reduce their energy consumption. The Dutch auction is a type of demand-response method that has been gaining popularity in recent years. The Dutch auction is based on the principle of price discovery, where the price of power is determined by market forces. In this case, the price of electricity is determined by the amount of electricity demanded by customers. The utility sets a starting price for electricity and then gradually lowers it until enough customers have agreed to purchase at that price. This allows utilities to find an equilibrium between supply and demand, while also providing customers with incentives to reduce their energy consumption. The Dutch auction method is a fair scheduling method that has been gaining popularity in recent years due to its ability to provide equitable access to electricity resources, which ensures that all participants receive equal access to electricity resources regardless of their size or financial status. This allows smaller customers to benefit from lower prices and encourages competition among suppliers. Additionally, it helps reduce peak load by encouraging customers to shift their energy usage away from peak hours. The Dutch auction method also offers several advantages over other demand-response methods. It is simple and easy to implement, and it does not require complex algorithms or software. Furthermore, it provides an incentive for customers to reduce their energy consumption during peak hours, which can help reduce overall energy costs. Finally, it encourages competition among suppliers, which can lead to lower prices for consumers. Overall, the Dutch auction method is an effective way to manage electricity demand in smart grids while promoting fairness and competition among suppliers. It offers several advantages over other demand-response methods and has been gaining support from governments and utilities around the world for reducing peak loads and improving system reliability while providing equitable access to electricity resources for all customers.
The study of fair scheduling methods in demand response for smart grids using a Dutch auction approach is important because it provides a way to ensure that all participants in the energy market are treated fairly. This is especially important in a smart grid system, where the demand for energy can vary significantly from one moment to the next. By using a Dutch auction, the price of energy can be adjusted dynamically based on current demand, ensuring that all participants receive fair prices for their energy. Additionally, this method helps to reduce peak demand and encourages efficient use of energy resources. The importance of this approach lies in its ability to provide an equitable and efficient way to manage energy resources in a smart-grid system. By using a Dutch auction, all participants are able to receive fair prices for their energy while also helping to reduce peak demand and encourage efficient use of resources. This is beneficial not only for those participating in the auction but also for society as a whole, as it helps to ensure that energy resources are used responsibly and efficiently.
We made the following assumptions for a fair-scheduling demand response method for smart grids using the Dutch auction: (i) all consumers and producers must be registered with the system in order to participate in the Dutch auction; (ii) all consumers and producers must provide accurate information about their energy needs/availability; (iii) the auctioneer must have a transparent bidding process that is open to all participants; (iv) the auctioneer must ensure that all bids are treated fairly and equally, regardless of the identity of the bidder; (v) the auctioneer must ensure that all bids are valid and accepted before they are considered for the auction process; (vi) the auctioneer must ensure that all bids are kept confidential until the end of the auction process; (vii) the auctioneer must ensure that all bids are processed in a timely manner, so as not to disadvantage any participant in the auction process; (viii) the auctioneer must ensure that all bids are processed in accordance with the rules of the auction system, including any applicable laws or regulations governing such auctions.
The goal of this research was to investigate the feasibility of using a Dutch-auction-based fair-scheduling method for demand-response in smart grids. This method was used to optimize the scheduling of energy consumption and production to reduce peak demand and improve overall energy efficiency.
Through this paper, our main contributions are as follows: (i) we first present a generic formal model for the consumer as well as a provider agent model; (ii) we introduce the most common model related to DR for smart grids based on the control mechanism; (iii) we compare centralized and distributed control for DR control; (iv) we present the fair energy scheduling method; (v) we conduct a theoretical and experimental comparison between Vickrey and Dutch auctions based on the GridSim tool.
The content of this paper is as follows: the
Section 2 introduces the state of the art. The
Section 3 presents a generic formal model for the demand-response method. The
Section 4 discusses a comparison between between centralized and distributed control for demand response. The
Section 5 presents a fair energy scheduling method. The last section provides a theoretical and experimental comparison between Vickrey and Dutch auctions. Finally, we conclude and present future work.
2. State of the Art
Demand-response methods are essential for the efficient operation of smart grids. They allow for the management of electricity demand in order to reduce peak load and improve system reliability. The smart grid necessitates the development of efficient demand-response methods. To do so, DR deployment is critical. The DR is divided into many categories, and each category has its own benefits and drawbacks. We categorize the DR control into three fundamental groups [
15].
In the first class, the DR programs aim to minimize power consumption. This category is classified into two groups: time-based and incentive-based programs [
16]. In the first subgroup, which is a time-based program (known as a price-based program), customers are given time-varying pricing that is proposed by the power utility based on the energy cost in several slots of time [
17]. In the second subgroup, which is an incentive-based program, consumers must pay fixed or time-varying payments to decrease their electricity consumption during peaktime, but they are also subjected to certain limits or penalized for not contributing to the allocation [
7].
The second class contains task-scheduling and energy-management-based demand-response systems (known as energy scheduling DR methods). The fundamental aspect of task-scheduling DR is the possibility of choosing the required charge-activation time, which can be relocated at times of peak demand [
18]. DR strategies, focusing on energy management, achieve varying power usage during times of high demand by lowering the consumed power of specified loads [
19].
Finally, demand-response methods are divided into centralized and distributed categories based on the communication model. In the centralized category, decisions for load activation or load scheduling are managed by the energy utility based on the data sent by the consumers. In this category, each customer contributes to the solution on their method, without having to worry about the other group members’ participation. For example, a centralized solution is used to determine scheduling decisions [
20] and control appliances [
21], buildings [
2], PHEV charging stations [
22], and the application of DR in microgrids [
19]. In the distributed approach, the key contribution of the power utility is the delivery of prices that depend on the total system load; customers may work together to reduce the total load [
23]. By inhibiting central authority from gathering data for decision-making, this decentralized control ensures scalability as well as consumer privacy. To ensure effective control mechanisms in DR, the distributed nature of the Internet has encouraged several researchers to develop effective control techniques for smart-grid systems. There are papers in which the authors present a distributed DR strategy that is based on the tariff of congestion in the control of Internet traffic [
24], a distributed DR approach that was used with a voltage control strategy [
25], a frequency-sensitive demand-response method [
26], and distributed algorithms to coordinate and monitor demand response and distributed power resources [
27].
There have been several different energy scheduling systems considered in the past [
28,
29,
30,
31]. This study is based on the results presented in [
32]. The aim of this study was to develop a completely fair energy-scheduling mechanism for a smart, distributed grid system. The proposed mechanism was able to provide fairness in terms of energy scheduling and also improved the overall efficiency of the system. Our fair energy-scheduling method is executed in two phases. During the first phase, the energy is equally distributed among all consumers. During the second phase, the Vickrey auction model is used to schedule the remaining energy among those consumers whose energy requirements were not met during the first phase. All consumers are handled equally, making it a non-priority-based famine-free method.
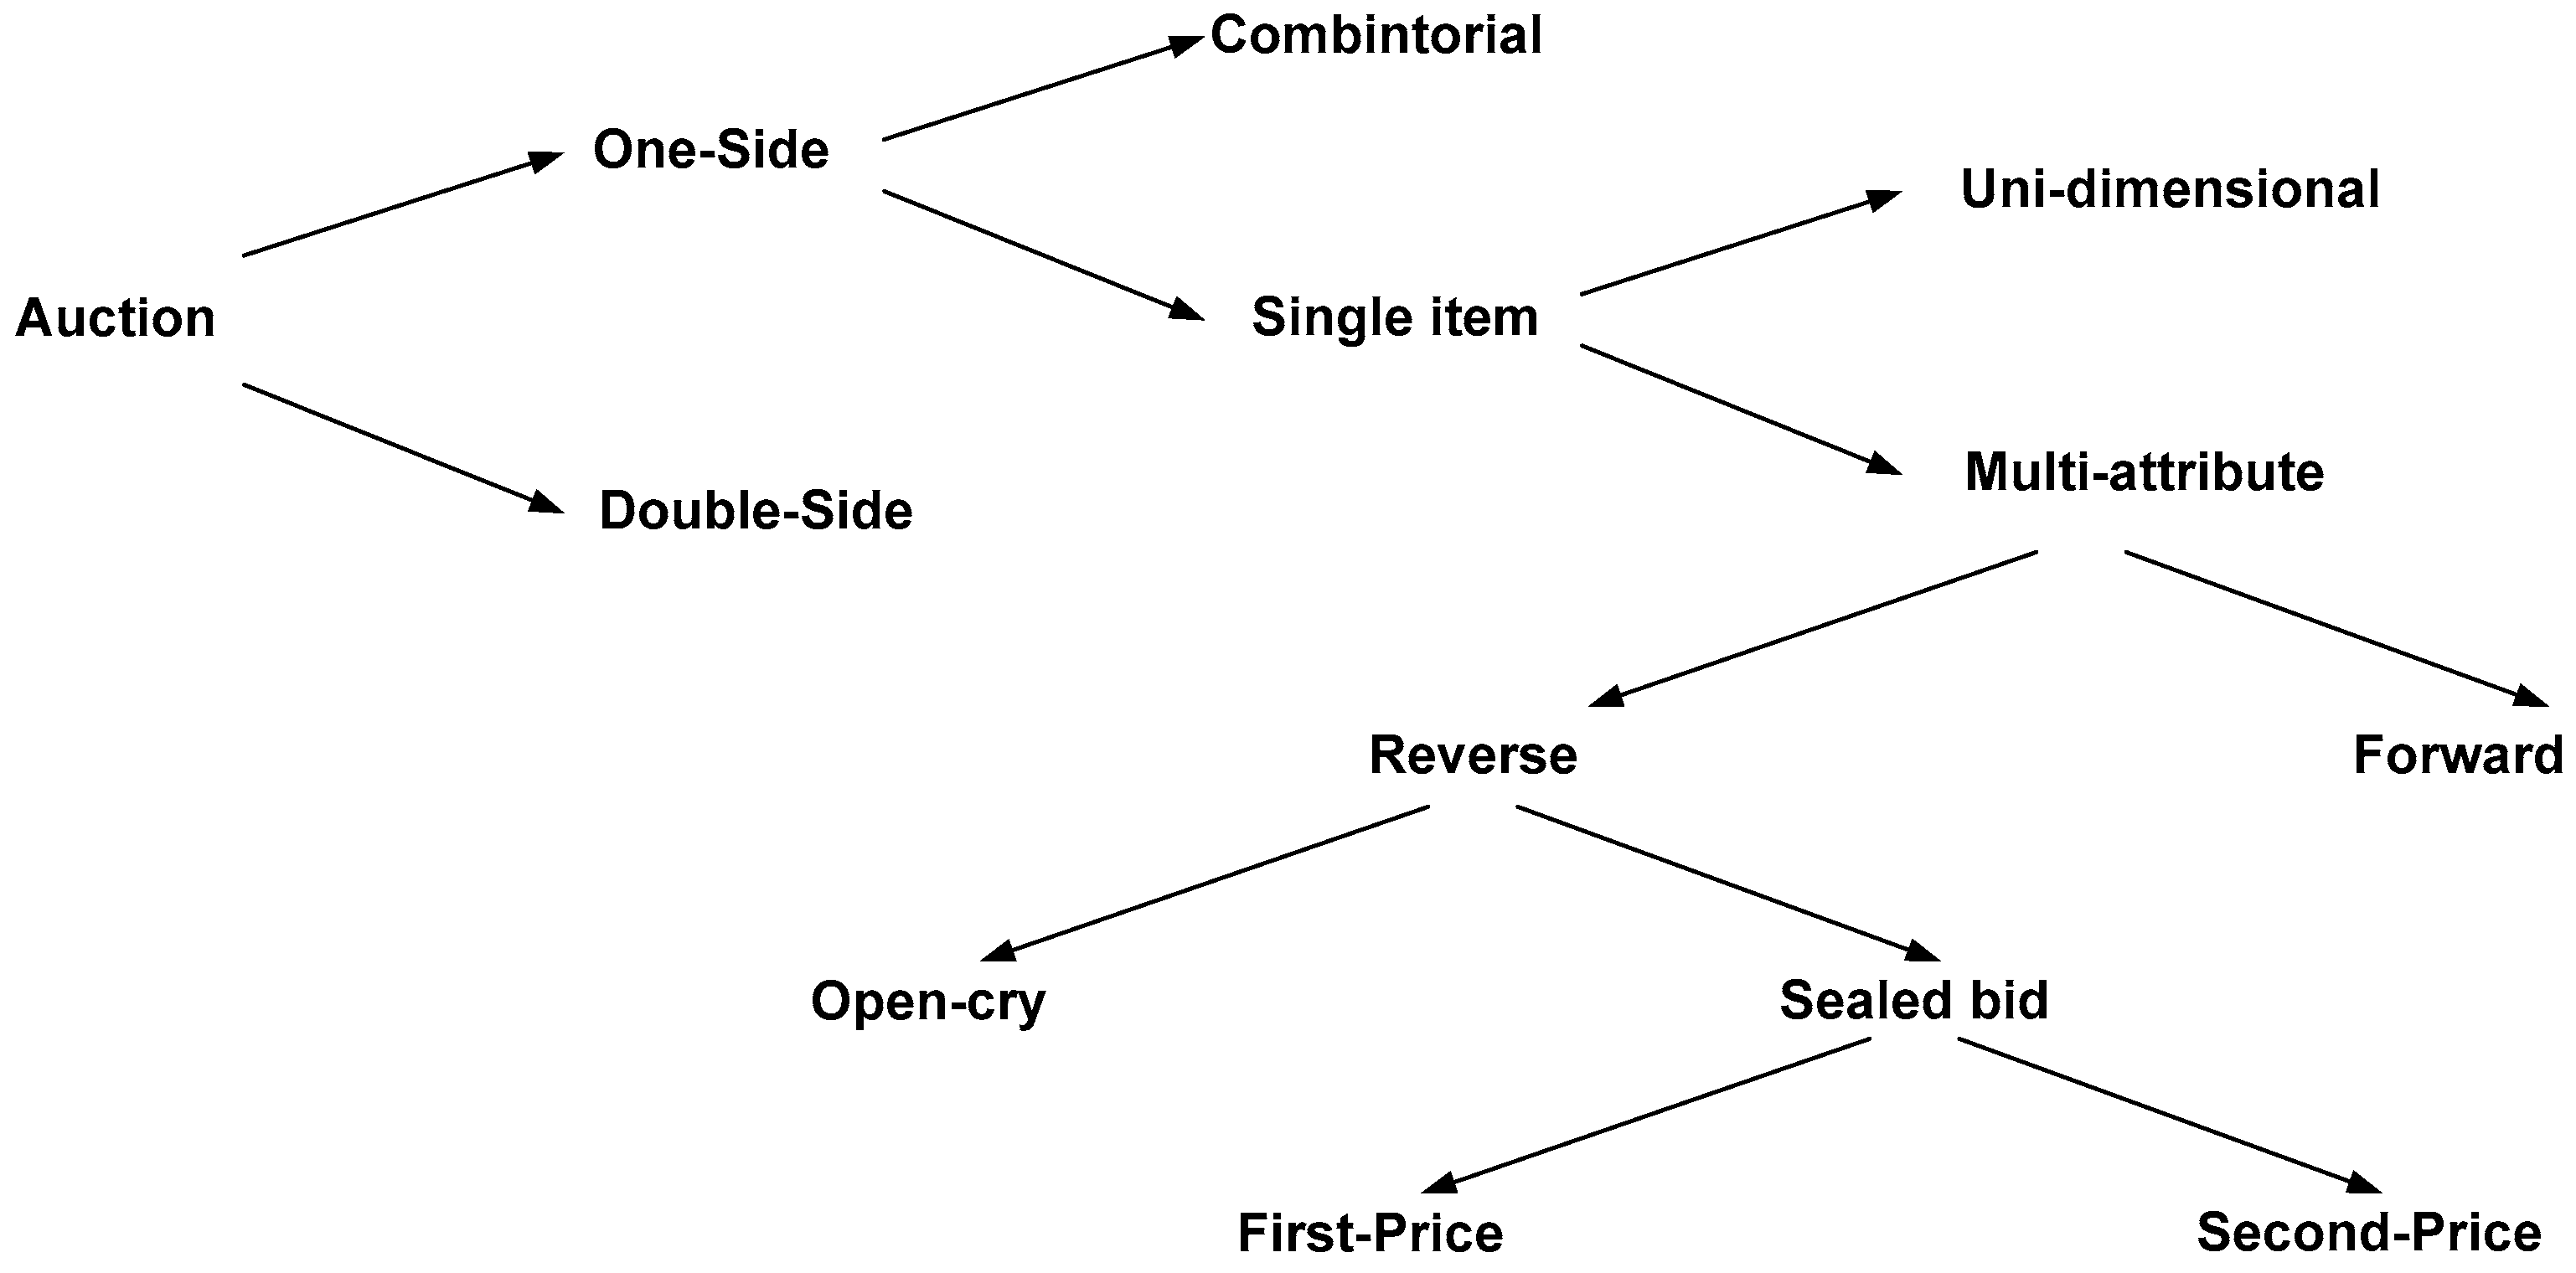
There is a variety of auction types that can be categorized based on some factors [
33]. First, a double-sided auction occurs when a person can act as both auctioneer and bidder at the same moment. In a one-sided auction, on the other hand, a participant can only function as the auctioneer or bidder. Second, whether an auction is a single-item or a multi-item (combinatorial) auction is determined by the number of items or services being sold. The nature of the auction differs depending on whether the objects being auctioned are divisible (meaning that they may be shared between two or more people) or indivisible (meaning that they can not be split).
Third, whether an auction is single-dimension (also known as uni-attribute) or multi-attribute is determined by the number of attributes in the bid. Bidders supply information about other qualities in addition to the bid amount in single-dimension auctions, but in multi-attribute auctions, bidders provide information about other attributes in addition to the bid amount (e.g., time or quality). Fourth, an auction is a first-price auction if the winner pays the exact amount it provided in its bid; otherwise, it is a second-price auction if the price is conditioned by the non-winning bids. Finally, an auction can be classed as forward or reverse depending on the function of the competitors.
As previously stated, in forward auctions, the auctioneer sells products or services to bids, but in reverse auctions, the auctioneer is the buyer, and bidders compete to sell their services to the auctioneer.
Furthermore, auctions can be classified as open-cry or sealed-bid. Participants in open-cry auctions compete openly against one another, making their bids public and expressing their preferences to the other auctioneers. Agent privacy is traded for the sake of transparency in these procedures. Iterative auctions, in which participants can adjust their bids openly in response to the other participants’ bids, are a good illustration of this type of auction. If bidders increase their offers during the sale, it is an English auction; otherwise, bidders in Dutch auctions decrease their offers downward. In contrast, in sealed-bid auctions, the agents’ privacy is protected because all bidders make sealed bids to the auctioneer at the same time. As a result, no one knows how much the other bidders have bid (as shown in
Figure 1).
3. Generic Formal Model for Demand Response
In this section, we present a generic formal model for demand response where we consider that the smart grid is constituted by several consumer agents as well as a provider agent. Consumer Agents (CAi) are considered independent users who ensure their well-being. To enhance their benefits and satisfaction, each user needs a precise quantity of electricity. The purpose of a smart grid is to provide the requested power to all consumer agents and maintain a balance between the production and consumption of power (load).
3.1. Consumer Agent Model
The Consumer Agent (CAi) is responsible for monitoring energy usage, responding to price signals, and making decisions about when to purchase or reduce energy consumption. The consumer agent can also be used to provide feedback on the performance of the smart grid system. Each consumer agent has some constraints, such as its minimum and maximum requested power, its present running state, and the available production. The consumer agent cannot work well in any circumstance involving a power amount out of its required bounds, and . Here, and indicate the minimum and maximum power that is required by the consumer agent.
Therefore, the required consumed power
for the consumer agent CA
i at the time slot
t has to satisfy
where
and
represent the power limits for the consumer agent CA
i at time slot
t, under the following constraint:
where
and
represent the ascent and descent limitations of the ramp, respectively, by the consumer agent constraints. Therefore, it is possible to represent these limits on a consumer agent’s power usage
in the following way:
The overall minimum and maximum required power limits of all consumer agents at time slot
t can be calculated as follows:
where
N represents the number of consumer agents.
Consequently, the total required power inside the smart grid is expressed as follows:
The utility function for the Consumer Agent (CAi) is defined such that, where is the consumer agent’s power consumption level and is a parameter that may vary throughout agents and at different times of the day. In more formal terms, the utility function for each consumer agent defines the consumer agent’s level of satisfaction as a function of its power consumption. In most cases, a quadratic utility function is used to represent the profit obtained by Consumer Agent (CAi) when he consumes the power.
A consumer agent
i must pay a price
of dollars per hour for consuming
kW electricity for a particular number of hours at
P dollars per kWh. As a result, each consumer agent
i’s welfare
can be estimated as follows:
Each consumer agent i tries to regulate its power consumption to maximize its private comfort for each announced price value P.
3.2. Provider Agent Model
The provider agent is responsible for monitoring energy production, responding to demand signals, and making decisions about when to increase or decrease energy production. The provider agent is expected to satisfy the requests of consumer users and coordinate between different agents to ensure the entirety of requested electricity and preserve an equilibrium between the production and consumption of power (according to the consumer agents’ requests and constraints).
Lt denotes the generated capacity in each time slot t ∈ T, which may differ between time slots. The maximum generated capacity in each time slot t ∈ T is likewise defined.
We consider a cost function
Ct(
Lt), which represents the cost of the provider agent delivering Lt units of energy in each time slot
t ∈
T. The power cost function is, in general, a monotonically increasing function of the power amount. For example, it is possible to use a quadratic cost function:
where
at > 0 and
bt,
ct ≥ 0 are pre-determined parameters.
4. Comparison between Centralized and Distributed Control for Demand Response
In this section, we present centralized and distributed control for demand response in smart grids. Then, we compare the two approaches based on advantages and disadvantages of each method.
4.1. Centralized Control for Demand Response
Centralized control is a method of demand response that uses a centralized system to manage energy usage. This system is typically operated by a utility or other energy provider, and it allows the provider to monitor and adjust energy usage to meet demand. The system can be used to reduce peak demand, reduce overall energy consumption, or both. It can also be used to provide incentives for customers to reduce their energy use during peak times.
In a centralized solution, the DR procedure is controlled by a central controller, who collects request data from customers and then decides for the demand schedule.
The provider agent updates its energy supply strategies in each step according to the consumer agents’ electricity consumption approaches, while the consumer agent
i regulates its power consumption in a function of real-time costs. We present the common model for centralized control in Algorithm 1 [
28].
| Algorithm 1: Executed by the Provider Agent. |
1: Initialization.
2: For each time t = 1, t <= 24; t++ do:
3: Collect the initial requested power (, , ) from every consumer agent i ∈ N.
4: Update the total load accordingly.
5: Compute the new price,
6: Broadcast the new price, , to all the consumer agents.
7: Receive the updated requested power (, ) from each consumer agent i ∈ N.
8: End for.
9: End algorithm. |
Running Example
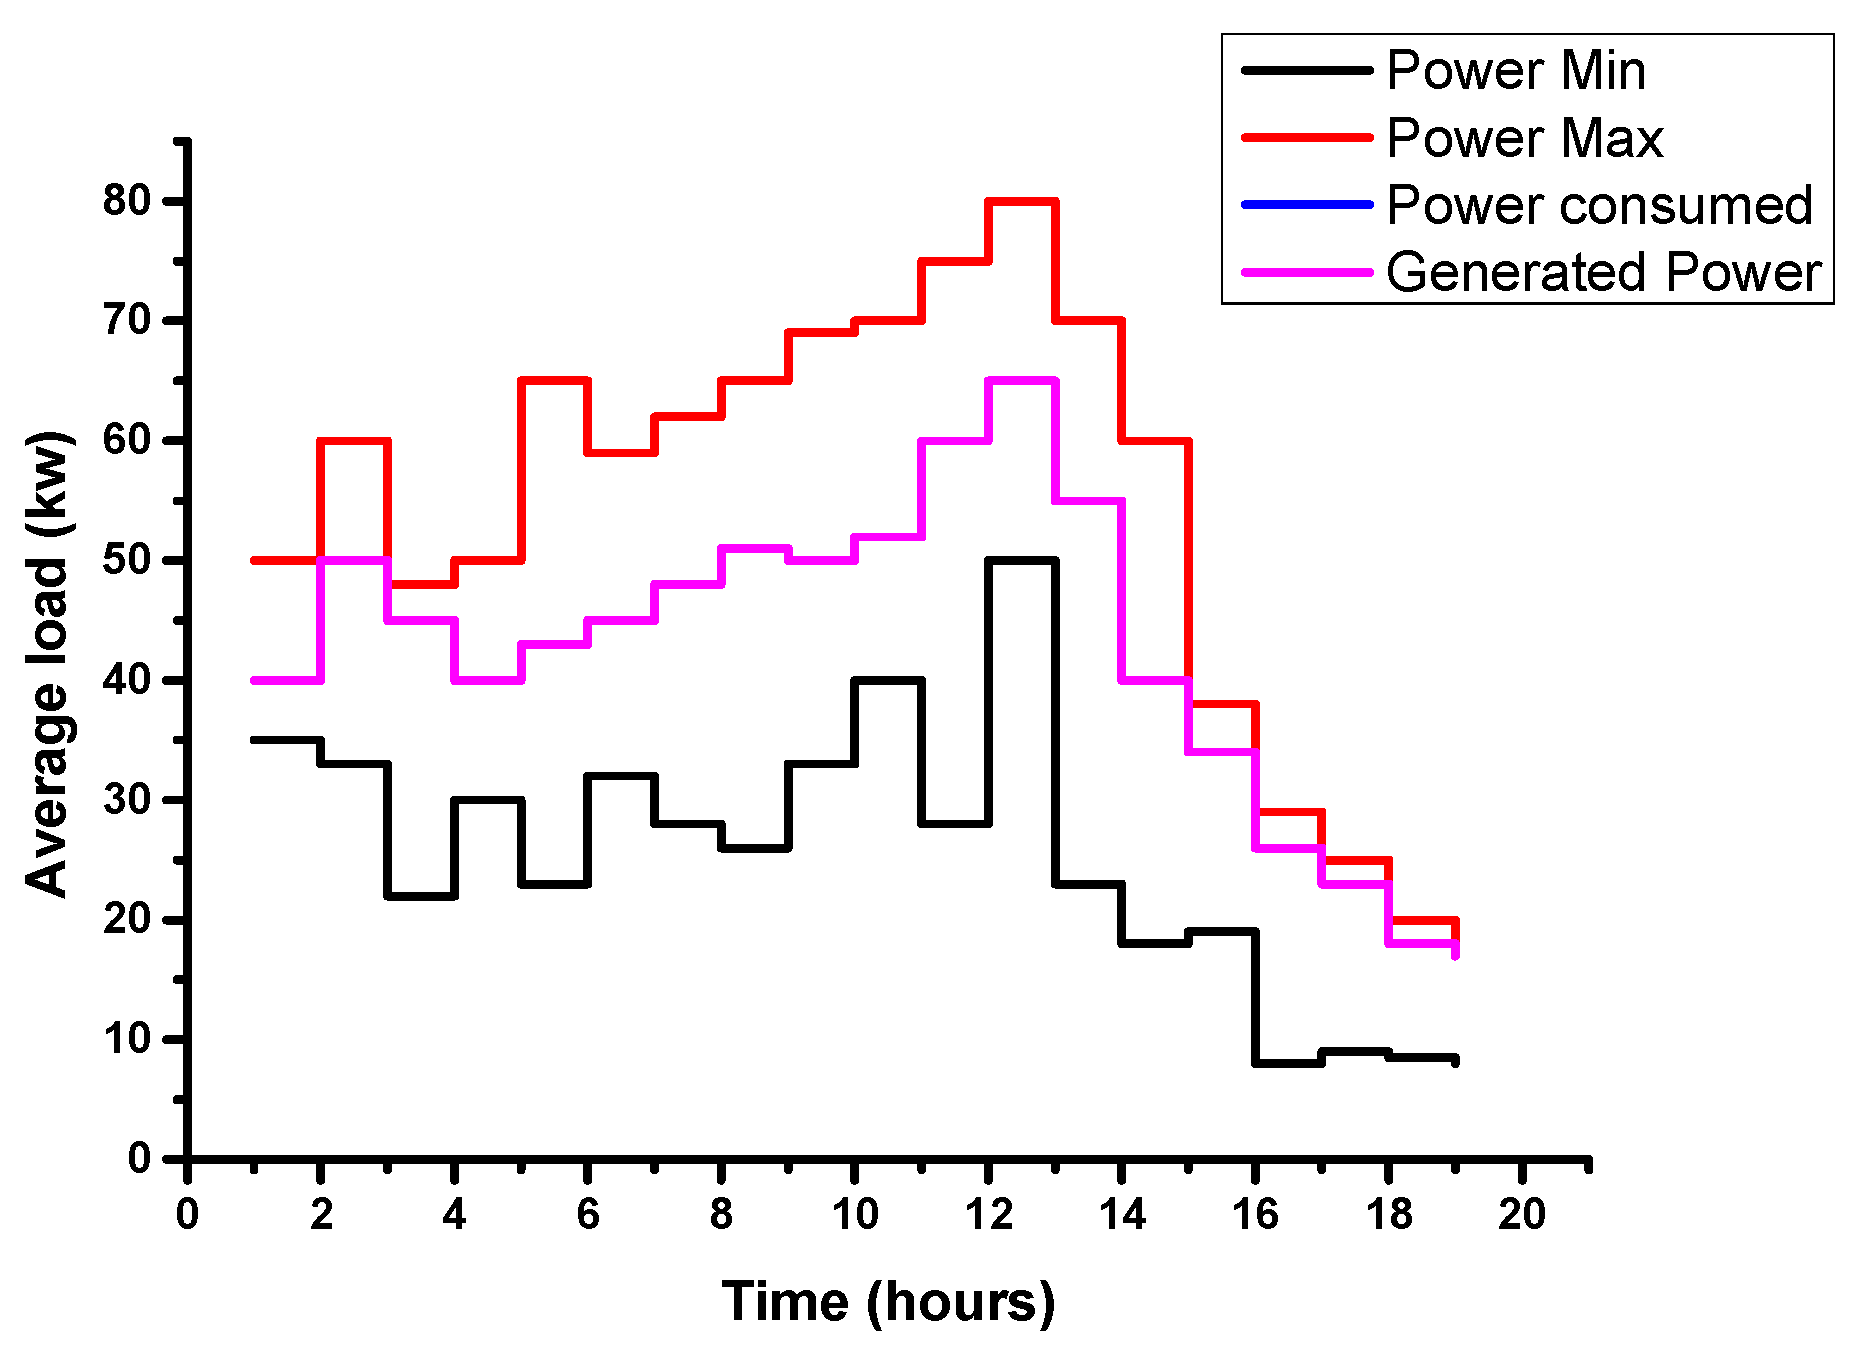
In
Figure 2, we provide simulation data and evaluate the algorithm’s performance. In our simulation model, the consumers’ number is assumed to be 3. To cover the full-time cycle, the 24 hours of the day are represented by 24 time slots. In each time slot, the minimum and maximum required power of all users vary, and the minimum generating capacity is guaranteed to meet the minimum power requirements.
Figure 2 shows the simulation results of the power consumed by each one of the three consumers based on the demand-response algorithm.
Figure 3 depicts the simulation results for the whole power allocated to all the consumers. As expected, both curves relative to the overall energy consumption of the users and the targeted production capacity of the power supplier coincide because of the live interaction between the consumers and the energy provider. The overall power consumption and generating capacity are limited by all users’ minimum and maximum overall energy needs within each time interval.
4.2. Distributed Control for Demand Response
Distributed control is a method of demand response that uses distributed systems (such as smart meters) to manage energy usage. This system allows customers or utilities to monitor and adjust energy usage on an individual basis, rather than relying on a centralized system. This allows customers or utilities more flexibility in managing their own energy consumption and provides incentives for customers who reduce their energy use during peak times.
In distributed DR, the request for energy is not centrally collected, and consumers have direct access to grid state indicators. Using this data, users can respond based on the system’s state, especially in crucial situations.
At the round
t (time) of information transmission between agents, let be
the amount of resource sought by the agent
i [
29,
30].
Let
be the entire quantity of resources that the aggregator provides.
,
i = 1, 2, …,
n exist and satisfy
The goal is to create a distributed iterative algorithm in which each agent i modifies its resource request at step k based on (i) its current need and (ii) the present requests of nearby agents that communicate with i with the restriction to not exceed the limit.
The graph depicting the data exchange is considered to be tightly connected in the algorithm described in this work, and each agent
i calculates its resource request
as a function of some
that each agent
i acquires recursively as a linear combination of its previous
and the previous
of its neighbors; specifically,
where the
are a set of time-varying weights defined as following:
, ∀
i; where
> 0 if
j ∈
Ni, and
= 0 otherwise.
In this study, we propose an approach for resolving the problem of distributed resource allocation. The aggregator (which is aware of the amount of resource that needs to be cooperatively delivered by the agents) is supposed to be able to communicate with K ≥ 1 agents, and first sends a command requiring /K units of resource to each of them.
Then, if the agent i is a neighbor of the aggregator, is set to xi = /K, and xj = 0 otherwise.
Additionally, each agent sets .
For the equation, the algorithm utilizes constant weights. Each agent
i sets its weights to be
pii = 1/(1 +
) and
pij = 1/(1 +
) for all
j that have agent
i as a neighbor, i.e., all
j such that
i ∈
Nj. Therefore, each agent’s value is updated as needed (Algorithm 2).
where
is the maximum number of agents to which
j can send information (the out-degree of agent
j).
| Algorithm 2. Executed by Consumer Agent i |
1. At each round τ of the algorithm:
2. Send a copy of local value to all neighboring consumer agents j ().
3. Wait for the local values of all neighboring consumer agents j ().
4. Update new values using Equation (10).
5. Calculate new value of from via Equation (9). |
Let
’, ∀
i, be the result of iteration (4) with initial conditions
and
. Then, a solution to the distributed demand response problem can be approximately resolved as
, where
It is clear that is a limited value ∀t ≥ 0, since > 0 for all k ≥ 0.
Running Example
Figure 4 presents the neighboring agents in the graph. Let us consider that the aggregator is dealing with nodes 1, 2, and 3 only. We also suppose the total capacity
= 3 and
,
.
Then, is set to xi = /K if the agent i is considered a neighbor of the aggregator and xj = 0 otherwise.
Furthermore, each agent sets
(see the results in
Table 1).
Based on Equation (12), we can calculate
as it is illustrated in
Table 2.
4.3. Comparison between Centralized and Distributed Control
The demand-response control in smart grids can be divided into two categories: centralized and distributed control. We present two well-known solutions for centralized and distributed control. In DR based on centralized solutions, all the customer agents interact with the power utility. The centralized architecture is based on centric communication and is suitable for a small network due to its simplicity. In centralized control, global information is needed to make decisions for the whole system; that is, all agents are required to exchange all data with central control. Therefore, centralized control is considered simple to implement and easy to maintain in the case of single-point failure. However, it suffers from different drawbacks such as computational burden, scaling difficult, and a high needed level of connectivity. From a reliability perspective, a single point of failure leads to an unstable system, which is one of the main challenges in a centralized solution. From a scalability perspective, the maximum number of customers is restricted by the power utility’s capacity. Additionally, when demand response is implemented as an iterative process, communication latency between the power utility and customers might be significant. When the power utility is secured by firewalls or intrusion detection systems, the latency increases even further. From the standpoint of system security, because customers are typically situated outside the power utility’s physical security perimeter, cyber attackers may be able to exploit them when communication takes place via IP-enabled networks. All customers in a DR-based centralized solution must know the IP addresses of the specified power-utility side. As a result, from a security standpoint, using the IP address for demand response exposes the system to cyberattacks like distributed denial of service (DDoS) from hacked customers. Coordination of distributed customers in a centralized solution is difficult due to the high communication load and computational complexity. The difficulty is in determining how to ensure privacy and algorithm convergence. Moreover, the centralized approach needs private consumer details, which is difficult to ensure in the case of information asymmetry.
Using distributed algorithms has the following advantages: they are easy to extend (high extensibility), have low calculation cost (parallel computing), have no single point of failure, are convenient for large-scale systems, are unaffected by system topology changes, and are convenient for plugin features in smart-grid clients. Furthermore, anonymity is maintained (a small amount of data is requested from customers). Under distributed approaches, a large-scale model can be divided into several sub-problems. These more tractable sub-problems are then treated in parallel and independently, resulting in a significant increase in overall efficiency. Furthermore, the distributed approaches are scalable, meaning that the number of iterations does not increase as the number of consumers grows. The distributed architecture ensures a secure, scalable, efficient, and reliable algorithm. However, the distributed control suffers from the following drawbacks: it needs synchronization, it can be tedious for local customers to achieve consensus, the convergence rates may be influenced by the topology of the communication system, and it requires a bidirectional communications infrastructure. The distributed approach may suffer from islanding, which occurs if a microgrid with local loads or distributed generation/storage becomes isolated from the main power grid.
As a result, we recommend using a distributed solution for DR in smart grids for the following reasons: (i) the centralized solution is not appropriate for smart grids because it is highly unstable due to having a single point of failure and requiring a high level of connectivity; (ii) the distributed solution reduces communication burden and computational complexity, ensures security (anonymity), and is more suitable for smart grids, which are distributed by nature.
5. Fair Energy-Scheduling Method
This study is based on the results presented in [
32]. An outline of our proposed entirely fair energy-scheduling method is provided in this section. The scheduling mechanism described in this paper is intended to reduce overall energy buying costs for consumer agents while also increasing profit for provider agents. The two steps of our completely fair energy-scheduling method are described in the sections that follow.
5.1. Phase I: Proportional Division-Based Energy Scheduling
The auctioneer agent receives information on the amount of excess energy (Es(i)) and the deficit energy (Ereq(i)) from the provider and consumer agents, respectively, in the first phase.
For the multi-agent system, the auctioneer agent calculates the total extra energy available and total required energy load as follows:
where
Gi represents the produced energy by the agent
i.
Because the suggested energy-scheduling methodology is non-priority based, it performs fair energy-scheduling among all consumer agents during Phase I, utilizing the proportionate division method. As a result, the auctioneer agent divides
Etotal into
N equal portions, as seen below:
The auctioneer agent attempts to disperse the Eeq among all consumer agents.
The energy requirements of the consumer agent can be less than or greater than Eeq. If the energy requirement of the consumer agent (Ereq(i)) is less than Eeq, the total energy purchased by the consumer agent during phase I is (Eb(i)).
Because the consumer agent’s energy requirement is met during phase I, its remaining energy requirement is zero, i.e.,
However, if the consumer agent’s demand exceeds
Eeq, the consumer will receive energy equal to
Eeq in phase I; i.e., if (
Ereq(i) > Eeq),
Because the consumer agent’s energy requirements were not met during phase I’s internal trade, the remaining energy requirements are computed as
As a result, the first phase focuses on lowering the cost of energy for each consumer agent, as all consumers receive at least some of their entire energy requirements through internal trading and do not need to acquire all their energy from the utility grid at a higher cost.
After executing energy scheduling during Phase I, the
Etotal is the left-over energy with the auctioneer agent. The
Etotal is calculated as follows:
Running Example
From
Table 3, there are some agents which play the role of provider or consumer depending on the difference between the electricity generated, as well as its requirement. If the difference is positive (resp. negative), it is considered as a provider (resp. consumer).
Using Equation (14), Ereq = 40 + 235 + 410 + 232 + 500 = 1417 KWh.
Using Equation (15), Etotal = 395 + 685 + 170 = 1250 KWh.
Using Equation (16), Eeq = 1250/5 = 250 KWh.
Therefore, the total energy becomes Etotal = 1250 − (40 + 235 + 250 + 232 + 250) = 243 KWh.
Table 4 presents the requested energy of the five consumers along with the energy scheduling done during Phase I of Algorithm 3. The consumers whose energy requirement is greater than 250 kWh; that is, the consumers with IDs 5 and 8 receive 250 kWh in the first phase. The other consumers (IDs 1, 4, and 7) will receive the electricity that they require. Therefore, the remaining energy requirement of these three agents becomes 0 after Phase I, and these three consumers will not participate in Phase II.
The other consumers (IDs 5 and 8) will participate in Phase II auctioning for buying the remaining energy requirement.
5.2. Phase II: Auctioning
The energy scheduling continues to Phase II only if Erem-req(i) > 0; that is, some consumer agents have a higher energy requirement than the energy Eeq that was scheduled during Phase I, and also if Etotal > 0. If Etotal = 0, the consumer agents will have to buy the rest of their energy from the utility grid.
If the following conditions are met, the consumer agent will engage in energy scheduling during Phase II:
(i) Ereq(i) > Eeq
(ii) Etotal > 0
During Phase II, the auctioneer agent conducts an auction-based energy scheduling procedure in which all purchasers whose energy requirements were not met (
Erem-req(i) > 0) during Phase I participate in the auction. The authors in [
32] proposed a Vickrey auction approach; in our work, we propose a Dutch auction approach. The following section demonstrates a utility of our choice.
| Algorithm 3.Completely Fair Energy-Scheduling |
For all 0 < h ≤ NbHours_Day do
Etotal = 0
Ereq = 0
For all 0 < i ≤ NbTotal do
Read (Li, Gi)
If (Gi > Li)
ListProducer.Add(i)
Etotal = Etotal + (Gi − Li)
Else
ListConsumer.Add(i)
Ereq = Ereq + (Li − Gi)
End if
End for
NbConsumers = ListConsumer.length()
NbProducers = ListProducer.length()
Eeq = Etotal/NbConsumers
Total-Cost(i) = 0,
For all 0 < i ≤ NbConsumers do
If Ereq(i) < Eeq then
Eb(i) = Ereq(i)
Erem(i) = 0
Else
Eb(i) = Eeq
Erem(i) = Ereq(i) − Eeq
End if
Total_Cost(i) = Eb(i) * t
Etotal = Etotal − Eb(i)
End for
While Etotal > 0 do
Switch auctionKind do
Case 1: VickreyAuction VA = new VickreyAuction
Case 2: DutchAuction DA = new DutchAuction
End switch
End while
End for |
6. Theoretical and Experimental Comparison between Vickrey and Dutch Auctions
The Vickrey auction and the Dutch auction are two different types of auctions that are used in demand-response control to sell energy. The Vickrey auction is a sealed-bid auction in which bidders submit bids without knowing the bids of other participants. The highest bidder wins the item and pays the second-highest bid price. The Dutch auction is an open-outcry auction in which the price of an item is lowered until a bidder accepts it.
In this section, we present the simulation architecture. After that, we compare Vickrey and Dutch auctions theoretically as well as experimentally to show their advantages and disadvantages.
6.1. Simulation Architecture
GridSim is a Java-based open-source software platform that includes capabilities for application composition, resource discovery information services, and interfaces for assigning applications to resources. GridSim can also simulate heterogeneous computational resources in a variety of scenarios [
34]. New enhancements to GridSim are added to support advance reservation (AR), differential levels of network Quality of Service (QoS), and data grids by using these existing functions. GridSim is now a full tool for simulating computational and/or data grids due to these extensions. The following are some of the GridSim capabilities made possible by the new extensions:
Simulation of various resource features as well as their failure properties.
Simulation of workload traces from genuine supercomputers.
Resource allocation method based on reservations.
Auction framework with a variety of auction varieties, including English, Dutch, double, and sealed-bid first-price auctions.
Division of incoming jobs into two categories: space-shared and time-shared.
Scheduling of jobs that are computed and/or data-intensive.
Easy-to-understand APIs for building various resource allocation methods.
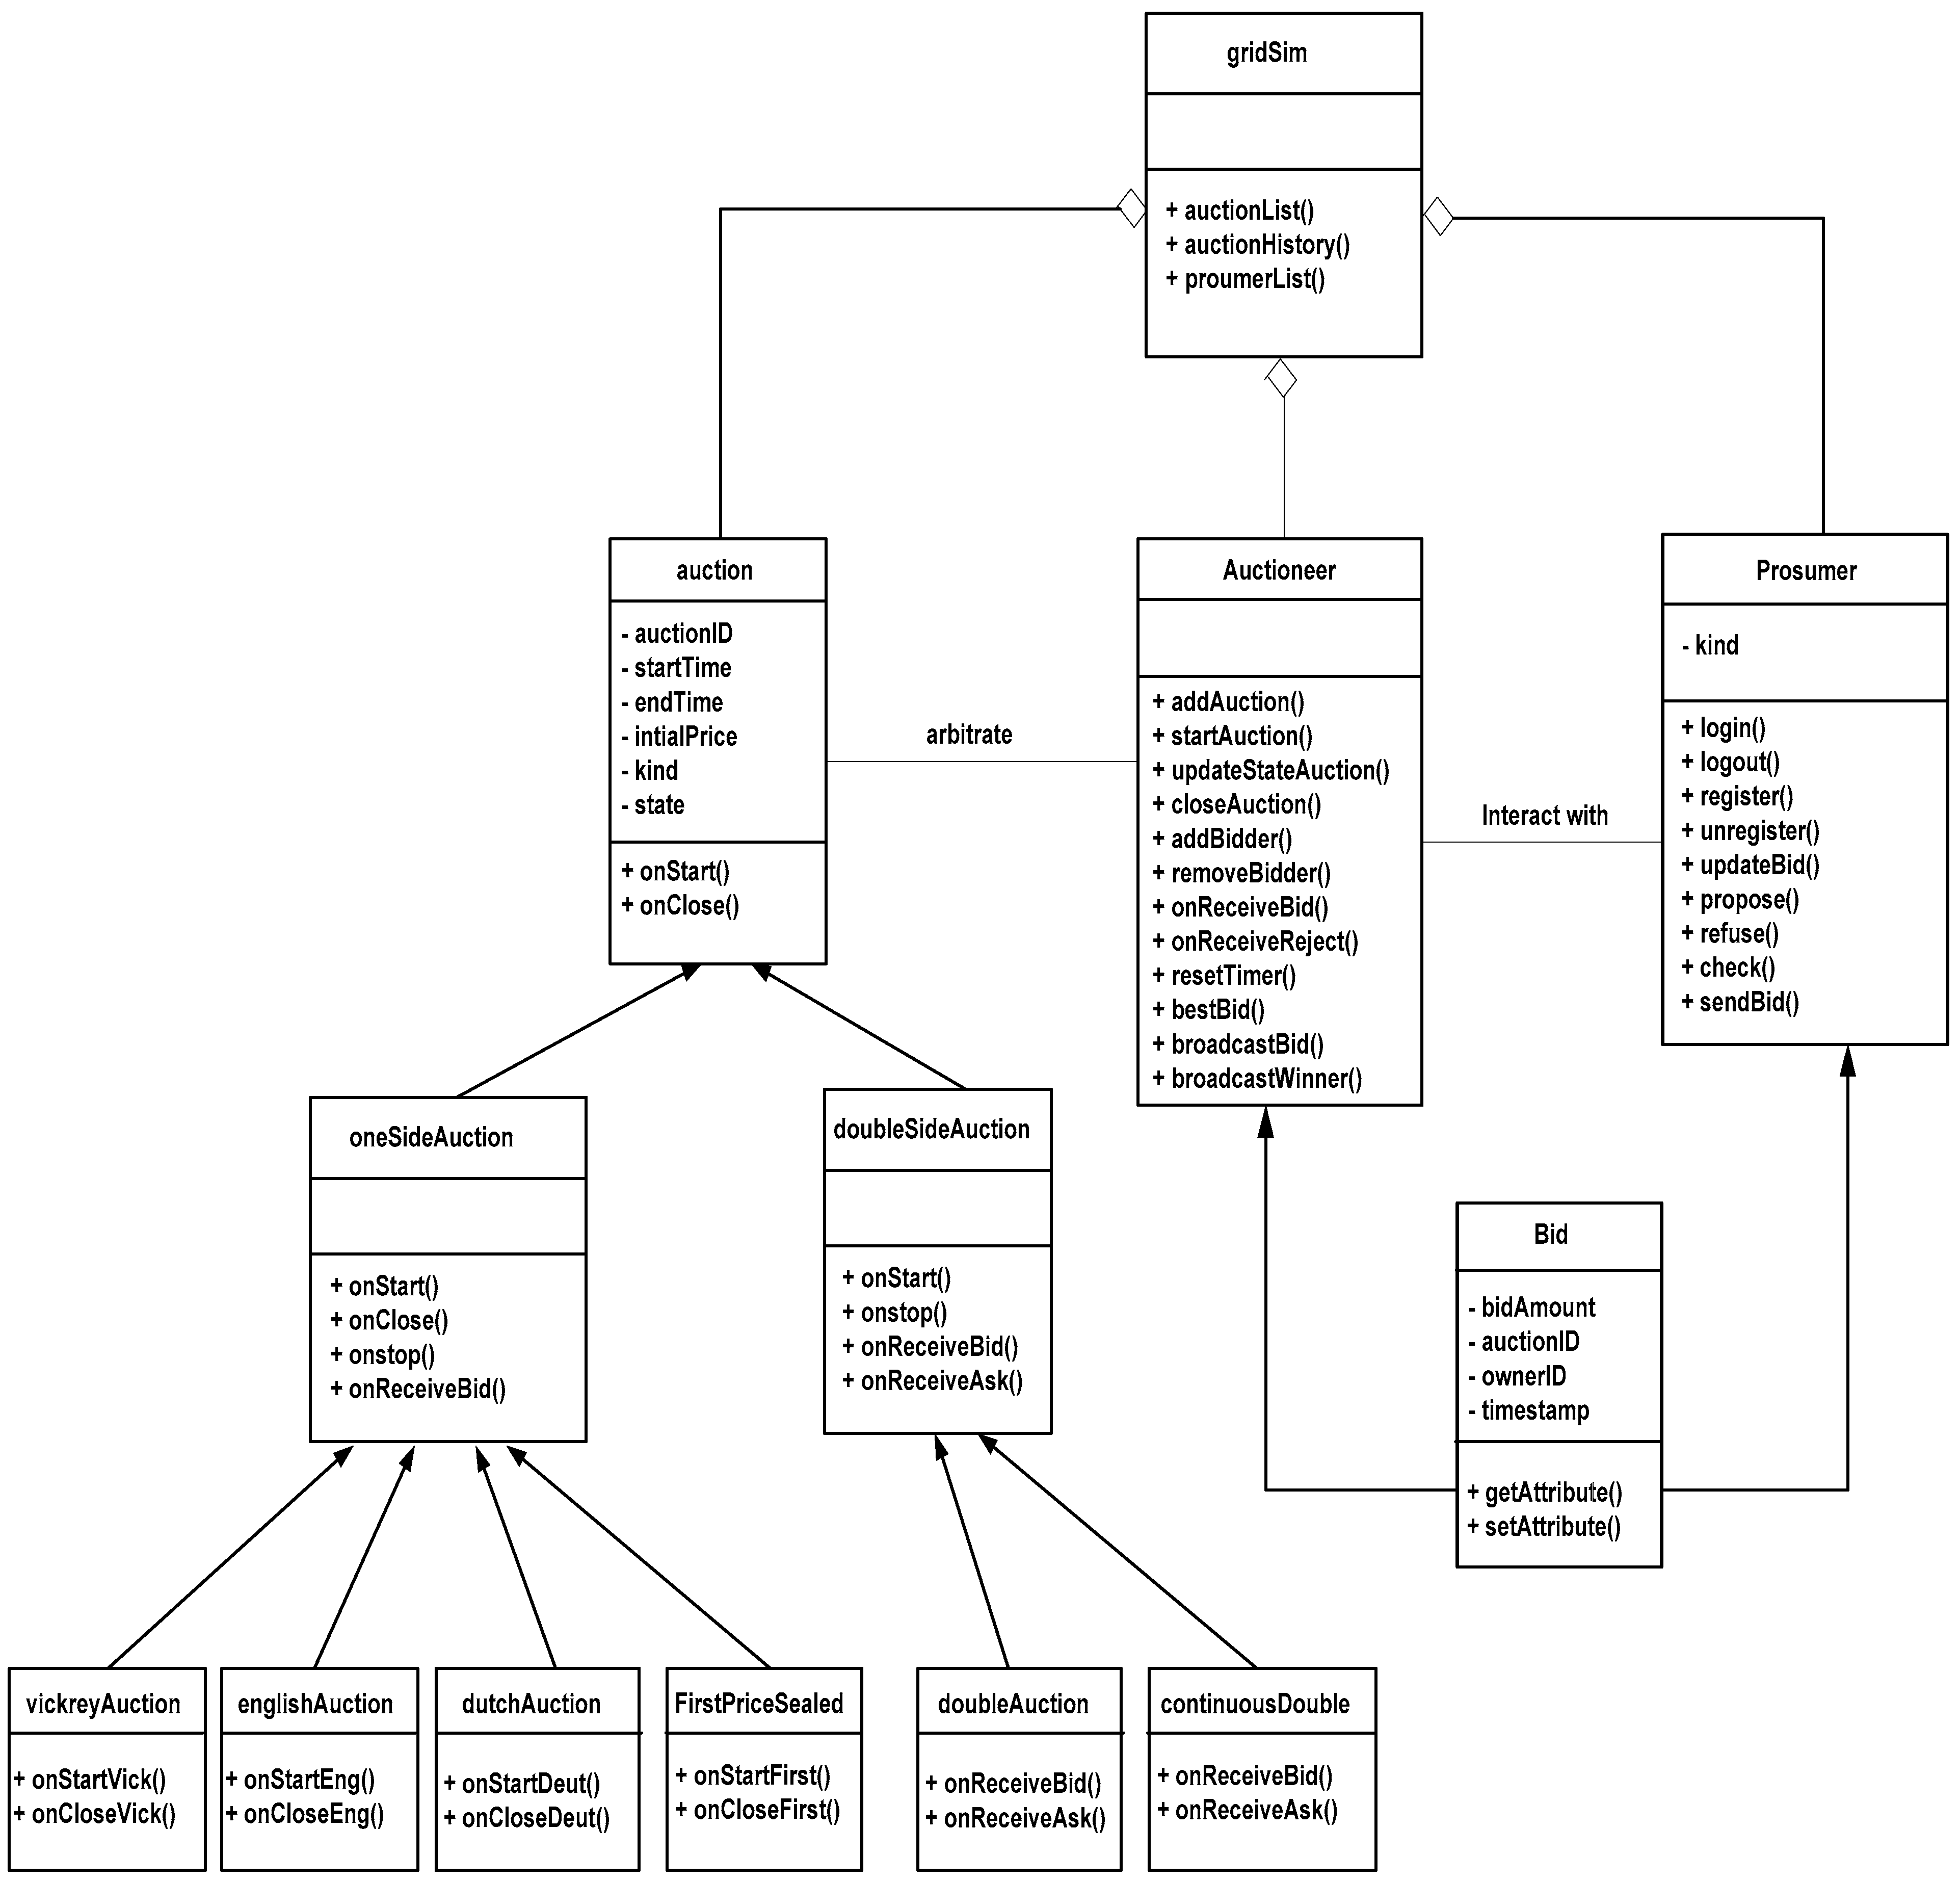
The main classes that compose the auction framework are as follows (
Figure 5):
- ○
The class Auctioneer: This class extends the GridSim entity and provides the auctioneer’s basic behavior. An auctioneer may participate in several auctions. The auctioneer issues a request for proposals, accepts bids, keeps track of the auctions, and eliminates them once they have been cleared. The class Auction refers to a set of characteristics that are common to all auctions.
- ○
The class OneSideAuction: Unlike double auctions, this class extends Auction and contains methods for auctions that take only bids. Extending this class and implementing the onStart(), onClose(), onStop(), onReceiveBid(), and onReceiveRejectCallForBid() methods allow users to create different auctions (). These methods must be implemented to specify the auction’s behavior when it starts a round, closes a round, finishes the auction, receives a bid, and so on. The class OneSideAuction is considered as a generic class for which we can define more specific classes, such as VickreyAuction, englishAuction, dutchAuction, FirstPriceAuction (these classes have to define the begining and the end of each auction).
- ▪
English auction: The auctioneer begins at a reserve price. Every bidder is free to increase their offer. The auction concludes when no one wants to increase their bid, and the item goes to the highest bidder for the price of that bid.
- ▪
First-price sealed-bid: Each bidder makes a single, private bid without knowing what the other bidders propose. The item is awarded to the highest bidder at that bid. Only one round of bidding is conducted.
- ▪
Dutch: The auctioneer continuously reduces the price until a bidder purchases the item at the present price. A Dutch auction is a type of auction in which the price starts high and is gradually lowered until a bidder accepts the current price.
- ▪
Vickrey (second-price sealed bid): Each bidder makes one offer while remaining anonymous to the other bidders. A Vickrey auction is a type of sealed-bid auction in which the highest bidder wins the item but pays the price of the second-highest bid.
- ○
DoubleSideAuction: This class defines the fundamentals of a double auction. A double auction accepts and attempts to match asks and bids. This class’s extensions must implement the following methods: onStart(), onStop(), onReceiveAsk(), and onReceiveBid(). The class DoubleSideAuction is considered as a generic class where we can define more specific classes such as doubleAuction and continuousAuction. These classes implement how to receive a bid or an ask message; for example, the Responder class’s method onReceiveBid() is called when receiving a bid message.
- ○
Bid: The Bid class offers the basic capability for auctioneers and bidders to exchange bids. This class has specializations to call for proposals, bids, reject proposal messages, and so on in the framework.
- ○
AuctionObserver: A bidder utilizes an auction observer to engage in auctions. The bidder may extend the GridSim class and send auction-related messages to the observer, who then treats the message and returns the relevant message to the auctioneer. An observer has a responder who is in charge of putting the bidder’s side of the auction into action.
6.2. Theoretical Comparison between Vickrey and Dutch Auctions
We summarize the comparison between Vickrey and Dutch auctions in
Table 5. This comparison includes the number of messages sent, by whom the price was determined, bidder collusion, vulnerability to a lying auctioneer, and undesirable private information revelation, based on [
35].
The Dutch auction has a relatively high communication cost in comparison with the Vickrey auction. This is because the auctioneer uses an outcry communication strategy that is necessary to broadcast B decreasing prices to all engaged bidders Cn, which could result in many messages. Each Deutch auction requires a total of messages equal to
where
NMsg is the number of messages sent per auction,
Cn is the number of participating consumers, and
B is the total number of bids sent by the auctioneer to all consumers.
In theVickrey auction, publishing the current highest bid to other participants is not required because bidders are limited to a single bid and the bids are sealed. The total number of messages required per Vickrey auction is equal to
The second criterion is whether the agent determines the price by itself or from others. In Vickrey auctions, the agent’s bid determines whether or not he wins the auction, but not the price. However, in Dutch auctions, the winning agent determines the price. In certain circumstances, this ensures trustful bidding and avoids counter speculation.
Although the Vickrey auction presents some advantages in comparison with Dutch auction, such as a lower communication weight, it suffers from some drawbacks such as bidder collusion, vulnerability to lying auctioneers, and the necessity to reveal sensitive information, as summarized in
Table 5.
The solution to bidder collusion vulnerability is to identify the coalition parties.
To address lying auctioneers, we need to add trusted third-party auction servers that reveal the highest bid to the seller after closing. The proposed mechanisms for avoiding lying by the auctioneer include cryptographic signatures on bids and the use of trusted third-party auction servers.
6.3. Comparison between Vickrey and Dutch Auctions based on a Case Study
We aim to compare the outcomes of both Vickrey and Dutch auctions. To do that, we take a case study of a provider selling electricity using an auction approach. The provider is looking to sell a total of 600 Kw.
Let us suppose five consumers (A, B, C, D, and E) are bidding on electricity.
- (i)
Consumer A bids 300 Kw at $400
- (ii)
Consumer B bids 100 Kw at $500
- (iii)
Consumer C bids 400 Kw at $100
- (iv)
Consumer D bids 150 Kw at $300
- (v)
Consumer E bids 200 Kw at $200
In a Dutch Auction
Sorted list of consumers established with the highest price at the top:
- ○
Consumer B: 100 Kw at $500 (600 − 100 = 500 Kw remaining)
- ○
Consumer A: 300 Kw at $400 (500 − 300 = 200 Kw remaining)
- ○
Consumer D: 150 Kw at $300 (200 − 200 = 0 Kw remaining)
- ○
Consumer E: 200 Kw at $200
- ○
Consumer C: 400 Kw at $100
In this example, the electricity would be priced at $300 per Kw, because the last bid of 150 Kw at $300 filled out the total number of Kw that the provider is looking to offer. The final price is $300, and the three best bidders (B, A, and D) pay the final price of $300 (100 Kw for B, 300 Kw for A, and 150 Kw for D) instead of their initial bids of $500, $400, and $300, respectively. Consumers E, F, and C would not receive anything because the number of Kw is already filled.
The consumers A, B, and D are satisfied with paying $300 per Kw, because their bids were higher.
The consumers C and E cannot purchase any electricity because their bid price was too low, and there is no electricity left to purchase.
In a Vickrey Auction
Sorted list of consumers established with the highest price at the top:
- ○
Consumer B: 100 Kw at $500
- ○
Consumer A: 300 Kw at $400
- ○
Consumer D: 150 Kw at $300
- ○
Consumer E: 200 Kw at $200
- ○
Consumer C: 400 Kw at $100
It is evident that consumer B has the highest price ($500), winning the auction bid but paying the price of the second-highest bid (A), which is $400.
Comparison between Dutch and Vickrey Auctions
The parameters we need to compare are the final price of the item, the amount of money paid by each bidder, and the amount of electricity each bidder receives in return.
Table 6 shows that in a Dutch auction, 80% of consumers (A, B, and D) receive the requested electricity based on their respective bids and pay in return the same amount (
$300), whereas in a Vickrey auction, only one bidder (B) receives the electricity needed.
In Dutch auctions, the provider is also satisfied, as it sells all the electricity that it provides at a reasonable price; here, the total amount received will be $570,000. Whereas, in the Vickrey auction, only a small part of the provided electricity is sold.
This demonstrates that the Dutch auction produces a more equitable outcome than the Vickrey auction for both consumers and provider.
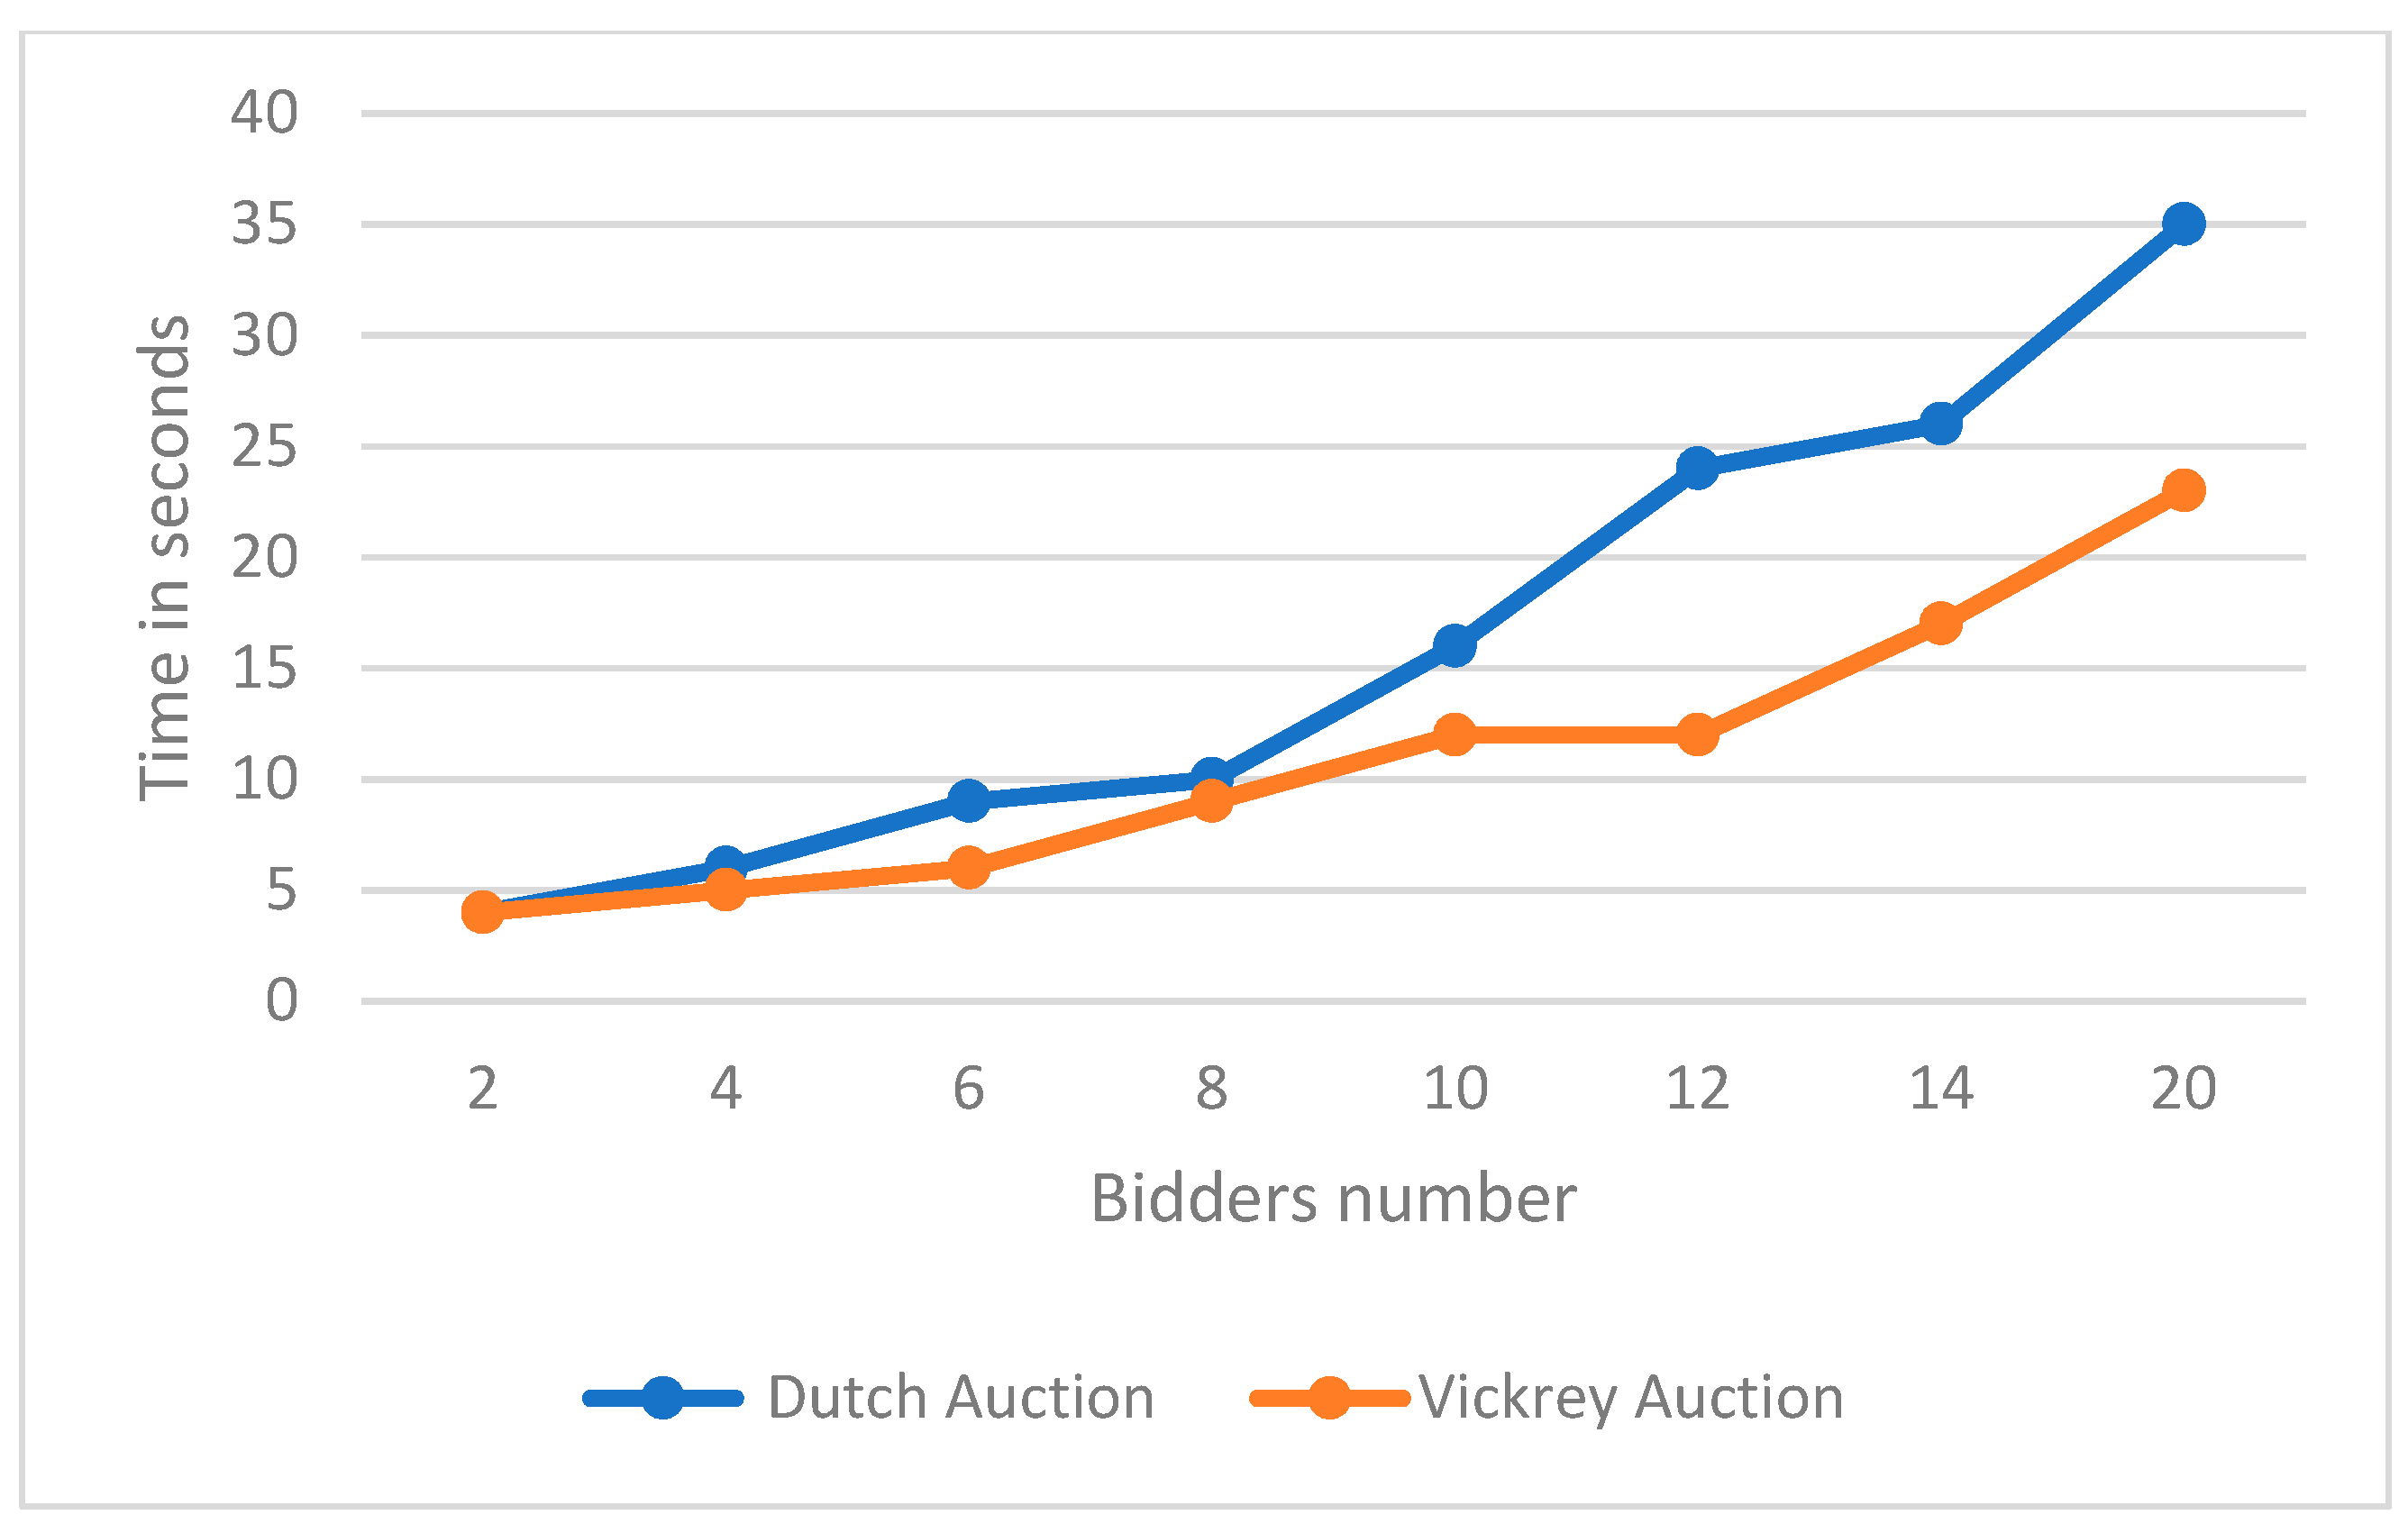
6.4. Experimental Comparison between Vickey and Dutch Auctions
We have deployed the following strategies: Dutch, and Vickrey auctions. We ran simulations with 2, 4, 6, 8, 10, 12, 14, and 20 bidders. The number of auction rounds for Dutch was limited to ten, with each round having a one-minute timeout. The Vickrey auction had only one round.
In this section, we estimate how much a transaction will cost in terms of time, messages, and bids. We also examine how these factors change in various scenarios where there are more consumer agents. Two examples are as follows:
In a demand-driven environment, there is more demand than the electricity in supply.
In a supply-driven environment, there is more electricity provided than the demand.
The time and the number of messages exchanged between these agents are all essential indicators.
The testing results for the prototype are shown in
Figure 6,
Figure 7,
Figure 8 and
Figure 9.
Figure 6 and
Figure 7 (8 and 9 resp.) are related to demand-driven scenarios (resp. supply-driven scenario).
Figure 6 and
Figure 8 show how the number of messages per transaction changes as the number of bidders grows.
Figure 7 and
Figure 9 show how time per transaction changes as the number of bidders grows.
6.4.1. In a Demand-Driven World
- ○
Number of messages and bids per transaction (Figure 6): In Dutch auctions, whenever the number of agents increases, the number of messages sent increases. This is because there is a higher chance of competition as the system gets more complex. The quantity of bids, and consequently messages, rises as the likelihood of competition climbs as well. However, in Vickrey auctions, the number of messages often increases linearly in a demand-driven world. Thus, the difference between Dutch and Vickrey auctions is becoming more and more important with the increasing number of bidders.
- ○
As more agents join the system, more consumers participate in a demand-driven world. Therefore, the time per transaction increases.
The number of bids and the time it takes for a buyer agent to execute a transaction rises.
In Dutch auctions, more sent messages implies more time spent to execute a transaction. In Vickrey auctions, the time it takes to conduct a transaction also increases, but in a reasonable manner. It is clear that Vickrey auctions outperform Dutch auctions, especially whenever the number of bidders is becoming huge.
6.4.2. In a Supply-Driven World
- ○
Number of messages and bids per transaction (Figure 8): In a supply-driven world, as the number of agents increases, the number of sending messages increases also. Both Vickrey and Dutch auctions present approximately similar results whether the number of bidders is small or big.
- ○
The performance of both Vickrey and Dutch auctions was similar.
As a result, in a demand-driven world, the Vickrey auction outperforms the Dutch auction. Indeed, Vickrey auctions and Dutch auctions both have good performance in terms of efficiency and accuracy. However, Vickrey auctions have a slight edge over Dutch auctions in terms of performance, as they are more efficient in terms of execution time and number of messages. In a supply-driven world, both have similar performance. The Dutch auction is preferred over the Vickrey auction, as Vickrey auctions can be manipulated by bidders who are aware of how they work. Dutch auctions are more equitable than Vickrey auctions, as all participants have an equal opportunity to bid on power at any price-point, whereas with a Vickrey auction, some participants may be disadvantaged due to their lack of knowledge or resources. Additionally, with a Dutch auction, all participants have an equal chance of winning the bid regardless of their initial bid price, whereas with a Vickrey auction, those who bid higher have an advantage over those who bid lower. Therefore, Dutch auctions are better than Vickrey auctions in situations where there is an abundance of power, and customers are willing to wait for lower prices. Additionally, Dutch auctions can be beneficial when producers want to ensure that all customers get access to power at fair market prices without having to compete with each other in an open bidding process.
7. Conclusions
In smart grids, demand-response (DR) control is used to reduce the total load in response to peak power issues. There are two methods for DR control: centralized and distributed solutions. Although the centralized approach is theoretically simple to implement, it will still not an easy way to expand power systems in the future. We recommend using a distributed solution for DR control in smart grids for the following reasons: distributed solutions (i) reduce communication cost and computational complexity, (ii) protect the agents’ privacy, and (iii) are more comfortable with smart grids, as they are distributed by nature. The benefit of using distributed control for demand response in smart grids is that it provides greater flexibility and resilience than centralized control while still allowing an effective way to manage energy usage across multiple entities with different objectives. Additionally, distributed control can respond quickly to changing conditions or demands without waiting for approval from a central authority, which makes it an attractive option when quick responses are needed or when there are multiple stakeholders with different objectives that need to be taken into account when optimizing energy usage across the system.
The proposed technique in [
32] drastically lowers the overall cost of energy purchase for each consumer microgrid. During the first phase, an equal quantity of energy is assigned to each consumer MG, and during the second phase, energy is scheduled using a Vickrey auction. It also makes sure that the scheduling of the energy is done effectively and fairly. We propose to ameliorate these results by using a Dutch auction approach instead of the Vickery auction approach. We compare the two approaches, and we obtained theoretical and empirical results.
The Dutch auction is the approach that requires the most messages. The Vickrey auction strategy has fewer communication needs, as it only requires one round, and performs better. Although the Vickrey auction presents some advantages compared to the Dutch auction, it suffers from some drawbacks, such as bidder collusion, vulnerability to a lying auctioneer, and the necessity to reveal sensitive information. As a result, in a demand-driven world, a Vickrey auction would be more effective: it encourages bidders to bid their true value for an item, since they know that they will only pay the second-highest bid if they win. In a supply-driven world, however, a Dutch auction would be more effective, because it allows buyers to wait for lower prices until they find one that meets their budget. Dutch auctions are better than Vickrey auctions when there is an abundance of power supply and customers are willing to wait for lower prices. Additionally, Dutch auctions can be beneficial when producers want to ensure that all customers get access to power at fair market prices without having to compete in an open bidding process. The Dutch auction method also allows for better optimization of resources within the smart grid energy-scheduling process, as bidders are encouraged to bid their true value rather than overbidding or underbidding due to uncertainty about what others may be willing to pay for a given resource or service within the smart-grid energy-scheduling process.
Despite its advantages, there are some challenges associated with using the Dutch auction method in smart-grid energy-scheduling processes that must be addressed before this type of system can be successfully implemented on a large-scale basis within an organization’s operations or processes. These include ensuring that all participants have access to reliable information about current market conditions and ensuring that all participants can submit bids quickly enough so that they do not miss out on opportunities due to slow response times from other participants within the same market segment or industry sector.
The feasibility of implementing the proposed Dutch auction-based fair-scheduling method for demand response in smart grids depends on several factors, such as the availability of data, computing power, and communication infrastructure. Additionally, it depends on the willingness of users to participate in such an auction system and their ability to understand how it works. Furthermore, it depends on whether regulatory bodies are willing to allow such a system to operate within their jurisdiction.
In future work, we plan to study how to move from centralized control to distributed control in demand response, which requires careful implementation of new technologies such as advanced metering infrastructure (AMI), automated load-shedding systems (ALS), and other intelligent devices such as sensors and controllers that allow for data collection.


