Article

Effects of Modified Outsole Patterns in Tennis Shoes on Frictional Force and Biomechanical Variables of Lower Extremity Joints

1
Motion Innovation Center, Korea National Sport University, Seoul 1239, Republic of Korea
2
Fila Advanced Science and Technology Center, FILA Holdings, Busan 1077, Republic of Korea
*
Author to whom correspondence should be addressed.
Appl. Sci. 2023, 13(4), 2342; https://doi.org/10.3390/app13042342
Submission received: 11 December 2022 / Revised: 21 January 2023 / Accepted: 27 January 2023 / Published: 11 February 2023
(This article belongs to the Section Biomedical Engineering)

Abstract

:
(1) Background: This study aimed to examine the effects of four different outsole patterns on frictional force and lower extremities during tennis-specific movements. (2) Methods: Four tennis shoes with different widths of outsole treads were manufactured for this study (A: all thin, B: all thick, C: laterally thin and medially thick, D: medially thick and laterally thin). The frictional force was measured during a mechanical test. Eleven male recreational tennis players participated in the study. The data were collected using sixteen infrared cameras and a force plate for a biomechanical test. (3) Results: During the mechanical test, there was a significant difference between the shoes in the forward and sideward Coefficient of Translational Friction (CoF) and clockwise rotational friction (p < 0.05). There were significant differences in the maximum ankle internal rotation angle during braking motion (p < 0.05). In contrast, a significant difference in the maximum internal rotation moment of the ankle was found during forward braking motion (p < 0.05). (4) Conclusions: Based on these results, the difference in the outsole tread width (0.6 mm) affected mechanical frictional force, but this phenomenon was less influenced by the adaptation of the lower extremity joint’s movement in a tennis-specific motion. Finally, the difference in the outsole pattern affects the rotational movement and moment of the ankle joint. Thus, any slight change in friction by modified outsole patterns of tennis shoes requires close attention to develop the functional requirements for tennis performance.

1. Introduction

Due to scientific research in the 1960s, footwear started to be designed to improve athletic performance, prevent injuries, provide comfort in sports situations, and protect the foot [1]. These modifications can improve functional factors by changing frictional force, stability, flexibility, and weight, which are footwear’s characteristics [2]. The characteristics of footwear can be changed through a combination of materials and designs used for the upper, midsole, and outsole—the structure of footwear [3]. The outsole is the lowest part of footwear and is the part making contact with the ground [4,5]. Although the outsole affects various footwear characteristics, its most crucial role is to provide frictional force between the surface and the footwear [6,7].
Frictional force is the resistance between two objects coming into contact [8]. In sports, frictional force aids in movements such as running, stopping, acceleration, and sudden directional change [8,9,10]. At this time, there is a required frictional force for these movements, and it has been reported to be 0.15–0.3 for walking [11], 0.6–0.7 for running [6], and around 1.0 for sports situations [8]. If the frictional force is too low, slipperiness occurs upon movement, so athletic performance declines and injuries are caused [7]. On the other hand, increasing the frictional force can improve performance, but it does not have an effect after certain levels [9,12]. Furthermore, excessive frictional force can cause non-contact injuries by causing foot fixation to occur during movement [2,12,13,14,15]. Therefore, setting the proper range of the frictional force to maximize athletic performance while minimizing injury occurrence would be a significant factor in sports situations.
The frictional force of footwear can be changed by modifying the contacting surface material, outsole material, and outsole pattern [6,16]. Previous footwear research has been carried out investigating the frictional force depending on the outsole materials [7,17] and patterns [18,19] in soccer [20,21], American football [8,22], basketball [4,17], and tennis [14,23,24,25] to find out the effects of frictional force on movement. The rationale for why studies on the frictional force of footwear are continuously conducted in various sports is that the required level of frictional force depends on the surface characteristics [16] and the movement required for each sport [1]. Hence, accurately understanding body movement and surface characteristics in sports games is essential to finding the proper scope of frictional force.
Tennis is played on various surfaces, including grass, clay, and hard court [26]. It is a sport where the front, back, left, and right directional changes are significant [23]. In tennis, directional change movements cause a sliding phenomenon, in which intentional sliding occurs between foot and surface, unlike in other sports games. This sliding phenomenon may occur during dynamic and powerful tennis movements when the horizontal force exceeds the maximum static frictional force [27]. Proper sliding may enhance athletic performance through a quick change of direction with improved stability [24] and reduce injuries by decreasing joint loading [26]. The sliding motion improving athletic performance and reducing injuries is reportedly decided by the size of the frictional force between the surface and footwear [28]. The sliding motion was frequently seen on the clay court in the past [29], but the motion has often been seen on the hard court recently [30]; therefore, tennis shoes’ frictional force on the hard court has become more critical.
For this reason, several biomechanical studies on tennis shoe frictional force have been conducted [14,24,30,31,32]. Biomechanical studies have reported frictional coefficients between 0.3 and 0.68 on a hard court [14,32], while frictional coefficients between 0.72 and 1.8 depending on normal forces during mechanical testing were observed [28,31]. However, most studies have carried out frictional force tests through mechanical tests [30,31] or frictional force comparisons between launched products that were not systematically controlled for the outsole patterns [24,32]. From the aspect that lateral movement in a tennis match takes up 70% of an athlete’s movements [33], this study examined the frictional force difference by distinguishing the medial and lateral sides of the outsole in a tennis shoe and systematically changing their tread width. Investigating the biomechanical changes created by modified outsole patterns during frequent tennis motions would be vital for athletic performance improvement and injury prevention.
This research examines the effects of four modified outsole patterns on frictional characteristics and lower extremity biomechanics during tennis-specific movements.

2. Materials and Methods

2.1. Participants

This study recruited 11 recreational male tennis players (age: 24.3 ± 6.1 years, height: 177.7 ± 3.0 cm, weight: 74.6 ± 8.6 kg, career: 12.4 ± 1.9 years) in their 20s to 30s having no musculoskeletal injuries within the past six months, wearing 270 mm tennis shoes, and continuously playing on the hard court. Before the experiment, the research was approved by the Institutional Ethics Review (Project Control Number: 1263-202106-HR-087-01, Approval Number: 20210610-097, Research Approval Date: 10 June 2021).

2.2. Tennis Shoes

The tennis shoes used in this research had the same design type and mass (approximately 370 g) with differences only in the outsole pattern. Additionally, the manufacture was requested by a company (Fila Holdings, Seoul, Republic of Korea). A herringbone pattern mostly adopted in tennis shoes was used for the outsole pattern. Two pattern types were designed: HA with a 1.4 mm tread width and HB with a 2.0 mm tread width. By combining the two patterns, (1) A, consisting of HA, (2) B, consisting of HB, (3) C, consisting of HA (lateral) and HB (medial), and (4) D, consisting of HB (medial) and HA (lateral), were manufactured and tested (Figure 1).

2.3. Experimental Process

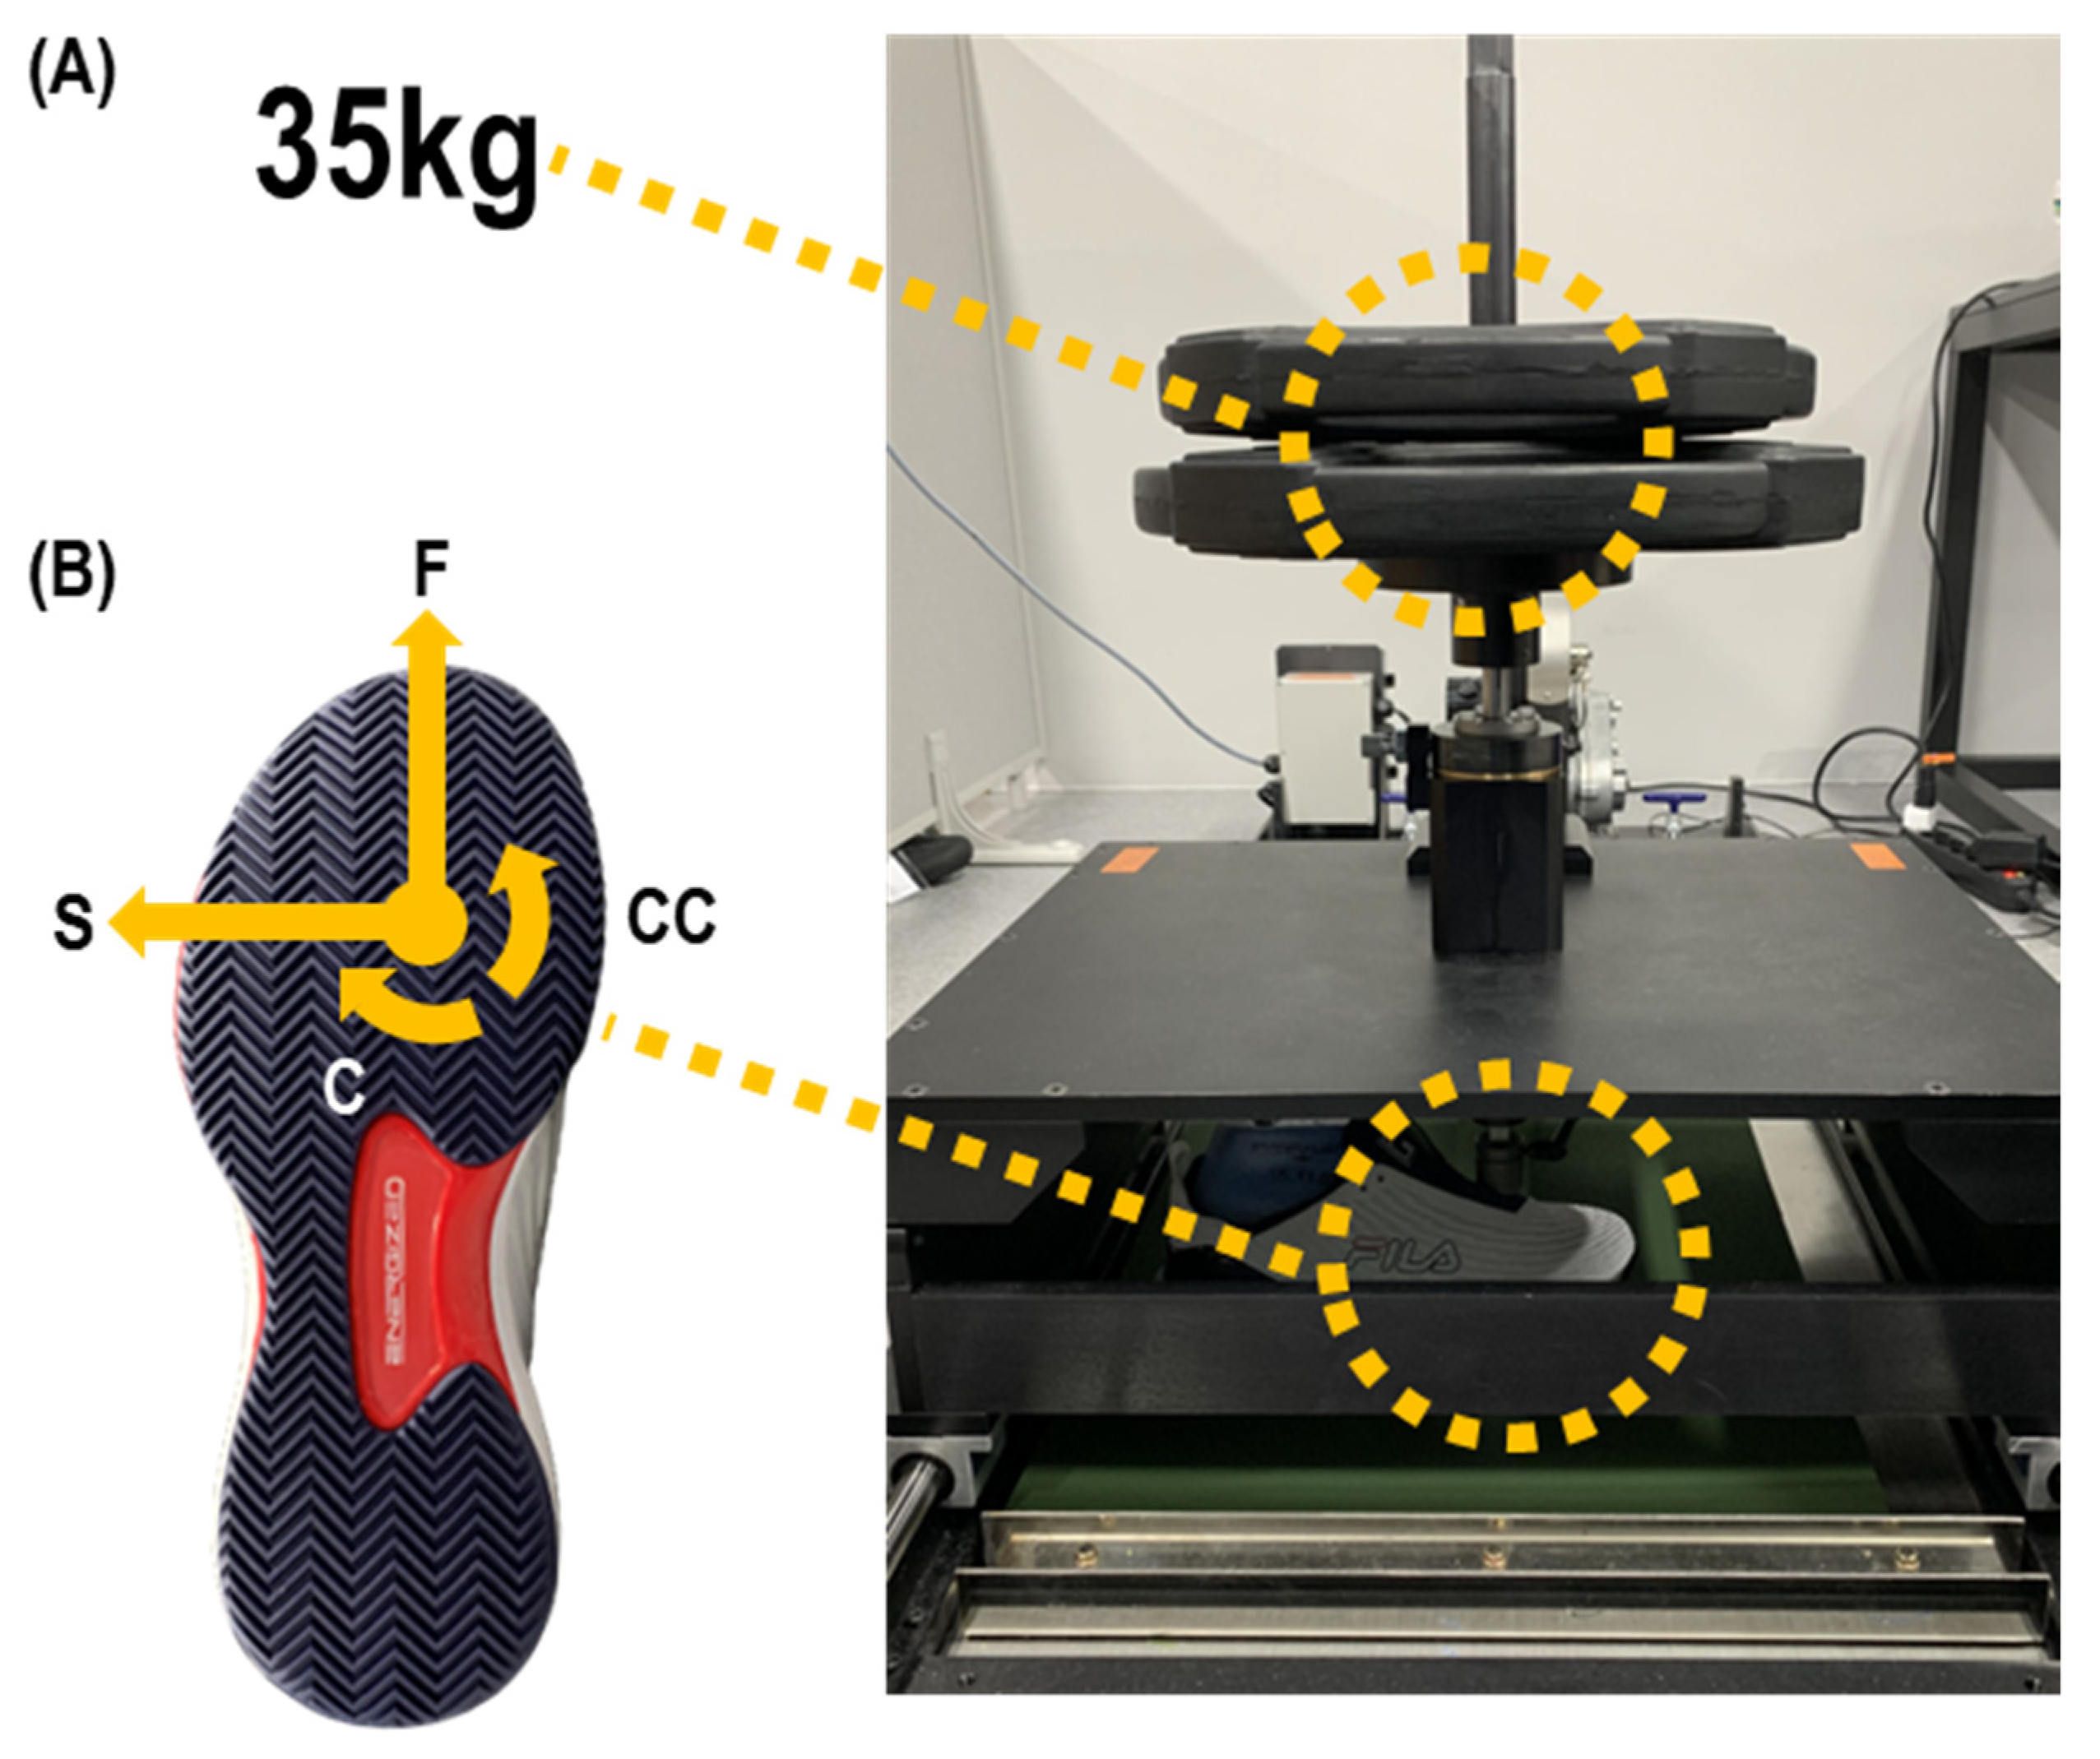
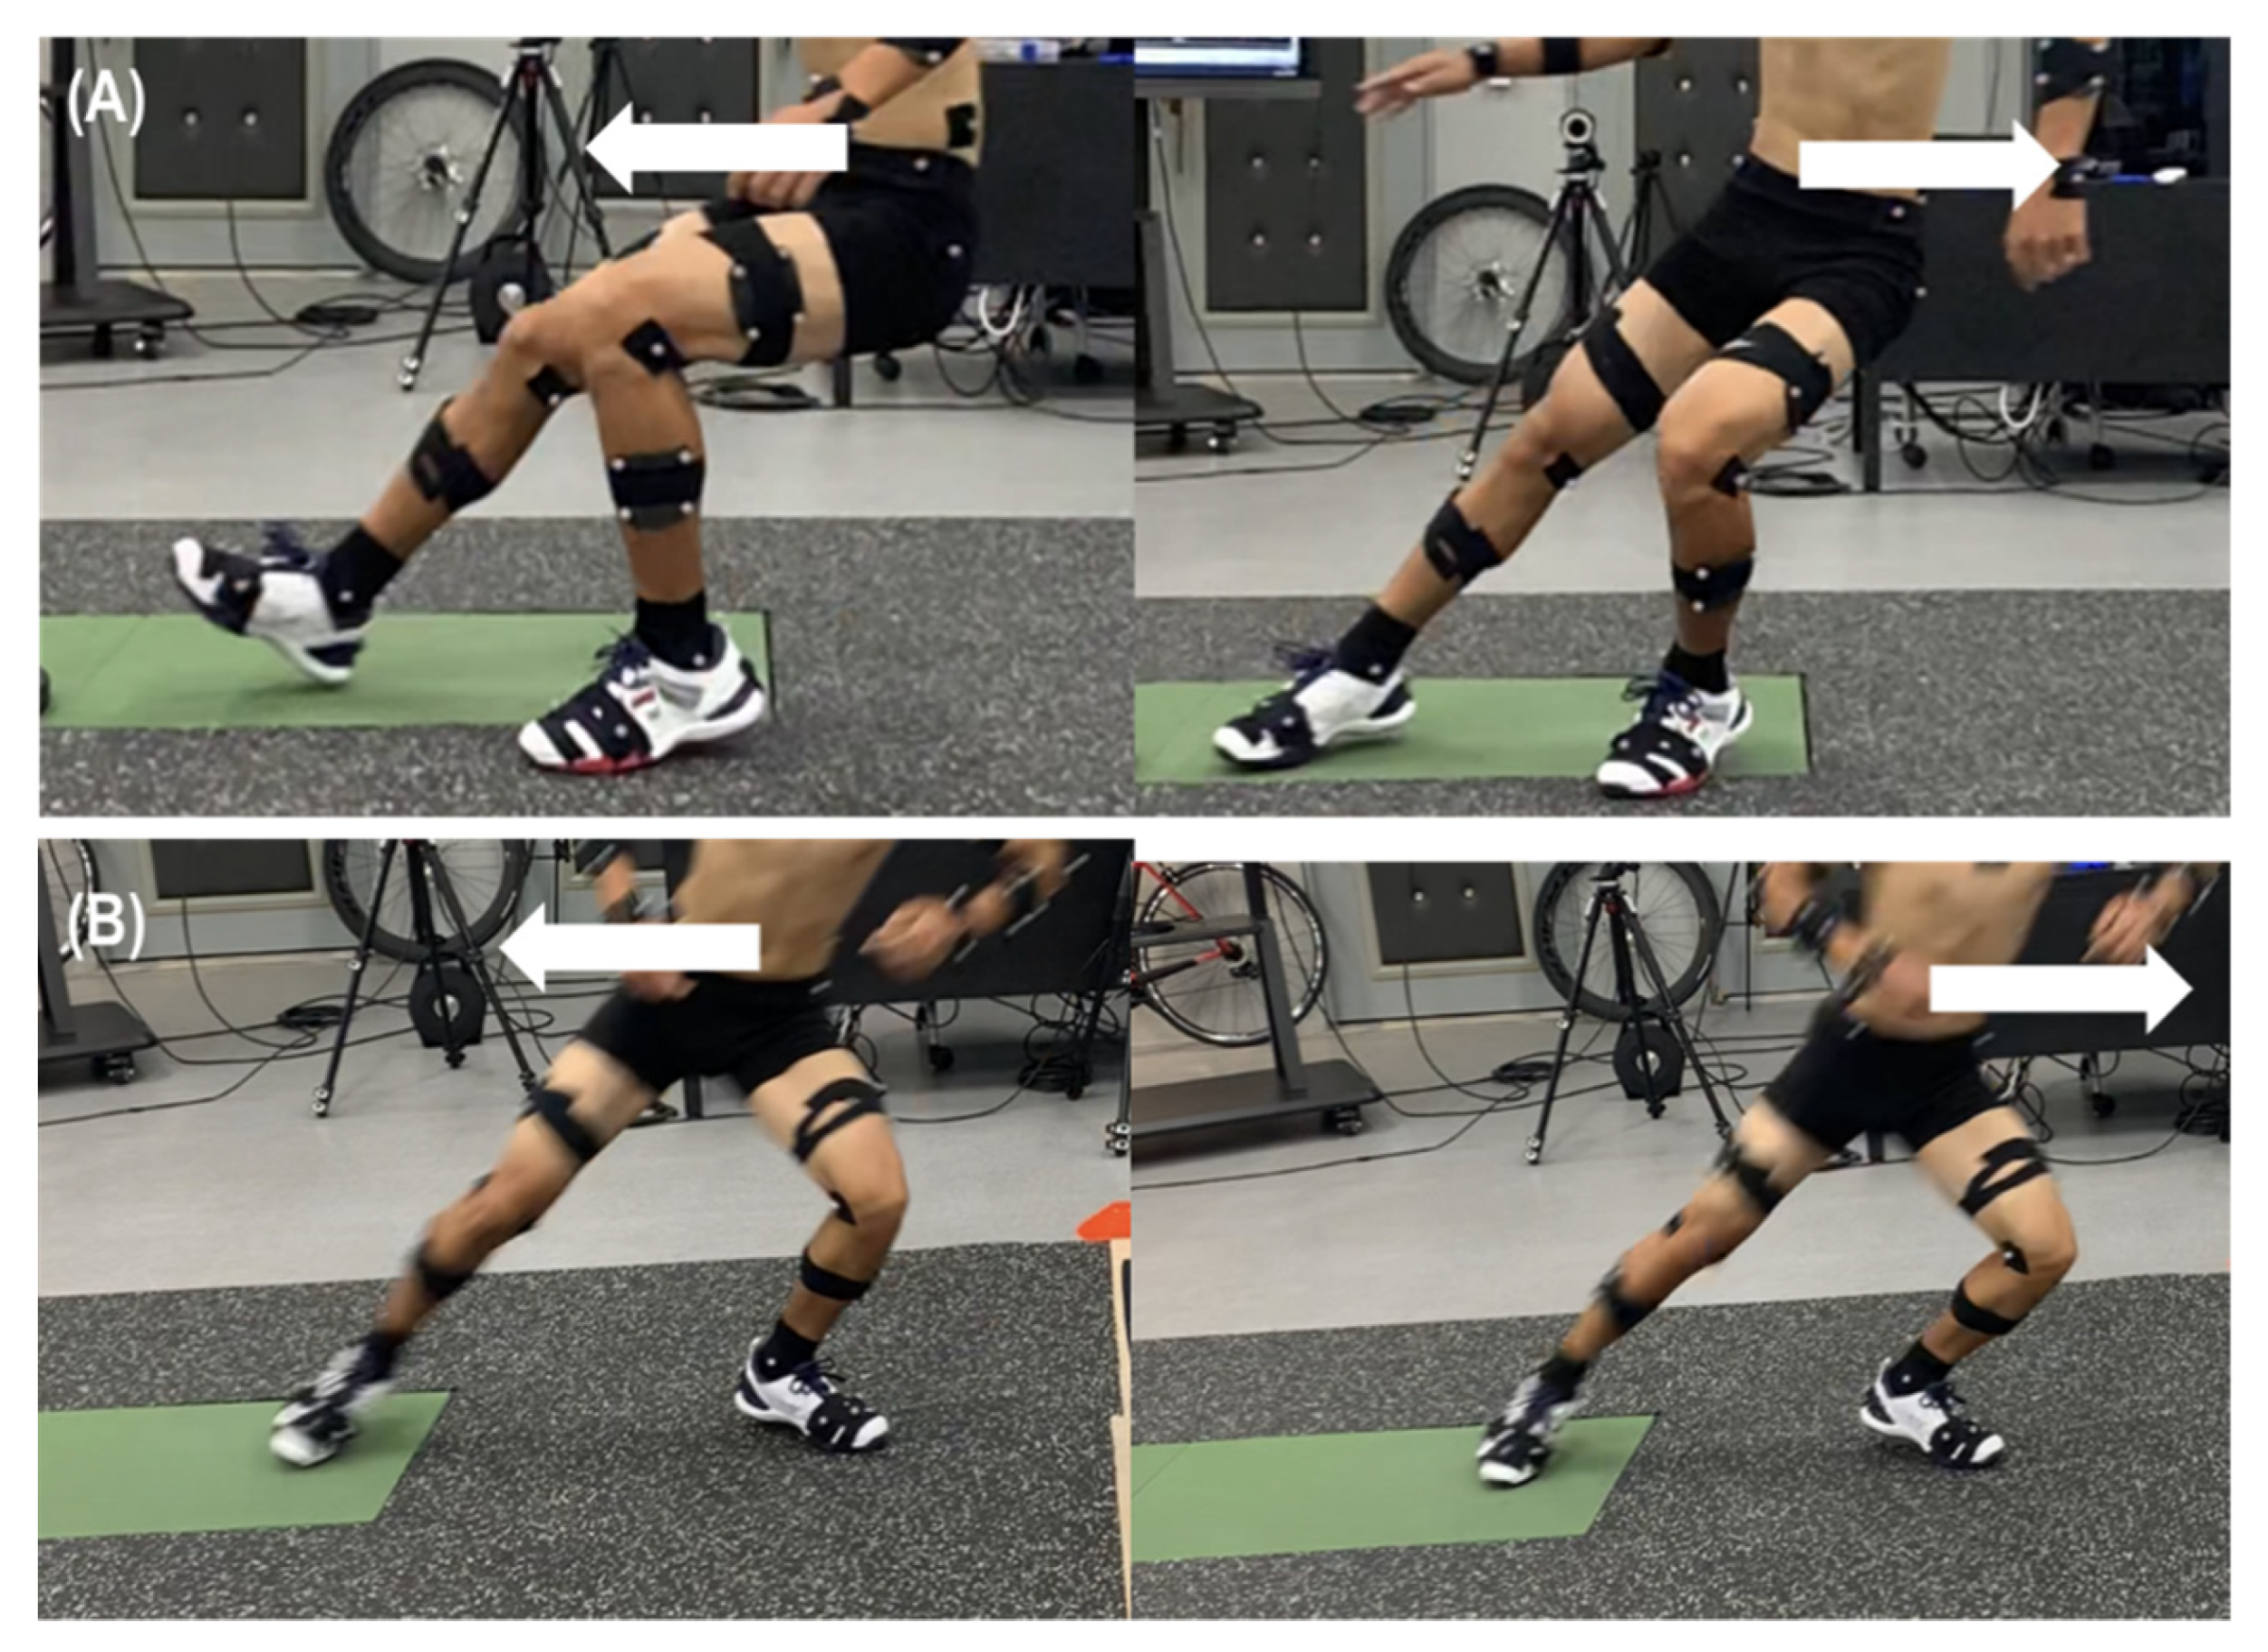
To measure the effects of tennis shoe outsole patterns on frictional force and biomechanical variables on the hard-court surface, a custom-manufactured surface (Hanseo Polymer, Gimpo, Republic of Korea) was used. Using a manufactured hard-court surface, this study measured translational and rotational friction force through a frictional force test machine (S2T2, Exeter Research Inc., Brentwood, NH, USA), depending on the tennis shoes’ direction (Figure 2). The mechanical test’s vertical load was set at 35 kg. The maximum Coefficient of Translational Friction (CoF) was calculated based on the maximum translational friction force when moving at 20 mm/s in the forward and side directions. The rotational friction force value was computed when a 90°/s rotation was applied using a digital torque wrench, while the rotational friction force occurred when rotation happened in clockwise and counterclockwise directions at the same vertical load. To determine the frictional force and biomechanical variables occurring depending on outsole patterns upon the motions, the 11 participants performed two directional change motions depending on tennis shoe conditions. Forward and side braking motions were carried out (Figure 3). The forward braking motion started at a position 2 m away. Moreover, the side braking motion started at a position 4 m away. All participants exerted their maximum efforts beginning from the starting position and returning to the starting position after braking. All data collection was conducted after the participants were sufficiently adapted to the tennis shoes, while sufficient rest was given between the shoes. The two motions were recorded using 16 high-speed infrared cameras (Oqus 600, Miqus M5, Qualisys, Gothenburg, Sweden) and 1 force plate (Type 9287C, Kistler, Winterthur, Switzerland) attached to the same hard-court surface as in the mechanical test. Seventy-two reflective markers were attached to the body to collect three-dimensional position data during the biomechanical test (Figure 3). The analyzed phase was selected from an initial contact to take-off of the right foot. Five trials for each tennis shoe were analyzed for comparison. For each trial, 16 cameras sampling at frequency of 240 Hz were used to collect the motion of the markers, and Force data was collected at 2400 Hz. For each motion, the order of the tested tennis shoes was randomized.

2.4. Data Collection

The Marker and ground reaction force data collected through infrared cameras and force plate were obtained through the Qualisys track manager (Qualisys, Gothenburg, Sweden). The second-order low-pass Butterworth filter was used to remove errors from the data obtainment process. The kinematics data cut-off frequency was set at 12 Hz, and the kinetic data cut-off frequency was set at 100 Hz [34]. The data were analyzed through Visual 3D (C-Motion, Germantown, MD, USA) and Matlab R2014b (The Mathworks, Natick, MA, USA), depending on the computation method of each variable.

2.5. Analysis Variables

2.5.1. Frictional Force

The frictional force between surface and footwear is classified into translational and rotational friction forces [3,16,35]. The translational friction force is a horizontal force resisting linear movement at the contacting position. The CoF is defined as the ratio of horizontal force to vertical force [8,19,36]. From the ground reaction force (Fx, Fy, Fz) occurring in the case of motion, the translational friction coefficient was calculated through the following equation:
Horizontal   Force = F y 2 + F y 2 Coefficient   of   Translational   Friction   ( μ ) = Horizontal   Force / F z
Rotational friction force can be indicated as the rotational friction force displayed at the Center of Pressure (CoP) when the foot makes contact with the ground [37]. It is defined as the ground reaction torque or free moment revealed in the ground reaction force [35] and was calculated using the following equation through CoP (CoPx, CoPy), ground reaction force (Fx, Fy), and moment (Mx, My, Mz) [38].
Rotational Friction = Mz + (Fx × CoPy) − (Fy × CoPx)

2.5.2. Joint Angle

Based on the three-dimensional position data of the marker obtained through infrared cameras, three-dimensional ankle and knee joint angles were calculated through the X-Y-Z matrix of Euler/Cardan [39]. The joint angles were calculated when the participant contacted the ground and took off from the ground, in addition to the maximum, minimum, and range of motion in the phase.

2.5.3. Joint Moment

The joint moment is the rotational force of the distal segment working on the joint, and through this, the three-dimensional moment of the distal segment on the proximal joint can be calculated. The ankle and knee joint moments were calculated using inverse dynamics [39].

2.6. Statistical Processing

A one-way ANOVA with repeated measures analysis using the SPSS statistical program (IBM Inc., New York, NY, USA) was conducted to find differences in frictional force and biomechanical variables between outsole patterns. The frictional force variables utilized for comparison were as follows: maximum CoF, maximum and minimum rotational friction, and biomechanical variables (joint angles and moments). A post hoc test was conducted using LSD when a significant difference occurred in variables, while the effect size and statistical power are presented in the results. All statistical significance was set at α = 0.05.

3. Results

3.1. Mechanical Frictional Force

Table 1 shows the mechanical frictional force by direction depending on the outsole pattern. The CoF in the forward direction of a mechanical test showed a statistically significant difference depending on the outsole pattern (F = 158.55, p = 0.01, η p 2 = 0.946, statistical power = 1.000). As a result of the post hoc test, the CoF was largest in the order of B > A > D > C. The CoF in the side direction of a mechanical test showed a statistically significant difference depending on the outsole pattern (F = 24.48, p = 0.001, η p 2 = 0.731, statistical power = 1.000). As a result of the post hoc test, the CoF was largest in the order of A, C > D > B. The mechanical rotational friction force during a clockwise rotation showed statistically significant differences depending on the outsole pattern (F = 4.10, p = 0.02, η p 2 = 0.313, statistical power = 0.789). As a result of the post hoc test, the coefficient was largest in the order of D > A and C. The mechanical rotational friction force during a counterclockwise rotation did not show a statistically significant difference depending on the outsole pattern (F = 1.84, p = 0.16, η p 2 = 0.17, statistical power = 0.423).

3.2. Frictional Force upon Braking Motion

In a biomechanical analysis of forward and side braking motions, no statistical difference between the CoF and rotational friction force was found depending on the outsole pattern (Table 2).

3.3. Joint Angle and Joint Moment upon Forward Braking Motion

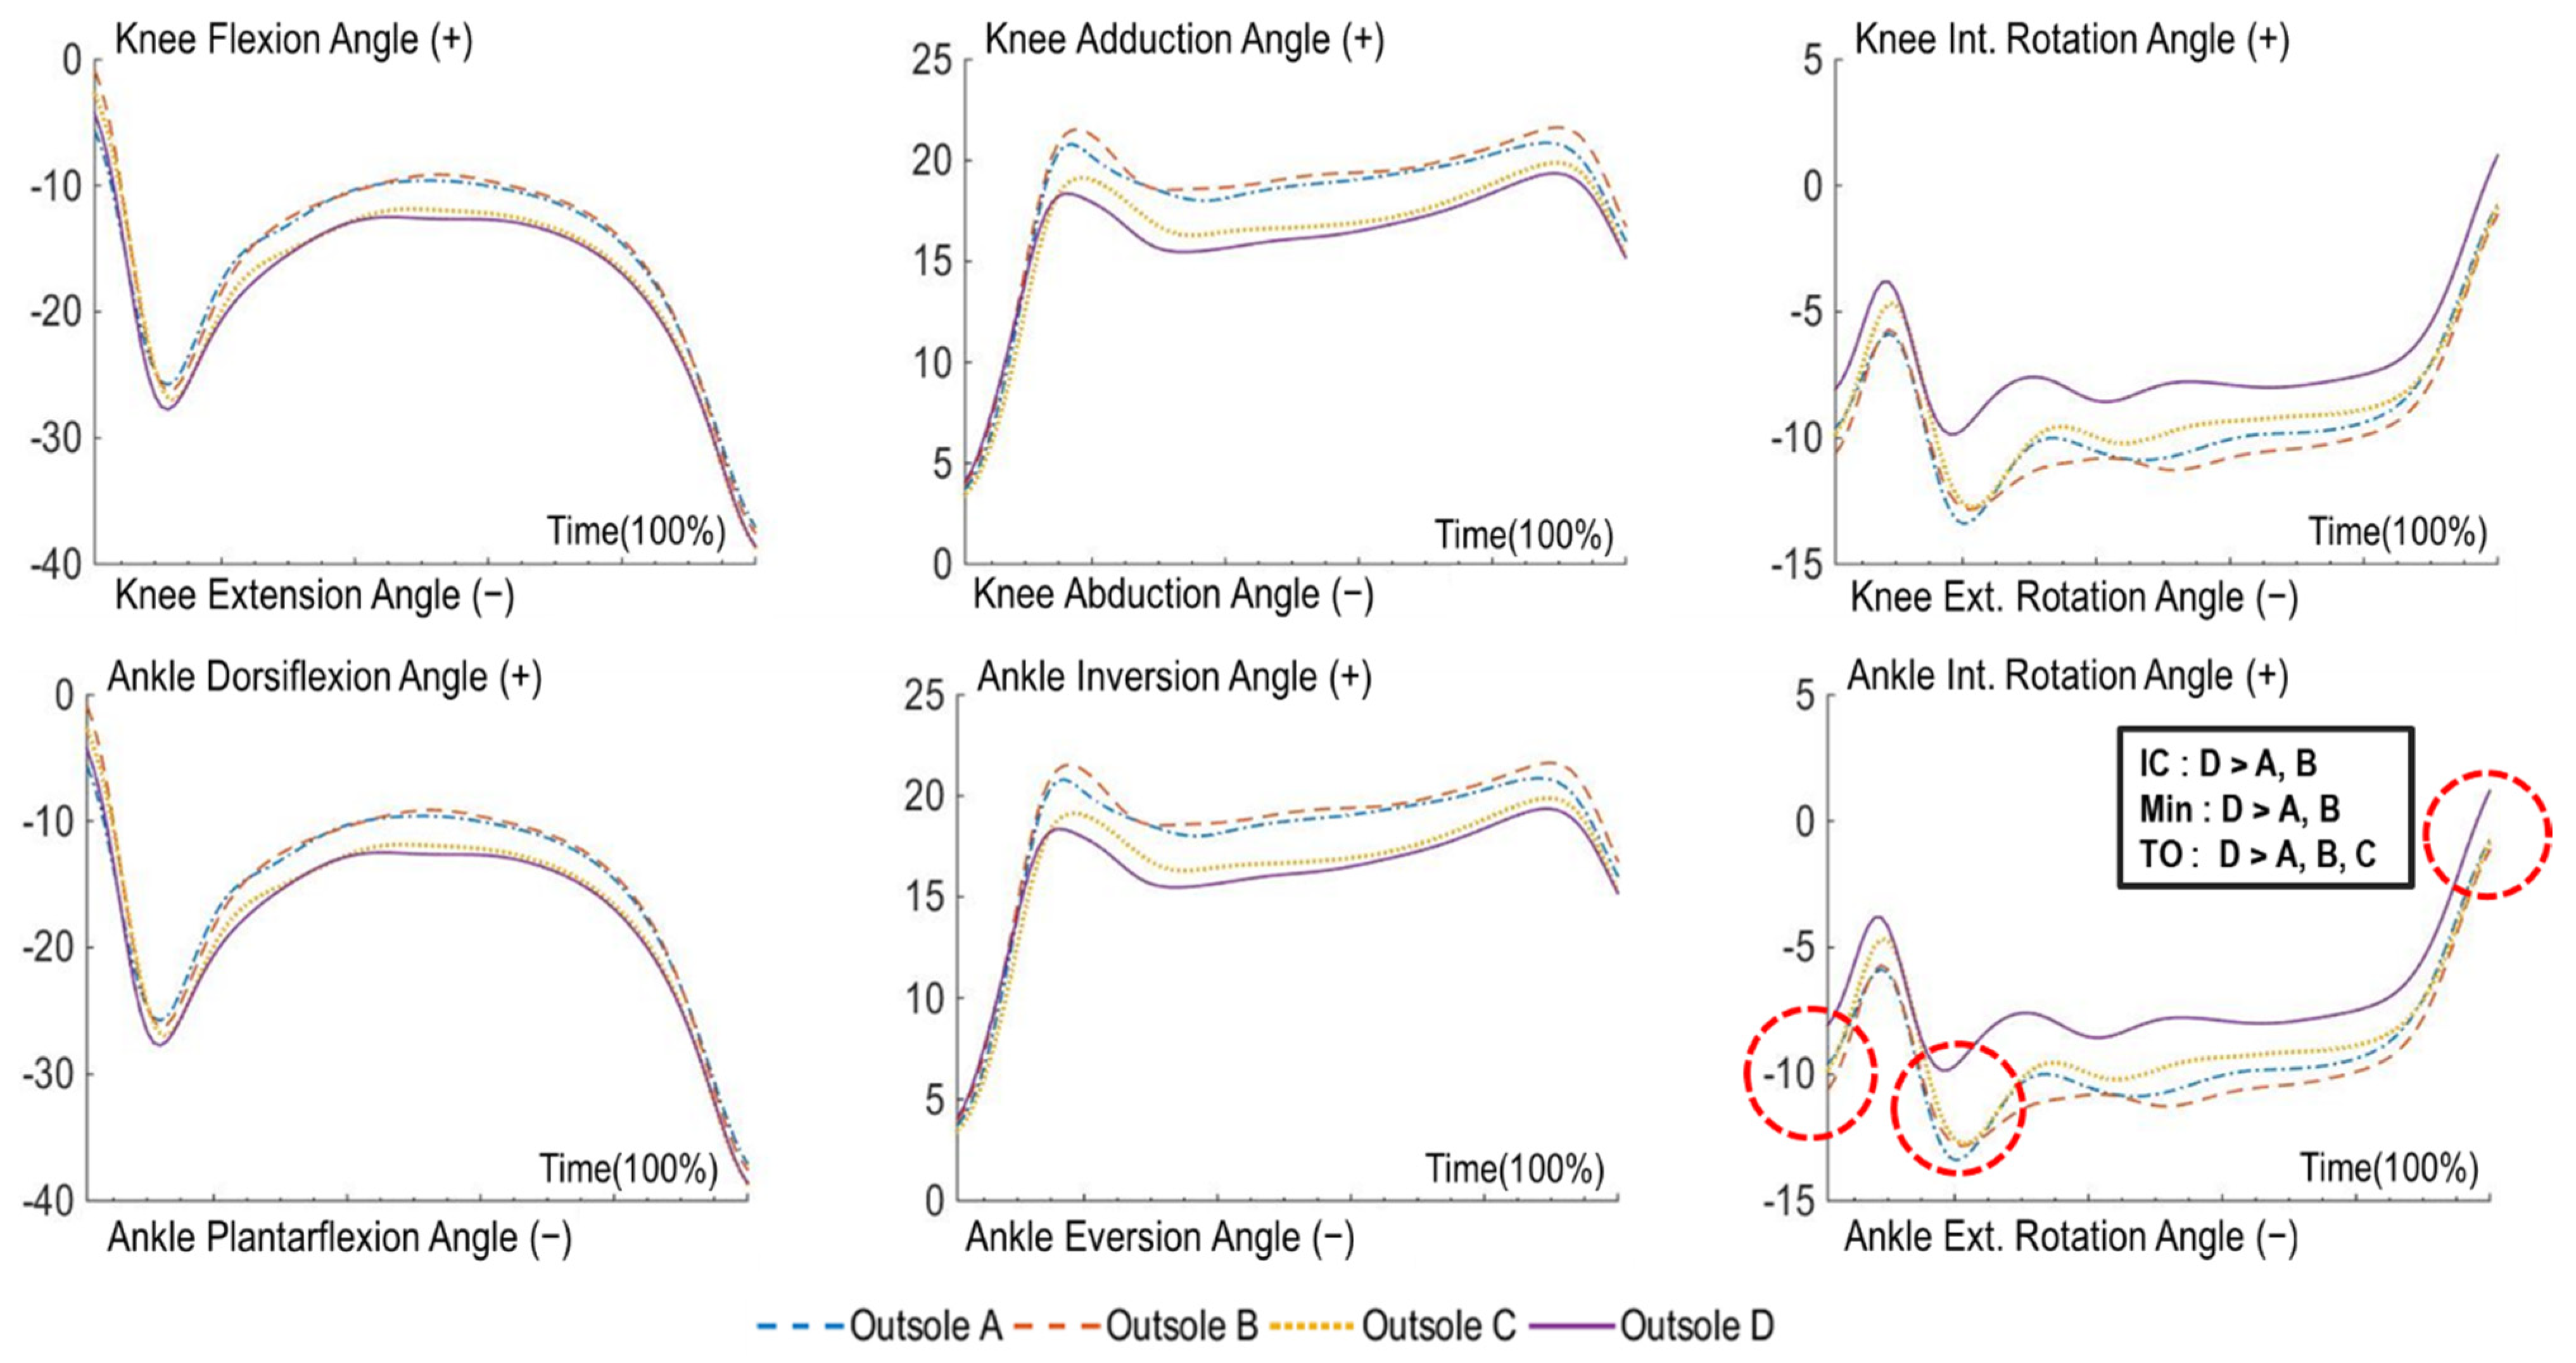
The ankle joint angle in the longitudinal axis upon forward braking motion showed statistically significant differences between outsole patterns at initial contact (A = −9.61 ± 4.61°, B = −10.64 ± 4.27°, C = −9.84 ± 5.17°, D = −8.08 ± 5.02°, F = 3.44, p = 0.03, η p 2 = 0.256, statistical power = 0.714), take-off (A = −0.74 ± 5.17°, B = −1.15 ± 4.25°, C = −0.81 ± 4.04°, D = 1.20 ± 3.69°, F = 3.67, p = 0.02, η p 2 = 0.268, statistical power = 0.745), and the ankle’s maximum external rotation angle (A = −15.77 ± 7.39°, B = −15.71 ± 5.77°, C = −14.62 ± 6.66°, D = −12.96 ± 6.87°, F = 5.24, p = 0.01, η p 2 = 0.344, statistical power = 0.891) (Figure 4, Appendix A Table A1). As a result of the post hoc test, D showed a smaller external rotation angle than that of A and B at initial contact and smaller than that of A, B and C at take-off from the ground. The ankle joint’s maximum external rotation angle in D was smaller than that in A and B. Statistically significant differences between outsole patterns were shown in the ankle joint’s maximum internal rotation moment in the longitudinal axis (A = 0.34 ± 0.11 Nm/kg, B = 0.37 ± 0.1 Nm/kg, C = 0.31 ± 0.09 Nm/kg, D = 0.36 ± 0.13 Nm/kg, F = 3.04, p = 0.04, η p 2 = 0.233, statistical power = 0.654) (Table 3). As a result of the post hoc test, the ankle joint’s maximum internal rotation moment of B was larger than that of C.

3.4. Joint Angle and Joint Moment upon Side Braking Motion

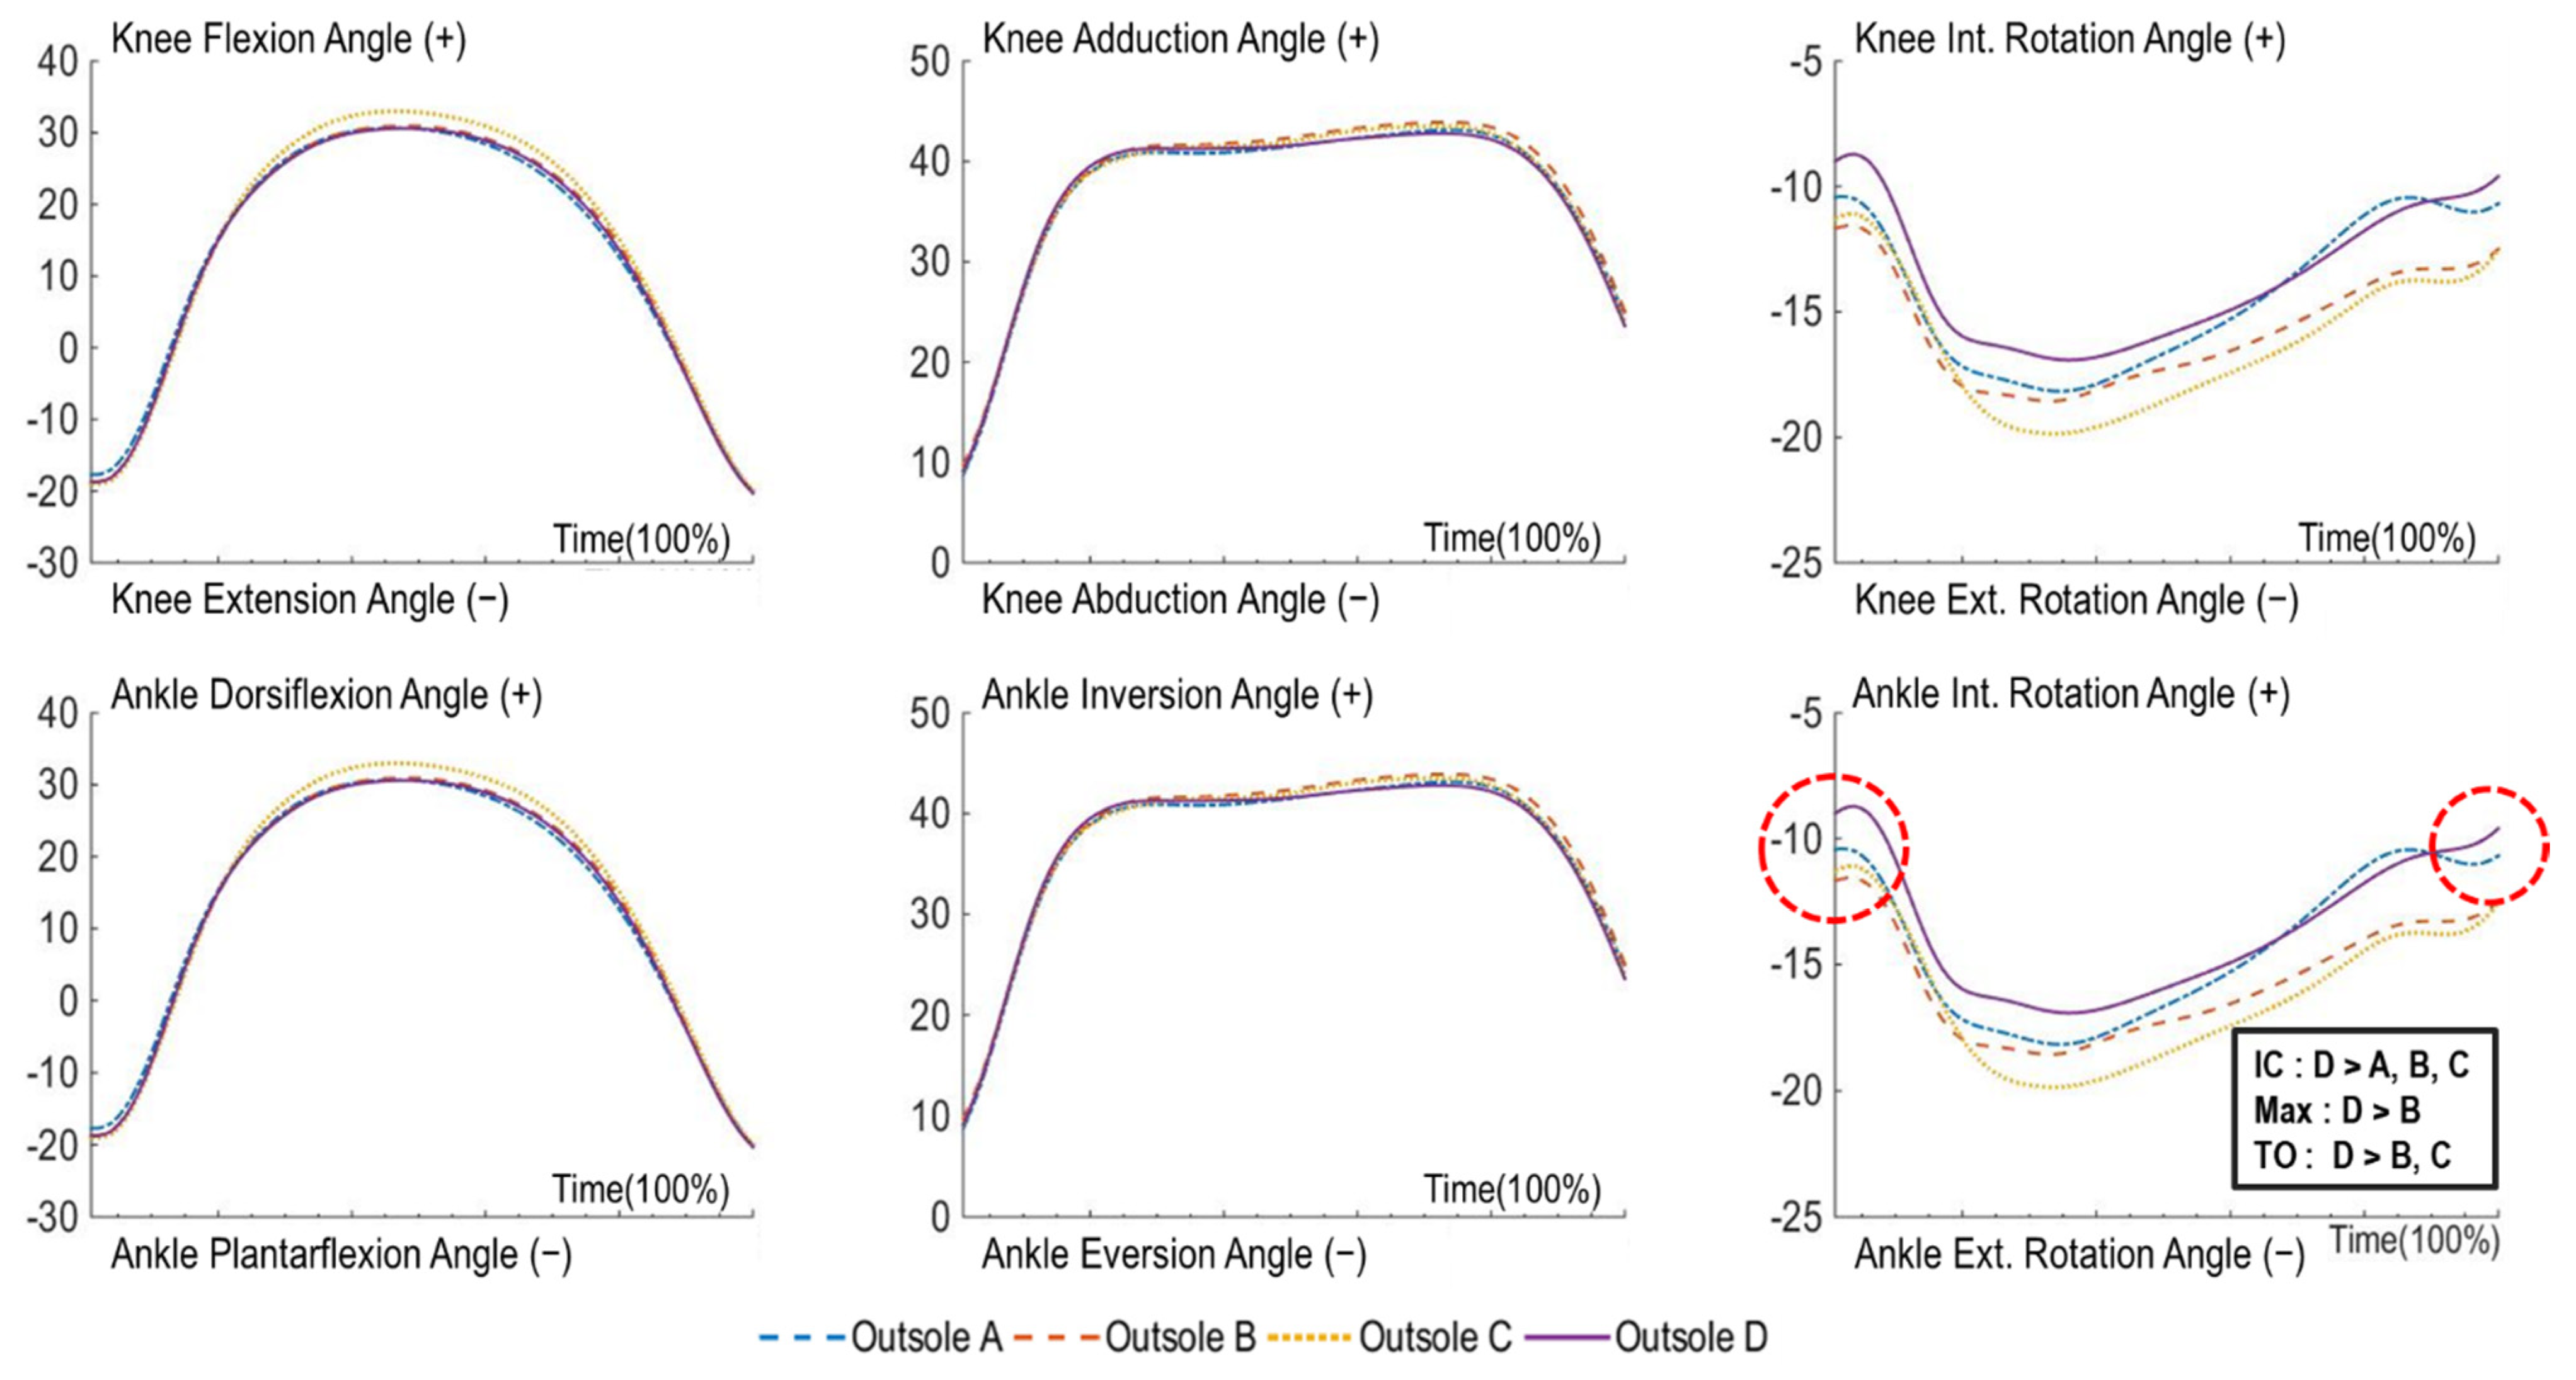
The ankle joint angle upon side braking motion showed statistically significant differences between outsole patterns at initial contact (A = −10.43 ± 5.34°, B = −11.69 ± 4.91°, C = −11.28 ± 4.61°, D = −9.00 ± 5.05°, F = 3.61, p = 0.03, η p 2 = 0.265, statistical power = 0.737) and take-off (A = −10.68 ± 6.9°, B = −12.5 ± 5.94°, C = −12.55 ± 5.72°, D = −9.6 ± 6.55°, F = 5.10, p = 0.01, η p 2 = 0.338, statistical power = 0.882), as well as the ankle’s minimum external rotation angle (A = −6.7 ± 6.71°, B = −8.56 ± 6.43°, C = −8.48 ± 5.6°, D = −6.03 ± 6.6°, F = 3.58, p = 0.03, η p 2 = 0.264, statistical power = 0.734) (Figure 5, Appendix A Table A2). As a result of the post hoc test, the external rotation angle (i.e., toe-out angle) in D was smaller than that in A, B, and C at initial contact. The external rotation angle of D was smaller than that of B and C at take-off from the ground. The minimum external rotation angle of D was smaller than that of B. There was no statistical difference between outsole patterns in the ankle and knee joint moments upon side braking motion (Table 4).

4. Discussion

This research examined the effects of tennis shoe outsole patterns on the frictional force, lower extremity joint angle, and lower extremity moment during tennis-specific movements. To this end, four tennis shoes were manufactured with different medial and lateral tread widths on the outsole. Furthermore, a mechanical test measured the frictional force of the tennis shoes, and a biomechanical analysis of forward and side braking motions was conducted for a biomechanical test. Mechanical tests can find significant differences in the frictional forces between the outsole patterns by controlling all parameters, such as velocity, vertical load, and the location of the force, but cannot embody natural movements [9,21]. It is a fact that the biomechanical test mimicking actual body movement is limited by difficulties in controlling all factors [21,40]. Likewise, researchers have attempted to perform mechanical and biomechanical analyses simultaneously to supplement the two measuring methods [2,41]. Therefore, this research carried out a mechanical and biomechanical analysis of natural movements.

4.1. Differences between Mechanical Frictional Force and Frictional Force upon Braking Motion between Outsole Patterns

As a result of the mechanical frictional force test, the maximum CoF showed statistically significant differences among all the tennis shoes. The rotational friction force showed statistically significant differences between the tennis shoes in a clockwise rotation; however, no statistical difference was revealed in a counterclockwise rotation. More specifically, the mechanical CoF depending on the forward motion was greater in the tennis shoes (A and B) consisting of a single pattern compared with the combined pattern (C, D), whereas the tennis shoes (B > A) with a thicker tread showed a high CoF. Depending on the side, the mechanical CoF was more significant in the tennis shoes (A and C) with thinner outer tread outsoles than thicker outer tread outsoles (B and D). This finding seems consistent with previous studies asserting that differences in tennis shoes’ frictional force exist depending on outsole patterns [6,18,19,42]. A difference of 0.6 mm in outsole tread width can have a considerable effect based on the mechanical frictional force test. From this aspect, outsole pattern and tread width are considered essential in professional sports footwear development. In the case of comparing two different tread widths of herringbone design by contrasting them to the outsole’s medial and lateral parts, there was difficulty in clearly comparing the size, direction, and pattern of frictional force. Further research on changing outsole patterns according to systematic criteria is needed.
In the mechanical frictional force test, differences in the frictional force were revealed between tennis shoes based on the direction of movements; however, frictional force in the forward and side braking motions did not show a statistical difference between tennis shoes. Generally, a frictional force is expressed as resistance against the horizontal motion on the vertical pressing (vertical load) between the ground and footwear outsole. In the mechanical frictional force test, the vertical load mass, center of pressure (CoP) position, and horizontal speed were constantly controlled. However, those variables are dynamically changed during a tennis game in forward and side braking motions. The cause of the lack of difference in frictional forces between tennis shoes during the actual motions (forward and side braking motions) may be related to the result of movement characteristics in the actual situation where perfect control is difficult to carry out, as in the previous studies [6,8] that reported how the frictional force could change depending on the contact area, pressure, speed, load, and direction.

4.2. Effects of Outsole Pattern on Forward and Side Braking Motions

As a result of examining the differences in the lower extremity joint angle between outsole patterns, there was no difference in the ankle and knee joint range of motion. However, tennis shoe D’s ankle joint external rotation angle (i.e., toe-out angle) was smaller than that of the other tennis shoes (A, B, C) in the forward and side braking motions at the moment of landing and taking off from the ground. Previous studies [14,16,35] have reported that differences in footwear frictional force can be adapted by lower extremity movement adjustment. A more internally rotated foot (i.e., toe-in) during the stance phase with tennis shoe D was observed, possibly due to the greater mechanical rotation frictional force (clockwise). According to the examination result of the lower extremity joint moment differences between outsole patterns, differences in the ankle joint’s maximum internal rotation moment between tennis shoes were found only in the forward braking motions. The acceleration, deceleration, and directional change motions in real tennis matches, which are major causes of joint ankle sprain, have been extensively discussed [2,19,23]. It has been suggested that ankle sprains are the most common injury to tennis players [43]. More specifically, 90% of ankle joint ligament injuries are caused by internal rotation movement, and it was reported that an increased footwear frictional force might be related to increased ankle joint load, inducing the risk of injury [19]. Based on the findings of the mechanical test, tennis shoe D had the largest rotational frictional force. Tennis shoe B showed a greater internal ankle joint moment during the biomechanical test. Whether the high mechanical frictional force in rotation of tennis shoe D or increased ankle joint load of tennis shoe B would induce a higher risk of ankle joint injuries than other tennis shoes during tennis games may require further investigation.

5. Conclusions

This research aimed to examine the effects of modified frictional force caused by the outsole patterns on biomechanical variables during tennis-specific movements. Through a mechanical test, significant frictional force differences were found, even with a 0.6 mm difference in the outsole tread width of tennis shoes. It may be questionable whether a smaller external rotational angle or toe-in position of the foot in the D-pattern tennis shoe is beneficial for higher tennis movement performance compared with the other tennis shoes. Regarding the risk of ankle injury between the shoes, tennis shoe B with thicker tread patterns showed a greater internal ankle moment than the other tennis shoes. In conclusion, investigating the proper range of frictional characteristics caused by the outsole patterns and their relationship to injury risk and athletic performance enhancement in tennis needs further investigation by footwear researchers and developers.

Author Contributions

Conceptualization, J.K. and S.-K.P.; investigation, J.K., S.R. and S.-K.P.; methodology, J.K., S.R., H.-J.G. and S.-K.P.; project administration, J.K., S.R., H.-J.G. and S.-K.P.; resources, J.K., S.R., H.-J.G. and S.-K.P.; validation, J.K., S.R., H.-J.G. and S.-K.P.; writing—original draft preparation, J.K., S.R. and S.-K.P.; writing—review and editing, J.K., S.R., H.-J.G. and S.-K.P. All authors have read and agreed to the published version of the manuscript.

Funding

This study is a part of Jaewon Kang’s Master’s thesis which was supported by Fila Holdings (Project Number: 05012022, Seoul, Republic of Korea).

Institutional Review Board Statement

This study was approved by the Institutional Review Board of Korea National Sport University (IRB Project Number: 1263-202106-HR-087-01).

Informed Consent Statement

Informed consent was obtained from all subjects involved in the study.

Data Availability Statement

Not applicable.

Conflicts of Interest

The authors declare no conflict of interest.

Appendix A

Table A1. Joint angles upon forward braking motion in a biomechanical analysis.
Kinematic Variables (Degree)Mean ± SDF (p)Post HocEffect SizeStatistical Power
ABCD
ICKneeFlexion15.93 ± 5.2916.13 ± 6.0216.87 ± 6.7016.69 ± 7.980.31 (0.82) 0.0300.103
Adduction2.74 ± 4.163.02 ± 2.803.53 ± 3.383.49 ± 3.400.72 (0.55) 0.0670.184
Int. Rot.0.12 ± 7.41−0.1 ± 6.70−1.15 ± 7.20−0.81 ± 5.060.48 (0.70) 0.0460.136
AnkleDorsiflexion−5.61 ± 13.83−0.85 ± 8.81−2.70 ± 9.60−4.27 ± 12.931.46 (0.25) 0.1280.347
Inversion3.69 ± 3.633.92 ± 4.583.46 ± 4.594.08 ± 4.110.22 (0.88) 0.0220.087
Int. Rot.−9.61 ± 4.61−10.64 ± 4.27−9.84 ± 5.17−8.08 ± 5.023.44 (0.03) *A,B>D0.2560.714
TOKneeFlexion9.36 ± 9.5110.43 ± 6.339.12 ± 6.029.62 ± 6.770.17 (0.91) 0.0170.078
Adduction2.53 ± 4.112.66 ± 3.863.15 ± 4.252.77 ± 4.360.91 (0.45) 0.0840.225
Int. Rot.1.07 ± 5.180.97 ± 4.221.14 ± 3.45−0.02 ± 4.900.32 (0.68) 0.0310.088
AnkleDorsiflexion−37.04 ± 6.52−37.52 ± 6.28−38.60 ± 4.46−38.57 ± 6.840.44 (0.73) 0.0420.127
Inversion16.04 ± 7.8116.76 ± 7.0115.27 ± 6.0115.19 ± 5.520.56 (0.65) 0.0530.151
Int. Rot.−0.74 ± 5.17−1.15 ± 4.25−0.81 ± 4.04−1.20 ± 3.693.67 (0.02) *A,B,C>D0.2680.745
MaxKneeFlexion57.23 ± 5.3658.32 ± 6.7658.02 ± 5.8459.16 ± 4.881.30 (0.29) 0.1150.312
Adduction4.39 ± 4.055.02 ± 3.225.49 ± 2.755.20 ± 3.461.38 (0.27) 0.1210.329
Int. Rot.16.11 ± 4.8015.79 ± 5.1815.76 ± 3.9515.27 ± 5.310.27 (0.85) 0.0260.096
AnkleDorsiflexion1.15 ± 5.121.94 ± 5.90−0.03 ± 5.530.52 ± 6.440.86 (0.47) 0.0790.214
Inversion23.61 ± 11.9324.56 ± 10.5322.29 ± 7.4321.76 ± 8.270.63 (0.55) 0.0590.140
Int. Rot.0.31 ± 4.08−0.02 ± 3.390.61 ± 3.542.01 ± 3.112.20 (0.15) 0.180.347
MinKneeFlexion6.94 ± 4.828.59 ± 4.996.80 ± 2.856.58 ± 4.502.21 (0.11) 0.1810.505
Adduction−7.56 ± 5.38−7.24 ± 5.74−6.79 ± 5.25−7.04 ± 5.170.32 (0.81) 0.0310.105
Int. Rot.−3.27 ± 6.20−3.69 ± 5.64−3.89 ± 5.35−4.24 ± 5.690.18 (0.91) 0.0170.079
AnkleDorsiflexion−39.17 ± 4.66−38.81 ± 4.84−39.78 ± 3.30−40.61 ± 3.291.75 (0.18) 0.1490.409
Inversion2.90 ± 4.663.18 ± 5.272.88 ± 4.863.66 ± 3.960.34 (0.80) 0.0330.108
Int. Rot.−15.77 ± 7.39−15.71 ± 5.77−14.62 ± 6.66−12.96 ± 6.875.24 (0.01) *A,B>D0.3440.891
RoMKneeFlexion50.29 ± 4.5349.73 ± 4.8751.22 ± 5.0252.57 ± 3.882.63 (0.07) 0.2080.585
Adduction11.95 ± 5.2112.26 ± 5.7512.28 ± 5.4512.24 ± 4.980.10 (0.96) 0.0100.066
Int. Rot.19.37 ± 5.1619.48 ± 4.5619.64 ± 4.6119.52 ± 5.010.02 (1.00) 0.0020.053
AnkleDorsiflexion40.32 ± 5.0040.74 ± 6.7639.75 ± 7.0241.13 ± 7.160.43 (0.73) 0.0410.126
Inversion20.72 ± 8.7821.38 ± 7.7219.41 ± 5.2418.10 ± 7.250.94 (0.39) 0.0850.172
Int. Rot.16.09 ± 4.2315.69 ± 3.0815.23 ± 4.1014.97 ± 4.340.79 (0.51) 0.0730.199
* Indicates a significant difference among the shoes at α = 0.05. IC: Initial Contact, TO: Toe off, RoM: Range of Motion.
Table A2. Joint angles upon side braking motion in a biomechanical analysis.
Kinematic Variables (Degree)Mean ± SDF (p)Post HocEffect SizeStatistical Power
ABCD
ICKneeFlexion24.00 ± 6.9223.18 ± 7.2222.88 ± 6.5323.24 ± 6.970.44 (0.83) 0.0420.127
Adduction−2.18 ± 3.55−1.83 ± 3.62−1.39 ± 3.76−1.61 ± 3.130.92 (0.44) 0.0840.227
Int. Rot.1.16 ± 5.360.63 ± 4.290.54 ± 5.730.44 ± 5.760.23 (0.87) 0.0230.089
AnkleDorsiflexion−17.72 ± 6.15−18.67 ± 5.82−18.98 ± 4.50−18.73 ± 5.520.70 (0.56) 0.0660.181
Inversion8.74 ± 3.299.68 ± 4.519.20 ± 3.749.17 ± 3.690.81 (0.50) 0.0750.204
Int. Rot.−10.43 ± 5.34−11.69 ± 4.91−11.28 ± 4.61−9.00 ± 5.053.61 (0.03) *A,B,C>D0.2650.737
TOKneeFlexion8.19 ± 6.958.22 ± 6.169.47 ± 6.518.75 ± 5.720.96 (0.42) 0.0880.236
Adduction0.01± 3.15−0.55 ± 3.05−0.02 ± 2.810.17 ± 2.931.90 (0.15) 0.1600.441
Int. Rot.−5.06 ± 6.44−5.51 ± 5.61−4.87 ± 5.65−5.42 ± 5.580.40 (0.75) 0.0380.120
AnkleDorsiflexion−20.00 ± 8.65−20.09 ± 6.00−19.86 ± 7.17−20.09 ± 8.270.10 (0.96) 0.0100.066
Inversion24.54 ± 4.6425.05 ± 4.0823.97 ± 5.5723.61 ± 3.671.01 (0.40) 0.0920.247
Int. Rot.−10.68 ± 6.90−12.50 ± 5.94−12.55 ± 5.72−9.60 ± 6.555.10 (0.01) *B,C>D0.3380.882
MaxKneeFlexion45.40 ± 5.6444.93 ± 5.4245.08 ± 6.3945.02 ± 6.010.06 (0.98) 0.0060.059
Adduction1.39 ± 3.290.91 ± 3.341.45 ± 3.521.85 ± 3.172.36 (0.09) 0.1910.533
Int. Rot.16.28 ± 4.0815.84 ± 3.9216.06 ± 4.1015.07 ± 3.651.06 (0.38) 0.0950.257
AnkleDorsiflexion31.71 ± 9.0331.75 ± 8.2133.53 ± 8.6231.33 ± 9.282.70 (0.06) 0.2130.597
Inversion44.00 ± 3.4544.81 ± 4.0144.59 ± 6.1443.76 ± 5.290.41 (0.75) 0.0400.122
Int. Rot.−6.70 ± 6.71−8.56 ± 6.43−8.48 ± 5.60−6.03 ± 6.603.58 (0.03) *B>D0.2640.734
MinKneeFlexion7.73 ± 6.728.09 ± 6.109.09 ± 6.328.33 ± 5.470.95 (0.43) 0.0860.233
Adduction−7.96 ± 3.36−8.35 ± 4.73−6.98 ± 3.56−7.08 ± 3.451.87 (0.16) 0.1580.436
Int. Rot.−5.63 ± 6.09−5.72 ± 5.40−5.34 ± 5.63−5.85 ± 5.490.18 (0.91) 0.0170.079
AnkleDorsiflexion−22.46 ± 6.00−21.52 ± 5.67−21.94 ± 5.11−23.00 ± 5.711.95 (0.14) 0.1630.451
Inversion8.74 ± 3.299.68 ± 4.519.20 ± 3.749.17 ± 3.690.81 (0.50) 0.0750.204
Int. Rot.−21.09 ± 6.00−21.54 ± 5.53−22.20 ± 5.63−19.56 ± 6.323.48 (0.08) 0.2580.458
RoMKneeFlexion37.67 ± 6.6736.84 ± 4.5135.99 ± 6.5536.69 ± 5.660.59 (0.63) 0.0550.156
Adduction9.36 ± 4.269.26 ± 3.538.42 ± 3.068.93 ± 3.480.95 (0.43) 0.0870.234
Int. Rot.21.92 ± 5.5021.56 ± 5.1621.40 ± 4.2920.92 ± 4.190.52 (0.67) 0.0500.144
AnkleDorsiflexion51.03 ± 6.2651.37 ± 5.7852.84 ± 6.8551.13 ± 5.641.56 (0.24) 0.1350.267
Inversion19.16 ± 5.3119.43 ± 4.8620.40 ± 5.2119.80 ± 5.850.84 (0.48) 0.0780.210
Int. Rot.10.20 ± 3.459.14 ± 2.839.73 ± 3.549.75 ± 3.831.02 (0.40) 0.0930.250
* Indicates a significant difference among the shoes at α = 0.05. IC: Initial Contact, TO: Toe off, RoM: Range of Motion.

References

  1. Reinschmidt, C.; Nigg, B.M. Current Issues in the Design of Running and Court Shoes. Sportverletz. Sportschaden 2000, 14, 72–81. [Google Scholar] [CrossRef]
  2. Lake, M.J. Determining the protective function of sports footwear. Ergonomics 2000, 43, 1610–1621. [Google Scholar] [CrossRef]
  3. Frederick, E. Physiological and ergonomics factors in running shoe design. Appl. Ergon. 1984, 15, 281–287. [Google Scholar] [CrossRef]
  4. Fales, C.W.; Stone, R.T.; Van Groningen, D.; Westby, B. Tread Patterns and the Effect on Basketball Player Slippage. In Proceedings of the Human Factors and Ergonomics Society Annual Meeting, 5–9 October 2020; Volume 64, pp. 1328–1332. [Google Scholar] [CrossRef]
  5. Werd, M.B.; Knight, E.L.; Langer, P.R. Athletic Footwear and Orthoses in Sports Medicine; Springer: Berlin/Heidelberg, Germany, 2000. [Google Scholar]
  6. Valiant, G.A. Friction—Slipping—Traction. Sportverletz. Sportschaden 1993, 7, 171–178. [Google Scholar] [CrossRef] [PubMed]
  7. Worobets, J.T.; Panizzolo, F.; Hung, S.; Wannop, J.W.; Stefanyshyn, D.J. Increasing Running Shoe Traction Can Enhance Performance. Res. J. Text. Appar. 2014, 18, 17–22. [Google Scholar] [CrossRef]
  8. Shorten, M.; Hudson, B.; Himmelsbach, J. Shoe-surface traction of conventional and in-filled synthetic turf football surfaces. In Proceedings of the XIX International Congress on Biomechanics, Dunedin, New Zealand, 21–25 August 2003. [Google Scholar]
  9. Luo, G.; Stefanyshyn, D. Identification of critical traction values for maximum athletic performance. Footwear Sci. 2011, 3, 127–138. [Google Scholar] [CrossRef]
  10. Severn, K.A.; Fleming, P.R.; Dixon, N. Science of synthetic turf surfaces: Player–surface interactions. Sports Technol. 2010, 3, 13–25. [Google Scholar] [CrossRef]
  11. Strandberg, L.; Lanshammar, H. The dynamics of slipping accidents. J. Occup. Accid. 1981, 3, 153–162. [Google Scholar] [CrossRef]
  12. Pedroza, A.; Fernandez, S.; Heidt, R., Jr.; Kaeding, C. Evaluation of the Shoe-Surface Interaction Using an Agility Maneuver. Med. Sci. Sports Exerc. 2010, 42, 1754–1759. [Google Scholar] [CrossRef]
  13. Andreasson, G.; Lindenberger, U.; Renström, P.; Peterson, L. Torque developed at simulated sliding between sport shoes and an artificial turf. Am. J. Sports Med. 1986, 14, 225–230. [Google Scholar] [CrossRef] [PubMed]
  14. Damm, L.C.; Low, D.; Richardson, A.; Clarke, J.; Carré, M.; Dixon, S. The effects of surface traction characteristics on frictional demand and kinematics in tennis. Sports Biomech. 2013, 12, 389–402. [Google Scholar] [CrossRef] [PubMed]
  15. Nigg, B.M.; Stefanyshyn, D.J.; Rozitis, A.I.; Mündermann, A.; Muendermann, A. Resultant knee joint moments for lateral movement tasks on sliding and non-sliding sport surfaces. J. Sports Sci. 2009, 27, 427–435. [Google Scholar] [CrossRef]
  16. Nigg, B.M.; Yeadon, M.R. Biomechanical aspects of playing surfaces. J. Sports Sci. 1987, 5, 117–145. [Google Scholar] [CrossRef]
  17. Worobets, J.; Wannop, J.W. Influence of basketball shoe mass, outsole traction, and forefoot bending stiffness on three athletic movements. Sports Biomech. 2015, 14, 351–360. [Google Scholar] [CrossRef]
  18. Ismail, S.I.; Nunome, H.; Tamura, Y. Does visual representation of futsal shoes outsole tread groove design resemblance its mechanical traction, dynamic human traction performance, and perceived traction during change of direction and straight sprint tasks? Footwear Sci. 2021, 13, 79–89. [Google Scholar] [CrossRef]
  19. Wannop, J.W.; Worobets, J.T.; Stefanyshyn, D.J. Footwear Traction and Lower Extremity Joint Loading. Am. J. Sports Med. 2010, 38, 1221–1228. [Google Scholar] [CrossRef]
  20. Müller, C.; Sterzing, T.; Lange, J.; Milani, T.L. Comprehensive evaluation of player-surface interaction on artificial soccer turf. Sports Biomech. 2010, 9, 193–205. [Google Scholar] [CrossRef]
  21. Sterzing, T.; Müller, C.; Schwanitz, S.; Odenwald, S.; Milani, T.L. Discrepancies between mechanical and biomechanical measurements of soccer shoe traction on artificial turf. In Proceedings of the ISBS-Conference Proceedings Archive, Seoul, Republic of Korea, 14–18 July 2008. [Google Scholar]
  22. Driscoll, H.; Kirk, B.; Koerger, H.; Haake, S. Influence of outsole design on centre of rotation during turning movements. Procedia Eng. 2012, 34, 301–306. [Google Scholar] [CrossRef]
  23. Girard, O.; Eicher, F.; Fourchet, F.; Micallef, J.P.; Millet, G.P. Effects of the playing surface on plantar pressures and potential injuries in tennis. Br. J. Sports Med. 2007, 41, 733–738. [Google Scholar] [CrossRef] [Green Version]
  24. Pavailler, S.; Horvais, N. Sliding Allows Faster Repositioning during Tennis Specific Movements on Hard Court. Procedia Eng. 2014, 72, 859–864. [Google Scholar] [CrossRef]
  25. Starbuck, C.; Damm, L.; Clarke, J.; Carré, M.; Capel-Davis, J.; Miller, S.; Stiles, V.; Dixon, S. The influence of tennis court surfaces on player perceptions and biomechanical response. J. Sports Sci. 2016, 34, 1627–1636. [Google Scholar] [CrossRef] [PubMed]
  26. ITF. Surface Types. Available online: https://www.itftennis.com/media/2169/surfaces-surface-types.pdf (accessed on 6 November 2022).
  27. Damm, L.; Starbuck, C.; Stocker, N.; Clarke, J.; Carré, M.; Dixon, S. Shoe-surface friction in tennis: Influence on plantar pressure and implications for injury. Footwear Sci. 2014, 6, 155–164. [Google Scholar] [CrossRef]
  28. Clarke, J.; Dixon, S.J.; Damm, L.; Carré, M.J. The effect of normal load force and roughness on the dynamic traction developed at the shoe–surface interface in tennis. Sports Eng. 2013, 16, 165–171. [Google Scholar] [CrossRef]
  29. Miller, S. Modern tennis rackets, balls, and surfaces. Br. J. Sports Med. 2006, 40, 401–405. [Google Scholar] [CrossRef]
  30. Goff, J.E.; Boswell, L.; Ura, D.; Kozy, M.; Carré, M.J. Critical shoe contact area ratio for sliding on a tennis hard court. Proc. Inst. Mech. Eng. Part P: J. Sports Eng. Technol. 2017, 232, 112–121. [Google Scholar] [CrossRef]
  31. Ura, D.; Clarke, J.; Carre, M. Effect of shoe orientation on shoe-surface traction in tennis. Footwear Sci. 2013, 5, S86–S87. [Google Scholar] [CrossRef]
  32. Monnet, T.; Domalain, M.; Decatoire, A.; Horvais, N.; Lacouture, P. Sliding on hardcourt surface with specific shoes, prelim-inary results. In Proceedings of the ISBS-Conference Proceedings Archive, Johnson City, TN, USA, 12–16 July 2014. [Google Scholar]
  33. Kovacs, M.S. Movement for Tennis: The Importance of Lateral Training. Strength Cond. J. 2009, 31, 77–85. [Google Scholar] [CrossRef]
  34. Wannop, J.W.; Stefanyshyn, D.J. The effect of translational and rotational traction on lower extremity joint loading. J. Sports Sci. 2016, 34, 613–620. [Google Scholar] [CrossRef]
  35. Hamill, J. Evaluating sport shoes using ground reaction force data. In Proceedings of the ISBS-Conference Proceedings Archive, Madeira, Portugal, 25–29 July 1996. [Google Scholar]
  36. Frederick, E.C. Optimal frictional properties for sport shoes and sport surfaces. In Proceedings of the ISBS-Conference Proceedings Archive, Amherst, MA, USA, 23–26 June 1993. [Google Scholar]
  37. Frederick, E. Kinematically mediated effects of sport shoe design: A review. J. Sports Sci. 1986, 4, 169–184. [Google Scholar] [CrossRef]
  38. Hamill, J.; Ryu, J. Experiment in Sport Biomechanics; Daehanmedia: Seoul, Republic of Korea, 2003. [Google Scholar]
  39. Winter, D.A. Chapter 9: Kinesiological Electromyography. In Biomechanics and Motor Control of Human Movement, 4th ed.; Winter, D.A., Ed.; John Wiley & Sons, Inc.: Hoboken, NJ, USA, 2005. [Google Scholar]
  40. Lindsey, C. Tennis Shoe Traction-Developing a Test Rig to Measure Shoe Traction on Tennis Courts. Available online: https://twu.tennis-warehouse.com/learning_center/traction.php (accessed on 6 November 2022).
  41. Nigg, B.M. The validity and relevance of tests used for the assessment of sports surfaces. Med. Sci. Sports Exerc. 1990, 22, 131–139. [Google Scholar] [CrossRef] [PubMed]
  42. Bonstingl, R.W.; Morehouse, C.A.; Niebel, B.W. Torques developed by different types of shoes on various playing surfaces. Med. Sci. Sports 1975, 7, 127–131. [Google Scholar] [CrossRef] [PubMed]
  43. Kibler, W.B.; Safran, M. Tennis Injuries. Med. Sport Sci. 2005, 48, 120–137. [Google Scholar] [CrossRef] [PubMed] [Green Version]
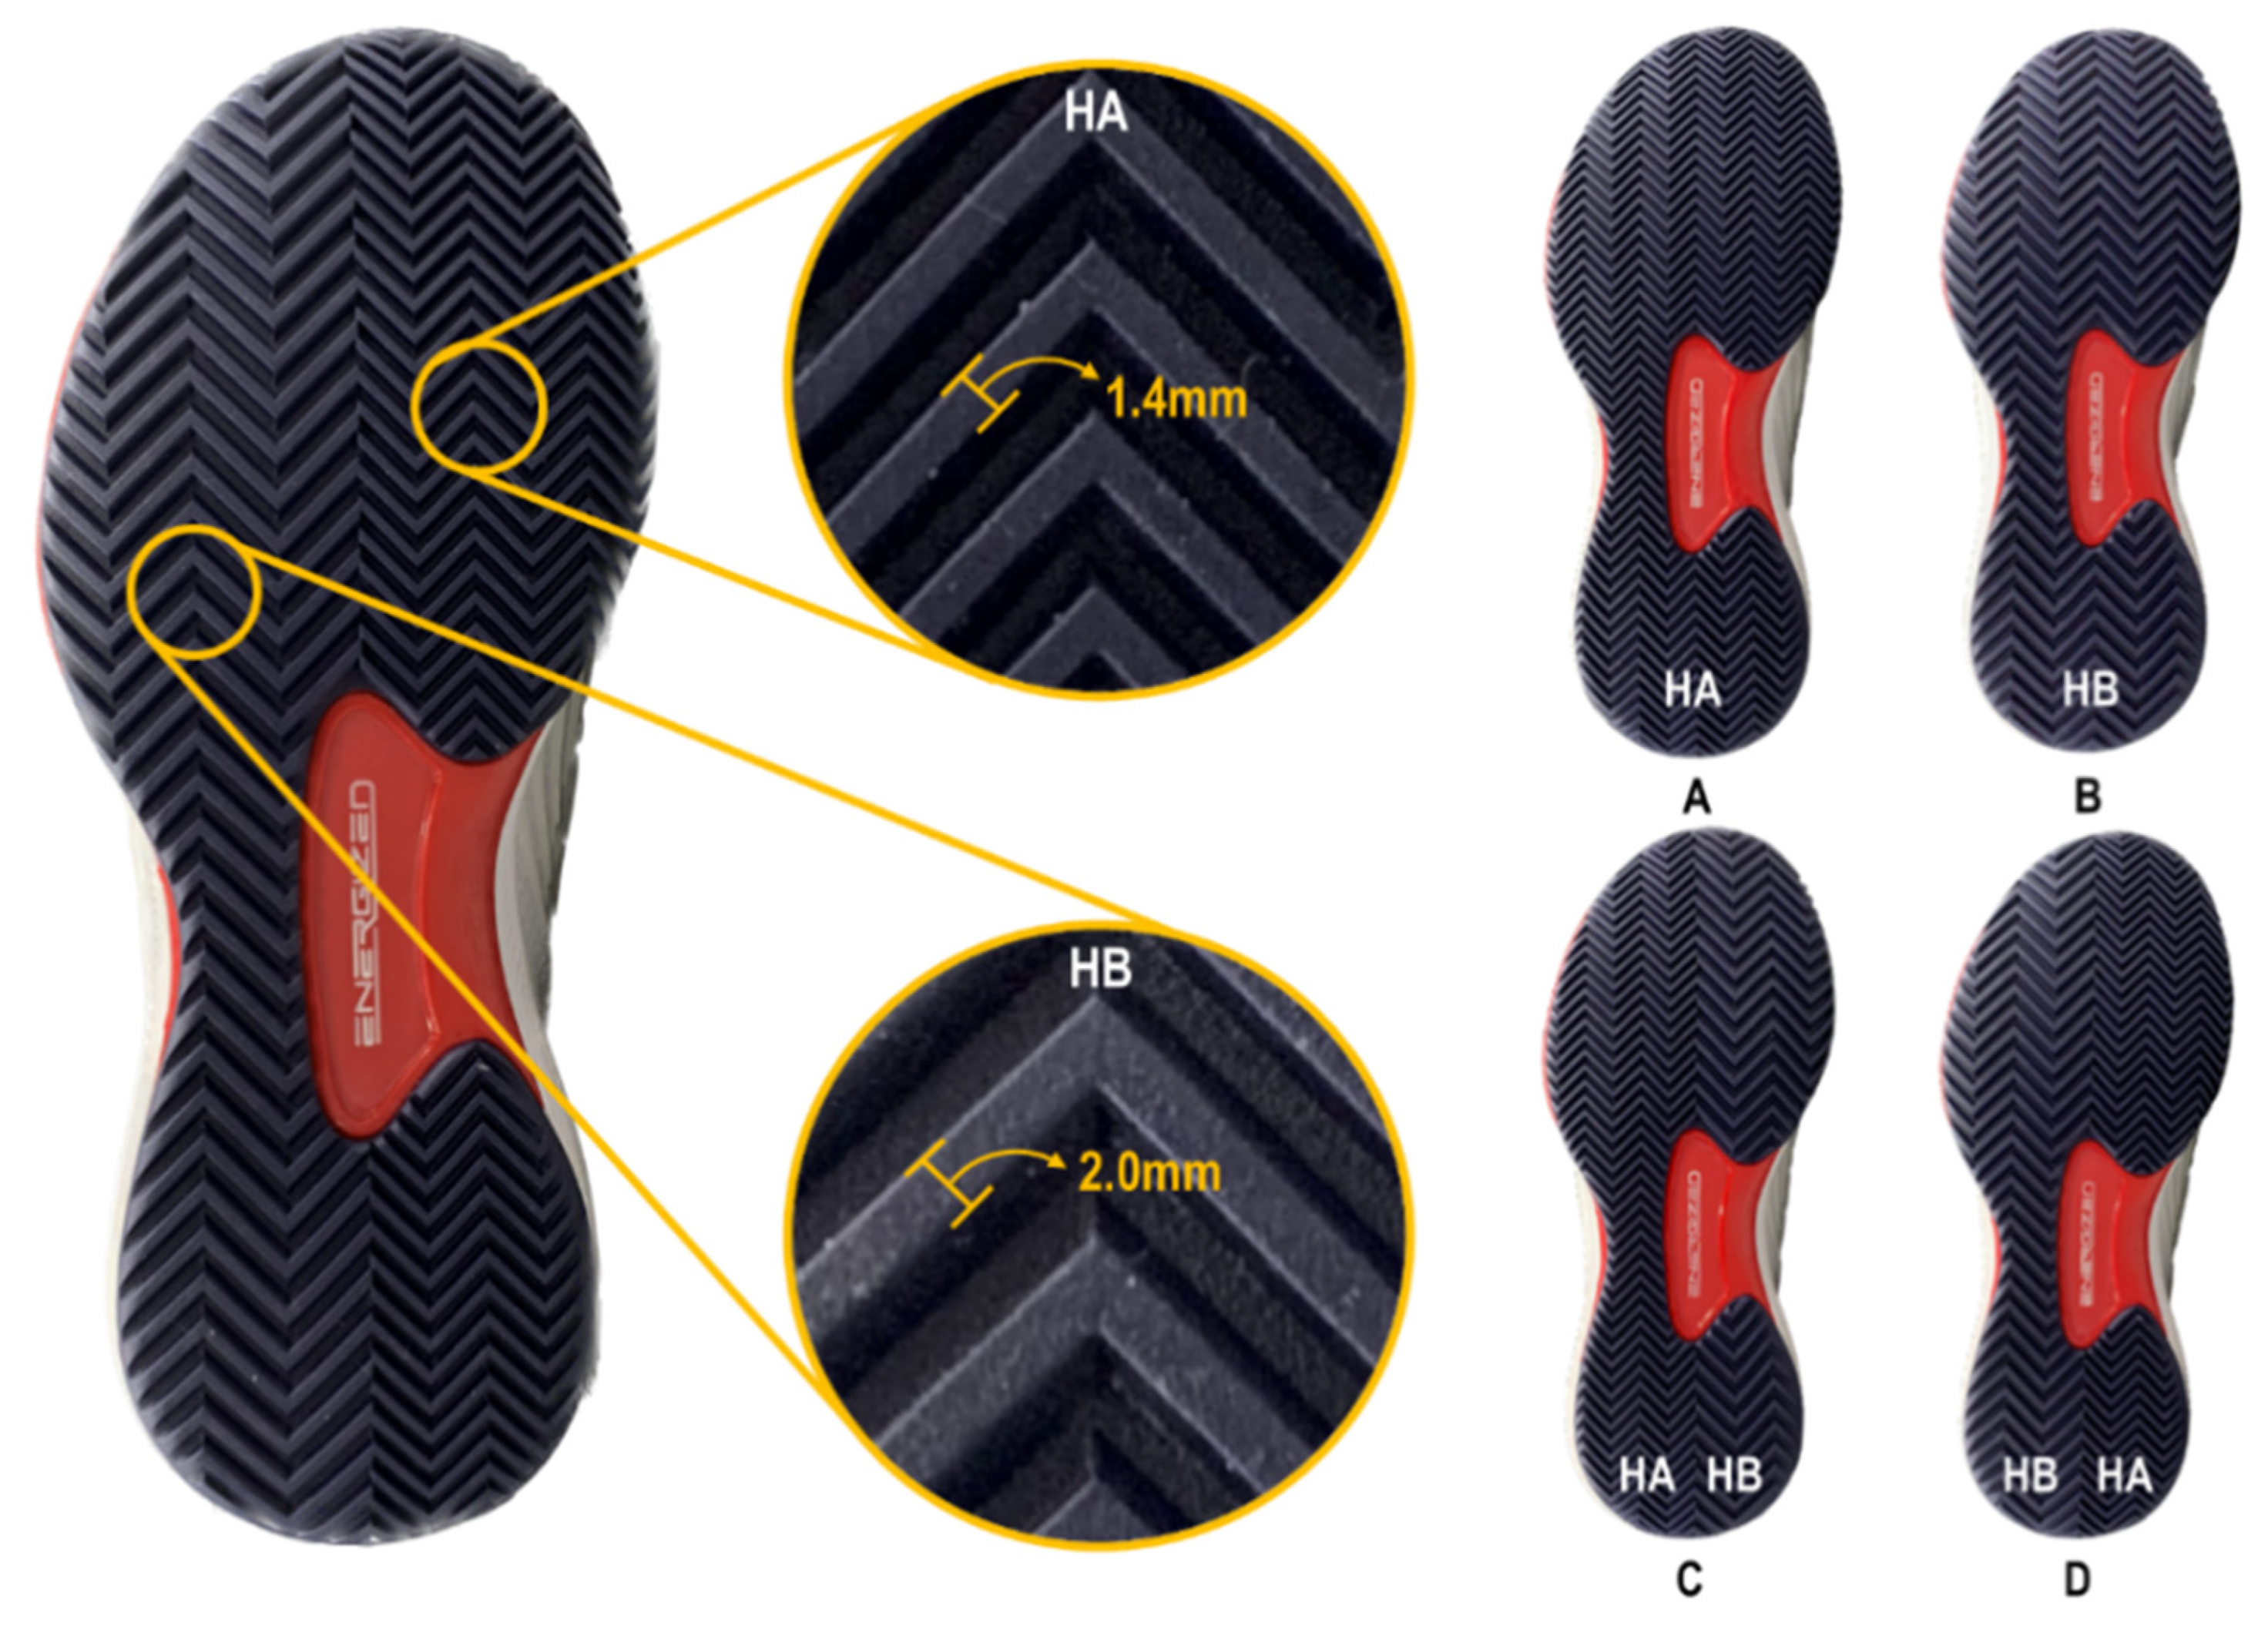
Figure 1. Different widths of outsole pattern and tennis shoes (AD).
Applsci 13 02342 g001
Figure 2. Frictional force measurement and measurement direction through mechanical test. ((A): Applied Vertical load of the mechanical test, (B): Direction of CoF and rotational frictional force of shoes through mechanical test).
Applsci 13 02342 g002
Figure 3. (A) Forward braking motion and (B) Side braking motion (sidestep). (Arrows indicate the direction of movement).
Applsci 13 02342 g003
Figure 4. Knee and ankle joints’ angles (mean of 11 participants) upon forward braking motion. IC: initial contact, Min.: minimum joint angle, TO: toe off. (Dotted red circles represent the significant difference among the outsole tread patterns).
Applsci 13 02342 g004
Figure 5. Knee and ankle joints’ angle patterns (mean of 11 participants) upon side braking motion. IC: initial contact, Max: maximum joint angle, TO: toe off. (Dotted red circles represent the significant difference among the outsole tread patterns).
Applsci 13 02342 g005
Table 1. Frictional force by direction depending on the outsole pattern upon mechanical test.
Mechanical FrictionMean ± SDF (p)Post-HocEffect SizeStatistical Power
ABCD
Forward CoF (μ)0.77 ± 0.010.78 ± 0.010.73 ± 0.010.74 ± 0.01158.55 (0.01) *B>A>D>C0.9461.000
Sideward CoF (μ)0.84 ± 0.010.82 ± 0.010.83 ± 0.010.82 ± 0.0124.48 (0.01) *A,C>D>B0.7311.000
C-RF (Nm)29.18 ± 1.3729.84 ± 1.2129.58 ± 0.9430.76 ± 1.094.10 (0.02) *D>A,C0.3130.789
CC-RF (Nm)27.92 ± 2.1927.31 ± 1.7928.51 ± 2.5429.62 ± 2.841.84 (0.16) 0.1700.423
* Indicates a significant difference among the shoes at α = 0.05. RF: Rotational Friction, C: Clockwise, CC: Counterclockwise.
Table 2. Frictional force depending on outsole pattern upon motion in a biomechanical analysis.
Biomechanical FrictionMean ± SDF (p)Post HocEffect SizeStatistical Power
ABCD
Forward BrakingMax CoF (μ)0.91 ± 0.070.90 ± 0.080.90 ± 0.110.92 ± 0.100.92 (0.45) 0.0840.226
Max RF (Nm)3.66 ± 2.492.81 ± 1.683.57 ± 1.984.21 ± 3.650.76 (0.40) 0.0710.124
Min RF (Nm)−28.49 ± 6.74−28.12 ± 7.34−27.27 ± 6.40−29.46 ± 8.150.40 (0.75) 0.0390.120
Side BrakingMax CoF (μ)0.94 ± 0.030.92 ± 0.050.93 ± 0.060.92 ± 0.060.94 (0.43) 0.0860.232
Max RF (Nm)12.35 ± 5.7213.27 ± 7.5512.37 ± 7.2112.55 ± 4.780.10 (0.96) 0.0100.066
Min RF(Nm)−14.28 ± 5.41−13.40 ± 5.84−13.78 ± 7.43−14.82 ± 4.900.32 (0.68) 0.0310.089
RF: Rotational Friction.
Table 3. Maximum joint moments upon forward braking motion in a biomechanical analysis.
Maximum Moment (Nm/kg)Mean ± SDF (p)Post HocEffect SizeStatistical Power
ABCD
KneeFlexion Moment1.79 ± 0.731.92 ± 0.631.84 ± 0.641.94 ± 0.880.31 (0.82) 0.0300.103
Extension Moment1.71 ± 0.281.65 ± 0.371.70 ± 0.37−1.65 ± 0.340.22 (0.76) 0.0220.077
Adduction Moment1.59 ± 0.851.62 ± 0.801.49 ± 0.621.56 ± 0.820.31 (0.71) 0.0300.091
Abduction Moment0.37 ± 0.310.34 ± 0.190.33 ± 0.28−0.33 ± 0.300.55 (0.65) 0.0520.150
Int. Rot. Moment0.40 ± 0.280.41 ± 0.270.42 ± 0.280.39 ± 0.280.21 (0.89) 0.0200.084
Ext. Rot. Moment0.43 ± 0.360.42 ± 0.310.43 ± 0.25−0.43 ± 0.370.01 (1.00) 0.0010.050
AnkleDorsiflexion Moment0.41 ± 0.250.48 ± 0.140.48 ± 0.130.41 ± 0.201.58 (0.22) 0.1360.372
Plantarflexion Moment1.60 ± 0.381.55 ± 0.231.55 ± 0.201.58 ± 0.270.35 (0.66) 0.0340.092
Inversion Moment0.18 ± 0.140.13 ± 0.120.15 ± 0.150.17 ± 0.151.07 (0.38) 0.0970.260
Eversion Moment0.51 ± 0.310.54 ± 0.300.54 ± 0.310.55 ± 0.290.64 (0.60) 0.0600.167
Int. Rot. Moment0.34 ± 0.110.37 ± 0.100.31 ± 0.090.36 ± 0.133.04 (0.04) *B>C0.2330.654
Ext. Rot. Moment0.11 ± 0.100.10 ± 0.060.10 ± 0.070.09 ± 0.060.58 (0.52) 0.0550.119
* Indicates a significant difference among the shoes at α = 0.05.
Table 4. Maximum joint moments upon aide braking motion in a biomechanical analysis.
Maximum Moment (Nm/kg)Mean ± SDF (p)Post HocEffect SizeStatistical Power
ABCD
KneeFlexion Moment0.83 ± 0.230.79 ± 0.230.81 ± 0.180.80 ± 0.230.25 (0.86) 0.0240.092
Extension Moment2.49 ± 0.562.47 ± 0.752.54 ± 0.792.50 ± 0.730.20 (0.90) 0.0200.083
Adduction Moment1.73 ± 0.461.78 ± 0.421.76 ± 0.461.77 ± 0.390.17 (0.91) 0.0170.078
Abduction Moment0.23 ± 0.070.20 ± 0.060.22 ± 0.080.21 ± 0.061.26 (0.31) 0.1120.302
Int. Rot. Moment0.09 ± 0.100.09 ± 0.110.10 ± 0.080.09 ± 0.090.15 (0.83) 0.0140.068
Ext. Rot. Moment0.56 ± 0.200.60 ± 0.200.56 ± 0.130.59 ± 0.150.62 (0.61) 0.0580.164
AnkleDorsiflexion Moment0.01 ± 0.010.00 ± 0.010.01 ± 0.030.01 ± 0.011.81 (0.21) 0.1530.259
Plantarflexion Moment3.47 ± 1.013.57 ± 1.013.62 ± 0.993.48 ± 0.901.34 (0.28) 0.1180.319
Inversion Moment0.20 ± 0.190.21 ± 0.190.21 ± 0.170.18 ± 0.151.09 (0.37) 0.0980.264
Eversion Moment0.30 ± 0.150.34 ± 0.210.31 ± 0.160.35 ± 0.240.80 (0.51) 0.0740.201
Int. Rot. Moment0.19 ± 0.050.19 ± 0.060.20 ± 0.070.19 ± 0.050.16 (0.92) 0.0160.077
Ext. Rot. Moment0.21 ± 0.170.22 ± 0.180.20 ± 0.150.18 ± 0.110.68 (0.57) 0.0640.177
Disclaimer/Publisher’s Note: The statements, opinions and data contained in all publications are solely those of the individual author(s) and contributor(s) and not of MDPI and/or the editor(s). MDPI and/or the editor(s) disclaim responsibility for any injury to people or property resulting from any ideas, methods, instructions or products referred to in the content.