Abstract
The ongoing reading process of digital meters is time-consuming and prone to errors, as operators capture images and manually update the system with the new readings. This work proposes to automate this operation through a deep learning-powered solution for universal controllers and flow meters that can be seamlessly incorporated into operators’ existing workflow. Firstly, the digital display area of the equipment is extracted with a screen detection module, and a perspective correction step is performed. Subsequently, the text regions are identified with a fine-tuned EAST text detector, and the important readings are selected through template matching based on the expected graphical structure. Finally, a fine-tuned convolutional recurrent neural network model recognizes the text and registers it. Evaluation experiments confirm the robustness and potential for workload reduction of the proposed system, which correctly extracts 55.47% and 63.70% of the values for reading in universal controllers, and 73.08% of the values from flow meters. Furthermore, this pipeline performs in real time in a low-end mobile device, with an average execution time in preview of under 250 ms for screen detection and on an acquired photo of 1500 ms for the entire pipeline.
1. Introduction
The automatic reading of water treatment station digital equipment is an emerging need for the real-time monitoring of important parameters related to the oxidation–reduction potential (ORP), dissolved oxygen (OD) and flow rate. The reading process is typically performed manually on-site by operators who register the values and later insert them into the company’s system. This operation is prone to errors, time-consuming and has low efficiency. Moreover, no photo is stored in the system for evidence. Although one possibility can be the replacement of the devices with a digital version capable of transmitting the readings, it involves unnecessary costs besides not contributing to the sustainability of the current devices, so automation is the key to optimizing this task by making it easier, more effective and auditable. Artificial intelligence (AI) has increasing potential to enhance the integration of knowledge on the ground by providing tools to operators which facilitate performing maintenance work.
The task of automatic reading of digital equipment is frequently addressed by a process named automatic meter reading (AMR). In recent years, many AMR approaches have been proposed in the literature, typically comprising the detection of the reading area and optical character recognition (OCR). In OCR, a text localization algorithm is applied to the reading area, and the text provided by the detector is recognized.
The dominant trend for AMR nowadays is using deep learning-based algorithms. Laroca et al. [1] proposed a convolutional neural network (CNN)-based two-stage approach that employs the Fast-YOLO [2] object detector for counter detection and tests three different methodologies for number recognition: CR-NET [3], multi-task learning and convolutional recurrent neural network (CRNN) [4]. The authors also took advantage of data augmentation to balance the data and increase robustness. The Fast-YOLO model successfully detected the counter in all images and, for counter recognition, CR-NET outperformed both multi-task and CRNN models. Laroca et al. [5] proposed an AMR pipeline comprising the two previously mentioned stages and introduced a new corner-detection and counter-classification module with the aim to rectify the detected counter as well as rejecting illegible meters, prior to the recognizer module. Their approach describes impressive end-to-end recognition rates when dismissing the readings made with lower confidence values. Zhou et al. [6] developed a highly robust deep learning method for reading recognition of the digital multimeter. Firstly, the digital display area is detected with the YOLOv5 model [7], followed by performing character segmentation based on the prior knowledge that the display accommodates five character areas. The combination of the output from a CNN character recognition model for each area (0–9 numbers, negative signs and blanks) with decimal point positioning results produces the complete reading information. This method reaches very high accuracy values and is able to adapt to complex environments; however, it does not work for other types of equipment. Gómez et al. [8] presented a different approach by training an end-to-end CNN to directly issue meter readings without locating the relevant text. Although the authors reported promising results, this approach was tested on close-up images with the counter centered.
This work is developed in the scope of the SINATRA project that aims to provide new insights and develop a support solution for Industry 4.0. This work aims to improve the reliability and traceability of meter readings, while reducing human effort through the usage of a simple mobile application running on edge devices in real-time. We propose a new AI-based framework that supports intelligent data acquisition and provides automated detection and recognition of digits on the counter. A standard AMR approach is followed by first identifying the screen of the equipment and then extracting the values that must be tracked. The main contributions of this paper may be summarized as follows:
- Developing a robust end-to-end system capable of detecting the display area and extracting relevant information in real time.
- Producing an easy-to-use support solution for Industry 4.0, specifically for the digitalization of maintenance processes, which could optimize the human resources effort and reduce errors.
2. Materials and Methods
2.1. Dataset
The dataset used in this work, named SINATRA, comprises digital meter images acquired by different mobile devices in a series of visits from November 2021 to November 2022 to the company Águas e Energia do Porto, EM (AEdP). There are two distinct types of equipment that display different information: the HACH Sc200 universal controller (UC) and the Krohne UFC 300 flow meter (FM). The first presents four values, from which ORP and OD values must be extracted, while the flow rate is shown in the latter. The pictures were captured by the authors and different operators at different angles and at different times of the day. Furthermore, the distance of acquisition to the equipment varies according to its location and depending on the position which best suits the operator. All photos taken are approximately 1 meter from the device. However, since zoom is available, the operators can use it further away (which means that the picture will have lower quality). This way, we ensured variability in terms of lighting, perspective and distance. In Figure 1, it is possible to observe examples of normal pictures ((a), (d) and (f)), pictures taken with too much light (b), dark (c) and also in perspective view (e). Some samples with poorer imaging conditions, such as blur, dirt, glare or reflections, were also included in the dataset. For image acquisition, we used different mobile devices: Samsung Tab Active3 (SM-T575), Xiaomi M11 (M2011K2G), Poco X3 (M2007J20CG), Samsung S20 FE (SM-G781B/DS), Samsung Tab S7 (SM-T870, iPhone SE 2020 (A2296) and iPad Pro (MHQR3TY/A). The devices have cameras that range from 12 to 108 Megapixels, creating images with resolutions of 1920 by 1080 or 3840 by 2160 and apertures between f1/8 and f2/0. There are no other relevant features of the devices that have implications for the population of the dataset.
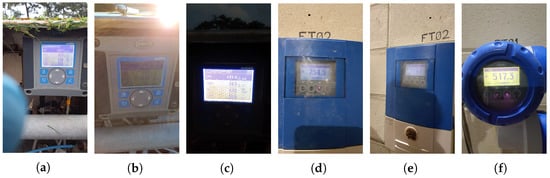
Figure 1.
Examples from the SINATRA dataset at different acquisition conditions. (a) Normal, (b) Daylight, (c) Dark, (d) Normal, (e) Perspective, (f) Normal.
The dataset distribution is described in Table 1. The test images correspond to images acquired by operators. The ratio between images from UC and FM is considerably different in the test set because the first is located outside, which means that it is necessary to capture more images in different acquisition conditions to evaluate the robustness of the reading pipeline.

Table 1.
SINATRA dataset: train and test set distribution.
The dataset is manipulated for training each of the steps of the pipeline. For screen detection, the raw images are cropped to a square at the center (with a width equal to 90% of the shortest side), and their respective ground truth annotations are used. For text detection, the annotations are performed on images containing only the screen with a corrected perspective, while text recognition uses images of text regions. Note that not all of the images in the training dataset are used to train each module. Illustrative examples are shown in Figure 2.
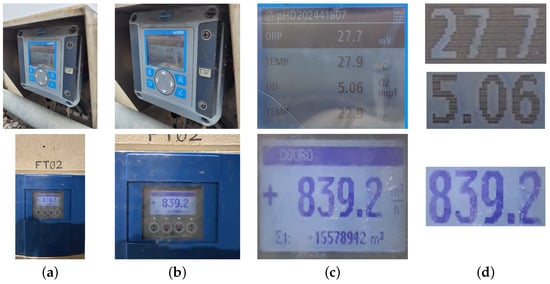
Figure 2.
Examples of input images of each step of the proposed pipeline: (a) original input image, (b) central cropped images that will serve as input for screen detection, (c) perspective corrected image after keypoint detection, (d) text regions obtained after text detection and template matching.
2.2. Automatic Meter Reading Pipeline
The pipeline proposed for the automatic digital meter reading system (Figure 3) is divided into three modules:
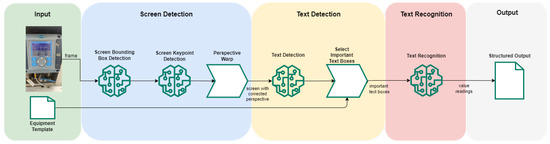
Figure 3.
Pipeline of the automatic digital meter reading system.
- Screen detection is composed of two steps: firstly, a model that detects a box containing approximately the screen of the equipment (screen bounding box detection); followed by a model to detect keypoints that correspond to the corners of the equipment’s screen (screen keypoint detection) is employed. The detected screen is then projected onto the normal plane.
- Text detection, where the regions that contain text are detected. Considering that the objective of this system is to extract specific values, the selection of important information is performed by using an equipment template with its expected position, in a template-matching step.
- Text recognition, in which the text from the important regions is extracted.
All experiments were conducted on a virtual machine (VM) with two AMD EPYC 7302 and six virtualized CPU cores, 16 GB of RAM, and one shared NVIDIA A16-8C with 8 GB of VRAM available per user.
2.2.1. Screen Detection
The first module of the system receives the mobile-acquired images, crops a central square with a length equal to 90% of the shortest side, and detects the equipment’s screen, enabling it to be extracted and projected onto a normal plane, as described above. The chosen approach is firstly based on a model that roughly detects a bounding box containing the screen. The detection is only accepted if the following requirements are satisfied: the confidence score is higher than 70%, the bounding box is not located on the corners of the image, and its ratio is within the range . If all conditions are met, a tolerance margin is added to this detected screen to face possible inaccuracies, and then a keypoint detection model is used to locate the corners of the screen.
The model for screen bounding box detection was built with the TensorFlow Object Detection API. This tool provides several models with different architectures pre-trained on public datasets. As we aim to develop a model suitable for integration in low-end devices, the SSD MobileNetv2 [9] model pre-trained on the COCO [10] dataset is chosen due to the trade-off between the number of parameters, speed and performance. This model is trained on this work’s dataset, returning the detection boxes and corresponding confidence scores. The input images are automatically resized to .
For keypoint detection, we implement a model based on the same backbone (MobileNetV2), from which image features are extracted and connected to four convolutional layers which calculate a regression that fits the coordinates of the desired points. Randomness is provoked in the position of the screen in order to introduce variability. We fine-tune the model by freezing the backbone layers and only training the regression layers. This model takes images sized as input and returns the x and y coordinates of the screen corners.
In non-ideal conditions of acquisition, the screen can assume distinct quadrilateral shapes (for example trapeziums). To overcome this, a perspective correction (perspective warp) methodology is employed to ensure that the corrected screen image maintains the graphical structure of the screen content, as the position of the text is crucial to understanding its context. Our approach uses OpenCV’s getPerspectiveTransform function to obtain a matrix of a perspective transform so that the detected screen corners are transformed into the corresponding expected points in the destination image. Then, OpenCV’s warpPerspective applies the perspective transformation to the resulting image of the screen bounding box module.
2.2.2. Text Detection
EAST [11] is one of the most commonly used algorithms in scene text detection, presenting a highly simplified pipeline and efficiency to perform inference at real-time speed. It uses a fully convolutional network (FCN), which outputs per-pixel predictions of words or text lines, followed by a non-maximum suppression (NMS) step on the geometric map as post-processing. The output layer is composed of two feature maps: the geometry map, which is used to generate the text bounding boxes and can assume different shapes—rotated box (RBOX) or quadrangle (QUAD)—and the scores map, which corresponds to the confidence of the geometry shape predicted at the same location. The loss function consists of a weighted sum of the score map and the geometry losses. Additionally, this method is commonly used for applications on edge devices, which is vital for the use case of this work.
We employed the EAST model pre-trained on ICDAR 2013 [12] and ICDAR 2015 [13] datasets with ResNet-50 [14] as the backbone. This model is fine-tuned with the SINATRA dataset. For data augmentation of the input images, we apply random crops, Gaussian blur, zoom, translations, and rotations, and adjust the contrast and brightness. The images are resized to , and the batch size is 6. The Adam optimizer is adopted with a learning rate . Regarding the outputs, we work with the RBOX geometry due to its superior performance demonstrated in [11].
Succeeding the text boxes detection, the selection of important information (values for reading) takes place in the template matching step (Figure 4). As mentioned before, the values extracted from the UC are related to ORP and OD; the value from the FM is the flow rate. This procedure is based on the graphical structure of the screen content; hence, the projection of the screen onto a normal plane being vital. The rectangular regions containing the desired text are obtained by averaging the ground truth locations, thus resulting in templates for each equipment. Then, the intersection over union (IoU) between the detected and the template’s regions is found, and the text boxes with IoU higher than our empirically set threshold of 15% are selected.
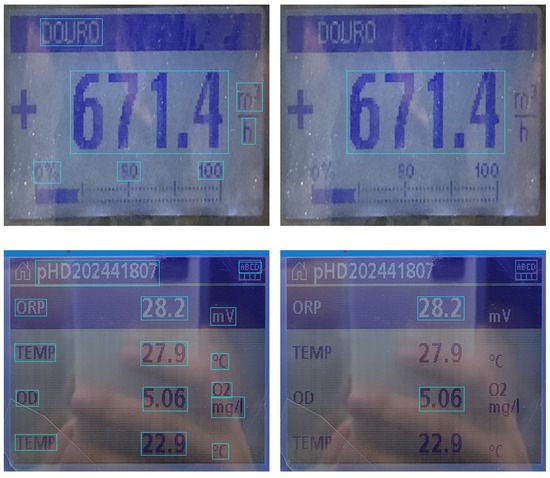
Figure 4.
Example of the text boxes returned by the text detection module (left column) and selection of important information (right column).
2.2.3. Text Recognition
Text recognition models that could recognize alphanumeric characters and special characters, such as dots, minus signs, etc., and allowed conversion to the open neural network exchange (ONNX) format were first identified. Facebook’s Rosetta [15] is an efficient text recognition model, based on the ResNet18 [14] architecture. Connectionist temporal classification (CTC) loss is used to train the sequence model, which allows the system to recognize words of arbitrary length and out-of-vocabulary words (words that were not seen during training). The framework introduced by Baek et al. [16] from Clova AI Research [17] allows training of this and other models based on the combination of four modules: transformation, feature extraction, sequence modeling and prediction. The CRNN [4] is an algorithm for image-based sequence recognition tasks, which combines a CNN for the extraction of visual features and an RNN for processing the feature map to recognize sequences of characters. Furthermore, the addition of CTC allows the length of the output sequence to not be necessarily equal to the length of the input image and helps to handle challenges such as variations in font, size, and orientation, and overlapping characters. Bautista and Atienza [18] reproduced the implementation of this model in the Scene Text Recognition Model Hub [19].
We pre-trained Rosetta on the SynthText (ST) [20] dataset and employed the CRNN with weights pre-trained on the MJSynth (MJ) [21] and ST datasets. Both models are also fine-tuned with the SINATRA dataset. For data augmentation of the input images, we adjust the contrast and brightness, add Gaussian blur, perform zooms and rotations, and pad each side by 0 to 10% to mimic faulty detections. The images are resized to the input shape of each model: for Rosetta and for CRNN, each. The models are trained for the 94-character set, which consists of mixed-case alphanumeric characters with punctuation.
2.3. Mobile Application
The previously presented automatic meter reading pipeline was deployed as an Android application running on a mobile device aiming to support the reading process of digital meters and save the data analysed. The application was developed using Android Studio and Kotlin as the main programming language. The models presented in the previous section were converted to the ONNX format for mobile deployment, except the screen detection module, which uses the TensorFlow Object Detection API that is also available in Android. To reduce the model size and speed up inference, dynamic quantization was performed.
The mobile application was designed for operators using a Samsung Tab Active3 (SM-T575), as required by the company. It is equipped with an 8-inch screen, an Octa-core (4 × 2.7 GHz Mongoose M3 and 4 × 1.7 GHz Cortex-A55) central processing unit and a 13 Megapixel back camera with f/1.9 and autofocus, being capable of acquiring pictures with a resolution of 1920 × 1080 pixels.
The application runs in two stages: (i) first, it automatically detects the screen of the device in real-time for each preview frame and, (ii) in the acquired image, the complete pipeline is applied. The user is first guided to center the meter inside a square (Figure 5). While in preview, each frame is analyzed to detect the equipment screen. An image is automatically acquired when the majority of 20 consecutive frames or when the majority of all frames acquired in the span of 1250 milliseconds (ms) detect a screen with a score of at least 70%. In case this process fails to automatically acquire the image, the user can always use the capture button located at the bottom part of the screen to manually acquire an image.
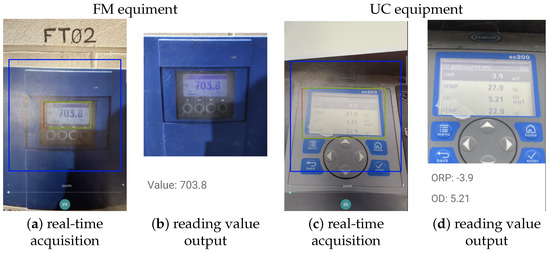
Figure 5.
Screenshots of the mobile application when using both devices (FM on the left and UC in the right): (a,c) images corresponding to the first stage where automatic screen detection is run in real-time and (b,d) outputs the image acquired, and the reading obtained.
All the modules, screen detection, text detection and recognition, are run in the acquired image, and in case all of them return a result, the final reading is returned as depicted in Figure 5. Otherwise, the user is prompted to another image acquisition stating one of two errors: that the screen was not detected properly or any of the other models had no result. In case the system is never able to obtain a proper reading, the user can always cancel the process and manually write the readings, and the last image acquired is saved into the application.
3. Results and Discussion
3.1. Screen Detection
Regarding the proposed methodology for screen detection, as performance metrics, the mean average precision (mAP) is used for comparison of the predicted bounding box and the corresponding ground truth, as it is the COCO [10] evaluation metric, and intersection over union (IoU) and Euclidean distance (ED) for assessment of the keypoint detection [1,5]. We compare the performance of an equipment-agnostic screen bounding box detection model, denoting a single model capable of identifying the screen in the UC and FM devices, with specific models trained for each.
Analyzing the results for screen bounding box detection shown in Table 2, the FM-specific model can detect the screen of these devices, despite noticeable differences in the appearance of its two subtypes, more precisely than the model for UC. Nonetheless, the equipment-agnostic approach proves to be superior, with an impressive jump of 56% in mAP@0.5 for UC and 16% for FM.
Table 2.
Results for screen bounding box detection module.
The results concerning screen keypoint detection are presented in Table 3. A big overlap between the predicted and ground truth polygons for both devices is demonstrated, with IoU values above 90%. Furthermore, the ED is around 7–8 pixels, which correspond to an error of approximately 3.5%. The good performance of this model is very important for competent perspective warp, allowing to correct and reduce distortion caused by camera misalignment.
Table 3.
Results for screen keypoint detection module.
3.2. Text Detection
The evaluation metrics employed in text detection are recall, precision, and F-measure [11]. We compare the EAST model pre-trained on ICDAR 2013 and ICDAR 2015 with a fine-tuned version, trained on the SINATRA augmented data. The detailed results can be observed in Table 4.
Table 4.
Results for text detection module.
In general, the fine-tuned model performs better than the pre-trained model, as denoted by an improvement in the F-measure of, approximately 21% and 3% for UC and FM, respectively. Recall greatly increases for both equipment after the model is introduced to images of this domain, meaning that this model is more capable of retrieving the correct regions. This improvement in performance was expected as the domains of these datasets present different characteristics: ICDAR datasets contain natural scene images, whereas SINATRA is composed of images of digital screens, which are luminous and hence more susceptible to glare. The results presented are on par with the capabilities shown by the EAST model on the benchmark ICDAR 2015, where the proposed algorithm achieves an F-measure of 78.20% [11]. However, our implementation uses ResNet-50 rather than PVANET [22].
3.3. Text Recognition
Accuracy is the most commonly adopted metric for the assessment of the text recognizer [1,5,6]. We implemented two popular state-of-the-art text recognition models and compared the influence of fine-tuning both with text regions from digital meter images. The experimental results are presented in Table 5.
Table 5.
Results for recognition of important text (text recognition module).
Pre-trained Rosetta performs poorly on the UC, compared to CRNN. For the FM, the difference is not abrupt, yet CRNN continues to outperform the first. In the implementation of Bautista and Atienza [18], CRNN exhibits average accuracy of 90.9% and 70.8% for ICDAR 2013 (1015 test images), and ICDAR 2015 (2077 test images). Rosetta’s implementation in Baek et al. [16] returns accuracy values of 89.2% and 64.2% for the same datasets, each. Such results corroborate our proposed thesis that CRNN outperforms Rosetta.
Regarding the fine-tuned models, this technique is proved to be beneficial, except for the identification of FM values by the CRNN model, whose accuracy remains unchanged. Although Rosetta returns the top result in FM, CRNN yields the best performance altogether, with average accuracy of 88.45% against 85.61% of the former. Therefore, the CRNN fine-tuned model is selected for incorporation into the pipeline.
3.4. Automatic Meter Reading Pipeline
The proposed system achieves an overall end-to-end recognition accuracy of 55.47% and 63.70% for the ORP and OD values of the UC, respectively, and 73.08% for the flow rate values of the FM, as depicted in Table 6. Regarding the metrics for screen detection, the values are different than the ones previously reported due to slight differences in the conversion to the ONNX format. The deterioration in the performance of the OCR models, text detection and text recognition, is noticeable and related to the propagation of errors from the prior modules, as we will explain next.
Table 6.
Results for the pipeline modules in the ONNX format.
As described in Section 2.3, when the detection modules are not able to locate the screen or text boxes, or when the detected text regions fail template matching, meaning that the regions do not have sufficient overlap with the expected position, the pipeline does not advance to the next step. Considering the UC device, the screen bounding box detection model is tested in 222 images. This stage failed to locate the screen in 9% (20 images), mainly due to low detection confidence. Regarding the text detection and template matching module, 202 cases are received, no text is detected in 0.5% (1 image), or both text boxes fail to overlap with their expected position in nearly 5% (11 images). In the remaining 190 samples, 183 boxes related to ORP and 160 of OD are successfully located. However, as the text is not readable in a number of cases, 137 ORP and 146 OD boxes advance to the final step, with 55.47% (76 images) and 63.70% (93 images), respectively, being correctly distinguished by the text recognizer. For the FM equipment, the screen bounding box detector is tested in 68 images, failing in 10% (7 images). Hence, 61 cases go through the text detection model, which always locates text boxes; however, the template matching step failed in 15% of the samples (9 images). Due to the previously identified fails in previous steps of the pipeline, 76% of FM cases (52 images) achieved the text recognition module, of which 73.08% (38 images) are veracious.
The different number of text boxes for ORP and OD in the UC obtained by the text detection module is explained by underexposure or occlusions provoked by glare and reflections. The model is not able to perceive if a second text box is present when in reality it is, thus not returning any result. Additionally, there are no ground truth labels for 46 ORP and 13 OD values because it was not possible for the human annotator to discriminate the actual values, as a consequence of the previously mentioned artifacts. Another common problem found in the images of the UC was a malfunction in the display, which affected the readability of some values. A few cases related to text detection and template matching issues are demonstrated in the first row of Figure 6, whereas the second row shows difficult cases for text recognition.
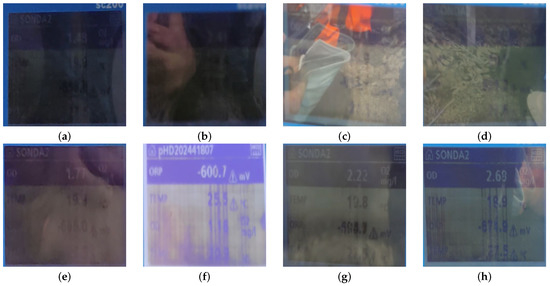
Figure 6.
Examples of challenging images of universal controllers (UC) with corrected perspective from the test set. The first row demonstrates cases where the text detection—(a,b)—and template matching—(c,d)—module cannot infer results, the second row presents difficult cases for the text recognition module—(e–h).
Figure 7 presents examples of outputs obtained at the end of each module of the pipeline, identifying their importance in subsequent steps. Figure 7a,d show the correct functioning of all stages of the pipeline. The correct definition of the screen corners is of paramount importance; otherwise, the graphical structure of the display area will not correspond as expected, affecting template matching and consequently the output of the system, as illustrated in Figure 7b,e. Faulty text detection has a strong negative impact on text recognition: the negative sign is often left out by the detector, or other symbols are also considered, thus making it impossible for the recognizer to correctly identify the actual value (Figure 7c). The framework also reveals difficulties when glare or reflections are present in the images, as they overshadow the values and introduce noisy patterns (Figure 7f).
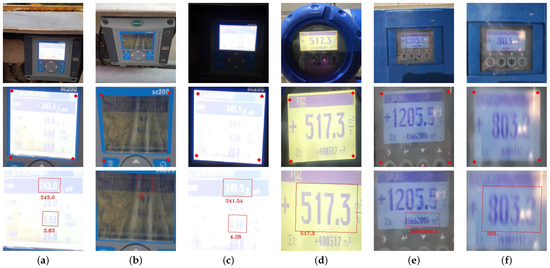
Figure 7.
Examples of the results obtained by the modules of the proposed pipeline. The first row contains the central cropped images; the second row presents the resulting images of the screen bounding box model and keypoints detected by the screen keypoint model; the third row includes the important text boxes and corresponding text identified by the text detection and text recognition modules, respectively. Each column represents different cases, where the system correctly extracts the values—(a,d)—or fails in certain modules of the pipeline (keypoint and template matching—(b,e)—or text recognition—(f)). (a) Correct, (b) Incorrect keypoint detection and template matching fail, (c) Incorrect text detection, (d) Correct, (e) Incorrect keypoint detection and template matching error, (f) Incorrect recognition due to glare.
To evaluate the execution time of the system, a Samsung Active Tab3 was used (the same device used by the operators in the field due to its robustness and safety). Although it is a device equipped with hardware present in older devices, making it comparable with current low-end devices, the system performed within reasonable timing. The step of screen detection that runs solo in each preview frame takes under a quarter of a second on average, making it visually acceptable to the end user. With the acquired photo, the user needs to wait, on average, one and a half seconds to read the extracted values, whereas the text detection model takes most of the time (a bit over one second). The timings were obtained (see Table 6) from the average of several acquisitions with the mentioned device.
To the best of our knowledge, we are not aware of any works in the literature for the same type of devices, thus not allowing a direct comparison. The most similar AMR systems are proposed for analog energy meters or multimeters as described in Section 1; however, they are quite different from the equipment in our work. The system introduced by Laroca et al. [5] performed the correct reading of 94.75% and 96.98% of the meters in their UFPR-AMR [1] and Copel-AMR [5] test sets. Gómez et al. [8] describes an overall end-to-end recognition accuracy of 94.167%, while Zhou et al. [11] report accuracy of 98% on private datasets. The results reported by these works are quite superior when compared to our approach, which is misleading considering that these images show excellent conditions of acquisition and a lack of challenging artifacts.
4. Conclusions
This work presents a robust and versatile deep learning-based solution for the reading of digital meters, suitable for edge application. This system aims to contribute to streamlining and facilitating industrial preventive and corrective processes. The proposed methodology includes the detection of the meter screen and subsequent perspective correction to tackle poorer captures, followed by text detection, automatic selection of values for reading, and value recognition. The dataset collected for this work contains 1335 samples from two different types of meters, which were acquired in challenging conditions for robust system training and testing. This dataset is an original contribution of this work. Furthermore, we also explored offline data augmentation techniques to increase variability and improve data quality.
The proposed pipeline is deployed as a mobile Android application, and the end-to-end approach is executed in 1500 ms in average, and under 250 ms for each preview frame, returning accuracy values of 55.47% and 63.70% for the oxidation–reduction potential and dissolved oxygen readings in the UC device, and 73.08% for the flow rate in the FM. Such experiment results show the potential of the solution. Moreover, it is important to mention that a number of samples from the test set exhibited demanding characteristics, such as reflections, obstructions or glitches, which hinder our process.
The presented pipeline can be integrated with any information system currently used in the industry. The presented system can be deployed as a library that can be consumed by any complete Android application. In the context of the project, both the values extracted and the photo used are stored in a cloud server that manages the processes performed by the operator.
For future work, further tests to validate the solution in a relevant environment will be performed. There is room for improvement, particularly in the text detection step to avoid detecting irrelevant information.
Author Contributions
Conceptualization, R.C., J.M., R.G. and M.J.M.V.; methodology, R.C., J.M., R.G. and M.J.M.V.; data curation, R.C. and J.M.; implementation, R.C., J.M. and R.G.; writing—original draft preparation, all; writing—review and editing, M.J.M.V. and R.C.; supervision, M.J.M.V.; funding acquisition, M.J.M.V. and G.S. All authors have read and agreed to the published version of the manuscript.
Funding
This work was done under the scope of SINATRA—“Smart Industrial maiNtenance through AugmenTed ReAlity” project (POCI-01-0247-FEDER-069974), according to Portugal 2020 is co-funded by the European Regional Development Fund from European Union, framed in the COMPETE 2020.
Institutional Review Board Statement
Not applicable.
Informed Consent Statement
Not applicable.
Data Availability Statement
Not applicable.
Acknowledgments
This work was done under the scope of SINATRA—“Smart Industrial maiNtenance through AugmenTed ReAlity” project (POCI-01-0247-FEDER-069974), according to Portugal 2020 is co-funded by the European Regional Development Fund from European Union, framed in the COMPETE 2020. The authors would like to thank the AEdP team that collaborated in the data acquisition process.
Conflicts of Interest
The authors declare no conflict of interest.
References
- Laroca, R.; Barroso, V.; Diniz, M.A.; Gonçalves, G.R.; Schwartz, W.R.; Menotti, D. Convolutional neural networks for automatic meter reading. J. Electron. Imaging 2019, 28, 013023. [Google Scholar] [CrossRef]
- Redmon, J.; Divvala, S.; Girshick, R.; Farhadi, A. You only look once: Unified, real-time object detection. In Proceedings of the IEEE Conference on Computer Vision and Pattern Recognition, Las Vegas, NV, USA, 27–30 June 2016; pp. 779–788. [Google Scholar]
- Montazzolli, S.; Jung, C. Real-time brazilian license plate detection and recognition using deep convolutional neural networks. IEEE Trans. Pattern Anal. Mach. Intell. 2017, 39, 55–62. [Google Scholar]
- Shi, B.; Bai, X.; Yao, C. An end-to-end trainable neural network for image-based sequence recognition and its application to scene text recognition. IEEE Trans. Pattern Anal. Mach. Intell. 2016, 39, 2298–2304. [Google Scholar] [CrossRef] [PubMed]
- Laroca, R.; Araujo, A.B.; Zanlorensi, L.A.; De Almeida, E.C.; Menotti, D. Towards image-based automatic meter reading in unconstrained scenarios: A robust and efficient approach. IEEE Access 2021, 9, 67569–67584. [Google Scholar] [CrossRef]
- Zhou, W.; Peng, J.; Han, Y. Deep Learning-based Intelligent Reading Recognition Method of the Digital Multimeter. In Proceedings of the 2021 IEEE International Conference on Systems, Man, and Cybernetics (SMC), Melbourne, Australia, 17–20 October 2021; pp. 3272–3277. [Google Scholar]
- Jocher, G.; Stoken, A.; Borovec, J.; Christopher, S.T.A.N.; Laughing, L.C. ultralytics/yolov5: v4.0—nn.SiLU() Activations, Weights & Biases Logging, PyTorch Hub Integration. 2021. Available online: https://doi.org/10.5281/zenodo.4418161 (accessed on 20 January 2023).
- Gómez, L.; Rusinol, M.; Karatzas, D. Cutting Sayre’s Knot: Reading scene text without segmentation. application to utility meters. In Proceedings of the 2018 13th IAPR International Workshop on Document Analysis Systems (DAS), Vienna, Austria, 24–27 April 2018; pp. 97–102. [Google Scholar]
- Sandler, M.; Howard, A.; Zhu, M.; Zhmoginov, A.; Chen, L.C. Mobilenetv2: Inverted residuals and linear bottlenecks. In Proceedings of the IEEE Conference on Computer Vision and Pattern Recognition, Salt Lake City, UT, USA, 18–23 June 2018; pp. 4510–4520. [Google Scholar]
- Lin, T.Y.; Maire, M.; Belongie, S.; Hays, J.; Perona, P.; Ramanan, D.; Dollár, P.; Zitnick, C.L. Microsoft coco: Common objects in context. In Proceedings of the European Conference on Computer Vision, Zurich, Switzerland, 6–12 September 2014; Springer: Berlin/Heidelberg, Germany, 2014; pp. 740–755. [Google Scholar]
- Zhou, X.; Yao, C.; Wen, H.; Wang, Y.; Zhou, S.; He, W.; Liang, J. East: An efficient and accurate scene text detector. In Proceedings of the IEEE Conference on Computer Vision and Pattern Recognition, Honolulu, HI, USA, 21–26 July 2017; pp. 5551–5560. [Google Scholar]
- Karatzas, D.; Shafait, F.; Uchida, S.; Iwamura, M.; i Bigorda, L.G.; Mestre, S.R.; Mas, J.; Mota, D.F.; Almazan, J.A.; De Las Heras, L.P. ICDAR 2013 robust reading competition. In Proceedings of the 2013 12th International Conference on Document Analysis and Recognition, Washington, DC, USA, 25–28 August 2013; pp. 1484–1493. [Google Scholar]
- Karatzas, D.; Gomez-Bigorda, L.; Nicolaou, A.; Ghosh, S.; Bagdanov, A.; Iwamura, M.; Matas, J.; Neumann, L.; Chandrasekhar, V.R.; Lu, S.; et al. ICDAR 2015 competition on robust reading. In Proceedings of the 2015 13th International Conference on Document Analysis and Recognition (ICDAR), Tunis, Tunisia, 23–26 August 2015; pp. 1156–1160. [Google Scholar]
- He, K.; Zhang, X.; Ren, S.; Sun, J. Deep Residual Learning for Image Recognition. In Proceedings of the 2016 IEEE Conference on Computer Vision and Pattern Recognition (CVPR), Las Vegas, NV, USA, 27–30 June 2016; pp. 770–778. [Google Scholar] [CrossRef]
- Borisyuk, F.; Gordo, A.; Sivakumar, V. Rosetta: Large scale system for text detection and recognition in images. In Proceedings of the 24th ACM SIGKDD International Conference on Knowledge Discovery & Data Mining, London, UK, 19–23 August 2018; pp. 71–79. [Google Scholar]
- Baek, J.; Kim, G.; Lee, J.; Park, S.; Han, D.; Yun, S.; Oh, S.J.; Lee, H. What is wrong with scene text recognition model comparisons? dataset and model analysis. In Proceedings of the IEEE/CVF international Conference on Computer Vision, Seoul, Republic of Korea, 27 October–2 November 2019; pp. 4715–4723. [Google Scholar]
- Research, C.A. What Is Wrong with Scene Text Recognition Model Comparisons? Dataset and Model Analysis. Available online: https://github.com/clovaai/deep-text-recognition-benchmark (accessed on 1 January 2023).
- Bautista, D.; Atienza, R. Scene Text Recognition with Permuted Autoregressive Sequence Models. In Proceedings of the European Conference on Computer Vision, Tel Aviv, Israel, 23–27 October 2022; Springer: Berlin/Heidelberg, Germany, 2022; pp. 178–196. [Google Scholar]
- Bautista, D. Scene Text Recognition with Permuted Autoregressive Sequence Models. Available online: https://github.com/baudm/parseq (accessed on 1 January 2023).
- Gupta, A.; Vedaldi, A.; Zisserman, A. Synthetic data for text localisation in natural images. In Proceedings of the IEEE Conference on Computer Vision and Pattern Recognition, Las Vegas, NV, USA, 26 June–1 July 2016; pp. 2315–2324. [Google Scholar]
- Jaderberg, M.; Simonyan, K.; Vedaldi, A.; Zisserman, A. Synthetic data and artificial neural networks for natural scene text recognition. arXiv 2014, arXiv:1406.2227. [Google Scholar]
- Kim, K.H.; Hong, S.; Roh, B.; Cheon, Y.; Park, M. Pvanet: Deep but lightweight neural networks for real-time object detection. arXiv 2016, arXiv:1608.08021. [Google Scholar]
Disclaimer/Publisher’s Note: The statements, opinions and data contained in all publications are solely those of the individual author(s) and contributor(s) and not of MDPI and/or the editor(s). MDPI and/or the editor(s) disclaim responsibility for any injury to people or property resulting from any ideas, methods, instructions or products referred to in the content. |
© 2023 by the authors. Licensee MDPI, Basel, Switzerland. This article is an open access article distributed under the terms and conditions of the Creative Commons Attribution (CC BY) license (https://creativecommons.org/licenses/by/4.0/).