1. Introduction
According to a Statista report [
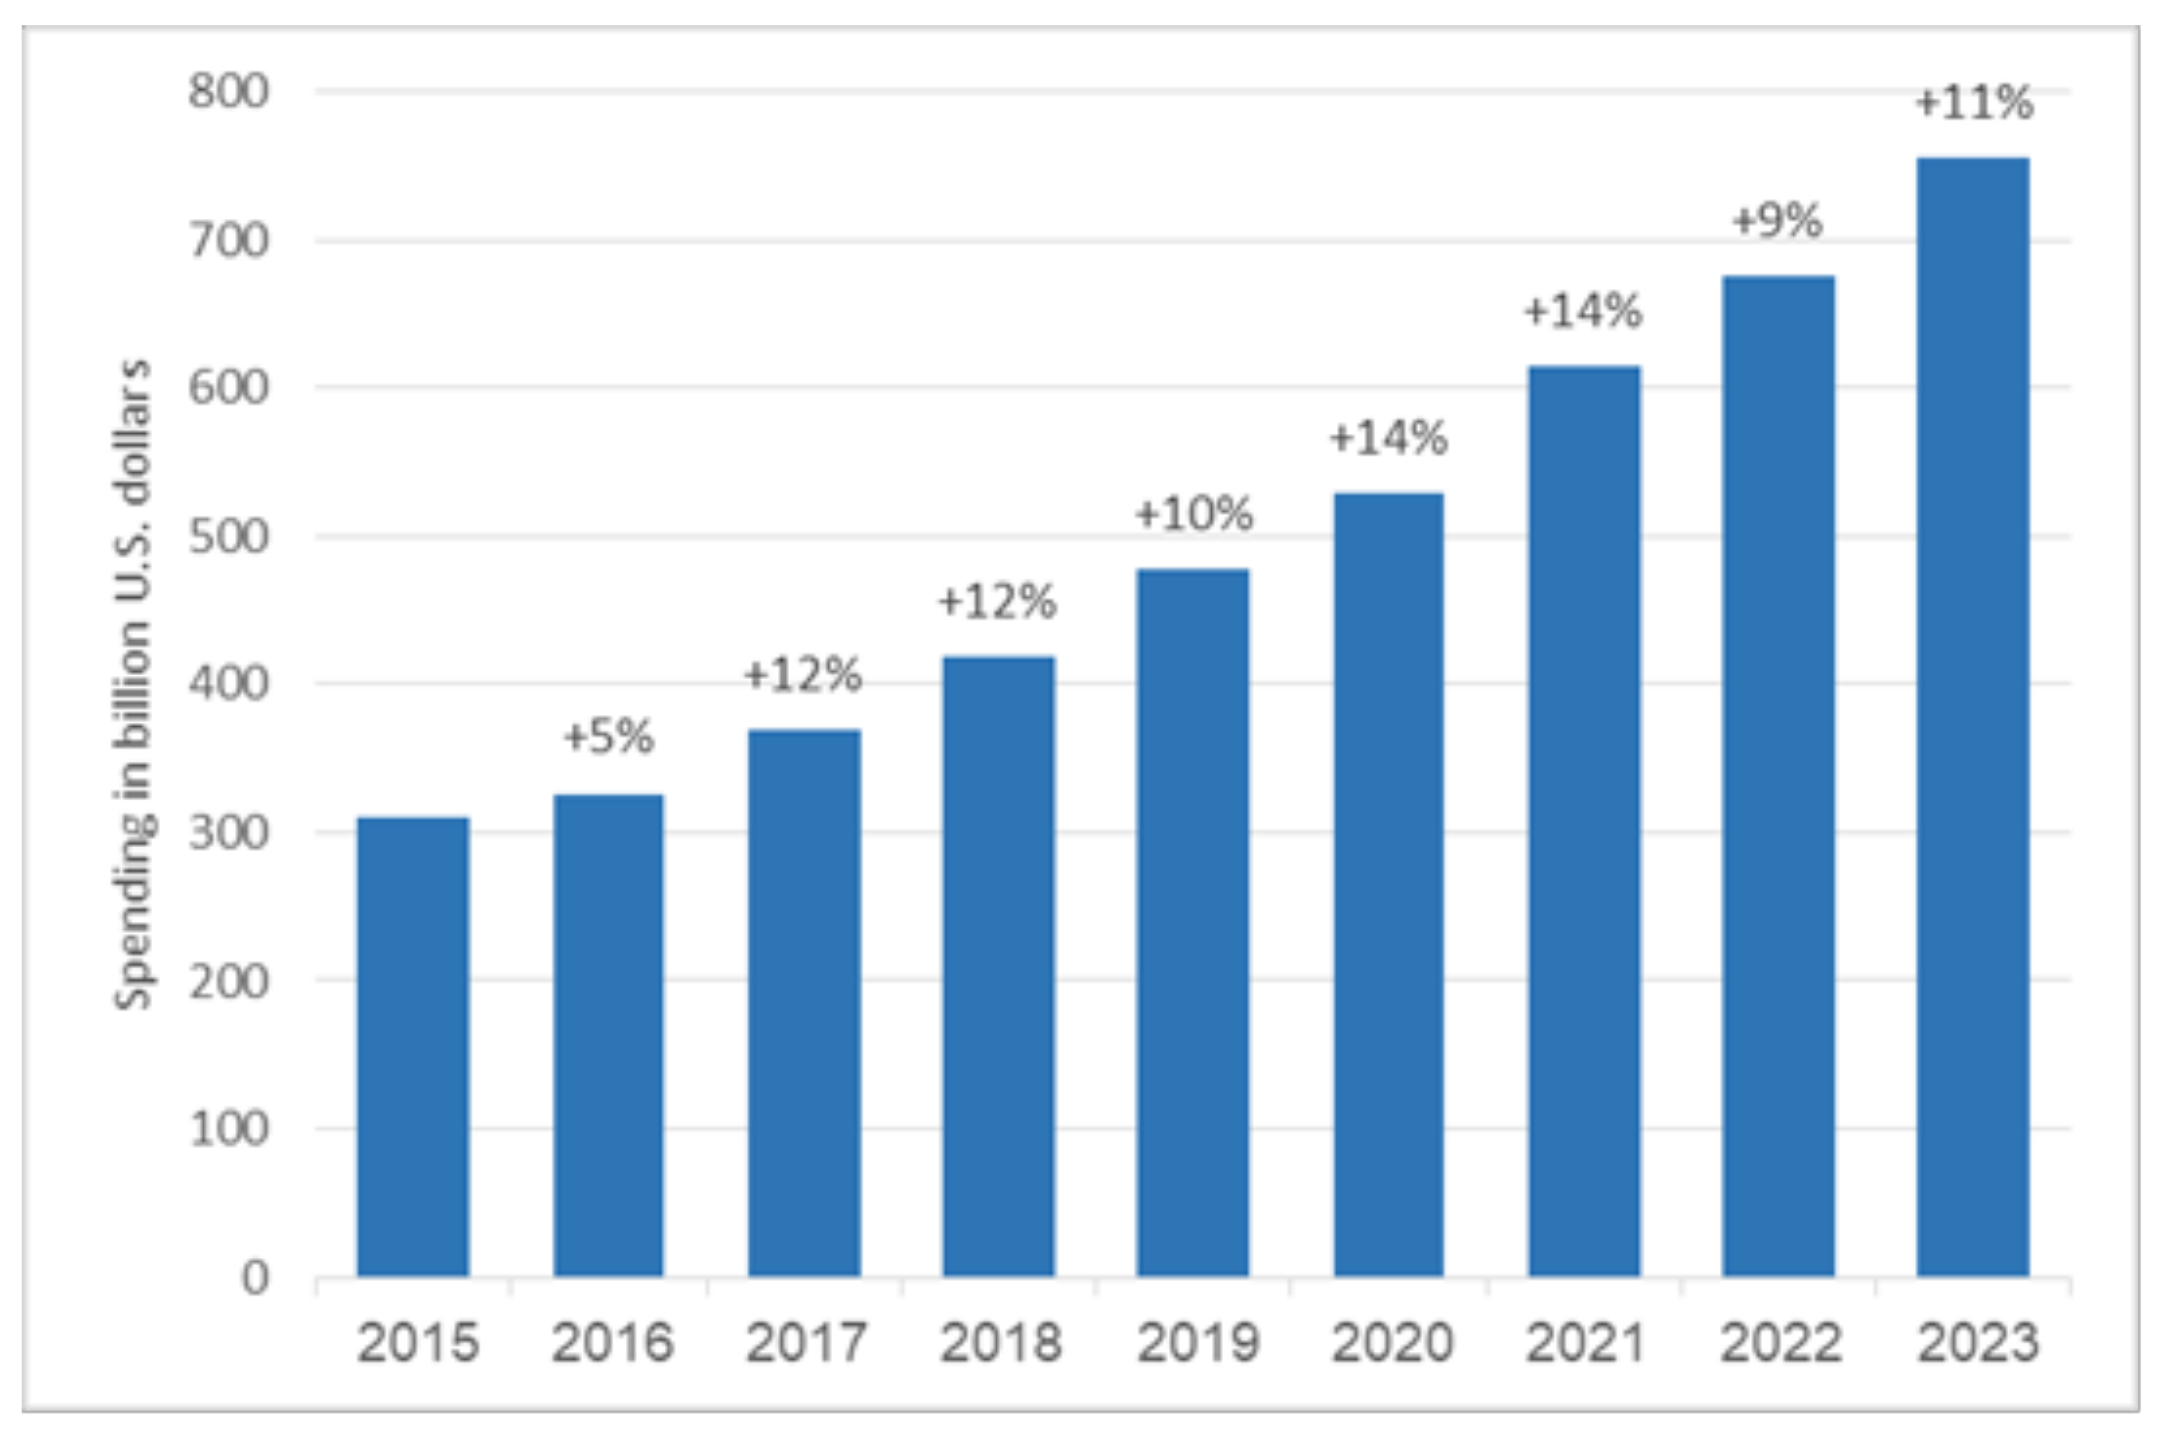
1], expenditures on global information technology (IT) by companies in various sectors grew annually between 2015 and 2022, as shown in
Figure 1. Forecasts indicate an expected rise of 11% in 2023 due to the continued expansion of new technologies. In particular, several technological categories, including robotics and artificial intelligence, are likely to expand to represent more than 25% of IT spending worldwide, and next-generation security linked to those new technologies will also encourage significant growth (see IDC—Global ICT Spending Forecast [
2]).
Software companies sell their products by transferring licenses of various software components to customers. Typically, a basic fee covers use of the software by a specified number of simultaneous or concurrent users, and annual maintenance fees ensure that purchasers receive maintenance and updates. Several types of license allow controlled access to software. MathWorks, for example, offers three different MATLAB® licenses:
Network concurrent (floating) license. The network concurrent license makes MathWorks products available to anyone with access to the purchaser’s network. Access is not limited to specific user names. Instead, users check out license keys when starting MATLAB or using its functions in other products. When all available keys have been checked out, the software’s license manager denies further requests.
Network named user license. The network named user (NNU) license controls access via user name and costs four times less than the floating license.
Non-network licenses. Non-network licenses control access via either user name or computer identification.
MathWorks also offers maintenance agreements, which provide an upgraded version twice a year, and technical support for an additional 25% of the license fee annually.
Table 1 provides additional information about how users are typically distributed within a company under each type of license. Under common practice, heavy users (users occupying a license slot more than 25% of the time) are given personal user-name-based access. Light users (users occupying a license less than 25% of the time) usually rely on concurrent licenses. Non-network licenses are generally purchased only for users who cannot work on a network because of confidentiality concerns (laboratories, experiments) or because they are traveling.
MathWorks also uses two types of activation: (i) a designated computer license designed for one computer, identified by its MAC (media access control) address, and any user of that computer can use the software; and (ii) user activation, in which specific user names are activated and can be used on up to four computers.
It is also important to remember that many software licenses are offered with various sublicenses. The MATLAB license, for example, includes toolboxes intended for various content domains, such as code desecration, image processing, statistics, electronics, and mechanics. The cost of MATLAB sublicenses varies by type and ranges from USD 1000 to 50,000. Coder licenses are significantly more expensive than image processing and statistics licenses.
Other software companies, such as nTopology, Ansys (e.g., Granta license, and Ansys Learning Hub license), and Solidworks, also offer both floating and named user licenses. These licenses control access to the software via user names or computer identification. Additionally, many of these companies also offer maintenance agreements that provide upgraded versions and technical support at an additional cost. In addition, similar to MathWorks, these companies offer various sublicenses for specific content domains, such as engineering, design, and analysis, with different costs. It is important to note that the licensing options and costs may vary depending on the specific software product and the industry in which it is being used. However, typically, the retail price of a floating license is three–four times higher than that of an NNU license.
There are open-source programming languages, such as Python, that do not have licensing options like the network concurrent (floating) license or the network named user license. However, organizations that use Python for commercial purposes (e.g., organizations in the banking industry) may choose to purchase a license from a third-party software company that offers these types of licenses. For example, Anaconda a distributer of Python and R for scientific and analytic computing, offers both floating license and NNU license options for organizations. Therefore, the methodology suggested in this paper can be used for a wide range of software when an optimal choice of various license types is required.
Recently, some companies have started offering cloud-based licensing options [
3], which allows users to access the software through the Internet and pay for usage on a subscription basis. This can be an attractive option for companies that do not want to invest in expensive hardware and have flexible needs in terms of usage.
Licenses and sublicenses can be perpetual or annual. The original software can be perpetually “owned” and used indefinitely with no renewal fees (increasingly less common as time passes) or renewed annually. Maintenance and support licenses are mostly annual. For example, the first year of MathWorks’ software maintenance service is included in the initial purchase price. Then, after the first 12 months, licensees must pay annual renewal fees for maintenance and updates. Alternatively, with annual software licenses, maintenance and support are often included in the annual license fee. To ensure uninterrupted service, the license owner must renew the license prior to conclusion of the existing term. Otherwise, the license and/or maintenance services expire.
In addition to traditional buying and building of software, firms are increasingly using powerful open-source applications [
4]. Clearly, in such an environment, selecting the best portfolio of licenses, even for a single application, is not trivial; the number and types of licenses purchased can have a significant impact on a firm’s IT costs and operational abilities, with potentially disastrous consequences arising from a lack of access to critically important software when needed [
5].
The above notwithstanding, there is an obvious downside to buying an excess number of, often costly, licenses, to avoid denying access to software. Consequently, many firms have begun to monitor utilization of their software applications to make sure they do not purchase more access than needed, and software providers are including monitoring systems with their licenses. Emerset NetSupport DNA and FlexNet, for example, provide license-monitoring applications that firms can use when making procurement and maintenance decisions [
6]. Our research takes this recent trend into account by explicitly considering underutilization as a constraint when identifying optimal license portfolios. In particular, we present a general integer program for optimizing mixed-license software portfolios under constraints on two types of risk: access rejection and license underutilization.
2. Literature Review
Queuing models employed to estimate loss (blocking) probability may be found in the literature pertaining to a variety of applications, such as call centers [
7,
8,
9], after sales services [
10,
11,
12,
13,
14], and health care services [
9,
15], and have also been used to estimate the number of licenses needed to meet a given probability of nonaccess. Specifically, the literature on efficient software licensing has mostly addressed queuing models used to estimate the probability that a single type of user will be denied access given a finite versus an infinite number of users, which is justified when analyzing a case in which the number of concurrent users is quite small relative to the total number of potential users. In particular, Murtojarvi et al. [
16] consider several multiserver Erlang delay and loss queuing models when assuming an infinite number of users and the Engset model with no queue and a finite number of users. They address floating network concurrent licenses and assume that the users are homogeneous.
Quandt [
17] also studies a single type of licensing for homogeneous users but assumes that the distribution of user arrivals is binomial; that is, there is a given probability that a user (a student) will want to use a terminal (license) in a given one-hour interval, and that probability is referred to as the probability of “success” in terms of the binomial distribution. In that case, determining the probabilities that exactly
x students in a population of
n students will want to use the software and that
k students will be denied access when
x is greater than
k is straightforward. The goal is to determine the tradeoff between the cost of the software licenses and the cost of failing to satisfy some users.
Gull and Wehrmann [
18] consider a more general optimization problem. They assume that the Erlang loss (queuing) system describing user demand and operating times depends on the specific time interval involved. Their basic model allows for optimization of the license portfolio cost for a single homogeneous user group subject to a given load profile and a quality-of-service standard. They consider portfolios consisting of two types of license, single user and network, and suggest an extension to make the general problem for heterogeneous users more tractable. This is accomplished by splitting the heterogeneous users into a few homogeneous groups and determining the number of each type of license needed for those groups. Their numerical analysis for a large user group shows that, in most cases, mixed single-user and network licensing is not economically efficient, even for heterogeneous user behavior. In addition, they examine a case involving several user groups and demand-oriented licensing. They find that dynamic network licensing is cost effective, especially for international businesses and even for intensive-use groups because of time shifts among the user profiles.
A separate stream of literature addresses job scheduling and management of available software licenses and cloud computing services. Studies examining floating licenses and scheduling policies have found that submitted jobs can be queued and scheduled so that software and limited licenses can be shared and used efficiently via multiple clusters of users [
19,
20,
21,
22].
In this paper, we focus on strategic acquisitions of licenses to meet peak demand. As in previous studies, we employ an Erlang queuing model to describe demand for software licenses and determine access-rejection probabilities. Unlike the above-mentioned studies, which compared specific portfolio alternatives, we present a general integer program that optimizes licensing portfolios subject to access-rejection and underutilization constraints. The program integrates multiple types of licenses and sublicenses into a portfolio using the number of licenses of each type as a decision variable. We evaluate and illustrate the approach using the classical choice between floating and NNU software licenses and assess the integer program’s sensitivity to the accuracy of estimated rates of requests for access. In particular, we find that mixing license types in a single portfolio can be economically efficient, even when the choice is limited to two license types.
3. Problem Formulation
As in earlier studies of license portfolio selection, we consider the standard queuing model, namely, the Erlang loss system (M/M/S/S) in which S is the number of licenses and users who cannot obtain access because all licenses are checked out are blocked (these users do not wait in a queue but may attempt to access the software later). When a user stops using the software, the license is returned to the pool of available licenses. This specifies a model in which the number of users, K (source size), is large enough such that their arrivals may be described as a Poisson process with an average rate of . Service times are exponentially distributed with an average required time of per user.
Let
k, the current number of software users logged into the system, be the status variable in which
k = 0, 1, 2, …,
S. Then, the probability that an arriving user will be rejected by the system,
B(
S, a), which is the blocking probability, is given by the Erlang B formula:
where
represents the offered load (traffic intensity). A more convenient way of calculating the blocking probability is via recursion of its reciprocal,
[
23]:
We use these basic results to formulate a general license-portfolio management problem by considering the time intervals that have the most pronounced effect on the quality of service; that is, is the average aggregate intensity of license use during the highest traffic hours.
Let J be the number of homogeneous clusters of users, each characterized by software-use intensity and number of users where j is a type of user, j = 1, 2, …, J. Since arrivals are assumed to occur according to an independent Poisson process, they are given by . Additionally, let there be I types of license for purchase that have average service times of Let be the percentage of users of cluster j who will use license type i. Thus, for all j Let be the number of respective licenses purchased of each license type i; user demand for them is thus , i = 1,…, I. For each license type i the offered load is , the blocking probability is the active load is , and the corresponding license utilization is . Denote the cost of purchase and maintenance for a fixed number of years for license type i as ci.
The objective is to find the optimal number of licenses of each type so that the total cost,
C, of purchasing and maintaining the software licenses is minimized while ensuring that the probability of blocking does not exceed a given level,
b (Constraint (5)), and utilization of each license type is at least at a given level,
u (Constraint (6)):
subject to
4. Floating vs. Network Named User Licenses
We consider a special case of two types of license, I = 2 where i = 1 denotes NNU licenses and i = 2 denotes floating licenses and two clusters of users J = 2, j = 1 heavy and j = 2 light users, to illustrate the approach to managing portfolios of software licenses using integer programming. Firms routinely encounter this type of portfolio management problem, and the integer program facilitates an efficient algorithm for solving it.
As the firms must purchase a license for each customer who uses an NNU license and it purchases these licenses only for heavy users, then there are only two decision variables:
and
that is,
and
,
and
Given the number of heavy users
and the arrival rate of heavy (
) and light (
) users, the total average arrival for floating license users is determined by:
where
is the proportion of heavy users who do not have personal licenses. The portfolio optimization problem, then, is to find the optimal number of NNU and floating licenses so that the total cost is minimized:
subject to
where
is the cost of NNU licenses and
is the cost of network floating licenses.
The solution for this system is based on the following simple algorithm, in which and denote the optimal number of NNU and floating licenses, respectively.
Algorithm
Set , , , and
For the current find the minimal number that meets the blocking probability by calculating consecutively over all possible until (10) holds. Set .
For the current , , check the utilization Constraint (11). If the constraint holds, then go to Step 4. Otherwise, check if set = + 1 and go to Step 2. If then stop; an optimal solution ( is found.
If , set , If set = + 1 and go to Step 2. Otherwise, stop; an optimal solution ( is found.
The complexity of the algorithm lies in Step 2, which calculates the blocking probability with iterations by Equation (2); each step takes O(1) time, and there are at most K steps. Then, the complexity of step 2 is O(.) Calculations of the utilization in Step 3 and of the total cost at Step 4 are of O() complexity. Steps 2–4 are repeated at most K1 times, which in the worst case results in O time.
5. Case Study
In our case study, we analyze the software license portfolio decision made by an Israeli high-tech company, hereafter referred to as CO, which develops and manufactures unique, technologically advanced products. CO has been in operation for more than 70 years. Initially, it engaged mainly in research and development. Over the years, however, it added manufacturing of products for Israeli and international markets. CO employs more than 7500 people, mostly engineers and technicians.
In the analysis, we focus on CO’s MATLAB licenses. The total number of users (K) is 1646, of whom 700 are heavy users () and the others are light users ( = 946). CO has customers in numerous countries, including the United States, Europe, India, and Singapore. Its IT-related expenses are significant, since hundreds of engineers are needed to develop its various software offerings and, as a result, the number of software licenses that it purchases continues to grow.
The methodology that we use for the analysis is as follows:
We start off by assessing the dynamics in number of floating license users in November 2020 to identify the most active business hours.
Next, we assess the dynamics of the number of user requests denied.
The natural estimator for the steady-state blocking probability, B(t), is then employed based on admission observations over time.
Overall user requests during the same period of time for floating and NNU licenses, respectively, are registered.
Based on the registered user requests, the model is calibrated to calculate the average rate of requests by all light users.
The duration of license use by peak hour is monitored to calculate the average user’s working time accessing the software.
Baseline case is calculated to illustrate the effects of the two frontier constraints—risk of rejection and risk of underutilization.
Finally, we assume that it is difficult to assess exact levels of license requests, so we conduct a sensitivity analysis with respect to an average rate of requests for use of floating licenses by light users and heavy users.
5.1. Floating and NNU Licenses
In November 2020, CO had
= 580 NNU licenses and
= 150 floating licenses.
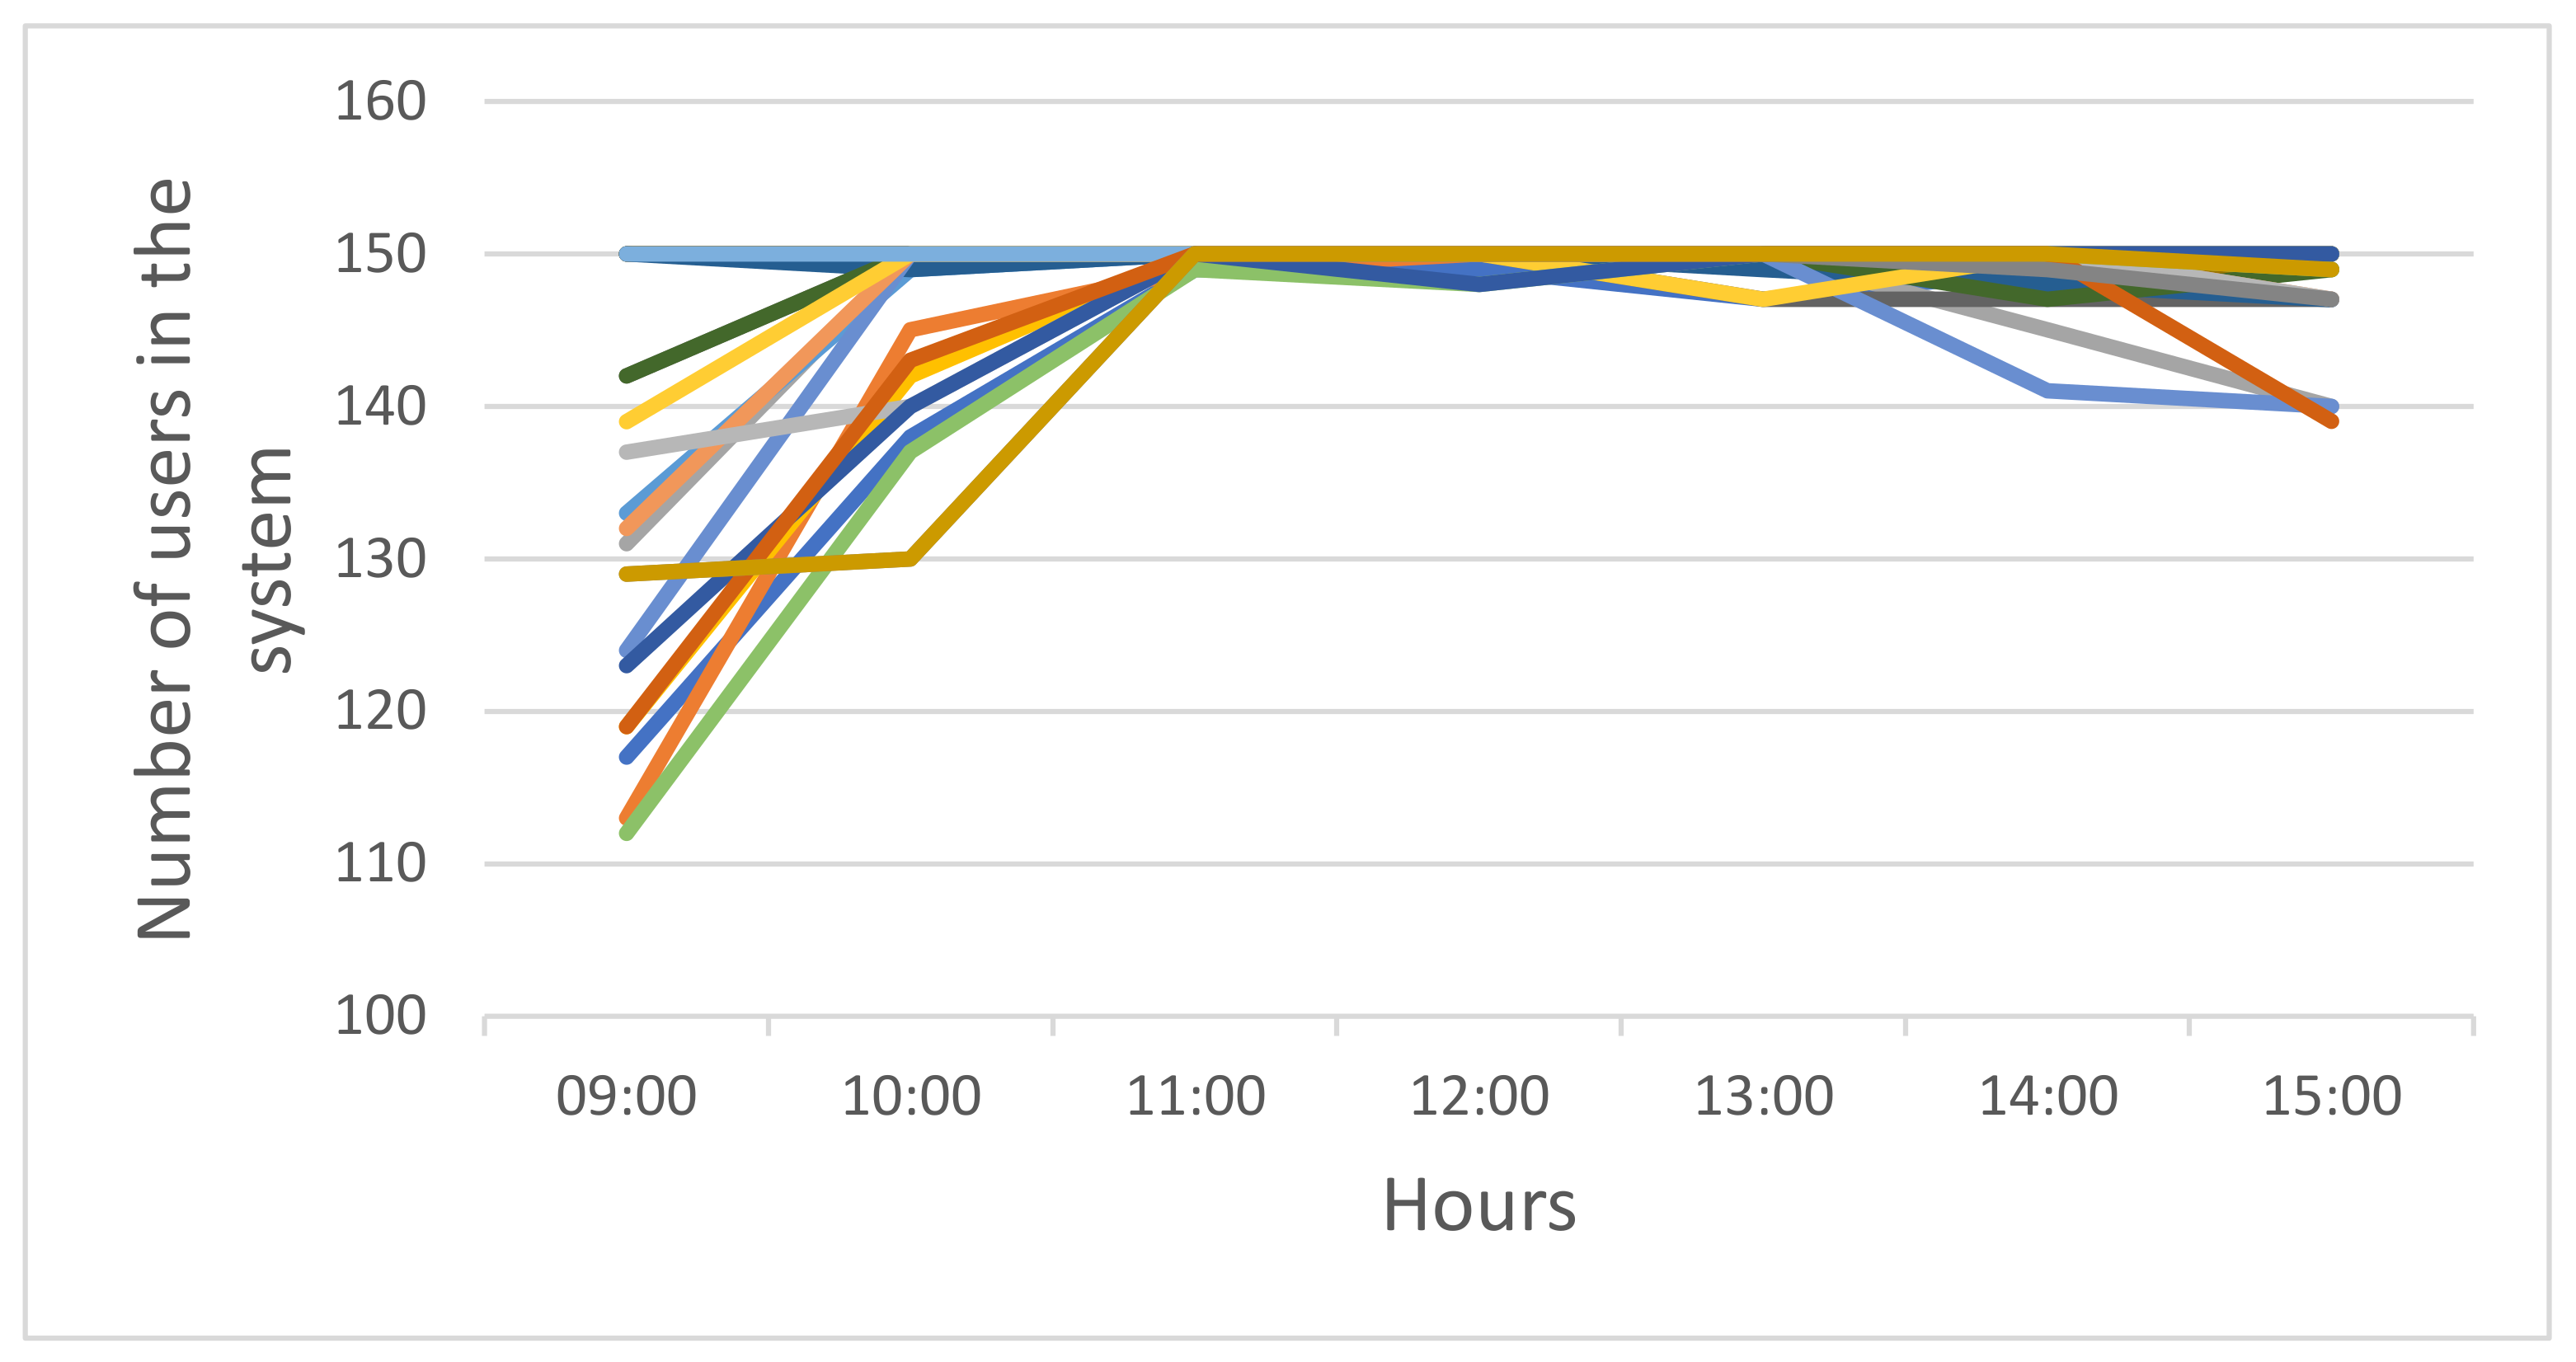
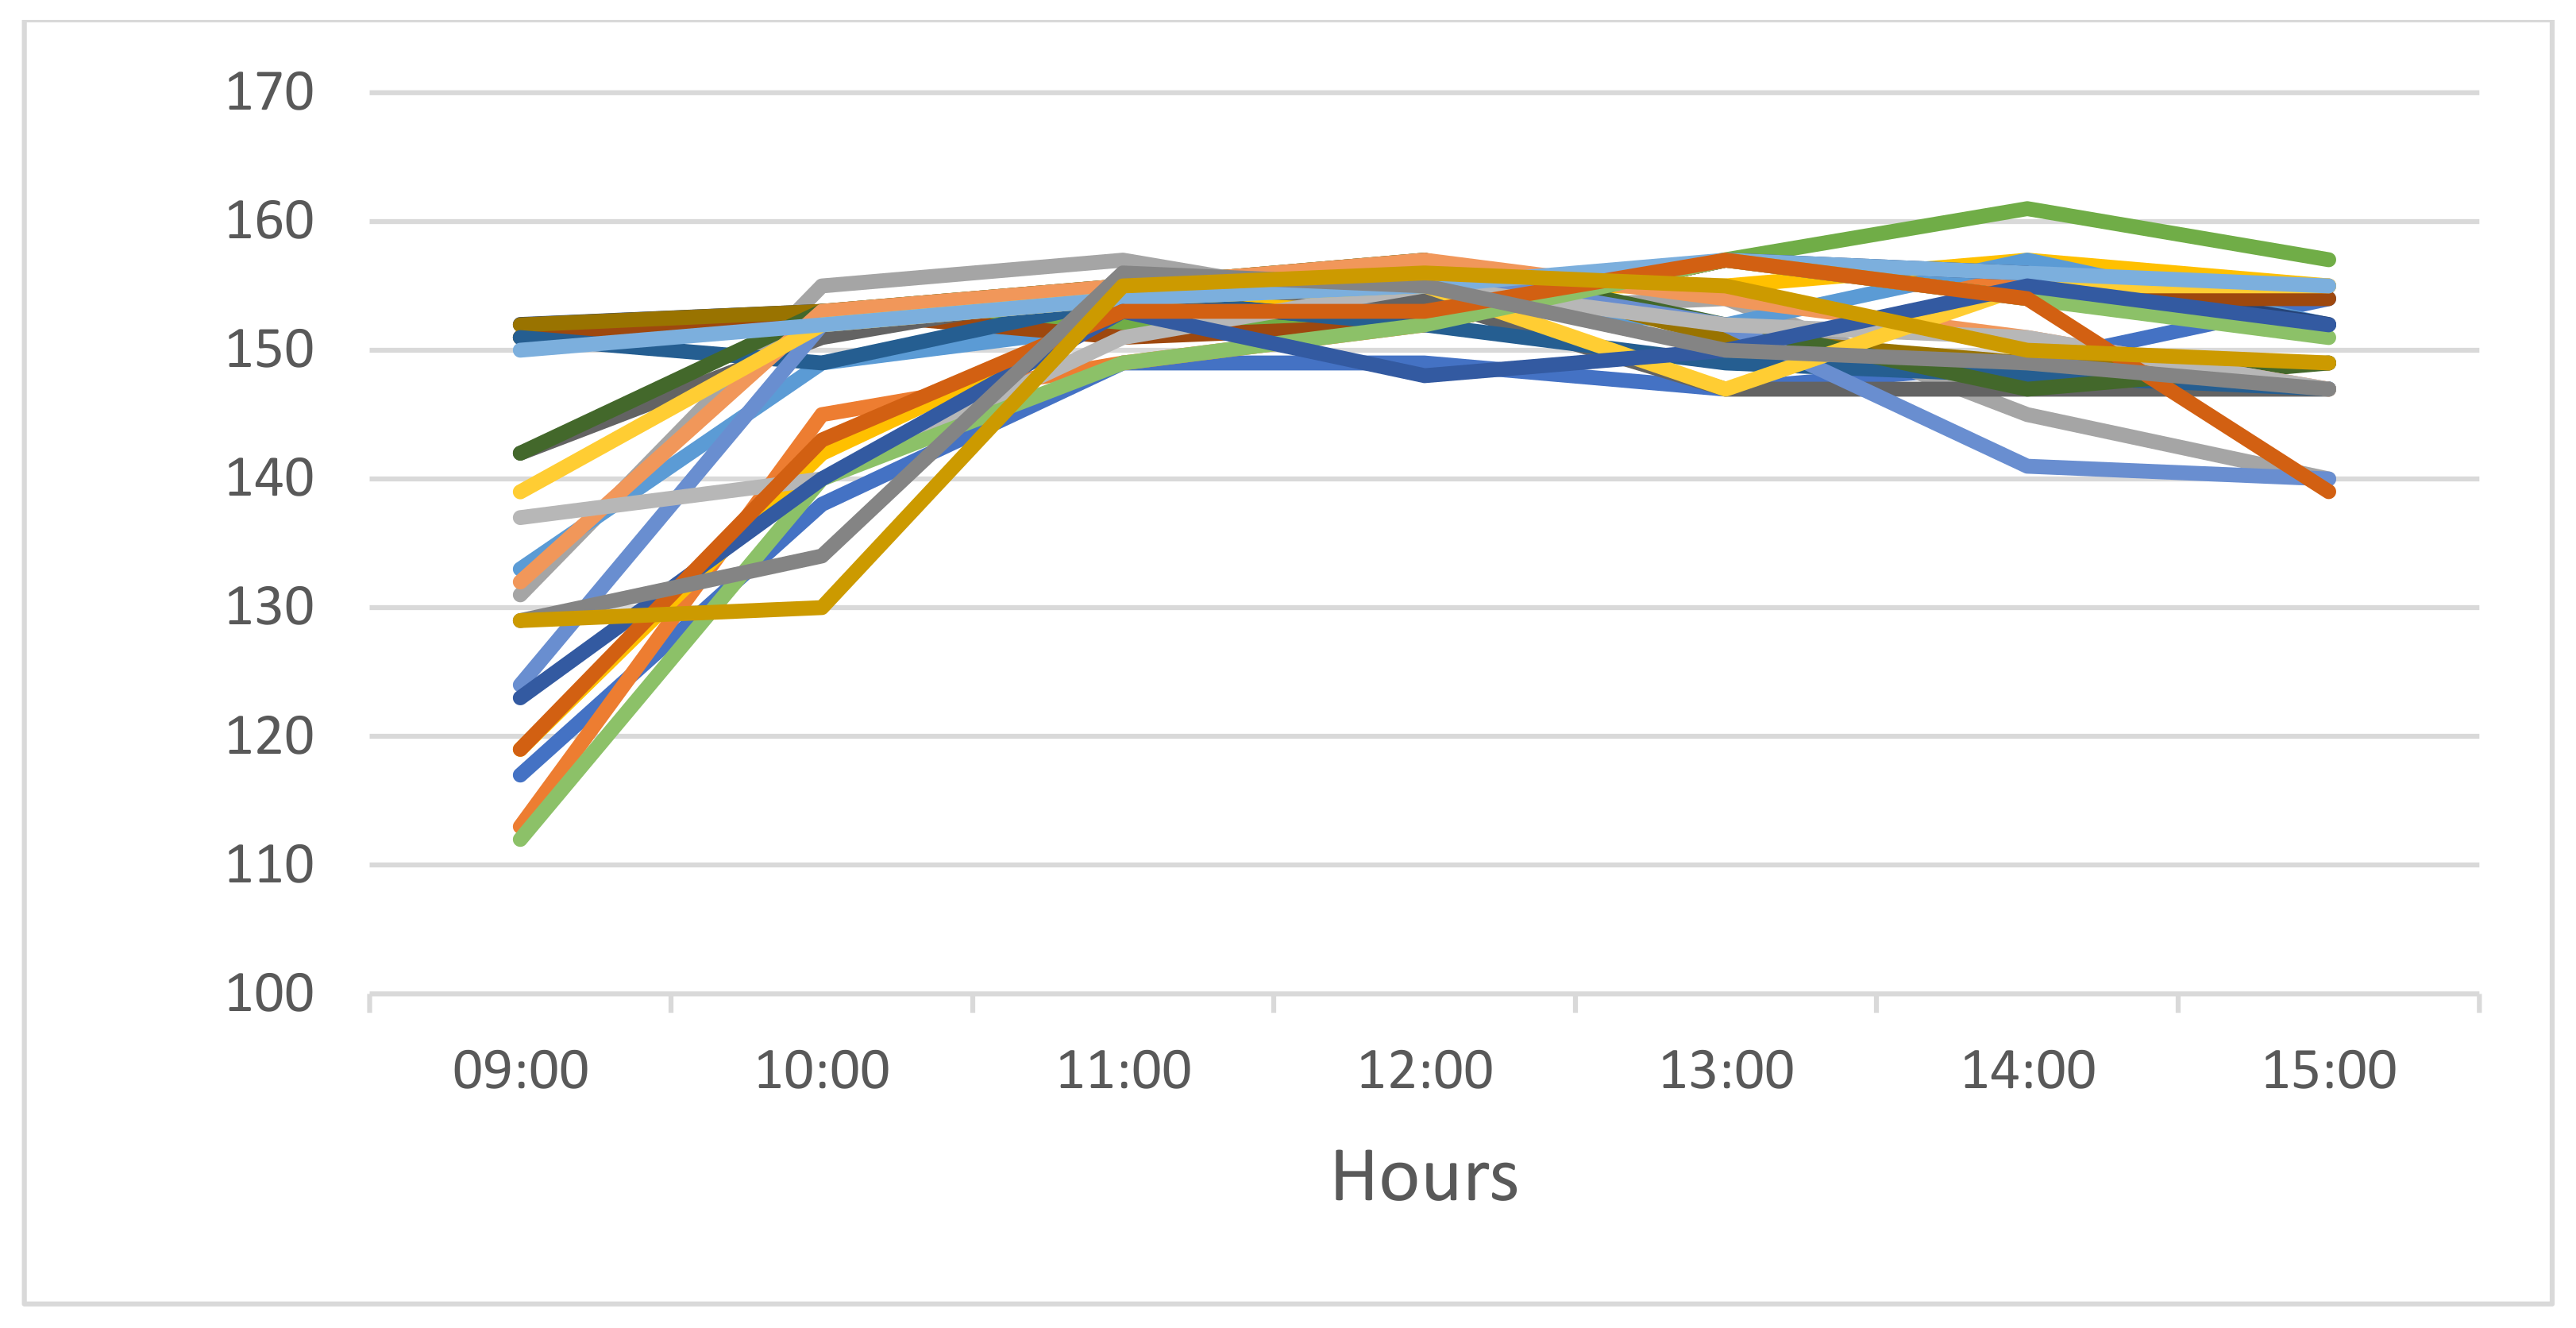
Figure 2 presents the dynamics in number of floating license users in November 2020 during the most active business hours (9:00 to 15:00); each color in the figure represents a different day in November. As shown, CO’s MATLAB software is used intensively and some users are occasionally blocked during the week.
The company monitors its license use and reviews the usage every two months. When the company detects low use of an NNU license, the license is transferred to a different heavy user in the organization. This approach maintains adequate NNU licenses for heavy users and floating licenses for light users.
5.2. Denials
The 51st employee who requests access to a license receives a refusal (an error message indicating that no licenses are available).
Figure 3 presents the number of unsuccessful requests by hour in November 2020.
The natural estimator for the steady-state blocking probability,
B(
t), is based on admission observations over a time interval [0,
t], which, in our case, is the month of November 2020:
where
L(
t) is the number of lost (blocked) arrivals in [0,
t] and
A(
t) is the total number of arrivals (admitted and blocked) in [0,
t].
Figure 4 shows the cumulative evolution of the blocking probability estimate over time; the estimate becomes relatively steady after three weeks and converges to
b = 0.011.
5.3. Rate of Requests for Licenses and Duration of Their Use
Figure 5 and
Figure 6 present CO’s user requests in November 2020 for floating and NNU licenses, respectively, by hour.
5.4. Model Calibration
The main parameters of the calibration system are summarized in
Table 2. Based on
Figure 6, the average rate of NNU license requests by
= 580 heavy users (of
= 700 heavy users) is
per hour, that is,
and, therefore, the overall average rate of use of NNU licenses by heavy users is
. The average number of requests for a floating license (
Figure 5) by all light users (946) and 120 heavy users (
−
= 700 − 580 = 120) during peak hours is
. Consequently, using Equation (9), we can calculate the average rate of requests by all light users:
.
The duration of license use by peak hour in November 2020 is depicted in
Figure 7. Using these data, we calculate the average user’s working time accessing the software as
= 0.847 h (
= 1.18).
Consequently, formulating (9)–(12), based on the data in
Table 2, gives:
subject to
where, in accordance with (8),
.
5.5. Baseline Case
Table 3 describes the top (lowest cost) nine portfolio selections in terms of the number of each type of license and total portfolio cost for the baseline case, which includes the CO’s portfolio choice.
Figure 8 and
Figure 9 employ the efficient frontier of portfolios (e.g., [
23]). Specifically, they illustrate the effects of the two frontier constraints—risk of rejection and risk of underutilization—on the cost of the total portfolio presented with
Figure 10. In this case, we set minimum server utilization at
, and the resulting top nine portfolios have rates of utilization of 86.9% to 87.3%.
As shown in
Figure 10, the lowest-cost portfolio is P9 (
= 587,
= 145), which is about 36,500 dollars less than the CO’s current portfolio (P6,
= 580,
= 150). This result arises because of a smaller number of the floating licenses ensuring similar rejection probability and utilization, so it meets both the constraints (see
Figure 8 and
Figure 9). When the company’s target utilization is more restrictive—87.2% instead of 86.9%—under the same rejection probability frontier, the lowest cost portfolio is P2 (
= 576,
= 153), which is more expensive than the CO’s current portfolio. In other words, restricting underutilization while using the same maximum blocking probability implies losses.
Next, we assume that it is difficult to assess exact levels of license requests (requests per hour), so we conduct a sensitivity analysis with respect to an average rate of requests for use of floating licenses by all light users and − heavy users. Specifically, we test a +5% change in the value of in Case 1 and a −5% change in Case 2. Under the 5% increase in Case 1 (), we obtain from Equation (9) when the values of all other parameters remain fixed. Under the 5% decrease in Case 2 (), we obtain .
5.6. Case 1: 5% Increase in
Table 4 (Case 1) presents the top nine portfolios under the 5% increase in rate of requests per hour. Under a utilization frontier of 86.9% to 87.3%, the company’s current portfolio (
= 580,
= 150) drops out of the top nine. In this case, the best portfolio is P
+9 (
= 591,
= 149), which costs 11,144 dollars more than the current portfolio. Under the more restrictive frontier of 87.2% instead of 86.9%, the best portfolio is P
+3 (
= 584,
= 154), which meets the constraints and is 47,696 dollars more than the CO’s current portfolio.
5.7. Case 2: 5% Decrease in
Table 4 (Case 2) depicts the top nine portfolios under the 5% decrease in rate of requests per hour. Under the same utilization frontier of 86.9% to 87.3%, the least costly portfolio is P
−9 (
= 574,
= 147), which costs about 41,544 dollars less than the company’s current portfolio. Under the more restrictive utilization constraint of 87.2%, the best portfolio is P
−5 (
= 574,
= 147), which costs about 5000 dollars less than the company’s current portfolio.
6. Discussion
Overall, we find that the proposed process for selecting optimal software license portfolios is quite robust in terms of the cost criteria; that is, the percentage of inaccuracy in estimating the average rate of software requests tested in Cases 1 and 2 (+/−5%) is greater than the percentage of corresponding losses due to this inaccuracy. Assuming the baseline case uses an accurate estimate of the requests’ arrival rate, a 5% underestimation (Case 2) of the average rate of requests for licenses () leads to a 0.19% deviation in the cost of the best available portfolio (versus the baseline) under an 86.9% utilization constraint and a 1.0% reduction in the cost under the more restricted utilization constraint of 87.2% instead of 86.9%. A 5% overestimation (Case 1) of the average rate of requests for licenses results in a 0.96% increase in the cost of the best available portfolio (relative to the baseline), and the relaxed utilization constraint results in a 1.85% increase in the cost. In terms of our constraints, however, the result of an inaccurate estimate is less encouraging. In particular, overestimation of the requests’ arrival rate leads to a much improved blocking probability of the best portfolio due to a >4% decrease in utilization, thereby violating the utilization constraint for both 87.2% and 86.9% bounds. Underestimation, on the other hand, leads to about the same 4% increase in utilization, while also increasing the blocking probability by about 60%. Consequently, underestimation of the average rate of requests for licenses is far more troublesome than overestimation.
7. Conclusions
In this paper, we focus on a firm’s strategic acquisition of different types of software licenses to meet peak user demand. Unlike the previously mentioned studies, which compared specific portfolio alternatives, we present a general integer program that optimizes licensing portfolios subject to access-rejection and underutilization constraints when heterogeneous users can be classified into multiple homogeneous groups. The program integrates multiple types of licenses and sublicenses into a portfolio using the number of licenses of each type as a decision variable. The goal of the integer program, which we calibrate using actual user data, is to minimize the cost of the license portfolio subject to constraints on the probability of user requests being rejected (blocked) and likelihood of underutilization of the licenses. Using a case study, we illustrate and evaluate the ability of the integer program to solve the commonly encountered problem of determining how many floating and NNU software licenses a firm should buy, given the nature and number of its users, via an efficient enumeration algorithm based on monotonic properties of the objective function and the recursive nature of the blocking-probability constraint.
Overall, we find that the proposed integer program for selecting optimal mixed-license portfolios is quite robust. Specifically, the percentage of inaccuracy in estimating the average rate of software requests tested in Cases 1 and 2 (+/−5%) is both greater than the percentage of corresponding losses due to the inaccuracy and greater than the error in determining the software utilization. In terms of blocking probability, however, correct estimation of the average rate of requests for licenses can play a critical role in the decision-making process. In particular, underestimation of the average rate of requests for licenses can be especially problematic.
The excess cost of underutilization points to the existence of optimal mixes of various types of license and the economic importance of strategically selecting those mixes. Thus, we find that the observation by Gull and Wehrmann [
18] that mixed licensing of single-user and network licenses is not economically efficient no longer holds in most cases and that both underutilization and the probability of blocked requests are important factors in addition to the probability of blocked requests.
In this work we present a particular case study characterized by two types of license, floating and NNU licenses. We view this as a first step in studying more general cases of multiple types of software and licenses with the aim to assess the economic efficiency of mixed licensing, which we regard as an important direction for future research.


